conduction velocities and their temperature coefficient...
TRANSCRIPT

J. Exp. Biol. (1967), 46, 63-84 6 3
With 12 text-figures
Printed in Great Britain
CONDUCTION VELOCITIESAND THEIR TEMPERATURE COEFFICIENTS IN SENSORY
NERVE FIBRES OF COCKROACH LEGS*
BY K. M. CHAPMANf AND J. H. PANKHURST
Department of Physiology, University of Alberta, Edmonton,Alberta, Canada
(Received 6 August 1966)
The cockroach-leg preparation of Pumphrey (1936) and Pringle & Wilson (1952)lends itself easily to measurements of conduction velocity in afferent nerve fibres frommany of the larger mechanoreceptive sensilla of the leg. Conduction velocity is aquantity that can be measured quite precisely, and it has an important bearing onseveral open problems involving sensory mechanisms in insects, as well as in cellularneurophysiology more generally. One group of problems relates to the sensory transferfunctions for tactile spine mechanoreceptors of Periplaneta, determined by Pringle &Wilson (1952) and Chapman & Smith (1963). Sensory transfer functions are quantita-tive expressions of the stimulus-response relationship, which describe some aspectsof the temporal sensory code used in information transmission, and which provideuseful insight in identifying component transducer mechanisms in the sensory ending.Conduction velocity is important in this context because it contributes quantitativelyto the sensory code, and because it generates a quantifiable experimental artifact inthe analysis of transducer mechanisms. In the present work these effects are evaluatedand are shown to be small but not negligible.
Secondly, conduction velocity provides a physiological estimate of nerve fibrediameter. Knowledge of the diameters of fibres innervating the mechanoreceptors ofcockroach legs should be an important guide to future microelectrode work, and is•essential in estimating current densities and related electrical properties of the sensorycell membranes. The morphological literature is somewhat confusing regarding fibrediameters. Pringle (1938) found fibres of the order of 6-15/i arising from the campaoi-form sensilla of the trochanter of Periplaneta. On the other hand Guthrie (1962),tracing fibres in serial sections of regenerating fifth podial nerve in Periplaneta, foundthat virtually all fibres in the 5-20/j range innervated muscle fibres, and that the re-maining small nerve fibres, ranging to less that i/i, accounted for nearly all the sensoryinnervation of the leg. From this he concluded that no sensory fibre diameters exceedabout 5 /i. The detailed work of Dresden & Nijenhuis {1958) on the sensory inner-vation of the legs of Periplaneta did not give fibre diameter measurements, althoughNijenhuis & Dresden (1952) had described the innervation of structures later shownto be campaniform sensilla in the bases of the tactile spines (Chapman, 1965). In the
• Supported by grant MA 760 of the Medical Research Counts! of Canada.f Present address: Division of Biological and Medical Sciences, Brown University, Providence,
R.I., U.S.A.
64 K. M. CHAPMAN AND J. H. PANKHURST
latter report, the afferent nerve fibres were not visible in our bistological preparationsof these sensilla.
Moreover, the literature on conduction velocities of insect nerve is notably sparse(cf. reviews of Rockstein, 1965; Bullock & Horridge, 1965; Treherne & Beament,1965). In much of the work on this subject estimation of conduction velocity has beenof secondary interest, and many of the estimates include latencies other than con-duction time. Further, in many studies temperature has not been specified, so that it isdifficult to make meaningful comparisons between one published report and another.A number of relevant reports have been collated here relating fibre diameter and con-duction velocity in a number of species (Fig. 11), to form a basis for an estimate ofdiameter for Periplaneta. Our average conduction velocity, 3-3 m./sec. at 200 C ,indicates diameters of about 10 ji.
MATERIALS AND METHODS
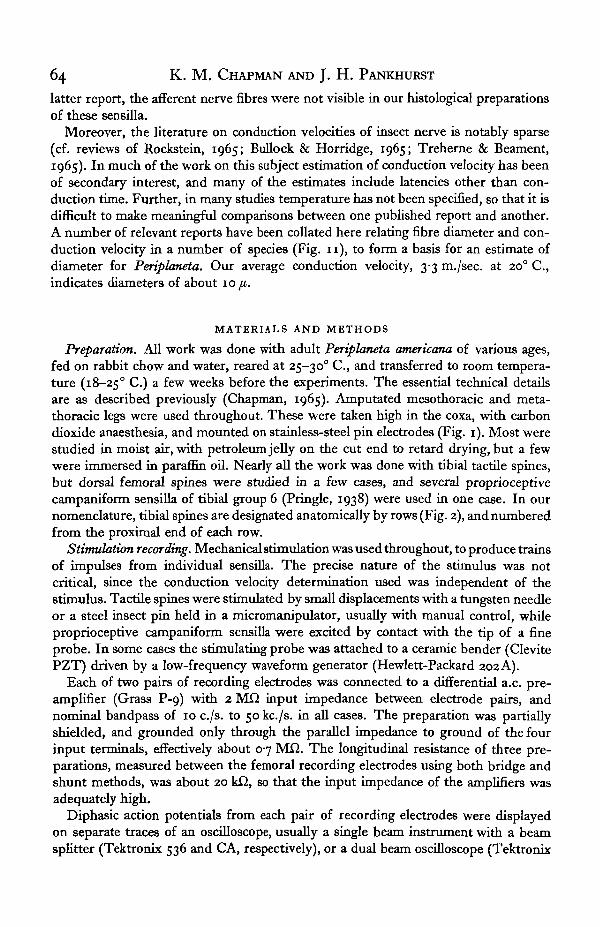
Preparation. All work was done with adult Periplaneta americana of various ages,fed on rabbit chow and water, reared at 25-300 C , and transferred to room tempera-ture (18-25° C.) a few weeks before the experiments. The essential technical detailsare as described previously (Chapman, 1965). Amputated mesothoracic and meta-thoracic legs were used throughout. These were taken high in the coxa, with carbondioxide anaesthesia, and mounted on stainless-steel pin electrodes (Fig. 1). Most werestudied in moist air, with petroleum jelly on the cut end to retard drying, but a fewwere immersed in paraffin oil. Nearly all the work was done with tibial tactile spines,but dorsal femoral spines were studied in a few cases, and several proprioceptivecampaniform sensilla of tibial group 6 (Pringle, 1938) were used in one case. In ournomenclature, tibial spines are designated anatomically by rows (Fig. 2), and numberedfrom the proximal end of each row.
Stimulation recording. Mechanical stimulation was used throughout, to produce trainsof impulses from individual sensilla. The precise nature of the stimulus was notcritical, since the conduction velocity determination used was independent of thestimulus. Tactile spines were stimulated by small displacements with a tungsten needleor a steel insect pin held in a micromanipulator, usually with manual control, whileproprioceptive campaniform sensilla were excited by contact with the tip of a fineprobe. In some cases the stimulating probe was attached to a ceramic bender (ClevitePZT) driven by a low-frequency waveform generator (Hewlett-Packard 202 A).
Each of two pairs of recording electrodes was connected to a differential a.c. pre-amplifier (Grass P-9) with 2 MO input impedance between electrode pairs, andnominal bandpass of 10 c./s. to 50 kc./s. in all cases. The preparation was partiallyshielded, and grounded only through the parallel impedance to ground of the fourinput terminals, effectively about 0-7 Mfl. The longitudinal resistance of three pre-parations, measured between the femoral recording electrodes using both bridge andshunt methods, was about 20 k£2, so that the input impedance of the amplifiers wasadequately high.
Diphasic action potentials from each pair of recording electrodes were displayedon separate traces of an oscilloscope, usually a single beam instrument with a beamsplitter (Tektronix 536 and CA, respectively), or a dual beam oscilloscope (Tektronix
Conduction velocities of cockroach nerve fibres
Fig. i. Right mesothoracic leg mounted on three pairs of electrodes, posterior view, ex,coxa; tr, trochanter;/, femur; tb, tibia. Scale, cm and mm. Tibial-to-femoral conduction dis-tance was taken as 875 mm. (Expt. 15).
Exp. B10L 46, 1

66 K. M. CHAPMAN AND J. H. PANKHURST
502). In both cases the sweep speeds were calibrated with a Tektronix 181 time-markgenerator, the frequency dividers of which were verified for accuracy before andduring the series of experiments. In addition, the alignment of both sweeps relative tothe cathode-ray tube reticle was verified from time to time.
X
i
t
D
AV V
PD
PV
1 mm.
Fig. 2. Nomenclature used in designating spine rows; sections of left metathoracic tibia,pinned on to wax, viewed from distal end. Right, five rows of non-terminal spines; left, seventerminal spines. AD, Antexodorsal; D, dorsal; PD, posterodorsal; PV, posteroventral; V,ventral; AV, anteroventral; A, anterior. A and V occur in terminal group only.
200/tV.
1 msec.
Fig. 3. Oscilloscope record indicating conduction time from distal electrodes (lower trace)to proximal electrodes (upper trace). Calibration at left; conduction distance, 15-3 mm.; velocity,3-28 m./sec.; 13-3° C. (Expt. 5).

Conduction velocities of cockroach nerve fibres 67
The two oscilloscope sweeps were triggered simultaneously as each afferent impulseapproached the distal pair of recording electrodes, the initial deflexion of its diphasicaction potential providing the triggering signal (Fig. 3). Thus the action potentialfrom the distal recording site appears at the extreme left of one of the two traces,usually the lower. When the same impulse reached the proximal recording site, asecond action potential was produced on the other trace, later than the first by theconduction time between the two sites. Conduction time was taken as the time-intervalbetween the base-line crossover point of the distal diphasic action potential and that ofthe proximal. Usually a dozen or more impulses from one or more evoked trains weresuperimposed in each oscilloscope record, and several such records were averaged foreach determination of conduction velocity. The method used to determine conductionvelocity from the oscilloscope records is illustrated in Fig. 4, and described in detailin a later section.
e)
Fig. 4. Procedure for reading conduction velocity from film records with a calibrated io-turnpotentiometer, using a hyperbolic cursor carried by the movement of an X— Y recorder. Eachdiagram shows the transparent cursor overlying an oscilloscope record, drawn schematicallyhere for simplicity; in a and b the impulse traces have been omitted (cf. Fig. 3). (a) Zerosetting: with the reading potentiometer set at zero, the abscissa (time axis) of the cursor isplaced over the base-line of the proximal (upper) impulse trace. (6) Calibration: the potentio-meter dial is set to the numerical value of conduction distance, d, in mm. and the Y-axis sensi-tivity of the recorder adjusted such that the cursor then delimits a i-oms. interval on theproximal baseline, (c) Reading: with the cursor ordinate (velocity axis) intersecting the base-line crossing of the distal impulse trace, the reading potentiometer is used to translate thecursor vertically so that the hyperbola intersects the baseline crossing of the proximal trace;the potentiometer then indicates conduction velocity u in m./sec.
Electrode spacing and conduction distance. Pairs of stainless-steel insect pins servingas recording electrodes were arranged in a square array with 2 mm. spacing in a flatPerspex clamp, and the leg was mounted on them. Usually three pairs were employed,the most distal pair penetrating the upper part of the tibia, the next pair going throughthe femur, and the third through the coxa (Fig. 1). Most commonly the tibial andfemoral pairs were chosen for recording, but occasionally the pair immediately acrossthe femoro-tibial joint and that across the trochanter were used instead. When tibialand femoral pairs were used, the femoral pair was spaced about twice as far apart asthe tibial, about 4 mm. and 2 mm. respectively, producing nearly equal action potentialamplitudes from the two sites.
5-2
68 K. M. CHAPMAN AND J. H. PANKHURST
Conduction distance between the two recording sites was estimated as the distancefrom the midpoint of the distal electrode pair to that of the proximal pair. Electrodepositions were measured in situ at the end of each experiment, with an ocular micro-meter at first, but in all of the later experiments from a calibrated photograph of thepreparation as in Fig. i. No attempt was made to determine the precise course of theafferent nerve in the leg, and conduction distance has been taken arbitrarily as anaverage of plausible path lengths within the confines of the cuticle.
20 5
<J
10 =
500 1000 1500
Time (sec.)
2000 2500
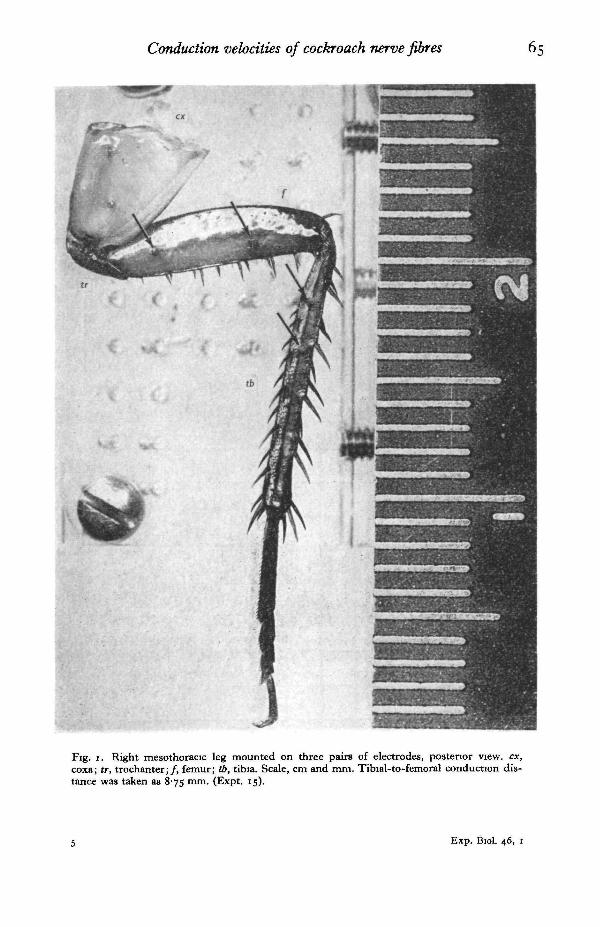
Fig. 5. Thermal equilibration curves for indicated chamber temperature T (O) and forconduction velocity u ( • ) ; curves are calculated exponential regression lines. Arrows indicatetunes at which the temperature of the circulating water was changed. The indicated tem-perature during warming was obviously not a simple exponential process and has been arbi-trarily fitted piecewise with two exponentials (Expt. 16).
Temperature variation. When temperature coefficients were to be determined, pre-parations were enclosed within an air-filled metal chamber with hollow walls andbottom, around which water at various temperatures could be circulated. A plastic lidwith holes to accommodate the necessary apparatus partially covered the top, toreduce air exchange with the surroundings.
Air temperature in the chamber was measured with a small thermistor bead placedclose to the leg, operated in a bridge circuit and calibrated to within o-i° C. with amercury thermometer. Chamber temperature was not regulated, but was varied atconvenient rates by altering the temperature and flow rate of the circulating water.Using ice water and warm tap-water, temperatures from 5 to 420 C. were attained.
Working in air was convenient for electrical insulation and for ventilating the tissue,but tended to retard thermal equilibration. To assess the latter effect, thermal tran-sient responses of the chamber and of the preparation were studied in detail in oneexperiment (Figs. 5, 6). Following a sudden, substantial change in temperature of the
Conduction velocities of cockroach nerve fibres 69
circulating water, it took several minutes for conduction velocity to stabilize. As onewould expect, the thermistor bead equilibrated more quickly than the considerablylarger leg. The time-courses of the thermal responses are shown in Fig. 5. For con-venience these may be approximated as simple exponential functions of time, and inthese terms the time-constant for equilibration of conduction velocity was roughlytwice that for the temperature probe. (A single exponential is clearly not adequate toapproximate the warming phase in Fig. 5, and separate exponentials have been fitted
5 r
10 20 30T (°
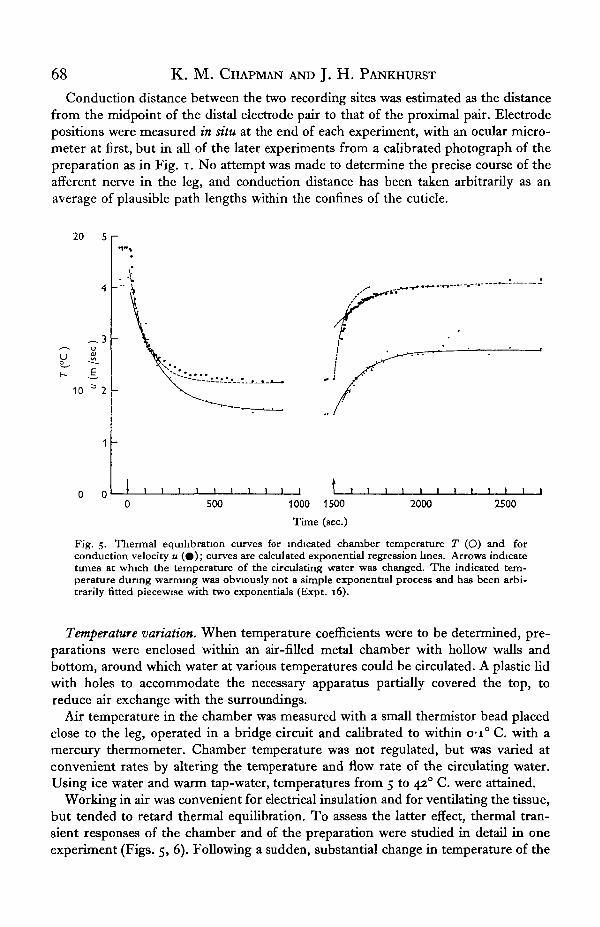
Fig. 6. Conduction velocity u as a function of indicated chamber temperature, T, data ofFig. s, demonstrating hysteresis due to thermal lag. O, Decreasing temperature; • , in-creasing temperature; —, Arrhenius equation calculated using all points; , calculatedusing points at thermal equilibrium only.
arbitrarily to the early and late phases of equilibration.) In this situation the relation-ship between conduction velocity and chamber temperature contains appreciablehysteresis, reflecting the thermal lag between the preparation and the surroundingair (Fig. 6). This is a potential source of error in estimating temperature coefficientsof conduction velocity, and to reduce this effect when actually determining tempera-

70 K. M. CHAPMAN AND J. H. PANKHURST
ture coefficients, chamber temperature changes were executed slowly, usually in com-plete cycles (Fig. 7). Calculation of temperature coefficients is discussed in detailbelow.
10
10 20 30 -40
T (°
Fig. 7. As Fig. 6, but for a case in which temperature changes were executed slowly to mini-mize thermal hysteresis (Expt. 13). O, Initial temperature descent; 9, rising temperature;©, final descent; —, Arrhenhis equation calculated using all points; , one standard devia-tion from the calculated curve.
PRINCIPLES AND COMPUTATION
Symbols. The following list defines most of the quantitative symbols used through-out the text (anatomical symbols are explained in Table 1 and Fig. 2):
B Arrhenius temperature coefficientD Fibre diameterd Conduction distanceL Total wavelength of action potential

Conduction velocities of cockroach nerve fibres 71
La Wavelength of inward radial action current<5 1 0 Relative increase in conduction velocity per io° C.5 Spacing between two electrodes of a pair ; complex frequencyT Tempera tu r e (absolute unless otherwise specified)t Conduct ion t imeu Conduct ion velocityUJO Conduct ion velocity at 200 C.ux Limiting conduction velocity in Arrhenius equationT Total duration of action potentialTa Duration of inward radial action current<j> Phase shift by which response leads stimulus
Conduction velocity. In principle, conduction velocity u was determined frommeasured conduction distance d, conduction time t and the denning equation:
u = d\t. (1)
To facilitate data analysis, however, a graphical analogue technique was used to readconduction velocity directly from the oscilloscope records (Fig. 4).
The essential device for the method was a miniature nomogram of equation (1),consisting of a rectangular hyperbola and its co-ordinate axes, reduced onto trans-parent photographic film from a large, accurate ink drawing (Chapman, 1957). Thenomogram was mounted on the pen arm of an X-Y recorder, where it served as areading cursor which could be conveniently positioned over a strip of oscilloscoperecords, using the positioning controls of the X-Y recorder. The conduction-velocityscale, along the ordinate axis of the nomogram, was given by the dial of a 10-turnpotentiometer. The latter was operated as a voltage divider from either a battery or avariable-voltage power supply, and fed into the Y-axis of the recorder, to providemeasured vertical movement of the nomogram. The ordinate scale could thus bevaried for calibration by varying either the Y-axis sensitivity of the recorder or thepower supply voltage. The abscissal (time) scale was taken directly from that of theoscilloscope records, so that after calibration, when a conduction time was laid off onthe abscissa, the corresponding ordinate reading gave the conduction velocity. Foreach leg preparation, the ordinate was calibrated using the measured conductiondistance d, a convenient value of t and equation (1). Thus the ordinate reading fort = i-o msec, was set at u = d/rasec. (Fig. 46). The procedures for calibration andfor reading velocity are illustrated in detail in Fig. 4.
The precision of the method, estimated from the standard deviations of replicatevelocity readings (Table i), was about 3-4 %. Individual potentiometer readings couldbe made to three decimal digits, and therefore did not limit the precision. Individualvariability between fibres and variations due to temperature were considerably greaterthan the limits of reading precision, so that the technique was adequate to study thesegrosser effects.
Temperature coefficients. The temperature dependence of conduction velocity inthese experiments was adequately described by the Arrhenius rate equation (Fig. 7).In terms of the Arrhenius coefficients KO and B, this is:
« = ucoexp(-JB/7T). (2)
72 K. M. CHAPMAN AND J. H. PANKHURST
An alternate form in terms of u^ and Q10 for the temperature interval 20-30° C. is:
u = UnQf^-^W- (3)
The Arrhenius coefficients and their variances were determined from the linearregression coefficients of (Inu) on (i/T) by the method of least squares with equalweighting in the transformed data values (lnw) and (i/T1) (Guest, 1961, ch. 6).
MJJO and Qw and their standard deviations SDu^ and SDQ10 were in turn calculatedfrom the Arrhenius coefficients as:
«80 = ii<oexp(-5/293-2° K), (4)
var (lnttg,) = var (lnUco) +[(1/293-2° K)2-(2/293-2° K) (i/r)]var (B), (5)
in which var denotes the variance and (i/T) the mean reciprocal temperature.SDu^ was approximated as:
SZ)«a0=tt20[var(lntt80)]i. (6)From equation (3):
Q10 = " x K = exp(i-i25 x 10-* °K-15), (7)
and approximating as in equation (6):
SDQ10 = &O(I- IZ5 x io-*oK-i) [var(5)]i. (8)
Temperature coefficients and related data were computed with an I.B.M. 7040 digitalcomputer.
RESULTS
Conduction velocities were measured in afferent fibres from 67 tactile spines and 3proprioceptive campaniform sensilla of group 6, in 16 leg preparations from 12 indi-viduals. Of these, temperature coefficients were determined for 22 tactile spineafferents in 10 preparations from 7 individuals.
Over the 5-42° C. temperature range studied, conduction velocities from i-o to17-4 m./sec. were encountered, ranging 2-2 to 9-0 m./sec. in one preparation (Expt. 13).Five of the receptors failed reversibly at the lower end of the temperature range(Table 2, asterisks), and several failed irreversibly above 35-40° C. With cold failureit was not possible to distinguish between failure of the sensory generator mechanismand failure of conduction. But with heat failure a gradual fall in conduction velocitywas sometimes observed during onset, suggesting that conduction failure was involved.However, no attempt was made to study these phenomena systematically, nor toestablish limits of the physiological temperature range.
On occasion a slight facilitatory effect of impulse frequency on conduction velocitycould be clearly detected on the oscilloscope. During impulse bursts above about100 sec.-1, conduction velocity was increased possibly by as much as 1-5 % in somecases. This incidental observation likewise was not studied further, and the velocitymeasurements are weighted heavily toward the lower values.
The main results are summarized in Figs. 8 and 9 and Tables 1 and 2. Table 1presents conduction velocities measured at room temperature only. These wereaveraged from single readings of several replicate oscilloscope records. In most cases,ten or more replicates were taken; for fewer than ten replicates, standard deviationswere not calculated. 'Background discharge', usually spontaneous activity in one or
Conduction velocities of cockroach nerve fibres 73
more fibres other than that from the sensillum under study, occasionally made thecrossover points on the oscilloscope records difficult to read. In these cases, the sensil-lum discharge was identified by waveform, or the records were discarded entirely.This effect was, however, the main source of the occasional larger standard deviationsobtained in reading replicate records from a single sensillum.
20 r
10
0 S 10"to (m./sec )
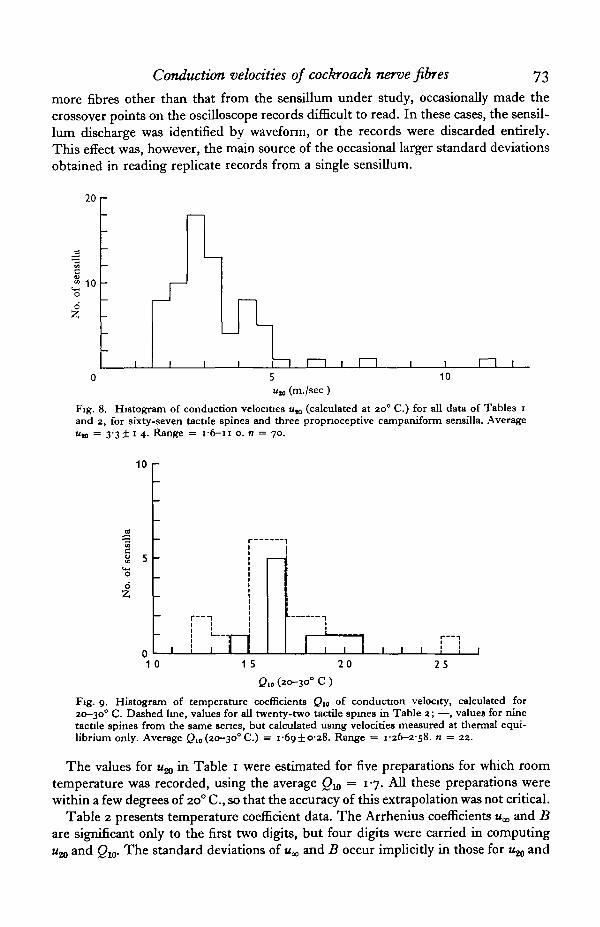
Fig. 8. Histogram of conduction velocities uK (calculated at 20° C.) for all data of Tables iand 2, for sixty-seven tactile spines and three propnoceptive campaniform sensilla. AverageUJD = 33 ± 1 4 . Range = i-6— 11 o. n = 70.
10 r
J I
1 0 15 20
Qw (20-300 C )
25
Fig. 9. Histogram of temperature coefficients Ql0 of conduction velocity, calculated for20-30° C. Dashed line, values for all twenty-two tactile spines in Table 2; —, values for ninetactile spines from the same series, but calculated using velocities measured at thermal equi-librium only. Average Qw (20-30° C.) = 1-6910-28. Range = 1-26-2-58. n = 22.
The values for u^ in Table 1 were estimated for five preparations for which roomtemperature was recorded, using the average Qw = 1-7. All these preparations werewithin a few degrees of 200 C, so that the accuracy of this extrapolation was not critical.
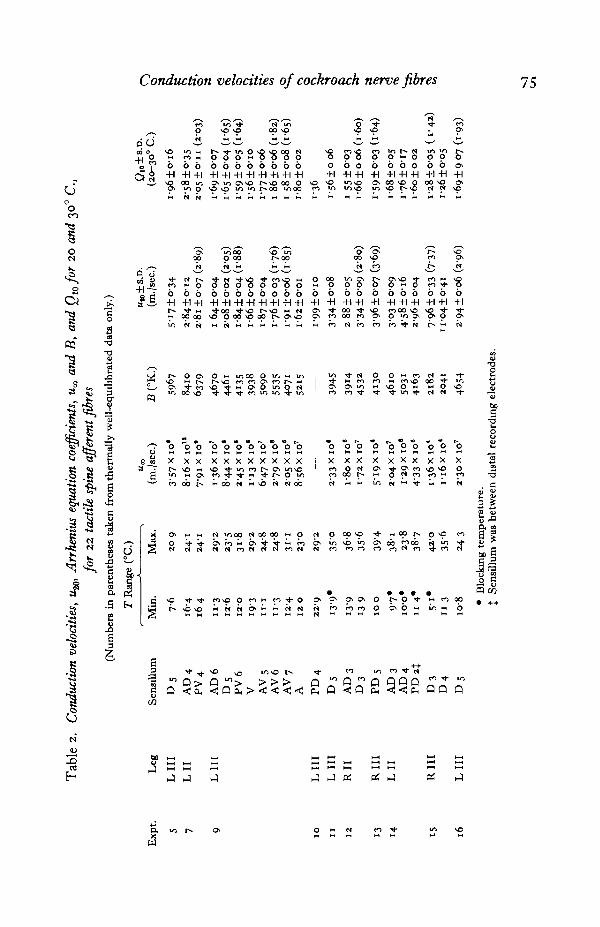
Table 2 presents temperature coefficient data. The Arrhenius coefficients «„ and Bare significant only to the first two digits, but four digits were carried in computingMJJO and Q10. The standard deviations of ux and B occur implicitly in those for u^ and

74 K. M. CHAPMAN AND J. H. PANKHURST
Table i . Conduction velocities of afferent fibres from 50 tactile spines and 3 proprio-
ceptive campaniform sensilla, measured at room temperature (u) and expressed at 200 C.
(«a>) using Qw = 17Conduction velocity
(m./sec.)Temperature , * ,
Expt. Leg* Sensillumf (°C.) U±S.D. «„
1 L I I I
LI I I
RIII
RIII
LIIRIII
P D 5PV3P V 4
PVsPV6DFSJxD ijD i\D 3D 4
P D 3P D 4P D 5P V 3P V 4
P V 5
P V 6VA V 6 'DFSJ ^G p . (>%
Gp.6JGp.6JADiJA D 2A D 3AD 4ADsD 1%D 2
D 3D 4
DsPD 1P D 2P D 4P V iPV6A V iA V 2A V 3AV6 1A D 3A D 4A D 5AD6DsPD 2%P D 3P D 4PDsA D 3
P D 4
Not recorded
22*5 1
2 4 1
2 3 93 3 923-32 3 32 3 62 4 2
25-42 3 92 3 9
22-8
24-3
6-54-253'974'15-2
/7'4i ±0204-i2±o-n472±o-o8S-3i±o-io5-10 ±0-044-144-13 ±0054-g6±o-io5-i9±o-io5-26 ±0 084-64 + 0-114-8i±o-35S 28±o-i5
^S-O4±o-35'S-3i±o-333-26±o-n3-6o±oo93-4O±o-io3-22 ±0-143-i2±o-i43-35±o-i23-42±o-io3-32±o-i4349±o-i22-9810-153-35 ±0-194-00 ±0-173'9S ±0-243'4S ±0-183-38 ±0083-57±o-i42-87 ±0082 89 ± 0-262-82 ±0-042'73±o-io2-62±O-I2
^2-82±O-2O
3.853-953 8 14-155-043-904-03 ±0043843-8s±o-i53-n2-72±O-O2
6-453-584-104-60
4433-603-604-3°4-5°4-S54034184-574'39422
3-592-863-702-562492-672-722-642-782362-67
2-752-702832-272-292242-1920O
2-25
309
3-173-414113-o8300308309
2652-14
• R, Right; L, left; II, mesothoracic; III, metathoracic.f DFS, Dorsal femoral spine; Gp. 6, group 6 campaniform sensillum; tibial spines designated by
rows aa Fig. 2, and numerically from proximal end of each row.J Sensillum was between distal recording electrodes.
Exp
t.
5 7
9
I0
I I I2
I3
I4
15
16
Tab
le 2.
Con
duct
ion
velo
citie
s, h,
Arr
heni
us e
quat
ion
co
~e
nts
, u,
and
B, a
nd Q,, for
20
and
30" C
.,
for
22
tac
tile spine
@er
ent
@re
s
(Num
bera
in p
aren
thes
es t
aken
fro
m th
erm
ally
wel
l-eq
ud
lbra
ted
dat
a on
ly.)
T R
ange
("(
3 - urn
Min
. M
ax.
(m./
sec.
) B
("K
.) Q
lo f S.
D.
(20-
go0
C.)
Blo
cku
-~g te
mp
erat
ure
. f
Sen
sill
um
was
bet
wee
n d
lsta
l re
cord
mg
elec
trod
es.
76 K. M. CHAPMAN AND J. H. PANKHURST
Q10 (equations 5, 6, 8). As indicated in equation (5), the standard deviation of lnwcalculated at other than 20° C. goes through a broad minimum at (i/T), the meanreciprocal temperature of the data points. Since the corresponding mid-range tem-perature was usually near 200 C, u^ lies in the region in which calculated conductionvelocity can be most precisely specified (Fig. 7).
With nine sensilla, possible artifacts due to thermal non-equilibrium were con-sidered. These were cases in which, due to the nature of the method of varying thetemperature, a number of values were taken after relatively long periods when thetemperature had been changing very slowly. Usually this happened in trying to reachthe extreme upper and lower limits of the range. For these cases Arrhenius co-efficients were recalculated using only points for which chamber temperature hadchanged by less than a degree during the previous 2-3 min. at two or more repre-sentative regions of the temperature range. The corresponding 'well equilibrated'values of %, and Qw are tabulated in parentheses below those determined using all ofthe data values. In most 'well equilibrated' cases the coefficients are within onestandard deviation of the original estimates, and it may be concluded that the thermalresponse of the temperature chamber and the data sampling method were adequate.
All of the estimates of u^ are plotted as a histogram in Fig. 8. The distributionappears to be unimodal, and somewhat skew. The mean and standard deviation for theseventy sensory afferent fibres, 3-3+1-4 m./sec., indicate a rather broad naturalvariation, of the order of half the mean, for the population of fibres studied. It ishowever, appreciably less than the 3- to 4-fold changes due to temperature over thephysiological temperature range.
The values of Q10 are likewise given as a histogram in Fig. 9. The dashed linesindicate the distribution found for all twenty-two sensilla using all of the data; thesolid line is plotted only for the ' well equilibrated' data of the nine fibres so indicatedin Table 2. The 'well equilibrated' values are distributed like the total data set,confirming the earlier conclusion that thermal lag was not a serious problem. Themean Q10, 1-7 + 0-3, agrees with the classic value 1-79 of Keith Lucas (1908) forfrog sciatic nerve.
DISCUSSION
Wavelength of the action potential. The length and shape of the action potential hasa bearing on the accuracy of the velocity estimate. The total wavelength L of thelongitudinal action current was estimated from the total duration T of the diphasicaction potential, the inter-electrode spacing s across which it was observed, and theconduction velocity, u, from the relation:
L = TU — S. (9)
To a first approximation the length La of the active region of fibre membrane, in whichthe membrane action current is inward, can be estimated from the relative durationof the time-interval between the negative and positive peaks of the diphasic actionpotential, as: La = LTJT_ ( I O )
For the experiment shown in Fig. 10, average total and active-region wavelengthswere 2-4 mm. and 1-3 mm. respectively, and were essentially invariant with tempera-ture over the entire range. Comparable wavelengths and temperature independence

Conduction velocities of cockroach nerve fibres 77
were found in twenty-four afferent fibres examined. These short wavelengths areconsistent with the short length constants, about 1 mm. for the faster-conductinggiant fibres of the ventral nerve cord of Periplaneta (Yamasaki & Narahashi, 19596).Clearly the 2-4 mm. inter-electrode spacing in these experiments was not negligiblecompared with the wavelength of the action potential. Possible errors thus intro-duced are discussed later. Likewise the diameter of the tissue space in leg segmentsis not negligible compared with the wavelength, so that volume conduction mustbe important in situ.
Accuracy considerations. The precision of the graphical method for reading reci-procal conduction times from oscilloscope records was about 3-4%. The accuracyof the measurement of conduction distance now needs to be considered, since any
3r
\
t
10 20 30T (°
Fig. 10. Length of the propagated disturbance as a function of temperature. O, Estimatedfor total length of the diphasic action potential; # , estimated for the inwardly directed radialcurrent (Expt. 13).
errors introduced by it have been neglected in the tabulated data. Two points areinvolved: (1) the anatomical measurement and (2) the interpretation of the baseline-crossing interval.
The estimated lengths of conduction path between the two pairs of recordingelectrodes were typically 10 mm., ranging roughly from 7 to 15 mm. for all the pre-parations studied. The largest uncertainty arose in measuring around the flexedfemoro-tibial joint, and was typically ±0-5 mm., or of the order of 3-8%. For anygiven leg preparation, the anatomical uncertainty is a systematic error, constant forthose sensilla below the distal electrode pair, and constant over the range of tem-perature. However, it is not systematic with respect to the group of leg preparationsstudied. Moreover, it affects the calculated conduction velocities proportionately, andtherefore does not enter the estimate of Qw.
78 K. M. CHAPMAN AND J. H. PANKHURST
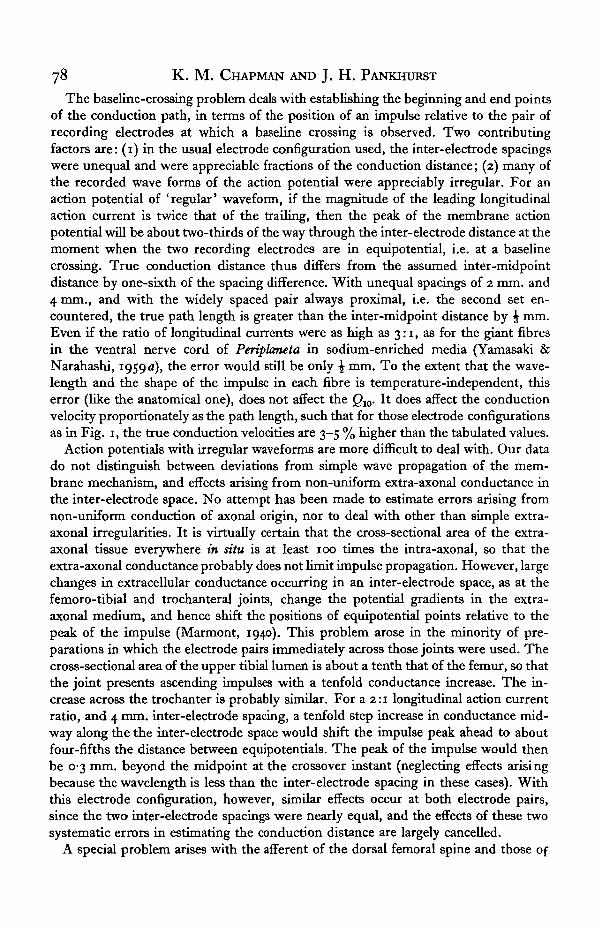
The baseline-crossing problem deals with establishing the beginning and end pointsof the conduction path, in terms of the position of an impulse relative to the pair ofrecording electrodes at which a baseline crossing is observed. Two contributingfactors are: (1) in the usual electrode configuration used, the inter-electrode spacingswere unequal and were appreciable fractions of the conduction distance; (2) many ofthe recorded wave forms of the action potential were appreciably irregular. For anaction potential of 'regular' waveform, if the magnitude of the leading longitudinalaction current is twice that of the trailing, then the peak of the membrane actionpotential will be about two-thirds of the way through the inter-electrode distance at themoment when the two recording electrodes are in equipotential, i.e. at a baselinecrossing. True conduction distance thus differs from the assumed inter-midpointdistance by one-sixth of the spacing difference. With unequal spacings of 2 mm. and4 mm., and with the widely spaced pair always proximal, i.e. the second set en-countered, the true path length is greater than the inter-midpoint distance by ^ mm.Even if the ratio of longitudinal currents were as high as 3:1, as for the giant fibresin the ventral nerve cord of Periplaneta in sodium-enriched media (Yamasaki &Narahashi, 1959 a), the error would still be only \ mm. To the extent that the wave-length and the shape of the impulse in each fibre is temperature-independent, thiserror (like the anatomical one), does not affect the Q10. It does affect the conductionvelocity proportionately as the path length, such that for those electrode configurationsas in Fig. i, the true conduction velocities are 3-5 % higher than the tabulated values.
Action potentials with irregular waveforms are more difficult to deal with. Our datado not distinguish between deviations from simple wave propagation of the mem-brane mechanism, and effects arising from non-uniform extra-axonal conductance inthe inter-electrode space. No attempt has been made to estimate errors arising fromnon-uniform conduction of axonal origin, nor to deal with other than simple extra-axonal irregularities. It is virtually certain that the cross-sectional area of the extra-axonal tissue everywhere in situ is at least 100 times the intra-axonal, so that theextra-axonal conductance probably does not limit impulse propagation. However, largechanges in extracellular conductance occurring in an inter-electrode space, as at thefemoro-tibial and trochanteral joints, change the potential gradients in the extra-axonal medium, and hence shift the positions of equipotential points relative to thepeak of the impulse (Marmont, 1940). This problem arose in the minority of pre-parations in which the electrode pairs immediately across those joints were used. Thecross-sectional area of the upper tibial lumen is about a tenth that of the femur, so thatthe joint presents ascending impulses with a tenfold conductance increase. The in-crease across the trochanter is probably similar. For a 2:1 longitudinal action currentratio, and 4 mm. inter-electrode spacing, a tenfold step increase in conductance mid-way along the the inter-electrode space would shift the impulse peak ahead to aboutfour-fifths the distance between equipotentials. The peak of the impulse would thenbe 0-3 mm. beyond the midpoint at the crossover instant (neglecting effects arisingbecause the wavelength is less than the inter-electrode spacing in these cases). Withthis electrode configuration, however, similar effects occur at both electrode pairs,since the two inter-electrode spacings were nearly equal, and the effects of these twosystematic errors in estimating the conduction distance are largely cancelled.
A special problem arises with the afferent of the dorsal femoral spine and those of

Conduction velocities of cockroach nerve fibres 79
the group 6 campaniform sensilla and of the upper tibial spines, as these sensilla layon the distal inter-electrode space (Tables 1 and 2, \). While we have not attemptedto estimate the impulse position relative to the distal electrode pair at the momentof the distal baseline crossing, it seems likely that the true conduction distancewas less than the distance between midpoints by not more than half the distal inter-electrode spacing. The true conduction velocities of these fibres may be as much as10-20% lower than calculated.
It is unlikely that the cut proximal end of the nerve trunk presents a conductionproblem in most cases, since the most proximal recording electrode was usuallyseveral millimeters from the cut end. The length constant of these fibres can beestimated from the data of Boistel & Coraboeuf (1954) and Yamasaki & Narahashi(1959 A) for Periplaneta giant fibres (conduction velocity = 7 m./sec. and lengthconstant = 1 mm. respectively) and the conclusion from local circuit theory thatlength constant and conduction velocity are proportional. Thus length constants inthese afferents should be about half those of giant fibres, or 0-5 mm., so that the lastrecording electrode was probably 5-10 length constants from the cut end in mostcases. The two fastest axons (Table 2, Expt. 15) are also those with the lowest Q10's,suggesting the possibility that the fibres were damaged with decremental conductiontoward the more proximal electrode pair. However, there was no direct evidence ofdamage, and these fibres did continue to conduct as long as many of the others, so thatthe data have not been rejected.
To summarize the random and systematic errors attributable to the limits ofgraphical precision, anatomical length measurement, and electrode placement effects,the relative error in an individual determination of conduction velocity, taken simplyas the sum of the individual relative errors, is about 3 ± 6 % t o 5 ± i 2 % f o r prepara-tions with unequal inter-electrode spacing, or + 6-12 % for those with equal spacing.These experimental errors are appreciably smaller than the population variability forconduction velocity.
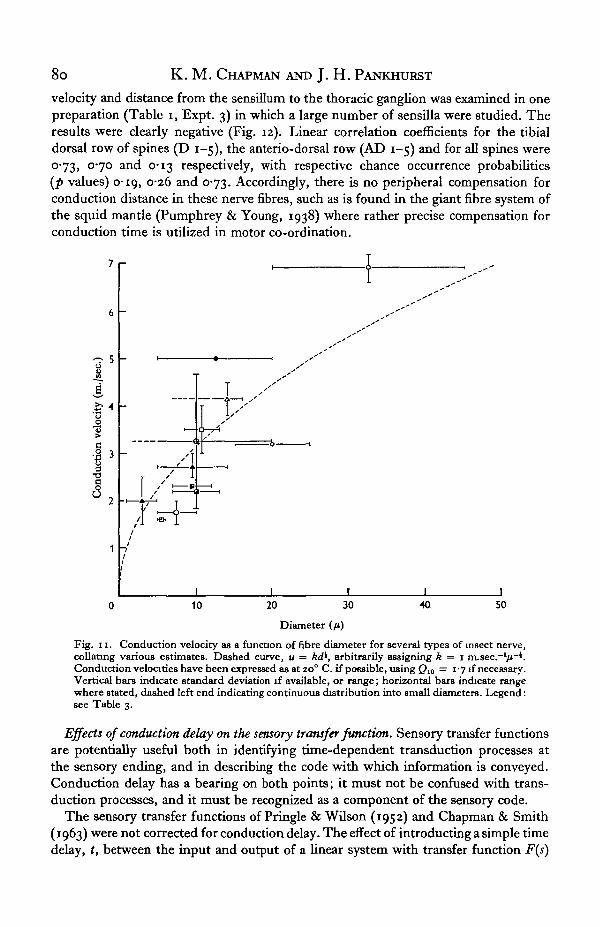
Fibre diameters. No direct measurements of fibre diameter were undertaken in thepresent work, but it is useful to estimate diameters of these afferent fibres by com-paring our results with data in the literature. Fig. 11 and Table 3 collate data fromseveral insect species, in which velocities range from among the fastest found ininsects to significantly below those studied here. In most cases, the diameter measure-ments and velocity measurements have been made by different authors, and fre-quently temperatures have not been specified. The entire collection of data does, how-ever, agree plausibly with the theoretical parabolic relation between velocity anddiameter D, .
u = kDl (11)(Fig. 11, dashed curve), of Pumphrey & Young (1938), Hodgkin (1954) and others,for unmedullated nerve. Within the limits of this comparison, our values of conductionvelocity indicate fibre diameters of the order of 10/i, ranging from about 3 to 20/4within one standard deviation of the mean velocity for the population. This physio-logical estimate thus agrees with Pringle's (1938) measurements of 6-15 /i for afferentfibres from campaniform sensilla in the trochanter, and does not support Guthrie's(1962) conclusion that in the legs of Periplaneta only motor fibres exceed 5 /i.
Non-correlation with sensory path length. The possible correlation of conduction
80 K. M. CHAPMAN AND J. H. PANKHURST
velocity and distance from the sensillum to the thoracic ganglion was examined in onepreparation (Table i, Expt. 3) in which a large number of sensilla were studied. Theresults were clearly negative (Fig. 12). Linear correlation coefficients for the tibialdorsal row of spines (D 1-5), the anterio-dorsal row (AD 1-5) and for all spines were°"73> °'7° a n d °-I3 respectively, with respective chance occurrence probabilities(p values) 0-19, 0-26 and 0-73. Accordingly, there is no peripheral compensation forconduction distance in these nerve fibres, such as is found in the giant fibre system ofthe squid mantle (Pumphrey & Young, 1938) where rather precise compensation forconduction time is utilized in motor co-ordination.
-> 5
1•aa
10 20 30 50
Diameter
Fig. 11. Conduction velocity as a function of fibre diameter for several types of insect nerve,collating various estimates. Dashed curve, u = /W, arbitrarily assigning k = i m.sec.~l/i~i.Conduction velocities have been expressed as at 20° C. if possible, using Q10 = 1 -7 if necessary.Vertical bars indicate standard deviation if available, or range; horizontal bars indicate rangewhere stated, dashed left end indicating continuous distribution into small diameters. Legend:see Table 3.
Effects of conduction delay on the sensory transfer function. Sensory transfer functionsare potentially useful both in identifying time-dependent transduction processes atthe sensory ending, and in describing the code with which information is conveyed.Conduction delay has a bearing on both points; it must not be confused with trans-duction processes, and it must be recognized as a component of the sensory code.
The sensory transfer functions of Pringle & Wilson (1952) and Chapman & Smith(1963) were not corrected for conduction delay. The effect of introducting a simple timedelay, t, between the input and output of a linear system with transfer function F(s)
Conduction velocities of cockroach nerve fibres 81
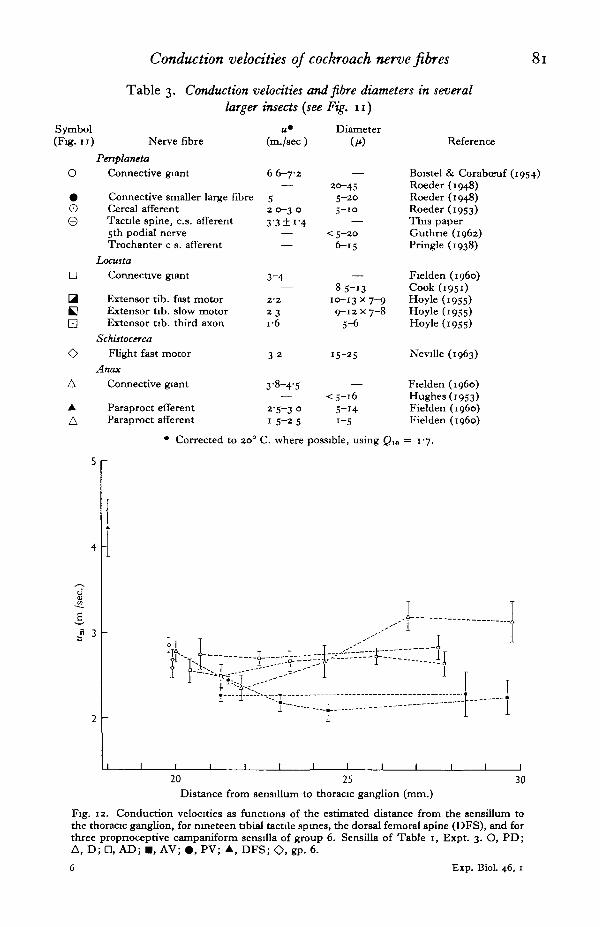
Table 3. Conduction velocities and fibre diameters in severallarger insects {see Fig. 11)
Symbol(Fig. I I )
O
0©
•
B
aB
oA
A
A
Nerve fibre
Penplaneta
Connective giant
Connective smaller large fibreCereal afferentTactile spine, c.s. afferent5 th podial nerveTrochanter c s. afferent
Locusta
Connective giant
Extensor tib. fast motorExtensor tib. slow motorExtensor tib. third axon
Schistocerca
Flight fast motor
Anax
Connective giant
Paraproct efferentParaproct afferent
u*(m./sec )
66-72—
52 O—3 O
3-3 ±1-4——
3-4—
2-2
2 3i-6
3 2
3-8-4-5
2-5-3 01 5-25
Diameter
—20-455-205-10
—
<5-2O6-15
—
85-1310-13x7-99-12 X7-8
5-6
15-25
—
<5-i65-141-5
Reference
Boistel & Coraboeuf (1954)Roeder (1948)Roeder (1948)Roeder (1953)This paperGuthne (1962)Pringle (1938)
Fielden (i960)Cook (1951)Hoyle (1955)Hoyle (1955)
Hoyle (1955)
Neville (1963)
Fielden (i960)Hughes (1953)Fielden (i960)Fielden (i960)
• Corrected to 20° C. where possible, using Qw = 1-7.
S r
3 3 ..''"1
-- !I
20 25Distance from sensillum to thoracic ganglion (mm.)
30
Fig. 12. Conduction velocities as functions of the estimated distance from the sensillum tothe thoracic ganglion, for nineteen tibial tactile spines, the dorsal femoral spine (DFS), and forthree propnoceptive campaniform sensilla of group 6. Sensilla of Table 1, Expt. 3. O, PD;A, D; D, AD; • , AV; • , PV; A, DFS; O. gP- °-
6 Exp. BioL 46, 1

82 K. M. CHAPMAN AND J. H. PANKHURST
(defined by Laplace transforms) is well known*; the transfer function with delaybecomes F(s)exp( — ts). In terms of the frequency response function, obtained byevaluation with the imaginary values of the complex frequency s,
s = o+J2nf, (12)the delay factor becomes
exp(-fc) = exp(-j2nft). (13)
For a sinusoidal input with frequency/ the delay factor simply shifts the phase of thecorresponding output sinusoid by phase angle
<j> = - 2 1 1 f t , (14)and has no effect on its amplitude.
In the present case, when a sensory discharge has been monitored at a distance dfrom the sensillum, the transfer function relating the observed impulse-frequencymodulation to a mechanical input contains implicitly the conduction delay factor
exp(-fr) = exp{-sd/u), (15)
with corresponding phase shift$ = -2*f(dlu). (16)
For the average conduction velocity, 1*20 = 3*3 m./sec, the phase-shift per unit con-duction distance and unit sinusoidal input frequency is
<j>jfd = —o-ii°/mm. (cycle per sec). (17)
Since the phase-shift varies inversely with conduction velocity, its Q10 is the reciprocalof that for conduction velocity, or about o-6.
In the transfer function experiments of Chapman & Smith (1963) on the dorsalfemoral spine preparation, the recording electrodes were usually about 5 mm. fromthe sensillum, and the latter gave frequency-modulated discharges for input sinusoidsfrom about o-oi to 30 cycle/sec. This gives the phase-angle correction, by which thetransfer function at the sensillum leads the observed values, as about
— 4>lf = + o-55°/cycle per sec, (18)
or about 160 at 30 cycle/sec. While it is well within the limits of precision of measuredtransfer functions over most of the physiological frequency range, the effect is notnegligible at the uppermost frequencies.
In the time domain, the conduction delay per unit distance is simply the reciprocalof velocity. For %, = 3-3 m./sec. it is 0-3 msec/mm. Like the phase shift, it has aQw of about o-6. In keeping with linear transfer-function theory as well as withintuition, it does not appreciably distort the sequence of impulses originating at thesensillum, but merely delays its presentation to the central nervous system. A minorfacilitatory effect of impulse frequency on conduction velocity has been mentionedearlier, and to this extent the waveform of modulated impulse frequency is slightlypeaked at high impulse frequencies. But it is likely that, in at least some circum-stances, the temporally encoded signal from these sensilla is transmitted with precisionwell beyond its meaningful information content. Wilson & Gettrup (1963) and Wilson(1966) have suggested that in insect flight and running, volleys of proprioceptiveimpulses serve mainly to regulate the timing of central endogenous oscillators, and
• A biologically oriented treatment of thu subject ia given by MJsum (1966); Aseltine (1958) givesfurther detail.
Conduction velocities of cockroach nerve fibres 83
do not participate directly in the precise control of movements. It remains to beshown, however, how much of the available sensory information is actually utilizedin walking and in other more delicate motor acts such as leg preening.
Among the tactile spines, since conduction velocity is uncorrelated with path length,the main effect of the spatial distribution of sensilla is probably merely to increase thedispersion of conduction delays. For fibres within one standard deviation of mean u^conduction delays vary 2- to 3-fold due to the velocity distribution. The range ofsensory path lengths from the most proximal of the ventral femoral spines to the mostdistal tibial spines, about 10-30 mm., increases the spread by another factor of 3, sothat corresponding delays range from about 2 to 15 msec. As with temporal encoding,however, it seems unlikely that conduction delay effects limit any known behaviouralreactions involving sensory input from tactile spines.
In proprioception, however, conduction delays may be closely matched to thefastest locomotor responses. Wilson (1965) has measured minimum reflex latenciesfor proprioception in cockroach legs of 10 msec, or less, from mechanical input to thefirst 'muscle potential', in muscles whose oscillatory periods may approach 50 msec,in rapid running. If our velocity data are valid for the major groups of proprioceptivecampaniform sensilla, it is clear that only the most proximal groups can participatein the fastest reflex phenomena. Conduction times in fibres within one standarddeviation of mean u^ range from 5 msec, or less from even the slower fibres of tro-chanteral and upper femoral groups 1-5 to well beyond 8 msec, for even the fasterfibres from tarsal sensilla. If synaptic delay and motor transmission occupy about halfthe minimum latency, then most of the group 1-5 sensilla, but only about half thoseof group 6 on the upper tibia, can report in time; almost all the tarsals must beexcluded. However, Wilson (1965) points out that muscle contraction, not minimumreflex latency, is probably what limits stepping frequencies in fast running. Evidentlythen, with stepping periods of 50 msec, and longer, nearly all of the proprioceptiveinput arrives at the thoracic ganglion well within a single period. Whatever role pro-prioceptive information may have in locomotion, it seems that most of it could beavailable for fairly simple reflex effects.
SUMMARY
1. Conduction velocities of individual afferent nerve fibres from tactile spines andproprioceptive campaniform sensilla have been measured in situ over the temperaturerange 5-420 C, in leg preparations of the cockroach Periplaneta americana.
2. Conduction velocities at 200 C. (%,) averaged 3-3! i-4m./sec., ranging fromi-6 to II-O m./sec.
3. Temperature coefficients, expressed as Qw for the interval 20-3o° C, averaged1-710-24, ranging from 1-3 to 2-6.
4. The length of the propagated disturbance is about 2-3 mm., and is nearlytemperature-independent.
5. Fibre diameters, estimated from conduction velocity, must be about 10 /i.6. There is no correlation between conduction velocity and distance from the
sensillum to the thoracic ganglion. Conduction delays in fibres conducting within onestandard deviation of mean M ,̂ range from about 2 to 15 msec, from the most proximalto the most distal tactile spines.
6-2
84 K. M. CHAPMAN AND J. H. PANKHURST
7. The effect of conduction delay on temporal and spatial sensory encoding isprobably unimportant from a behavioural point of view. It contributes a factor of theform exp(-sdlu) to the sensory transfer function, and may be appreciable at upperphysiological frequencies of impulse frequency modulation.
We thank Drs J. M. Marshall and B. T. and P. A. Stewart for criticizing the manu-script, and Messrs J. Mares and N. Allahar for technical assistance.
REFERENCES
ASELTINE, J. A (1958). Transform Method in Linear System Analysis. New York, Toronto, London:McGraw-Hill.
BOISTEL, J. & CORABCEUF, E. (1954). Potentiel de membrane et potentiels d'action de nerf d'insectsrecueilhs a l'aide de microelectrodes intracellulaires. C. r. hebd. Sianc. Acad. Set., Pans 338, 2116-18.
BULLOCK, T. H. & HOHRIDGE, G. A. (1965). Structure and Function in the Nervous Systems of the Inverte-brates. San Francisco and London: Freeman.
CHAPMAN, K. M. (1957). A miniature direct-plotting pulse-frequency nomogram. WADC TN 57-371,ASTIA Document no. 142 097, Wright Air Development Center, Wright-Patterson Air Force Base,Ohio, U.S A.
CHAPMAN, K. M. (1965). Campaniform sensilla on the tactile spines of the legs of the cockroach. J.exp. Btol. 43, 191-203.
CHAPMAN, K. M. & SMITH, R. S. (1963). A linear transfer function underlying impulse frequencymodulation in a cockroach mechanoreceptor. Nature, Lond. 197, 699—701.
COOK, P. M. (1951). Observations of giant fibres of the nervous system of Locusta mxgratoria. Q. JlMicrosc. Sci. 93, 297-305.
DRESDEN, D. & NIJENHUIS, E. D. (1958). Fibre analysis of the nerves of the second thoracic leg inPeriplaneta amencana. Proc. K. ned. Akad. Wet. C 61, 213-23.
FIELDEN, A. (i960). Transmission through the last abdominal ganglion of the dragonfly nymph, Anaximperator. J. Exp. Btol. 37, 832-44.
GUEST, P. G. (1961). Numerical Methods of Curve Fitting. Cambridge University Press.GUTHRTE, D. M. (196a). Regenerative growth in insect nerve axons. J. Insect Physiol. 8, 79-92.HoDGKTN, A. L. (1954). A note on conduction velocity. J. Physiol. 135, 221-24.HOYLE, G. (1955). The anatomy and mnervation of locust skeletal muscle. Proc. R. Soc. B, 143, 281—92.HUGHES, G. M. (1953). ' Giant' fibres in dragonfly nymphs. Nature, Lond. 171, 87-8.LUCAS, K. (1908). The temperature coefficient of the rate of conduction in nerve. J. Physiol. 37, 112-21.MARMONT, G. (1940). Action potential artefacts from single nerve fibers. Am. J. Physiol. 130, 392-402.MILSUM, J. H. (1966). Biological Control Systems Analysis. New York, Toronto, London: McGraw-HilLNEVILLE, A. C. (1963). Motor unit distribution of the dorsal longitudinal flight muscles in locusts. J.
Exp. Btol. 40, 123-36.NIJENHUIS, E D. & DRESDEN, D. (1952). A micromorphological study on the sensory supply of the meso-
thoracic leg of the American cockroach Periplaneta amencana. Proc. K. ned. Akad. Wet. C, 55, 300—10.PRINGLE, J. W. S. (1938). Proprioception in insects. II. The action of the campaniform sensdla on the
legs. J. Exp. Btol. 15, 114-31.PRINGLE, J. W. S. & WILSON, V. J. (1952). The response of a sense organ to a harmonic stimulus. J.
Exp. Btol. 29, 220-34.PUMPHREY, R. J. (1936). Slow adaptation of a tactile receptor in the leg of the common cockroach. J.
Phystol. 87, 6PPUMPHREY, R. J. & YOUNG, J. Z. (1938). The rates of conduction of nerve fibres of various diameters in
cephalopods. J. Exp. Btol. 15, 453-66.RocKSTEiN, M. (1965). The Physiology of Intecta, vol. 11. New York: Academic Press.ROEDER, K. D. (1948). Organization of the ascending giant fiber system in the cockroach {Periplaneta
amencana). J. Exp. Zool. 108, 243-61.ROEDER, K. D. (1953). Electrical activity in nerves and ganglia. In Insect Physiology (ed. K. D. Roeder),
ch. 17. New York: Wiley.TREHBRNE, J. E. & BEAMENT, J. W. L. (1965). The Physiology of the Insect Central Nervous System. New
York: Academic Press.WILSON, D. M. (1965). Proprioceptive leg reflexes in cockroaches. J'. Exp. Btol. 43, 397-410.WILSON, D. M. (1966). Insect walking. Am. Rev. Entom. 11, 103-22.WILSON, D. M. & GETTRUP, E. (1963). A stretch reflex controlling wingbeat frequency in grasshoppers.
J. Exp. Btol. 40, 171-85.YAMASAKI, T. & NARAHASHI, T. (1959a). The effects of potassium and sodium ions on the resting and
action potentials of the cockroach giant axon. J. Insect. Physiol. 3, 146-58.YAMASAKI, T. & NARAHASHI, T. (19596). Electrical properties of the cockroach giant axon. J. Insect.
Pkysiol. 3, 230-42.