conducting longitudinal experiments with...
TRANSCRIPT
Conducting Longitudinal Experiments with BehavioralModels in Repeated Stackelberg Security Games on
Amazon Mechanical Turk
Debarun Kar, Fei Fang, Francesco Delle Fave, Nicole Sintov, and Milind Tambe
Department of Computer Science,University of Southern California, Los Angeles, California - 90089. USA.
{dkar,feifang,dellefav,sintov,tambe}@usc.edu
Abstract. Recently, there has been an increase of interest in domains involvingrepeated interactions between defenders and adversaries. This has been modeledas a repeated Stackelberg Security Game (repeated SSG). Although different be-havioral models have been proposed for the attackers in these games, human sub-jects experiments for testing these behavioral models in repeated SSGs have notbeen conducted previously. This paper presents the first “longitudinal study” – atleast in the context of SSGs – of testing human behavior models in repeated SSGsettings. We provide the following contributions in this paper. First, in order totest the behavioral models, we design a game that simulates the repeated inter-actions between the defender and the adversary and deploy it on Amazon Me-chanical Turk (AMT). Human subjects are asked to participate in this repeatedtask in rounds of the game, with a break between consecutive rounds. Second,we develop several approaches to keep the human subjects motivated throughoutthe course of this longitudinal study so that they participate in all measurementoccasions, thereby minimizing attrition. We provide results showing improve-ments of retention rate due to implementation of these approaches. Third, wepropose a way of choosing representative payoffs that fit the real-world scenariosas conducting these experiments are extremely time-consuming and we can onlyconduct a limited number of such experiments1.
Keywords: Game Theory, Human Behavior Models, Repeated Stackelberg Games,Longitudinal Experiments, Amazon Mechanical Turk
1 Introduction
Whereas previous real-world deployments of Stackelberg Security Games (SSGs) toprotect airports, ports or flights have been one-shot game models [13], recent work hasfocused on domains involving repeated interactions between defenders and adversaries.These domains include security of wildlife (repeated interactions between rangers and
1 This paper is based on the following AAMAS’15 full paper- ”A Game of Thrones”: WhenHuman Behavior Models Compete in Repeated Stackelberg Security Games [5]. Unlike themain conference paper, this paper focuses on the methodological contributions of conductinghuman subjects experiments in repeated game settings.
2 Debarun Kar, Fei Fang, Francesco Delle Fave, Nicole Sintov, and Milind Tambe
poachers) [14], security of fisheries (repeated interactions between coast guard and ille-gal fishermen) [4], forest protection or drug interdiction, and are modeled via repeatedSSGs. In a repeated SSG model, the defender periodically deploys new patrol strate-gies (in “rounds” of the game) and the adversary observes these strategies and actsaccordingly. Recent studies based on human subject experiments (HSEs) on AmazonMechanical Turk (AMT) have shown that modeling the adversary’s bounded rational-ity using behavioral models such as quantal response (QR) [15] and subjective utilityquantal response (SUQR) [11] leads to better performance when played against humansubjects in single-shot games. However, there is no prior work on comparing these be-havioral models and corresponding algorithms in repeated SSGs through HSEs. HSEsfor repeated SSGs gives rise to several key challenges.
First, to test a particular behavioral model, we require the same set of participantsto play each round of the game against the defender strategy computed for that model.The participants should also start with their earnings till the previous round to ensuresimilarity with the real-world scenario. This requires a new game design. Second, allthe algorithms require collecting attack data of all the human subjects after each roundto learn the parameters of the attackers’ behavioral models and then calculate defenderstrategy for the next round. Once a particular round has been deployed and human sub-jects have been notified to play that round, the participants may play at different timesand hence the completion of each round may take several hours or even a few days.Third, as the participants will need to play several rounds for one experiment, someplayers may leave the game before they finish all the rounds, raising a new challengeof ensuring the retention rate. Fourth, the time span of each experiment would be muchlonger than a single-shot SSG, thus restricting the total number of experiments thatcan be conducted and increasing the importance of identifying representative games fortesting our models.
We fill these gaps by being the first to conduct longitudinal experiments2 [7] withhuman subjects to test the effectiveness of existing behavioral models and algorithmson repeated SSGs. We also provide the following contributions in this paper. First, inorder to test the behavioral models, we design a game that simulates the repeated inter-actions between the defender and the adversary and deploy it on Amazon MechanicalTurk (AMT). Human subjects are asked to participate in this repeated task in roundsof the game. Second, we develop several approaches to keep the human subjects mo-tivated throughout the course of this longitudinal study so that they participate in allmeasurement occasions, thereby minimizing attrition which was a huge cause of con-cern for us. We provide results showing improvements of retention rate due to imple-mentation of these approaches. Third, we propose a way of choosing representativepayoffs that fit the real-world scenarios as conducting these experiments are extremelytime-consuming and we can only conduct a limited number of such experiments.
These methodological contributions towards successfully conducting longitudinalexperiments with human subjects on AMT led to the testing of several behavioral mod-els and thus assess the performances of these models against human subjects. This, inturn, helped in identifying the strengths and weaknesses of existing models in repeated
2 Whereas “longitudinal study” is often used to describe research that spans years – in which measurement occasions areconducted every X years – we use the term longitudinal study because our study included 5 measurement points with asingle population.

Title Suppressed Due to Excessive Length 3
Fig. 1. Game Interface for our simulated online repeated SSG (Reward, penalty and coverageprobability for a selected cell are shown)
SSGs and allowed us to develop and test a new model called SHARP [5] which miti-gates the weaknesses of existing models.
2 Game Interface Design
2.1 Game Overview
In our game, human subjects play the role of poachers looking to place a snare to hunta hippopotamus in a protected wildlife park. The game interface is shown in Fig. 1. Inthe game, the portion of the park shown in the map is divided into a 5*5 grid, i.e. 25distinct cells. The players may observe many hippos in some cells and fewer hipposin other cells. This is because the density of hippos may vary from one region of thepark to another but note that the density in a particular region or cell remains constant,i.e. the number of animals in a particular region does not change over time. Hippos fitour description perfectly because they are territorial animals and stay very close to theirstarting locations. Also to remove any bias on part of the human subjects3, we avoidedpopular species like tigers, elephants, etc. Also note that in the game, the movement ofthe hippos within a region is random and is currently not governed by any particularanimal movement model.
In order to ensure that the participants play the game with the mindset similar tothat of a poacher in the real-world, we first primed the participants before the start ofthe game with a background story about the hardships of a poacher’s life and that if theysuccessfully poached they can both feed their families and also earn money by sellingsome of the meat. This was in correlation with the real-world scenario.
3 “Charismatic Megafauna” effect: http://www.nature.com/news/charismatic-mammals-can-help-guide-conservation-1.14396

4 Debarun Kar, Fei Fang, Francesco Delle Fave, Nicole Sintov, and Milind Tambe
Overlaid on the Google Maps view of the park is a heat-map, which represents therangers’ mixed strategy x — a cell i with higher coverage probability xi is shown morein red, while a cell with lower coverage probability is shown more in green. As thesubjects play the game, they are given the following detailed information: the reward ifthey poach successfully (Ra
i ), the penalty if they get caught while poaching (P ai ) and
the coverage probability (xi) for each target i. However, they do not know the purestrategy that will be played by the rangers in each round, which is drawn randomlyfrom the mixed strategy x shown on the game interface. Thus, we model the real-worldsituation that poachers have knowledge of past pattern of ranger deployment but notthe exact location of ranger patrols when they set out to lay snares. In our game, therewere M = 9 rangers protecting this park, with each ranger protecting one grid cell.Therefore, at any point in time, only 9 out of 25 distinct regions in the park are protected.In this game, a player can only see his/her snare being placed in the park. This is incompliance with a simplified assumption of the real-world scenario, i.e. we assume thata particular poacher is unaware of the snares placed by other poachers and hence hisdecision to place a snare is unaffected by the other snares placed in the same or anyother region.
2.2 Computation of Poacher Reward
In addition to animal density, which is strongly correlated with high-risk areas of poach-ing [10,9,3], distance is another important factor in poaching, e.g., recent snare-densitystudies have found that significant poaching happens within 5 kilometers of SouthAfrica’s Kruger National Park border [6]. Therefore, the reward obtained by a poacherin successfully placing a snare at target i is calculated by discounting the animal densityby a factor of the distance traveled and is calculated as follows:
Rai = int(φi − ζ ∗ Di
maxj
(Dj)) (1)
Here, φi andDi refer to the animal density at target i and the distance to target i from thepoacher’s starting location respectively. int(y) rounds the value y to the closest integervalue. The parameter ζ is the importance given to the distance factor in the rewardcomputation and may vary based on the domain. Intuitively, the reward for successfullyplacing a snare in a region i near the starting location and which has animal densityφi, is higher than the reward obtained by successfully placing a snare in a region withthe same animal density but which is at a greater distance from the starting location ascompared to i.
2.3 Non-zero sum game
In our games, the minimum and maximum animal density at each cell were 0 and 10units respectively. The poacher received a flat penalty of -1 if he was caught at any tar-get. Also in our game, when the poacher successfully poaches, he may obtain a rewardthat is less than the animal density (Eqn. 1), but the defender loses a value equal to thatof the animal density, i.e., the game is non-zero-sum.

Title Suppressed Due to Excessive Length 5
Table 1. Experiment Details
Average time taken
per model per payoff
structure (all 5
rounds)
Average time taken
for a set of
participants to play
each round
Number of
participants who
played round 1
(minimum,
maximum)
Average number of
participants who
played all 5 rounds
Average retention
rate from round 2 to
round 5
2.3 weeks 4 days (42 , 49) 38 83.69%
3 Online Longitudinal Experiments
Longitudinal studies are typically conducted to observe and understand the effects ofa particular set of variables over a period of time. Such studies can be conducted witha subject pool at an University lab or by recruiting participants in an online settinglike AMT. Due to low costs, availability of a diverse subject pool and scalability, AMThas recently been a more favorable choice [12]. We tested a set of behavioral models(P-SUQR, P-BSUQR, P-RSUQR) and Maximin on AMT [5] by deploying the mixedstrategy generated based on each of these models repeatedly over a set of five rounds.For each model, we recruited a new set of participants to eliminate any learning bias.Due to unavailability of data, the strategy shown for each first round was Maximin. Wethen learned the model parameters based on previous rounds’ data, recomputed and re-deployed strategies, and asked the same players to play again in the subsequent rounds.For each model, all five rounds were deployed over a span of weeks. Such longitudinalstudies on AMT are rare at AAMAS (in fact we are not aware of any); and certainlynone have been conducted in the context of SSGs. Indeed, while the total time of en-gagement over our 20 experimental settings was 46 weeks, each setting required on av-erage 2.3 weeks, a duration typically not seen in related research at AAMAS (See Table1). Conducting such experiments on AMT gives rise to a set of challenges. Thereforethis section highlights our methodological contributions to conduct such experiments.
Specifically, the challenges of longitudinal studies on AMT include: (i) ensuringthat participants completely remember the game details and the procedures to play thegame during each round of the experiment, as otherwise we may lose significant timeand effort in collecting poor quality data, especially because each setting would takemore than two weeks to be completed; (ii) minimizing attrition and maximizing reten-tion, particularly for our study which required five separate measurement occasions; (iii)setting up a payment scheme to maximize participant retention across five rounds; and(iv) lengthy rounds due to participants’ long latencies (in some instances forgetfulness)in responding to notifications.
To mitigate the above challenges, we took the following steps: (i) We set up propervalidation and trial games in each round of the experiment, while not over-burdening theparticipants with many games and thus keeping their cognitive overload at a minimum.(ii) To be eligible for initial study enrollment, participants had to commit to completingall five rounds, i.e, remain in the study through completion. (iii) We allowed respondentssufficient time (4-5 days) to respond [8], as giving them an immediate deadline to finisha particular task can result in high attrition rates. (iv) We maintained persistent contactby sending repeated reminders [1]. (v) We set up the payment scheme to consistently
6 Debarun Kar, Fei Fang, Francesco Delle Fave, Nicole Sintov, and Milind Tambe
reward participation in each round plus offering a relatively high completion incentiveat the end of the experiment. First, we discuss below how we set up the validation andtrial games. Then, we discuss the implementation details of each of the above stepstaken (in the order they were implemented) to reduce attrition rates and also provideresults showing the improvements due to our approaches.
3.1 Validation and Trial Games
To enhance understanding of the game, participants were asked to play two trial gamesin round 1, with an option to view the instructions again after each game. After the trialgames, they played one validation game, and finally the actual game. The validationgame consisted of a cell with maximum animal density (=10) and the coverage proba-bility of that cell was zero, while other cells had an animal density of 1 and non-zerobut equal coverage probability. The participants were expected to select the target withthe maximum animal density and zero coverage. Data from subjects who played thevalidation game incorrectly were discarded and they were not allowed to participate infuture rounds of the experiment.
From second round onwards, participants were only asked to play one trial gameand then the actual game. The trial game was kept in order to remind them of the gameand its details and the playing procedures. Showing only the actual game without anytrial games might have resulted in the participants not playing the game properly due toforgetfulness about the game details.
3.2 Payment Scheme
In our initial payment scheme, participants were paid a fixed ‘base compensation’(=$0.50) for participation in each round of the experiment and a bonus amount basedon the points earned (or lost) in each round by attacking a particular target region inthe game. The participants started with an initial amount of $0.50 as the bonus amountin each round. For each point earned in a particular round (i.e., if they successfullypoached), they received $0.10 as the bonus compensation. For each point lost (i.e., ifthey were captured by the ranger), $0.10 was deducted from their current amount. Thebonus at the end of a round was not carried forward to the next round and was paidalong with the fixed participation compensation for that round. For example, for anexperiment with two rounds and $0.50 as the base compensation for each round, if aparticipant earned a reward point of 9 in the first round and got a penalty of 1 in thesecond round, (s)he was paid $(0.50+(0.50+9*0.10)) = $1.90 at the end of round 1 and$(0.50+(0.50-0.10*1)) = $0.90 at the end of round 2. However, this led to very high at-trition rates, i.e., very few people returned to play in each round, thus making it difficultto compare the performances on various models on a varying number of participants foreach model. This is shown in Fig. 2(a). Note that we had to abandon the experimentsdue to high attrition rates in round 5 for PSUQR in the first trial and rounds 4 and 5for PSUQR in the second trial. This led us to implement a payment scheme which isdiscussed below.
We made three changes to our first method of compensation. First, we introduced a‘completion bonus’ (=$2.50) for completing all the rounds of the experiment. Second,
Title Suppressed Due to Excessive Length 7
like before, to motivate the subjects, the participants were incentivized based on thereward/penalty of the region they chose to attack. However now, while the base com-pensation was paid after each round was completed, the incentivizing bonus was carriedforward from one round to the next and paid along with the completion bonus at the endof all the rounds of the experiment. This incentivizing bonus is called the ‘performancebonus’. Third, the players now started with an initial base performance bonus amount of$1.50 in round 1 and they could win up to a maximum and a minimum amount in eachround and hence at the end of all the rounds, based on how successful they were. We setthe base compensation fee for each round to be only $0.50, thus resulting in a total basecompensation fee of $2.50 over 5 rounds. However, the maximum amount they couldpotentially earn at the end of all the rounds from only the performance and completionbonus was as high as $7.60. The performance and completion bonus together at the endof all the rounds was much higher as compared to the total base compensation earnedfor playing all the 5 rounds. This ensured that majority of the participants remainedmotivated and returned to play all the rounds.
Taking the previous example of a two-round experiment where a participant earneda reward point of 9 in the first round and a penalty of 1 in the second round, (s)hewas paid $0.50 at the end of round 1 (the participation bonus for round 1). (S)he alsoearned a performance bonus of $(1.50+9*0.1) = $2.40 in round 1 which was carriedforward to round 2 and not paid at the end of round 1. Then at the end of round 2 shewas paid $(0.50+(2.40-1*0.1)+2.50) = $5.30 (participation bonus for round 2 (=$0.50)+ performance bonus at the end of round 2 (=$2.30) + completion bonus (=$2.50)).On an average, each participant was paid $7.60 upon completion for our five-roundexperiments. The effect of this payment scheme on participant retention rate can beseen in Fig.2(b).
3.3 Initial Study Enrollment
Even though the implementation of the new payment scheme saw an increase in reten-tion rate as shown in Fig. 2(b), there was still a decrease in retention rates over rounds.Therefore, we implemented an approach where the participants had to commit to com-pleting all five rounds before starting the first round of the game. They were asked toeither ‘agree’ or ‘disagree’ to this commitment. On an average, 96% of the participantswho enrolled in AMT for our study agreed to this commitment. These participants werethen allowed to proceed towards playing the first round of the game. On the other hand,if they did not agree, they were thanked for their interest in our study, but not allowedto participate any further. The effect of this on the retention rate can be seen in Fig.2(c). This clearly shows that a significant number of participants with prior commit-ment towards completing all the rounds of the experiment, returned and completed allthe rounds.
3.4 Reminder Emails
Even though the implementation of the payment scheme and initial study enrollmentprocedures increased the retention rate as shown in Fig. 2(c), the retention rate still de-creased over rounds for some of the experiments, even though at a slower rate. There-

8 Debarun Kar, Fei Fang, Francesco Delle Fave, Nicole Sintov, and Milind Tambe
(a) before payment scheme (b) after payment scheme and before initialstudy enrollment
(c) after payment scheme and after initial studyenrollment
Fig. 2. Retention Rates for various models (a) before implementation of our payment scheme,and (b) after implementation of our payment scheme and before implementation of initial studyenrollment procedure.
fore, we sent repeated reminders to the participants with clearly stated deadlines toensure that they (i) do not forget to participate in the current round, and (ii) also remainmotivated throughout the study. The construction of the email also turned out to be cru-cial in ensuring that more participants returned to play the next round. Specifically, theitalicized portion in the sample email shown below proved effective. Results are shownin Figs. 3(a) and 3(b).
Sample Email:
Hi,
Thank you for participating in our experiment. Your base compen-sation for round 3 has been paid to you via AMT. Thank you also foryour valuable comments and suggestions about the game and its strate-gies. We will definitely take those into account later on. Now, we wouldwant you to participate in the 4th round of our experiment. Pleasefollow the link below to participate: http://cs-server.usc.edu:16568/gamelink/index.jsp

Title Suppressed Due to Excessive Length 9
(a) ADS1 (b) ADS2
Fig. 3. Retention Rates for various models over 4 rounds, starting from round 2 to round 5, on (a)ADS1 and (b) ADS2 respectively.
In the first page, please read carefully the compensation details. Youwill be starting with the performance bonus that you earned in the lastround. The last date to participate in this round of our experiment isWednesday (November 6 2014) 4 pm PST. Please try to complete theexperiment by the deadline because otherwise deployment of the nextround gets delayed.
You are very important to the study and your continued participation iscritical. Don’t be discouraged if you got caught by a ranger in this round.The chance to play again and earn performance and completion bonuses arecoming in a few days. We look forward to your continued participation.
Thank you.
3.5 Discussions
In this section, we discuss some of the key strengths and limitations of our approaches.(i) The implementation of each additional strategy (such as the payment scheme, emailreminders, etc) required us to restart the experiment every time a new strategy wasimplemented. Also, since some of these approaches were not tested in isolation, butwere only tested in combination with other approaches, we do not know how some ofour strategies for maximizing retention in isolation affected retention rates (except forthe first strategy, i.e. the new payment scheme we employed). So, if we only had im-plemented email reminders but did not give them sufficient time to respond, retentionmight be different and vice versa. (ii) It is possible to run parallel experiments withour game as we recruit completely different sets of participants for each of our 5-roundexperiment. We recruited different sets of players for each of our 5-round experimentsbecause the knowledge accumulated by the subjects from a set of rounds of the gamemay affect the decision made by the same subjects if they were asked to play fromround 1 in a different experiment. (iii) The problems addressed by the development ofeach of our strategy (for example, the choice of concrete metrics, payoffs and incentive

10 Debarun Kar, Fei Fang, Francesco Delle Fave, Nicole Sintov, and Milind Tambe
(a) ADS1 (b) ADS2
(c) ADS3 (d) ADS4
Fig. 4. Animal density structures
mechanisms) does indeed lead to the development of some methodological contribu-tions towards conducting such longitudinal experiments on crowdsourcing platformslike AMT. The principles followed are not only based on common sense, but previousliterature [2] and also the results shown in Figs. 2(a)-2(c) and 3(a)-3(b) .
4 Payoff Structures
Selecting the appropriate set of payoff structures is critical as the total number of experi-ments that can be conducted is limited due to the time taken to conduct each experiment.The payoff structures used in our human subjects experiments vary in terms of the ani-mal densities and hence the adversary rewards. We henceforth refer to payoff structuresand animal density structures interchangeably in this paper. The total number of ani-mals in all the payoffs we generate is the same (= 96). However, the variation in thesepayoffs is in the way that the animals are spread out in the park. In payoff structure 1,the animal density is concentrated towards the center of the park, whereas the animaldensity is higher towards the edges of the park in payoff structure 2. These representscenarios that might happen in the real world. The animal density for both payoffs issymmetric, thus eliminating any bias due to the participant’s starting point in the game.Contrary to the above, animals in the park may be randomly scattered without any par-ticular orientation. So, we randomly generate two additional animal density structures(payoffs 3 and 4) and test our proposed model on these payoffs. To generate a randomstructure, one out of 25 cells was chosen uniformly at random and then an animal wasallocated to it until the total number of animals in all the cells was 96, keeping in mindthat if a cell total reached 10 (maximum animal density in a cell), that cell was notchosen again. Figs. 4(a), 4(b), 4(c) and 4(d) show heatmaps of these animal densitystructures, denoted as ADS1, ADS2, ADS3 and ADS4 respectively.

Title Suppressed Due to Excessive Length 11
5 Results of Human Subjects Experiments
The methodological contributions discussed in this paper resulted in conducting suc-cessful human subjects experiments with existing adversary behavioral models. Thisalso led to the identification of certain limitations in such models and hence the devel-opment of a novel human behavior model called SHARP for repeated SSG settings.Although the details of this model are discussed in detail in [5], we present here someof the performance results of SHARP against existing models in the human subjectsexperiments we conducted. The performance is measured in terms of the defender utili-ties per round and cumulative defender utilities over rounds. The interesting observationfrom the following results is that SHARP not only performs well in initial rounds of thegame, unlike existing models which incur heavy losses, it also performs consistentlywell in the subsequent rounds.
5.1 Defender Utilities
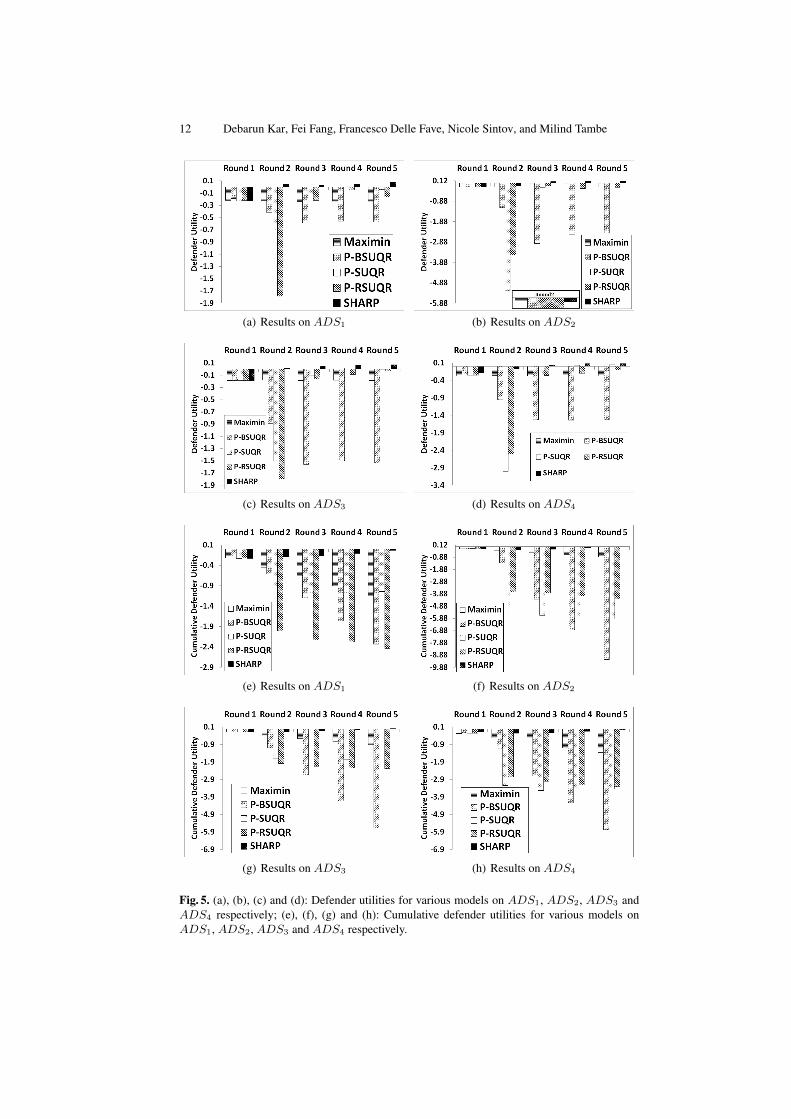
In Figs. 5(a)- 5(d) we show actual defender utilities obtained over 5 rounds for P-SUQR,P-BSUQR, P-RSUQR, SHARP and Maximin on ADS1, ADS2, ADS3 and ADS4
respectively, with an average of 38 human subjects playing per round. In the plots, y-axis corresponds to defender utility and the models tested for each round is shown onthe x-axis. For example, in Fig. 5(b), P-SUQR performs worst in round 2 with an utilityof -5.26. In Fig. 5(b), we also show (inset) zoomed in results of the second round tohighlight the difference in performance between Maximin (= -0.18) and SHARP (= -0.1). First round utilities for all models are same as Maximin strategy was played dueto absence of data. All significance results reported below are computed with bootstrapt-test. Following are key observations from our experiments.Heavy initial round losses: For all models except SHARP, there is statistically sig-nificant (p=0.05) loss in defender utility as compared to Maximin in second round.P-SUQR recovers from initial round losses and outperforms Maximin in rounds 3, 4and 5 for ADS1 (statistically significant at p=0.05), and in round 4 (statistically sig-nificant at p=0.15) and round 5 for ADS2. P-RSUQR, which is a robust model, alsooutperforms Maximin in rounds 4 and 5 (statistically significant at p=0.05) for ADS1
after initial round losses. Surprisingly, P-BSUQR, which is the basis for wildlife secu-rity application PAWS, performs worst on both payoffs over all rounds. Figs. 5(e)- 5(h)show cumulative defender utility over five rounds on ADS1, ADS2, ADS3 and ADS4
respectively. Observe that it takes five rounds for P-SUQR to recover from initial roundlosses and outperform Maximin in terms of cumulative defender utility for ADS1 (Fig.5(e)). None of the other models recover from the initial round losses on either payoffsin five rounds, thus highlighting the impact initial round losses have on model perfor-mance for a long period of time.Performance of SHARP against other models: SHARP consistently outperforms(statistically significant at p=0.05) all the models over all rounds (Figs. 5(a)- 5(d)),most notably in initial rounds (round 2) and ends up with significantly high cumulativeutility at the end of all rounds (Figs. 5(e)- 5(h)).
Therefore, our results on extensive human subjects experiments on repeated SSGsshow SHARP’s ability to perform well throughout, including the important initial rounds.
12 Debarun Kar, Fei Fang, Francesco Delle Fave, Nicole Sintov, and Milind Tambe
(a) Results on ADS1 (b) Results on ADS2
(c) Results on ADS3 (d) Results on ADS4
(e) Results on ADS1 (f) Results on ADS2
(g) Results on ADS3 (h) Results on ADS4
Fig. 5. (a), (b), (c) and (d): Defender utilities for various models on ADS1, ADS2, ADS3 andADS4 respectively; (e), (f), (g) and (h): Cumulative defender utilities for various models onADS1, ADS2, ADS3 and ADS4 respectively.

Title Suppressed Due to Excessive Length 13
6 Conclusions
In this paper, we discussed about an online simulation game that we developed for con-ducting longitudinal human subjects experiments to test the performances of variousbehavioral models in repeated SSGs. We deployed this game on AMT and faced sev-eral challenges while conducting these experiments, each of which lasted several weeks.Therefore, we present our methodological contributions towards conducting these lon-gitudinal experiments successfully on AMT and experimental results of the effective-ness of our approaches. Specifically, our contributions include: (i) developing an em-pirically supported payment scheme to reduce the attrition rate of participants for ourrepeated task; (ii) sending carefully worded reminders periodically to maximize partic-ipation in all measurement occasions; and (iii) generate a set of representative payoffstructures to test our behavioral models. These contributions allowed us to successfullytest a suite of existing behavioral models and identify their strengths and weaknessesin repeated SSGs and finally develop and test a novel human behavior model calledSHARP which outperforms existing approaches [5].
7 Acknowledgements
This work was supported by MURI Grant W911NF-11-1-03.
References
1. Cotter, R.B., Burke, J.D., Stouthamer-Loeber, M., Loeber, R.: Contacting participants forfollow-up: how much effort is required to retain participants in longitudinal studies? Evalu-ation and Program Planning 28(1), 15–21 (2005)
2. Estrada, M., Woodcock, A., Schultz, P.W.: Tailored panel management: A theory-based ap-proach to building and maintaining participant commitment to a longitudinal study. In: Eval-uation Review (2014)
3. Hamisi, M.: Identification and mapping risk areas for zebra poaching: A case of TarangireNational Park, Tanzania. Thesis, ITC (2008)
4. Haskell, W., Kar, D., Fang, F., Tambe, M., Cheung, S., Denicola, E.: Robust protection offisheries with compass. In: Innovative Applications of Artificial Intelligence (IAAI) (2014)
5. Kar, D., Fang, F., Fave, F.D., Sintov, N., Tambe, M.: “A Game of Thrones”: When human be-havior models compete in repeated stackelberg security games. In: International Conferenceon Autonomous Agents and Multiagent Systems (AAMAS 2015) (2015)
6. Lemieux, A.M.: Situational Crime Prevention of Poaching (Crime Science Series). Rout-ledge (2014)
7. Mao, A., Parkes, D., Chen, Y., Procaccia, A.D., Gajos, K.Z., Zhang, H.: Turkserver: Enablingsynchronous and longitudinal online experiments. In AAAI HCOMP Workshop (2012)
8. Menard, S.W.: Handbook of longitudinal research: Design, measurement, and analysis. Aca-demic Press (2008)
9. Montesh, M.: Rhino poaching: A new form of organised crime. Tech. rep., College of LawResearch and Innovation Committee of the University of South Africa (2013)
10. Moreto, W.: To Conserve and Protect: Examining Law Enforcement Ranger Culture andOperations in Queen Elizabeth National Park, Uganda. Thesis, Rutgers (2013)

14 Debarun Kar, Fei Fang, Francesco Delle Fave, Nicole Sintov, and Milind Tambe
11. Nguyen, T.H., Yang, R., Azaria, A., Kraus, S., Tambe, M.: Analyzing the effectiveness ofadversary modeling in security games. In AAAI (2013)
12. Paolacci, G., Chandler, J., Ipeirotis, P.G.: Running experiments on amazon mechanical turk.Judgment and Decision Making pp. 411–419 (2010)
13. Tambe, M.: Security and Game Theory: Algorithms, Deployed Systems, Lessons Learned.Cambridge University Press, New York, NY (2011)
14. Yang, R., Ford, B., Tambe, M., Lemieux, A.: Adaptive resource allocation for wildlife pro-tection against illegal poachers. In: International Conference on Autonomous Agents andMultiagent Systems (AAMAS) (2014)
15. Yang, R., Kiekintveld, C., Ordonez, F., Tambe, M., John, R.: Improving resource allocationstrategy against human adversaries in security games. In IJCAI (2011)