conducting a binomial sign test with excel, by hand, or...
TRANSCRIPT
Binomial-Sign_Excel.docx
Conducting a Binomial Sign Test with Excel, by Hand, or SPSS
The data are in a plain text file. On each row, the first score is the pretest score and the second score is the posttest score. The delimiter is a blank space.
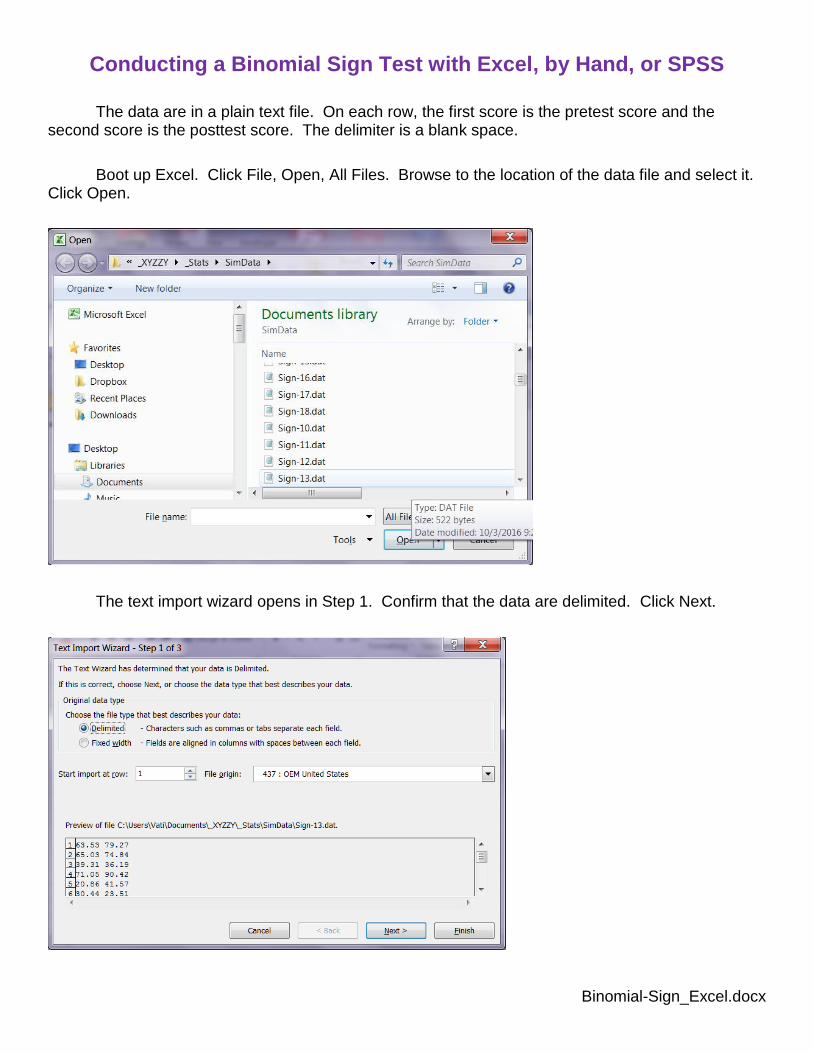
Boot up Excel. Click File, Open, All Files. Browse to the location of the data file and select it. Click Open.
The text import wizard opens in Step 1. Confirm that the data are delimited. Click Next.
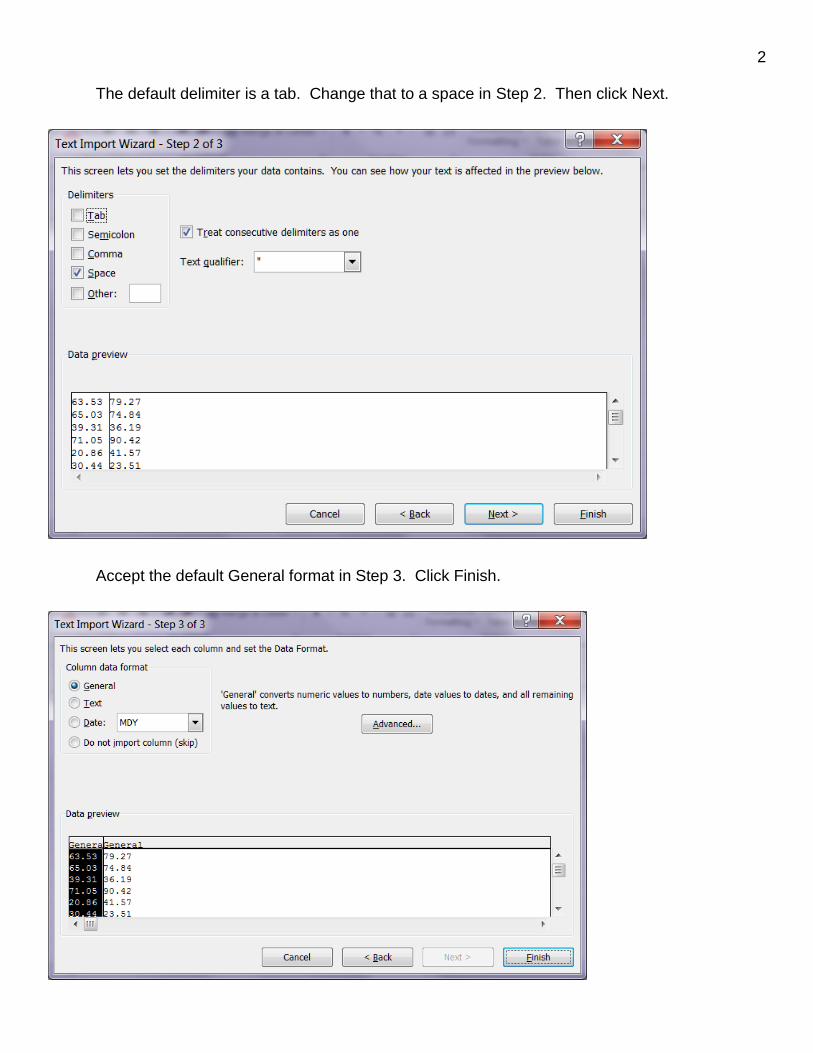
2 The default delimiter is a tab. Change that to a space in Step 2. Then click Next.
Accept the default General format in Step 3. Click Finish.

3 The data then appear in the spreadsheet.
Save the spreadsheet as an Excel xlsx file.
Place the cursor in the cell just below the last datum in the first column. Type in =AVERAGE(A1:A40). Hit Enter. The mean of those 40 scores will appear in that cell. Do the same for the second column, =AVERAGE(B1:B40)
In the next row, find the two medians: =MEDIAN(A1:A40) and =MEDIAN(B1:B40). Then get the standard deviations: =STDEV(A1:A40) and =STDEV(B1:B40).
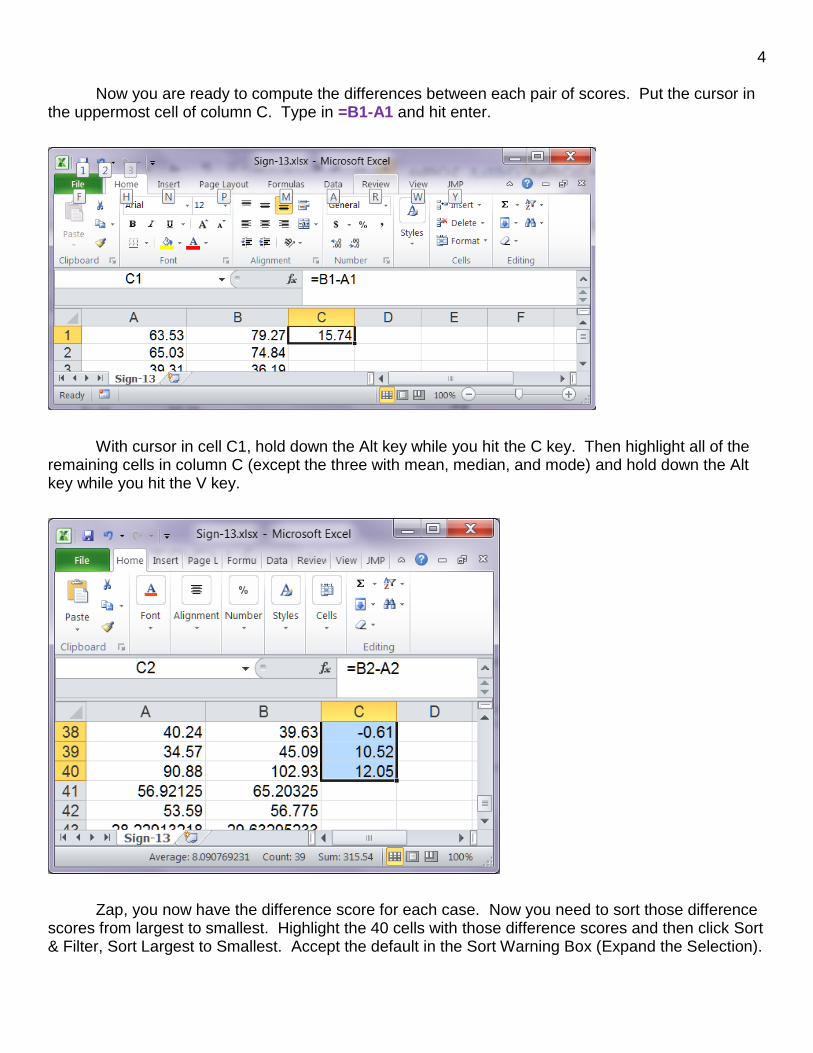
4 Now you are ready to compute the differences between each pair of scores. Put the cursor in the uppermost cell of column C. Type in =B1-A1 and hit enter.
With cursor in cell C1, hold down the Alt key while you hit the C key. Then highlight all of the remaining cells in column C (except the three with mean, median, and mode) and hold down the Alt key while you hit the V key.
Zap, you now have the difference score for each case. Now you need to sort those difference scores from largest to smallest. Highlight the 40 cells with those difference scores and then click Sort & Filter, Sort Largest to Smallest. Accept the default in the Sort Warning Box (Expand the Selection).
5
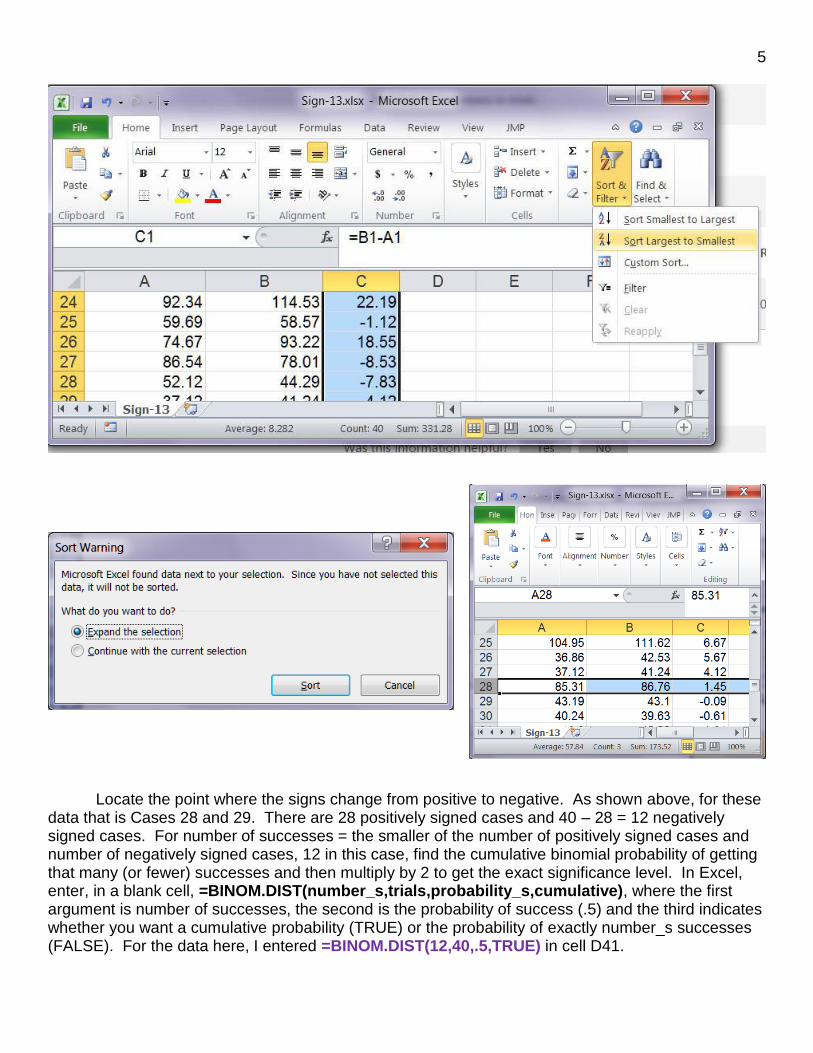
Locate the point where the signs change from positive to negative. As shown above, for these data that is Cases 28 and 29. There are 28 positively signed cases and 40 – 28 = 12 negatively signed cases. For number of successes = the smaller of the number of positively signed cases and number of negatively signed cases, 12 in this case, find the cumulative binomial probability of getting that many (or fewer) successes and then multiply by 2 to get the exact significance level. In Excel, enter, in a blank cell, =BINOM.DIST(number_s,trials,probability_s,cumulative), where the first argument is number of successes, the second is the probability of success (.5) and the third indicates whether you want a cumulative probability (TRUE) or the probability of exactly number_s successes (FALSE). For the data here, I entered =BINOM.DIST(12,40,.5,TRUE) in cell D41.

6
The two-tailed significance level is 2(.00829) = .017.
Doing it By Hand
Help, I am stranded on a desert island with data and a compulsion to do a sign test, but no computer. I do have paper and pencil and my stats book with a probability table for the standard normal distribution.
The first step is to calculate, for each pair of scores, whether A > B or B > A. While it would be tedious doing this by hand, it would not be difficult. For these data there are 28 cases with B > A and 12 with A > B. Use the normal approximation to determine the probability of getting as many as 28 in the one direction or 12 in the other direction.
20)5(.40 np 162.3)5(.20 npq 37.2162.3
205.27
z
From the normal curve table, the probability of getting a |z| as high as 2.37 is 2(.0089) = .018.
Doing it with Online Calculators or with SPSS
Help. I am on that island, but I do have Internet access via my laptop, but I never got around to installing SAS. What can I do?
You could use the Virtual Computer Lab. You could download and install the University Edition of SAS. You could download and install SPSS. You could use an online sign test calculator. You could, after getting the number of positive and negative signs, use an online calculator to get the significance level (just Google “binomial calculator”). Here I shall illustrate using SPSS.
Bring the data into SPSS.

7
Click Analyze, Nonparametric Tests, Legacy Dialogues, Two Related Samples. Scoot the two variables into the Test Pairs box. Select Sign as the Test Type. Click Exact and Select Exact. Continue, OK.
Frequencies
N
Pretest - Posttest Negative Differencesa 28
Positive Differencesb 12
Tiesc 0
Total 40
a. Pretest < Posttest
b. Pretest > Posttest
c. Pretest = Posttest

8
Test Statisticsa
Pretest -
Posttest
Z -2.372
Asymp. Sig. (2-tailed) .018
Exact Sig. (2-tailed) .017
Easy, eh?
Karl L. Wuensch, October, 2016.