conducted by vanson bourne research - dell emc · pdf filedelay in product/ service ... the...
TRANSCRIPT

1 © Copyright 2013 EMC Corporation. All rights reserved.
Conducted by Vanson Bourne Research
N o v e m b e r 2 0 1 3
2 © Copyright 2013 EMC Corporation. All rights reserved.
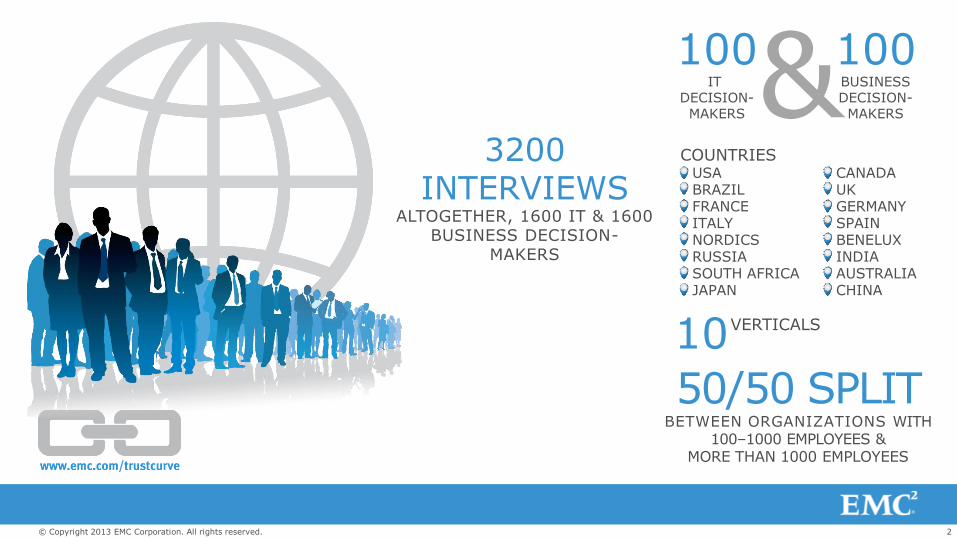
3200
INTERVIEWS ALTOGETHER, 1600 IT & 1600
BUSINESS DECISION-MAKERS
50/50 SPLIT BETWEEN ORGANIZATIONS WITH
100–1000 EMPLOYEES & MORE THAN 1000 EMPLOYEES
10 VERTICALS
COUNTRIES USA CANADA BRAZIL UK FRANCE GERMANY ITALY SPAIN NORDICS BENELUX RUSSIA INDIA SOUTH AFRICA AUSTRALIA JAPAN CHINA
100 IT
DECISION- MAKERS & 100
BUSINESS DECISION- MAKERS
3 © Copyright 2013 EMC Corporation. All rights reserved.
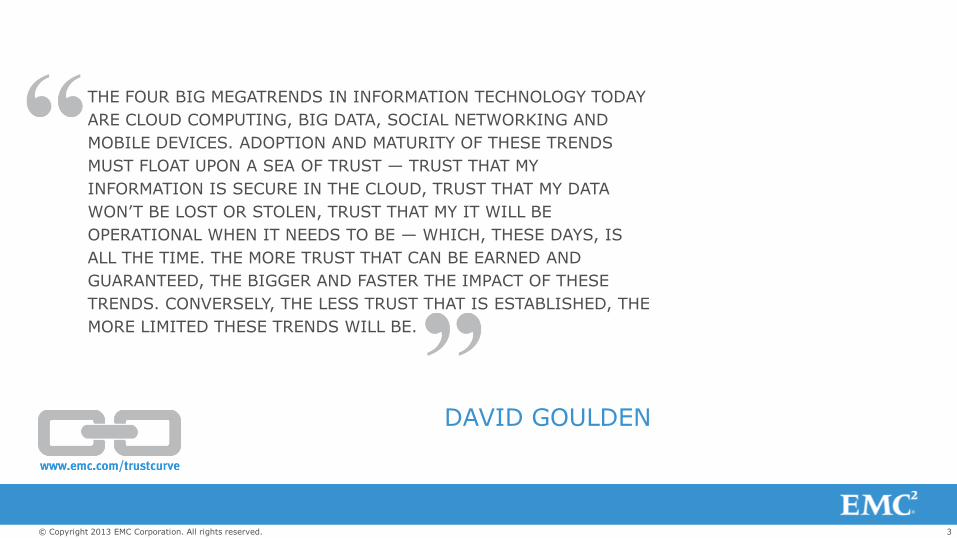
THE FOUR BIG MEGATRENDS IN INFORMATION TECHNOLOGY TODAY
ARE CLOUD COMPUTING, BIG DATA, SOCIAL NETWORKING AND
MOBILE DEVICES. ADOPTION AND MATURITY OF THESE TRENDS
MUST FLOAT UPON A SEA OF TRUST — TRUST THAT MY
INFORMATION IS SECURE IN THE CLOUD, TRUST THAT MY DATA
WON’T BE LOST OR STOLEN, TRUST THAT MY IT WILL BE
OPERATIONAL WHEN IT NEEDS TO BE — WHICH, THESE DAYS, IS
ALL THE TIME. THE MORE TRUST THAT CAN BE EARNED AND
GUARANTEED, THE BIGGER AND FASTER THE IMPACT OF THESE
TRENDS. CONVERSELY, THE LESS TRUST THAT IS ESTABLISHED, THE
MORE LIMITED THESE TRENDS WILL BE.
DAVID GOULDEN

4 © Copyright 2013 EMC Corporation. All rights reserved.
OVERALL MATURITY
LAGGARDS EVALUATORS ADOPTERS LEADERS
0
10
20
30
40
50
60
70
0 25 50 75 100
NU
MBER O
F R
ESPO
ND
EN
TS
MATURITY SCORE (OUT OF 100)
17% 8% 40% 36%
OVERALL MATURITY DISTRIBUTION

5 © Copyright 2013 EMC Corporation. All rights reserved.
MATURITY PILLARS
LAGGARDS EVALUATORS ADOPTERS LEADERS
0
10
20
30
40
50
60
70
0 25 50 75 100
NU
MBER O
F R
ESPO
ND
EN
TS
MATURITY SCORE (OUT OF 100)
17% 8% 40% 36%
OVERALL MATURITY DISTRIBUTION

6 © Copyright 2013 EMC Corporation. All rights reserved.
SCORING METHODOLOGY The study focuses on attributes of IT
– information availability, backup, &
security – that contribute most to
the ability to withstand & quickly
recover from disruptive IT incidents.
Those organizations with more
progressive strategies & those
using more advanced technology
achieved higher ratings.
1,600 IT responses were used to
rank their organizations’ maturity
levels, ranging from lowest to
highest – Laggard, Evaluator,
Adopter, & Leader.

7 © Copyright 2013 EMC Corporation. All rights reserved.
MATURITY SCORE BY COUNTRY
65.2
61.8
60.9
53.8
52.8
51.6
51.4
49.7
49.5
49.5
49.4
49.1
48.7
48.4
43.0
38.8
China
USA
South Africa
Brazil
Australia
Spain
France
UK
Canada
Benelux
India
Italy
Russia
Germany
Nordics
Japan
(OUT OF 100)
CHINA IS THE MOST MATURE COUNTRY—JUST AHEAD OF AHEAD OF THE USA
3 OF THE 4 MOST MATURE COUNTRIES ARE
B R I C S
JAPAN L A G S A S T H E L E A S T MATURE
8 © Copyright 2013 EMC Corporation. All rights reserved.
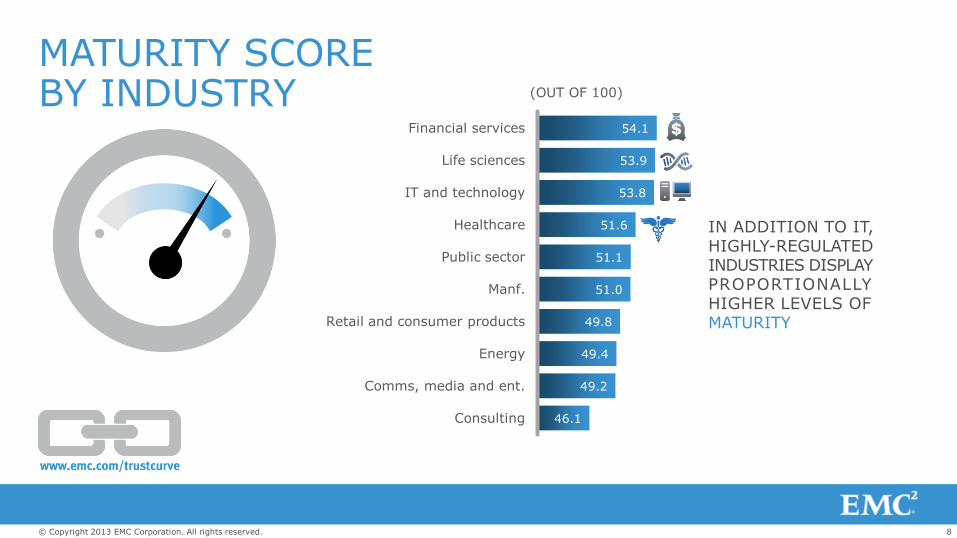
MATURITY SCORE BY INDUSTRY
54.1
53.9
53.8
51.6
51.1
51.0
49.8
49.4
49.2
46.1
Financial services
Life sciences
IT and technology
Healthcare
Public sector
Manf.
Retail and consumer products
Energy
Comms, media and ent.
Consulting
(OUT OF 100)
IN ADDITION TO IT, HIGHLY-REGULATED INDUSTRIES DISPLAY PROPORTIONALLY HIGHER LEVELS OF MATURITY

9 © Copyright 2013 EMC Corporation. All rights reserved.
THE CRISIS Widespread unplanned downtime, security breaches, & data loss
of respondents’ companies have
suffered at least one of the
following: unplanned downtime
(37%), security breach (23%) or
data loss (29%) in the last 12
months.
61% Nearly half—
45% —of respondents report that their senior
executives are not confident that their
organization has adequate data
protection, security, & IT availability.

10 © Copyright 2013 EMC Corporation. All rights reserved.
81%
65%
51%
39%
Leaders
Adopters
Evaluators
Laggards
SENIOR EXECUTIVES’ CONFIDENCE IN THEIR ORGANIZATION’S IT MATURITY
On average, only 55% of respondents report their senior executives have any confidence in their data protection, security, & availability. This rises significantly with each level of maturity. Conversely, 45% cited no confidence.
Do you think your senior executives are confident they currently have adequate data protection, security, & availability?
Only showing percentage for “yes, they already are”, by overall maturity (Asked to all 3200 respondents)

11 © Copyright 2013 EMC Corporation. All rights reserved.
SENIOR EXECUTIVES’ CONFIDENCE IN THEIR ORGANIZATION’S IT MATURITY (COUNTRY)
Japan—the least mature country—has the smallest percentage of respondents reporting that their senior teams have trust in IT. Interestingly, the BRICS countries are scattered throughout the centre—neither leading or lagging in this regard.
66%
64%
64%
63%
62%
61%
59%
58%
56%
55%
54%
50%
49%
49%
46%
31%
Germany
France
Benelux
Spain
India
USA
Australia
Canada
China
South Africa
UK
Brazil
Italy
Russia
Nordics
Japan
Do you think your senior executives are confident they currently have adequate data protection, security, & availability?
Only showing percentage for “yes, they already are”, by country (Asked to all 3200 respondents)
12 © Copyright 2013 EMC Corporation. All rights reserved.
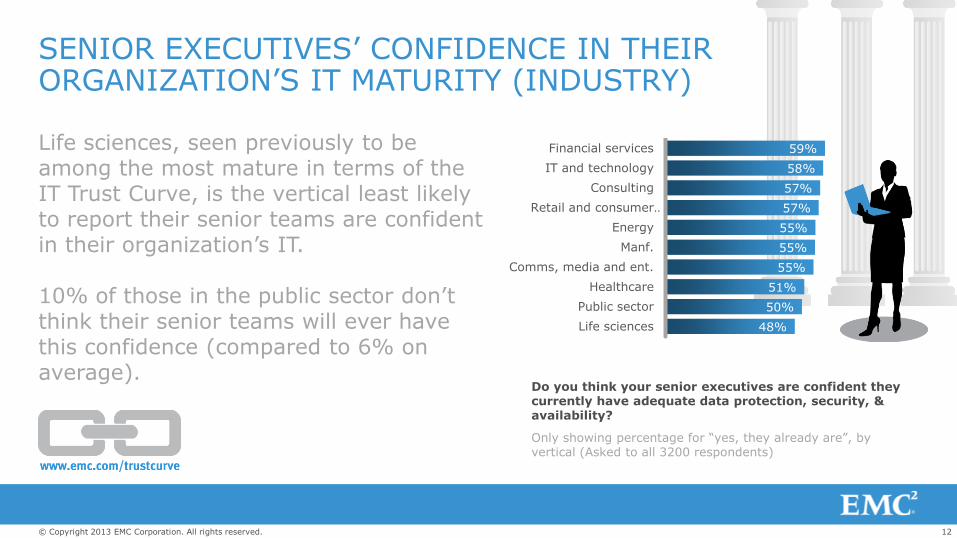
SENIOR EXECUTIVES’ CONFIDENCE IN THEIR ORGANIZATION’S IT MATURITY (INDUSTRY)
Life sciences, seen previously to be among the most mature in terms of the IT Trust Curve, is the vertical least likely to report their senior teams are confident in their organization’s IT. 10% of those in the public sector don’t think their senior teams will ever have this confidence (compared to 6% on average).
59%
58%
57%
57%
55%
55%
55%
51%
50%
48%
Financial services
IT and technology
Consulting
Retail and consumer …
Energy
Manf.
Comms, media and ent.
Healthcare
Public sector
Life sciences
Do you think your senior executives are confident they currently have adequate data protection, security, & availability?
Only showing percentage for “yes, they already are”, by vertical (Asked to all 3200 respondents)

13 © Copyright 2013 EMC Corporation. All rights reserved.
CONSEQUENCES OF INCIDENTS IN THE LAST 12 MONTHS (COUNTRY) Of the 61% of organizations who have experienced either unplanned downtime, a security breach or data loss at least once in the last 12 months, the top 3 consequences are a loss of employee productivity (45%), loss of revenue (39%), and loss of customer confidence/loyalty (32%).
Top consequence in each country:
• Loss of employee productivity: USA (58%), Canada (58%), Brazil (46%), UK (61%), France (36%), Nordics (48%), Russia (48%), Benelux (34%), South Africa (59%), Australia (47%)
• Loss of revenue: China (59%), Spain (46%), Italy (40%), Germany (40%), Russia (48%), Benelux (34%)
• Loss of an incremental business opportunity: Japan (38%)
• Loss of business to a competitor: India (47%)
45%
39%
32%
27%
27%
26%
26%
26%
23%
20%
16%
10%
1%
4%
Loss of employee productivity
Loss of revenue
Loss of customer confidence/loyalty
Loss of an incremental business …
Loss of business to a competitor
Delay in product/ service …
Loss of a new business opportunity
Loss of customers
Damage to company brand and …
Loss of repeat business
Delay in getting products/ …
Damage to company stock price …
Other
None of these
What were the consequences of the incident(s) your organization experienced in the last 12 months?
(Asked to those who have experienced downtime, security breach(es) and/or data loss in the last 12 months 1956/3200)

14 © Copyright 2013 EMC Corporation. All rights reserved.
MATURITY MATTERS.
THE IMPACT 53% of organizations in the highest maturity
segment reported data recovery time
measured in minutes or less for their most mission-
critical applications compared with only
27% across all respondents who reported
data recovery in minutes or less The more advanced the organization’s maturity, the less they suffer when it comes to data loss, downtime, & security breaches.
of companies in the highest maturity
segment believe they are able to recover
100% of their lost data in every instance versus only
in the lowest maturity segment
76%
44% Organizations in the lowest maturity segment
(Laggards) lost one and a half times more
money over the last 12 months as a result of
downtime than those in the highest maturity
segment (Leader). Average annual financial loss
from downtime across all respondents is
$494,037.
65%

15 © Copyright 2013 EMC Corporation. All rights reserved.
“If you had adequate controls to protect data and breaches were stopped before impact, how would your organization benefit?” (Asked to respondents who have experienced a security breach/breaches in the last 12 months 734/3200)
THE UPSIDE
42%
43%
45%
48%
49%
Reduced cost of application
deployment / time to market
More time for innovation &
analysis
Lower cost of investigation &
response
Lower barrier to information
sharing
Expedited audits & lower
compliance reporting cost

16 © Copyright 2013 EMC Corporation. All rights reserved.
FACTORS THAT LIMIT TECHNOLOGICAL PROGRESS
92% of all respondents experience inhibitors to their technology project success.
China is the only country where budget is not the main inhibitor. Instead resources and/or workload constraints tops the list here (50%), followed by planning and anticipation (46%), knowledge and skills (44%) and then budget (41%).
A lack of confidence in technology impacts one in five, & a lack of executive/management support inhibits one in seven.
8%
14%
19%
25%
32%
33%
35%
52%
We have no limits to our technology
project success
Lack of executive/management
support
Lack of trust in technology/IT
Culture (flexibility, acceptance)
Knowledge & skills
Planning and anticipation
Resources and/or workload
constraints
Budget
What most limits your organization's technology project success in relation to data protection, security, & availability?
(Asked to all 3200 respondents)

17 © Copyright 2013 EMC Corporation. All rights reserved.
DIFFERING VIEWS
Where is the motivation/drive for future plans/projects to deliver resilient & secure IT infrastructure coming from?
Percentage that selected “internal: IT department”, by respondent type (Asked to all 3200 respondents
70%
50%
ITDMs
BDMs
Just 50% of BDMs (business decision makers) consider the IT department to be a driver of a resilient & secure infrastructure—compared to 70% of ITDMs (IT decision makers) themselves.
18 © Copyright 2013 EMC Corporation. All rights reserved.
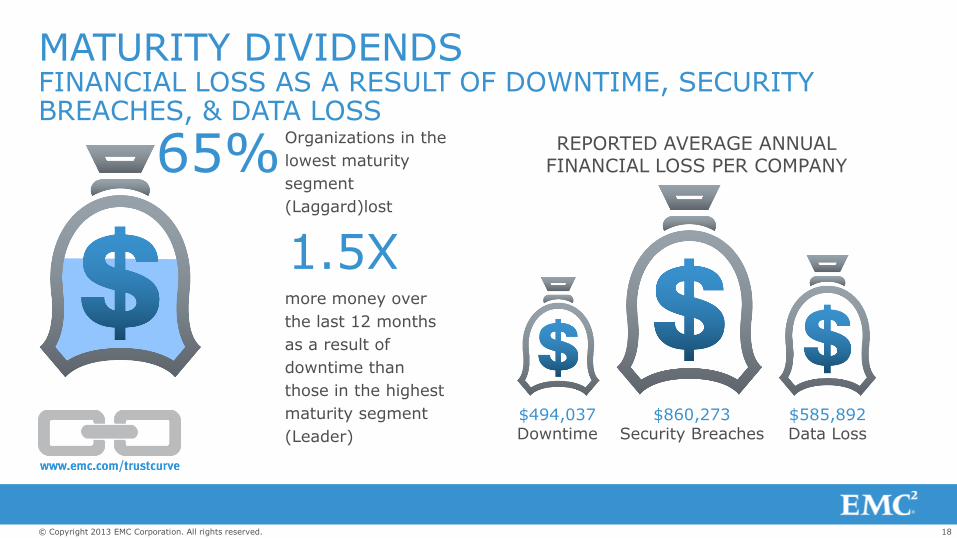
MATURITY DIVIDENDS FINANCIAL LOSS AS A RESULT OF DOWNTIME, SECURITY BREACHES, & DATA LOSS
$585,892 Data Loss
Organizations in the
lowest maturity
segment
(Laggard)lost
more money over
the last 12 months
as a result of
downtime than
those in the highest
maturity segment
(Leader)
1.5X
REPORTED AVERAGE ANNUAL FINANCIAL LOSS PER COMPANY
$860,273 Security Breaches
$494,037 Downtime
65%

19 © Copyright 2013 EMC Corporation. All rights reserved.
MATURITY DIVIDENDS ONLY AROUND A QUARTER OF SURVEYED ORGANIZATIONS CAN RECOVERY DATA IN MINUTES OR LESS
During an unexpected event causing downtime to our most critical applications.
(Asked to all 1600 respondents)
66% OUR RECOVERY TIME IS MEASURED IN HOURS
The most common response given overall is a recovery time of hours.
25% OUR RECOVERY TIME IS MEASURED IN MINUTES
A quarter of organizations have a recovery time of minutes for mission-critical applications. Therefore, 27% of organizations surveyed have a recovery time of minutes or less for their mission-critical applications.
2% OUR RECOVERY TIME IS ZERO
Only 2% of surveyed organizations report a recovery time of zero for their most critical applications.
3% OUR RECOVERY TIME IS 1 DAY OR MORE
Though a small minority report a recovery time of a day or more.
*
*Don’t know

20 © Copyright 2013 EMC Corporation. All rights reserved.
MATURITY DIVIDENDS BIG DATA ANALYTICS IS MORE LIKELY TO BE DEPLOYED BY THOSE WITH A HIGHER LEVEL OF TRUST MATURITY
74% of the leaders have already deployed Big Data analytics compared to just 8% of the laggards. However, less mature organizations are more likely to be in the planning stages.
8%
23%
42%
74%
74%
63%
50%
25%
18%
14%
8%
1%
Laggards
Evaluators
Adopters
Leaders
No plans
Deployment underway or in planning stages
Already deployed
Which of these strategic projects, requiring availability, data protection, & security do you have?
Looking at Big Data analytics only, by overall maturity (Asked to all 1600 IT respondents)


22 © Copyright 2013 EMC Corporation. All rights reserved.
Questions used to score Continuous Availability (i) IT only
Within each pillar section, respondents were asked questions that determine their technological maturity, the three used in Continuous Availability were (max score = 18):
Select which of the following best characterizes your current IT infrastructure:
Backup is the main component of our availability strategy – (2pt.)
Backup and replication are key components of our availability strategy – (2pt.)
Replication and standby servers are key components of our availability strategy – (3pts.)
Replication of virtual servers with restart capabilities are key components of our availability strategy - (4pts.)
Active-active instances of applications across data centers is key component of our availability strategy – (6pts.)
During an unexpected event causing downtime to our most critical applications:
Our recovery time is 1 day or more (please specify) – (2pt.)
Our recovery time is measured in hours – (3pts.)
Our recovery time is measured in minutes – (4pts.)
Our recovery time is zero – (6pts.)
Don’t know – no score
23 © Copyright 2013 EMC Corporation. All rights reserved.
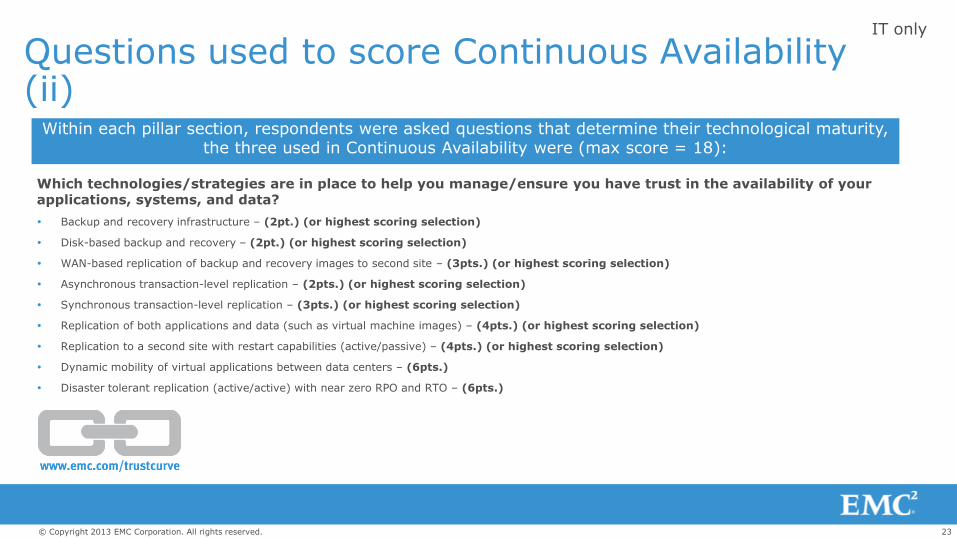
Questions used to score Continuous Availability (ii)
IT only
Within each pillar section, respondents were asked questions that determine their technological maturity, the three used in Continuous Availability were (max score = 18):
Which technologies/strategies are in place to help you manage/ensure you have trust in the availability of your applications, systems, and data?
Backup and recovery infrastructure – (2pt.) (or highest scoring selection)
Disk-based backup and recovery – (2pt.) (or highest scoring selection)
WAN-based replication of backup and recovery images to second site – (3pts.) (or highest scoring selection)
Asynchronous transaction-level replication – (2pts.) (or highest scoring selection)
Synchronous transaction-level replication – (3pts.) (or highest scoring selection)
Replication of both applications and data (such as virtual machine images) – (4pts.) (or highest scoring selection)
Replication to a second site with restart capabilities (active/passive) – (4pts.) (or highest scoring selection)
Dynamic mobility of virtual applications between data centers – (6pts.)
Disaster tolerant replication (active/active) with near zero RPO and RTO – (6pts.)

24 © Copyright 2013 EMC Corporation. All rights reserved.
Question used to score Advanced security IT only
Within each pillar section, respondents were asked questions that determine their technological maturity, the one used in Advanced Security was (max score = 18):
Which technologies/strategies do you have in place to help you trust your infrastructure and data is secure?
Strong authentication - 1pt.
Video surveillance – 0pts.
Governance, risk & compliance software – 2pt.
Anti-virus/anti-malware - 2pts.
Network firewalls/application firewalls/intrusion detection - 1pt.
Log/security monitoring - 1pt.
Identity & access management -1pt.
Encryption/tokenization - 1pt.
Digital forensics – 3pt.
Predictive analytics – 3pt.
Security operations center - 3pts.

25 © Copyright 2013 EMC Corporation. All rights reserved.
Questions used to score Integrated Backup and Recovery (i)
IT only
Within each pillar section, respondents were asked questions that determine their technological maturity, the two used in Integrated Backup and Recovery were (max score = 18):
Select which of the following best characterizes your current IT infrastructure’s information protection capabilities to prevent/minimize data loss due to site disasters or technical failures:
Backup is performed departmentally, as opposed to a centralized service, with independent backup tools requiring application downtime - (2pt.)
Multiple, separate application-specific backup tools are deployed across the organization regularly requiring application downtime during the backup process – (3pt.)
Backup is coordinated with storage features to minimize application downtime for the backup process and disk-based backup has been deployed – (5pts.)
Centralized disk-based backup systems exploit de-duplication efficiencies while providing comprehensive reporting of backup actives and protection status – (7pts.)
Comprehensive backup solutions include replication of backup images to secondary sites, enable archival storage, and ensure we meet our data retention and retrieval goals – (9pts.)

26 © Copyright 2013 EMC Corporation. All rights reserved.
Questions used to score Integrated Backup and Recovery (ii)
IT only
Within each pillar section, respondents were asked questions that determine their technological maturity, the two used in Integrated Backup and Recovery were (max score = 18):
Which technologies/strategies are you currently using to prevent data loss?
Tape-based backup and archive – (2pt.) (or highest scoring selection)
Disk-based backup and archive – (3pt.) (or highest scoring selection)
WAN-based replication of backups – (4pts.) (or highest scoring selection)
Software to assist in eDiscovery projects – (5pts.) (or highest scoring selection)
De-duplication of backup and archive data – (6pts.) (or highest scoring selection)
Consolidated backup and archive infrastructure – (7pts.) (or highest scoring selection)
Integrated backup and archive to meet data retention requirements – (9pts.) (or highest scoring selection)
