conditions influencing the career accomplishments · pdf filegre board research report greb...
TRANSCRIPT
CONDITIONS INFLUENCING THE
CAREER ACCOMPLISHMENTS OF Ph.D.s
Mary Jo Clark and
John A. Centra
GRE Board Research Report GREB No. 76-2R ETS Research Report 82-18
July I.982
This report presents the findings of a research project funded by and carried out under the auspices of the Graduate Record Examinations Board.

GRE BOARD RESEARCH REPORTS FOR GENERAL AUDIENCE
Altman, R. A. and Wallmark, M. M. A Summary of Data from the Graduate Programs and Admissions Manual. GREB No. 74-lR, January 1975.
Baird, L. L. An Inventory of Documented Accomplishments. GREB No. 77-3R, June 1979.
Baird, L. L. Cooperative Student Survey (The Graduates [$2.50 each], and Careers and Curricula). GREB No. 70_4R, March 1973.
Baird, L. L. The Relationship Between Ratings of Graduate Departments and Faculty Publication Rates. GREB No. 77-2aR, November 1980.
Baird, L. L. and Knapp, J. E. The Inventory of Documented Accomplishments for Graduate Admissions: Results of a Field Trial Study of Its Reliability, Short-Term Correlates, and Evaluation. GREB No. 78-3R, August 1981.
Burns, R. L. Graduate Admissions and Fellowship Selection Policies and Procedures (Part I and II). GREB No. 69-SR, July 1970.
Centra, J. A. How Universities Evaluate Faculty Performance: A Survey of Department Heads. GREB No. 75-SbR, July 1977. ($1.50 each)
Centra, J. A. Women, Men and the Doctorate. GREB No. 71-lOR, September 1974. ($3.50 each)
Clark, M. J. The Assessment of Quality in Ph.D. Programs: A Preliminary Report on Judgments by Graduate Deans. GREB No. 72-7aR, October 1974.
Clark, M. J. Program Review Practices of University Departments. GREB No. 75-SaR, July 1977. ($1.00 each)
DeVore, R. and McPeek, M. A Study of the Content of Three GRE Advanced Tests. GREB No. 78-4R, March 1982.
Donlon, T. F. Annotated Bibliography of Test Speededness. GREB No. 76-9R, June 1979.
Flaugher, R. L. The New Definitions of Test Fairness In Selection: Developments and Implications. GREB No. 72-4R, May 1974.
Fortna, R. 0. Annotated Bibliography of the Graduate Record Examinations. July 1979.
Frederiksen, N. and Ward, W. C. Measures for the Study of Creativity in Scientific Problem-Solving. May 1978.
Hartnett, R. T. Sex Differences in the Environments of Graduate Students and Faculty. GREB No. 77-2bR, March 1981.
Hartnett, R. T. The Information Needs of Prospective Graduate Students. GREB NO. 77-8R, October 1979.
Hartnett, R. T. and Willingham, We W. The Criterion Problem: What Measure of Success in Graduate Education? GREB No. 77-4R, March 1979.
Knapp, J. and Hamilton, I. B. The Effect of Nonstandard Undergraduate Assessment and Reporting Practices on the Graduate School Admissions Process. GREB No. 76-14R, July 1978.
Lannholm, G. V. and Parry, M. E. Programs for Disadvantaged Students in Graduate Schools. GREB No. 69-lR, January 1970.
Miller, R. and Wild, C. L. Restructuring the Graduate Record Examinations Aptitude Test. GRE Board Technical Report, June 1979.
Reiily, R. R. Critical Incidents of Graduate Student Performance. GREB No. 7+5R, June 1974.
Rock, D., Werts, C. An Analysis of Time Related Score Increments and/or Decre- ments for GRE Repeaters across Ability and Sex Groups. GREB No. 77-913, April 1979.
Rock, D. A. The Prediction of Doctorate Attainment in Psychology, Mathematics and Chemistry. GREB No. 69-6aR, June 1974.
Schrader, W. B. GRE Scores as Predictors of Career Achievement in History. GREB No. 76-lbR, November 1980.
Schrader, W. B. Admissions Test Scores as Predictors of Career Achievement in Psychology. GREB No. 76-laR, September 1978.
Swinton, S. S. and Powers, D. E. A Study of the Effects of Special Preparation on GRE Analytical Scores and Item Types. GREB No. 78-2R, January 1982.
Wild, C. L. Summary of Research on Restructuring the Graduate Record Examinations Aptitude Test. February 1979.
Wild, C. L. and Durso, R. Effect of Increased Test-Taking Time on Test Scores by Ethnic Group, Age, and Sex. GREB No. 76-6R, June 1979.
Wilson, K. M. The GRE Cooperative Validity Studies Project. GREB No. 75-8R, June 1979.
Wiltsey, R. G. Doctoral Use of Foreign Languages: A Survey. GREB No. 70-14R, 1972. (Highlights $1.00, Part I $2.OU, Part II $1.50).
Witkin, H. A.; Moore, C. A.; Oltman, P. K.; Goodenough, D. P.; Friedman, F.; and Owen, D. R. A Longitudinal Study of the Role of Cognitive Styles in Academic Evolution During the College Years. GREB No. 76-lOR, February 1977 ($5.00 each).
Conditions Influencing the Career
Accomplishments of Ph.D.s
Mary Jo Clark
and
John A. Centra
GRE Board Research Report GREB No. 76-2R
July 1982
Copyright@1982 by Educational Testing Service. All rights reserved.

ABSTRACT
This study is a synthesis of two separate but related analyses which explored the influence of academic ability, training, and personal characteristics on postdegree careers and attainments of recent Ph.D.%. Publication rates and income were used as indicators of attainments. The path model designed for the study viewed the employment setting as well as the kind of employment activity as mediating influences on the attainment measures. Academic ability was assessed by the GRE Aptitude and Advanced Tests and, for part of the sample, by graduate and undergraduate grades. Among the other individual characteristics included as predictors in the study were the number of years since receipt of the Ph.D., age, and sex. Finally, the study included estimates of the quality of the graduate program where the Ph.D. was received.
Some fairly consistent findings emerge when viewing the results across all six of the major field/discipline area samples that were analyzed. Although the academic ability construct did not generally affect productivity or income directly, it correlated significantly with the quality of the program that granted the Ph.D. Program quality, in turn, was an important determinant of whether graduates were employed in positions that emphasized research, or teaching and research. Employment in such positions, according to the path analyses, influenced productivity in each of the subsamples. Thus, ability and training appear to influence productivity largely through the employment setting and the primary work activity. The other direct influences on productivity were the number of years since receiving the doctorate, or other time-related variables. The length of time since earning the doctorate also positively influenced income in five out of six of the subsamples. Productivity helped to determine income in the samples of historians, psychologists, and physical scientists, but not in the other three samples. Employment as a college or university faculty member, or as an academic or non- academic researcher, has a negative impact on income in all six subsamples. Those employed as administrators or as clinicians tended to report higher earnings. Academic ability, for the most part, did not affect income.

Conditions Influencing the Career Accomplishments of Ph,D,s
Mary Jo Clark and John A. Centra
The career accomplishments of persons who earn Ph.D. degrees are affected by personal preferences, abilities, training, opportunities, chance, drive, and several other factors. Although it is virtually impossible to measure some of these factors, the relative influence of others can be investigated. Measures of academic ability, such as scores on the Graduate Record Examinations (GRE) and undergraduate achievement, are available and are important because they help determine who will have access to the graduate training that leads to the Ph.D. degree. Although the GRE tests are not designed to predict performance beyond this point, there is a natural interest in the relationship between factors that influence access and the postdegree performance of those who complete advanced training programs. This study investigated this relationship in two samples of recent Ph.D.%.
Past studies and reviews have shown that scores on the Graduate Record Examinations are generally useful predictors of performance in graduate school (Lannholm, Marco, & Schrader, 1968; Willingham, 1974). But evidence of a relationship between predictors, such as GRE scores and undergraduate grades, and postdoctoral indicators of performance, such as publication rates or income, is sparse. A National Research Council report, for example, compared scores and publications of a group of applicants for NSF predoctoral fellow- ships (Creager & Harmon, 1966). Although the sample included both awardees and nonawardees and followed up both those who did and those who did not receive the Ph.D., it is unlikely to have included the full range of GRE scores since these were predoctoral fellowship applicants. Even so, the Advanced Test scores correlated modestly (median of .28) with citation counts 8 to 12 years after application was made. A citation count presumably reflects the quality of scientific publications since it indicates the frequency with which a scholar is cited by others. The GRE verbal and quantitative ability scores did not correlate as highly with citations. Correla- tions were slightly higher in academic than in nonacademic settings. Correlations of test scores with income were lower than those found for citation counts (median of .ll with a GRE Advanced Test).
The Commission on Human Resources' study of 6,300 recipients of a doctoral degree in science also included data on the relation- ship between publications and measured ability (Folger, Astin, & Bayer, 1970). The ability scores,. however, were based on tests given during high school. Citation counts five to seven years after receipt of the doctorate were the criterion measure. The correla- tions between ability scores and citation counts were fairly low for
-2-
each field: mathematic/statistics .04, physics .lO, chemistry .07, biochemistry .04, psychology .07. The quality of the graduate department correlated somewhat higher with citation counts, with coefficients ranging between . 13 and .20 for the five fields. The length of time it took to complete a degree correlated negatively with citations (-.14 to -.18) with people who graduated in less time having slightly higher publication rates.
Bayer and Folger (1966) also reported a low correlation for citations with an IQ measure (.05) for a sample of 467 biochemists. But they found a significant correlation of .21 between the rated quality of the doctorate's graduate program and the number of citations, suggesting that the quality of graduate education can affect future research performance.
Studies of graduates of schools of business have found that undergraduate grades and admission test scores are related to success in graduate school but have no relation to later career success (Crooks, Campbell, & Rock, 1979). Personal characteristics, on the other hand, did affect career progress for business school graduates (see also Harrell, 1969).
In the engineering field, Kaufman (1972) found a correlation of about .20 between scores on an engineering achievement test, similar to the GRE Advanced Engineering Test, and the number of publications 14 years later. A longitudinal study of physicians found that traditional grades and admission test scores had little relation to future performance in medicine (Price, et al., 1971).
Undoubtedly, a number of personal characteristics and intervening circumstances moderate the effects of grades and test scores on future performance indicators, and an appropriate study would have to account for as many of them as possible. While the direct relation- ship between measures of academic ability and postdegree career performance may be modest, the indirect effects of ability on career achievement could be substantial.
Purpose
The purpose of this investigation was to explore the influence of a person's academic ability and the research eminence of the graduate program granting the Ph.D. on the postdegree careers of recent Ph.D.s. Publication rates and income were used as indica- tors of career achievement. Type of employment was considered a mediating influence in the relationship between the independent and dependent variables. The sample included several hundred persons 3, 5, and 13 years after receiving their doctor's degrees.

-3-
The following major research questions guided the conduct of the study:
1. Do persons with high-level academic aptitude, as measured by the Graduate Record Examinations, publish more than those with lower aptitude scores but equivalent educational attainment? Do they earn higher incomes?
2. What are the effects of sex, discipline, current employment setting, major job task, and time since the degree on the relationship between measures of academic ability and scholarly productivity?
3. How are these relationships affected by the reputational rating of the quality of the doctoral program that granted the Ph.D.?
Procedures
The basic research design was to look at already available data from two sets of Ph.D. alumni in relation to scores on the GRE Aptitude Test and Advanced Tests. The two sets of alumni data came from a study concerned with the assessment of Ph.D. programs in chemistry, history, and psychology that collected data in 1975 from persons who received the doctorate between 1970 and 1972 (Clark, Hartnett, & Baird, 1976) and a 1973 study of women and men who received doctorates in 1960 and 1968 (Centra, 1974). Originally, about 1,200 questionnaires were available from the first study and about 1,500 from the second. The data from each study were analyzed and are reported separately, since the methods of selecting the samples and the information that was collected from respondents differed in a number of respects. Each sample is described in some detail prior to reportng the results of analyses based on that sample.
The only new data added for the present studies were GRE scores. These were obtained from the GRE program's master microfilm file by a clerk who attempted to match score reports with the names of questionnaire respondents. The years just before and after the subject received an undergraduate degree were assumed to be the most likely sources of GRE score reports. Lookups in the first study were assisted by responses on the questionnaire to indicate whether or not the person had taken one or more GRE tests and the approximate year of the most recent testing. No such information was available for subjects in the second study. The results of these searches and their effect on the sizes of the samples avail- able for analysis are given in connection with the description of each sample. Confidentiality of the GRE scores was maintained by substituting the subject's identifying number for each name before

-4-
the scores lookups.
were keypunched and destroying the original list of
All data except the GRE scores, field of study, and information about the department that granted the degree are taken from the alumni questionnaires and therefore are self-reported information. Details of the major variables considered in each sample are given in connection with the report of the results for that sample. However, the general question of the reliability of self-reported accomplishments is considered here.
Reliability of Self-reported Publications
A continually bothersome aspect of using questionnaire data in studies of accomplishment is uncertainty about its reliability. Do most people report achievements, such as grade averages, publica- tions, or speeches, with reasonable accuracy? Most efforts to determine the accuracy of self-reported accomplishments have found that, although there is some tendency toward inflation of the overall level of accomplishment, there is underreporting as well as overreporting and therefore the variation of responses is very similar to the variation of the same data when it is collected from records. Most of these studies have concluded that self-reported data is much more accurate than usually supposed and is sufficiently reliable for most statistical analyses of group data (for a summary of the research, see Baird, 1976).
None of these studies looked specifically at the accuracy of self-reports of publications by university faculty members, however, and there remains some skepticism about the reliability of such data. It seems likely that there would be some random variation due to different definitions of a "scholarly publication“; for example, some respondents might include reports written for local newsletters, while others would count only articles accepted by refereed journals. Did respondents include or exclude articles in press? What about articles submitted to journals but not yet acted upon? What time span was covered? The likelihood of variations along these lines, in addition to errors of forgetting or of exaggeration, leaves one somewhat uncomfortable about the use of self-reported data on the quantity of research products.
In an effort to evaluate the reliability of the publication reports that were available for this study, a random sample of about half the male psychology alumni in the first study were selected for further evaluation. The names of these alumni were used in a computer search for entries in Psychological Abstracts between 1967 and mid-1977. Since the respondents received Ph.D. degrees between 1970 and 1972, it was felt that this count should capture nearly all their publications in journals included in the Abstracts, including
-5-
any publications prior to receiving the degree. However, two sources of difference between the computer counts and the self- reports could not be avoided: the self-reports could include publications in legitimate professional journals not included in the Abstracts, and the Abstracts does not include books while the questionnaire asked for "professional articles and single chapters in books" as one item. Also under review or in pre ss was
a respondent's decisio unknown.
n about articles
As some check on the problem of inclusion, two counts were derived from the Abstracts search. The first counted entries from 1967 through 1975, the year in which the questionnaire was completed, as a measure of the number of journal articles actually published at that time. The second count included entries from 1967 through mid-1977, to pick up articles under review or in press at the time the questionnaire was completed. The first count is almost certainly too low; the second probably includes some articles that had not yet been written in 1975 and therefore may be too high. However, since the self-reports included single chapters in books as well as journal articles, it was expected that the 1967-1977 count would come closest to the self-reports.
After matching the counts of entries in psychological Abstracts with questionnaire responses, complete data were availabe for 104 subjects. The count of Abstracts entries 1967-1975 averaged 3.98; entries between 1967-1977 averaged 4.89. The correlation between the two counts was .96. The average number of professional articles and single chapters in books reported by these subjects was 5.22, slightly higher than either of the Abstracts counts and closer to the count for 1967-1977, as predicted. The correlation of self- reported publications with both counts was .84. This level of agreement or reliability is considered quite acceptable for research purposes. The true correlation may be even higher if one accepts the likelihood that, even with considerable care, there were a few mismatches of names in the Abstracts computer search.
The extent of agreement between self-reported articles and entries in Psychological Abstracts was also investigated for employ- ment subgroups within the sample to determine whether there were marked variations in the reliability of self-reports by persons with different job responsibilities. The reliabilities were highest for four-year college teachers and for clinicians (.97 and .89), who also reported the lowest mean number of publications and probably are under the least pressure to publish in their jobs. Below average reliabilities were obtained for psychologists employed as researchers in nonprofit agencies and in business or government agencies (.70) and administrators in business and government (.60). The lower reliabilities may reflect some greater tendency to exag- gerate publica .tion s by re sponde nts in these groups, Pe rhaps because of empl oyment pres sure. Howeve r, they are not concl .us ive evidence
-6-
that the reports of respondents in these groups were less truthful than the responses from other groups, since publication counts by researchers and administrators in these settings almost certainly would include some legitimate publications not covered by the Abstracts.
Considering only the 1967-1975 count of entries in Psychological Abstracts and the 1975 self-reported number of professional articles and single chapters in books, counts for 65 out of the 104 subjects (63%) were either identical or varied by plus or minus one publica- tion. Five subjects (5%) reported two or more fewer publications than were included in the Abstracts; 22 subjects (21%) reported two to four more publications than were included in the Abstracts, while 12 (12%) reported five or more publications in excess of the Abstracts count. For all the reasons given above, the inclusion of some of these additional publications undoubtedly is legitimate. Thus, it seems likely that most responses are fairly accurate, with some elevation in mean responses for the group as a whole; Both this finding and the high correlation between the number of self- reported publications and counts from records are consistent with the findings in other studies of the reliability of self-reports and support the use of self-reported research productivity data in the analyses that follow.
Data Analysis
The data were analyzed separately by discipline or curricular group within each sample. Mean self-reported number of journal publications were computed for respondents at various score levels on each GRE test; also computed were means and standard deviations for subgroups of respondents on the major variables of interest and Pearson product moment correlations between variables. Wherever possible, computations reflected only cases with complete data. However, in the path analyses described below, a procedure to substitute an unweighted mean for missing data was used to maintain the maximum number of cases.
A hypothesized causal model of variables to explain differences in outcomes (number of publications or income) was evaluated through the use of path analysis (Werts & Linn, 1970). The model allowed for multiple indicators of certain variables and for causal relation- ships between relevant variables. In the first step, confirmatory factor analysis (Joreskog, 1969) was used to detect the validity of the part of the path model dealing with multiple measures. Multiple measures correct for measurement error, thereby increasing the chances of detecting and accurately estimating causal influences; they were available for ability and productivity in both studies and for quality of the graduate program in the first study. Ideally,

-7-
all variables would have multiple measures that would permit correc- tion for measurement error; however, most of the questionnaire data were not appropriate for such procedures. Therefore, it was not possible to estimate the reliability of a number of the variables in the path analyses performed for both samples, except to expect that there is some measurement error in the survey data. The correla- tions and path coefficients probably are somewhat lower than wyuld be obtained if it had been possible to correct for this error.
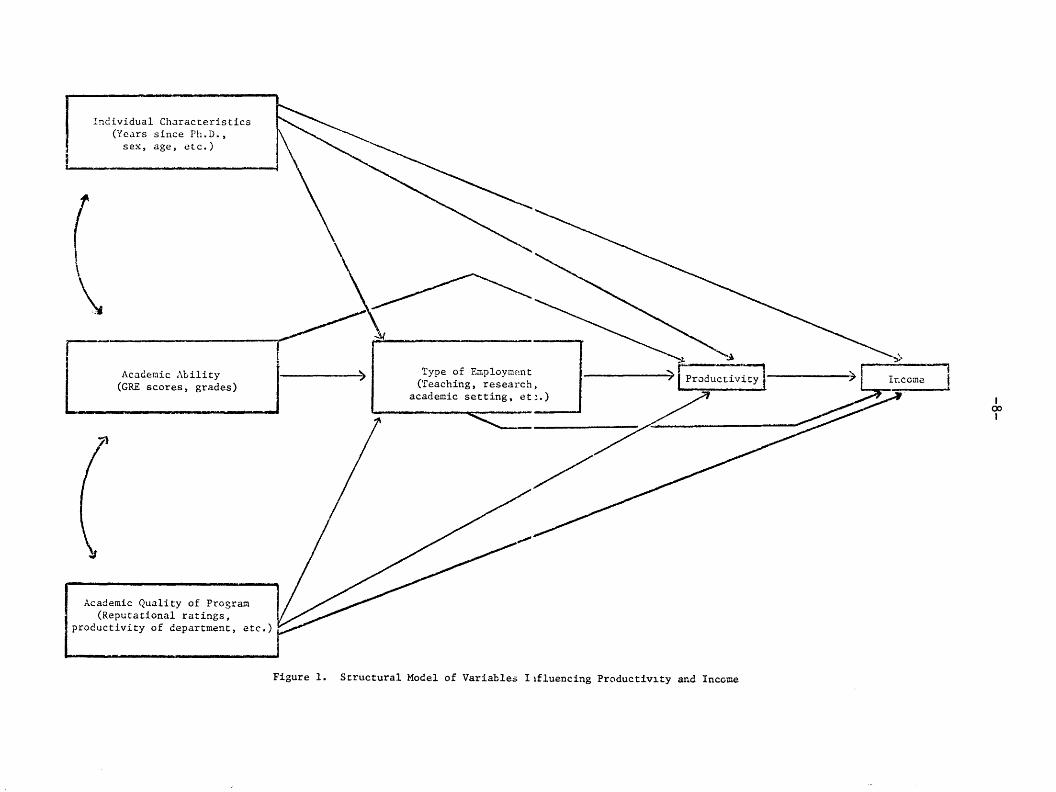
The general structural model for the path analyses is illus- trated in Figure 1. The independent variables, at the left, include academic ability, characteristics of the program granting the degree, and personal characteristics of the degree recipient. These factors were expected to influence the kind of employment sought and obtained by the respondents and therefore their reports of current job setting and activity. The type of employment was expected to influence professional productivity, which in turn would influence income. According to the hypothesized causal relations in the model, any of the variables may also have direct effects on con- structs further to the right in the sequence. The model assumes that all influences not included in the set of variables for analy- sis are uncorrelated with the causal variables in the model. Double-headed arrows connecting variables indicate that the reasons for the correlations between these variables are unspecified and no causal relationships are postulated. The path (partial regression) coefficients provide estimates of the association between pairs of variables when all other variables in the diagram are statistically controlled and therefore taken into account.
The results of the analyses for each of the samples are reported in the following sections.
Study 1
Ph.D. Recipients Three to Five Years After the Degree
The data in this section are responses in 1975 from about half the 1970-1972 Ph.D. graduates of the chemistry, history, and psychology departments of 22 American universities. The universi- ties were chosen to be a probability sample of the origins of all Ph.D.'s awarded in the U.S. in a recent three year period. The
1 The authors wish to acknowledge the assistance of Charles
Werts in planning, carrying out, and interpreting the path analyses.
Individual Characteristics (Years since Ph.D.,
sex, age, etc.)
Academic .12tili~y (GRE scores, grades)
Type of Employment
(Reputational ratings, productivity of department, etc.)
Figure 1. Structural Model of Variables Influencing Productivity ar,d Inccjme

-9-
departments provided a good cross section of program sizes and types in each discipline, while providing homogeniety by limiting respon- ses to graduates of programs in the same university settings. Relative to all doctoral degree programs in the country, the sample overrepresents large and nationally recognized departments. Restric- tion of the sample to a limited number of universities and to the same degree years (1970-1972) was expected to result in approximate- ly equal career opportunities for all the subjects. A detailed description of the programs and the alumni respondents can be found in the technical report of a study on the assessment of quality in doctoral education (Clark, Hartnett, & Baird, 1976).
Sample
The following analyses are limited to data from the alumni respondents for whom GRE scores could be located. GRE Aptitude Test scores were found for about 80 percent of those who said they had taken the test and were willing to release their scores; most had also taken an Advanced Test, and Advanced Test scores were located for a few persons (12-15 per field) who did not have Aptitude Test scores. Table 1 reports the number of alumni respondents at each level of data availability.
Because there were so few women respondents, and because other studies have shown different patterns of employment, publication, and income for women and men Ph.D.'s (for example, Centra, 1974), the analyses were limited to responses from men. In addition, more than 97 of the men were U.S. citizens and 94 described themselves as white or Caucasian. Inspection of the test scores and publica- tion rates of the nonwhite and non-U.S. respondents did not indicate any obviously serious bias in their data; nevertheless, they were eliminated from most of the analyses in order to identify the sample as clearly as possible. Therefore, unless otherwise indicated, the following tables and comments refer only to white male U.S. citizens who provided information about themselves in 1975 after receiving the Ph.D. degree in the early 197Os, and for whom we could locate one or more GRE scores. The final samples for data analysis of more than 200 young alumni in chemistry and in psychology are considered adequate for the analyses that were planned, although not large enough to avoid the possibility of some statistical instability. The history sample of 142 is considered marginal, and the results for this discipline should be interpreted with particular caution. It is difficult to estimate the extent to which the subjects repre- sent all male recipients of a doctoral degree in the early 197Os, though they are probably more representative than the subjects of some earlier studies of the relationship between academic ability and career performance (for example, applicants for NSF predoctoral fellowships, by Creager & Harmon, 1966).

-lO-
Table 1
Number of Ph.D. Alumni Respondents by Field
Data Available Chemistry History Psychology
Total number of usable ques- tionnaires in the original study 430 349 393
Said took GRE 344 229 356
Willing to release GRE scores for research purposes 310 205 340
Aptitude Test scores found (V & Q)
Men 242 146 229 Women 18 13 51
Advanced Test scores found
Men Women
232 144 208 16 10 42
Total number of men with at least one GRE score 254 158 241
Total number of white male U.S. citizens with at least one GRE score 239 142 221

-ll-
Variables
A copy of the questionnaire used to obtain information from these recent recipients of the Ph.D. degree is in Appendix A. The questionnaire included a number of questions about the program from which the degree was received, in addition to questions about the graduate's current employment. Almost all the data used. in this report come from pages 5, 6, and 7 concerning personal character- istics and current employment. Variables included in the analyses are experience (age and number of years since receiving the doctor- ate), undergraduate and graduate grade averages, kind of current employer, primary activity in the current job, ratings of the current position, number of professional publications and presenta- tions, and annual income. GRE scores were added to the file for each respondent.
In addition, a number of variables from the dimensions of quality study were added to each respondent's file to describe the program that granted the Ph.D.: student and faculty reports of the quality of the academic and social environment; student evaluations of the assistantship experience; faculty evaluations of the adequacy of physical and financial resources; faculty-reported extent to which the program emphasized the preparation of researchers, teachers, or practitioners; average number of faculty journal publications in the last three years; newly collected peer ratings of the quality of2 the graduate faculty and the attractiveness of the graduate program; percent of faculty who received their degrees from "leading" programs (3.0 or above in the ACE ratings); and number of full-time-equivalent doctoral students, as a measure of program size. Preliminary correlational and factor analyses indicated that size was almost entirely explained by the other variables; therefore, it was dropped, together with the variables that demonstrated weak or unstable associations with the measures of alumni postdegree professional activity. The program variables that remained in the analyses were mostly those that measured the research orientation of the program and the quality of the graduate faculty. These variables formed a stable factor labeled "academic quality of the program." A description of these variables and their intercorrelations is in Appendix B, Table 1.
Variables from the alumni data were also identified to define an academic ability factor and a research productivity factor in
2 Peer ratings collected in 1975 as part of the dimensions of quality project, using the same format as the Cartter and Roose/Ander- son ratings published by the American Council in Education. For details see Clark et al., 1976.

-12-
order to correct for additional measurement error in the regression (path) analyses. The academic ability factor included undergraduate and graduate grades and GRE Aptitude Test (verbal and quantitative ability) and Advanced Test scores. The research productivity factor included self-reported number of professional articles and single chapters in books, scholarly book reviews, authored or edited books, monographs , presentations at regional or national meetings, and presentations at scholarly colloquia. The variables in each factor and their intercorrelations are listed in Tables 2 and 3 of Appendix B.
Variations in the employment patterns, research involvement, productivity, and incomes of respondents with different specializa- tions within each discipline were also examined to determine whether subdisciplines should be taken into account in the regression analyses. The major findings are reported in Appendix B, Table 4. Though there were some systematic differences associated with some areas of specialization, the differences were not considered large enough to require statistical control and the numbers were not large enough to warrant separate analyses. Therefore, subdisciplinary affiliation was dropped as an independent variable.
The final set of variables in the hypothesized causal model included four independent variables: the academic ability and graduate program quality factors, number of years since receiving the Ph.D. (years of postdegree experience--generally three to five), and current age (a measure of time taken to complete graduate training, since all respondents received their degrees at approxi- mately the same time). Dependent variables included research or teaching as the primary activity in the current job, ratings of the research opportunities in the job and the extent to which the job interferred with the preparation of articles or books, the produc- tivity factor, and income. Descriptions of the variables and their intercorrelations will be found in Appendix B, Table 5.
Results and Discussion
There is a general social expectation that attainment of a Ph.D. is associated with high status employment, good income, and a high level of personal satisfaction in the job. Such expecta- tions are supported by these data; most graduates were employed in research, college teaching, or administrative positions, earned an average of $15,200 (history) to $19,500 (psychology) per year, and said that on most days they enjoyed their work and that it gave them a feeling of worthwhile accomplishment. Almost all (80 to 90) were professionally productive in the early years following attainment of the degree, as indicated by self-reports of publishing at least one professional article or book chapter and giving one or more presen- tations at a regional or national professional meeting as well as at local scholarly colloquia. A large-scale survey of college and university faculty in 1969 (Fulton & Trow, 1974) reported that
-13-
48 percent of all faculty members had published at least one article in the last two years; about 70 percent of the university faculty reported this level of research activity. Since faculty members without Ph.D.'s were included in the survey, it seems likely that the present sample is at least as productive as, and perhaps somewhat more productive than, the population it represents.
One of the central questions of this study concerned the relationship between scores on the GRE and later research produc- tivity as represented by the number of published articles in professional journals. It was thought that there might be be a "threshold" effect, such that persons in a particular score band would be found to publish more than those at other levels. There- fore, the first data analyses examined the number of published journal articles reported by men at different levels on each of the GRE tests. In general, the distributions were very flat, with no indication that more publications were reported in any of the disciplines by those with higher scores on any of the three GRE tests. In fact, the largest number of publications was reported by those with the lowest GRE scores (below 500) on all three tests in all three fields. However, the number of cases in this low score category was always very small-- 3 or 4 to 20 men per test and field.
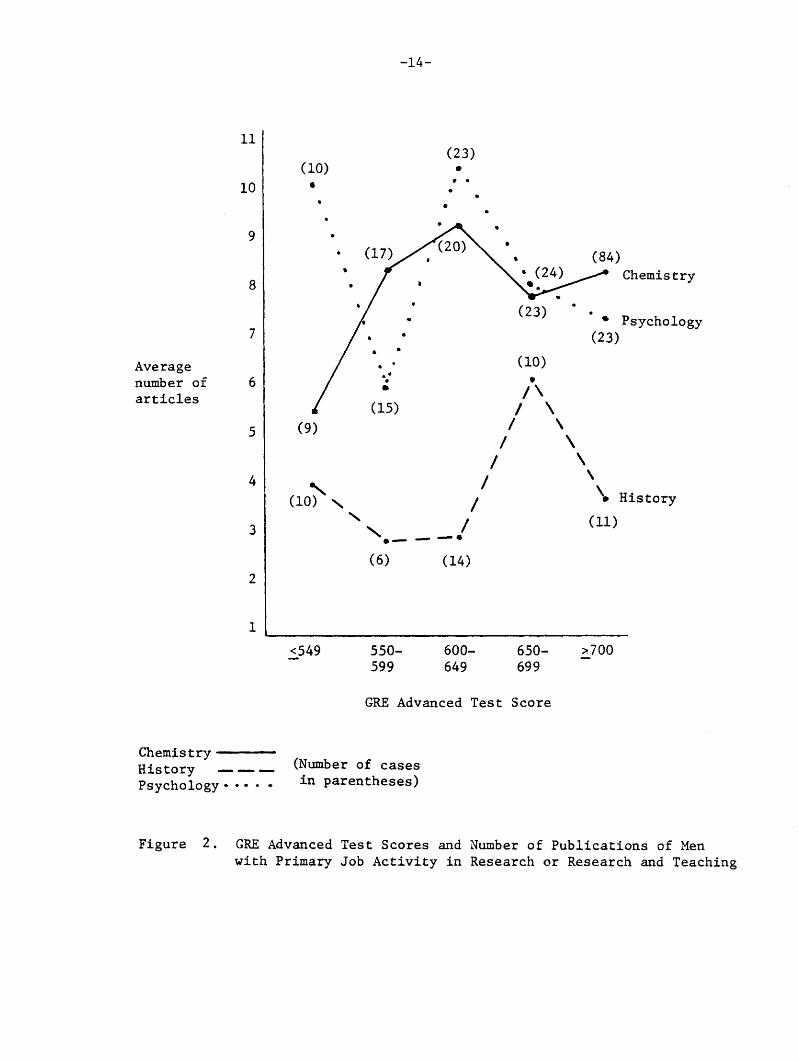
Next, the publication records of those who indicated primary job activity in research or research and teaching were computed separately, since it was expected that persons in research positions would publish more frequently than those in teaching, administra- tive, or clinical positions. The expectation was supported; re- searchers in chemistry reported an average of 8.1 articles or single chapters in books while nonresearch chemists reported 4.2 articles, and similar contrasts were 4.1 vs. 2.2 in history and 8.6 vs. 3.5 in psychology. However, even among the researchers, and in relation to scores on an Advanced Test (which tend to be slightly more positively related to productivity than verbal and quantitative scores in most studies), the level of publication at each score level was still quite flat. These score and publication profiles are plotted in Figure 2 for the researchers in each discipline. There is some fluctuation in research productivity across the score range and a low positive relationship between ability and productivity among the researchers in chemistry and history. However, since limiting the data presentation to researchers with Advanced Test scores presents only the most positive case, the data do not appear to support the expectation that Ph.D. recipients above a given ability level publish more scholarly articles than those below this level.
Multivariate analyses to explore the complexities of this relationship are reported in the remainder of this section. The employment settings of this very specialized segment of the American work force are examined, with results of path analyses to evaluate the relative contribution of ability, training, experience, and work
-14-
11
10
9
8
7
Average number of 6 articles
5
(23) (10) 0
0 9 .
. .
. l
.
.
(23)
/ \
/ \
\ (10) \
\ /
l History \
\ / (11) .- --a
(6) (14)
5549 550- 600. 650- 2700 599 649 699
GRE Advanced Test Score
Chemistry History --- (Number of cases Psychology- .a l - in parentheses)
Figure 2. GRE Advanced Test Scores and Number of Publications of Men with Primary Job Activity in Research or Research and Teaching

-15-
situation on early professional productivity (publications and presentations) and reward (income). The data are presented sepa- rately for each discipline, followed by a discussion of the simi- larities and differences across disciplines and some possible explanations for and implications of the results.
Chemistry. Table 2 reports the scores of all chemistry alumni in the sample on selected variables, and the scores of major occupa- tional subgroups among the chemists on the same characteristics. Relative to the GRE test-taking population, these Ph.D. graduates averaged about the 68th percentile among men on verbal scores, 79th percentile on quantitative Scores, and 71st percentile on the Advanced Test in chemistry. Graduates averaging the highest test scores, and from graduate programs with the highest reputational ratings, tended to hold regular faculty positions in Ph.D. univer- sities, research positions in business or government, or have a postdoctoral fellowship. Almost all these respondents indicated that their primary job activity was research or, in the case of university faculty, research and teaching.
Opportunity for research, job satisfaction, and research productivity varied somewhat depending upon job setting (see Table 2). The university faculty members said their jobs were very likely to provide many opportunities for research and creative work, and they reported the highest number of publications in professional journals as well as frequent presentations at regional or national professional meetings. Those holding research positions with academic or other nonprofit agencies were much like the university faculty in their reports of opportunities for research and their professional productivity, although their academic credentials tended to be somewhat less distinguished.
More research chemists reported working for business, industry, or government than in academe. The researchers in business or government positions and those holding postdoctoral fellowships reported research productivity rates slightly below average; the chemists employed as researchers in business and government also indicated relatively little opportunity for research and creative work and a relatively high level of interference with the prepara- tion of articles and books. These patterns of research opportunity and productivity are more like the responses of their administrative colleagues or college teachers than like those of reseachers in academic or nonprofit settings. Respondents in academic settings
3 Normative comparisions are graduate school students and
applicants tested in 1964-67 (Graduate Record Examinations Score Interpretation Leaflet for Students, 1968).

Table 2. Chemistry
Academic and Employment Characteristics of White Male Ph.D.'s Three to Five Years After the Degree
Current Employment
Variables
2-/4- Research Admin. Ph.D. year Non- in in
Post- univ. college profit business/ business/ Total dots faculty faculty research gov't gov't
N (239)* (13) (34) (45) (12) (95) (16)
1. 2. 3. 4.
5.
6. 7. 8. 9.
10.
11. 12.
13. 14.
GRE-V GRE-Q GRE-Adv. Reputational rating of graduate facultya Age Current job:b
Many research opportunities Interfereswithwriting Enjoyable Worthwhile accomplishment
Mean number of articles and book chapters Mean number of authored/edited books Mean number of regional/national presentations Income (in thousands) Correlations with number of articles/book chapters:
GRE-V GRE-Q GRE-Adv. Reputational rating of grad. fat.
588 603 614 587 545 589 563 689 690 711 672 629 696 687 686 697 716 661 661 703 654
3.37 3.36 4.00 3.11 2.79 3.40 3.12 31.71 30.54 31.00 32.64 32.00 31.43 31.25
2.21 2.38 2.74 1.82 2.83 2.23 1.75 1.59 1.31 1.29 1.73 1.25 1.65 1.56 2.57 2.31 2.79 2.62 2.83 2.45 2.44
I
2.42 2.15 2.76 2.56 2.58 2.20 2.44 :
6.67 5.92 14.21 5.14 12.08 5.26 4.63 .18 .92 .09 .05 00 .Ol .25
2.16 2.54 3.59 2.26 4.50 1.54 2.50 18.7 11.4 17.7 14.9 18.8 21.0 23.5
-.02 .34 -.Ol .24
.15 .21
.17 . 34l I
a5=distinguished, 4=strong, 3=good, 2=adequate, l=marginal
-.19 -.Ol -.66 -.03 .18 -.62
.05 .33 .34 -.08 .27 .46
.13
.ll
.05
.13
.03
.03 /
.05 -.32
b 3=very descriptive, 2=somewhat descriptive, l=not descriptive
*Other employment: Academic administration, clinic or hospital, self-employed, other position, no answer (24)
-17-
were also more likely than those in business or government settings to report that they enjoyed their jobs and that their jobs gave them a feeling of worthwhile accomplishment. But researchers in business and government reported considerably higher incomes.
Though there is a low positive correlation between the publica- tion of articles in professional journals and the GRE scores of some of the employment groups, (see bottom of Table Z), only the correla- tions between publications and scores on the Advanced Test are consistently positive. These correlations are consistent with the slope of the chemistry distribution in Figure 2. The larger corre- lations for ability scores, both positive and negative, are in very small groups and therefore probably quite unstable. Overall, these correlations suggest some relationship between early evidence of outstanding academic ability or achievement in chemistry and research productivity in the years immediately following receipt of the Ph.D., but the relationship is not very strong.
Variables in the hypothesized causal model are presented in Figure 3, with the significant path coefficients recorded to indi- cate the causal influences among chemists when all other variables in the model are held constant. The particular variables reflecting each of the factors for chemists are also indicated in Figure 3. Zero-order correlations between the variables in each factor and estimates of the correlations between the factors and variables in the path analysis can be found in Appendix B, Tables 1-4.
Though a graduate's level of academic ability and the quality of the training he received in graduate school are considered independent variables in this analysis, it is well known that the more widely recognized and competitive programs can and do admit students with higher-than-average undergraduate grades and GRE scores. Therefore, there is a fairly strong relationship between academic ability and graduate program quality in all three disciplines in this study; the relationship is particularly strongin chemistry, with a correlation of .74. There is also a significant negative correlation between the academic ability factor and the ages of the respondents in chemistry (-. 24), indicating that the more able tended to complete their doctoral degrees in less than the average amount of time. These young men were also more productive than average, as indicated by a negative path coefficient between age and productivity. When the effect of all of these variables is considered together, the low positive relationship between the academic ability and research productivity of chemists, suggested by some of the correlations at the bottom of Table 2, appears to reflect primarily the age of the graduates and the quality of the programs from which they received their degrees. The academic ability factor does not demonstrate an independent causal relationship with any of the dependent variables in the model.

L-L 2Teaching
I ’ qu . Pee-r Racing of Faculty
]/
Interference
f \
Years since Ph.D. S
.a0
1 J Multiple Correlations; I-IV 0;1 1 = .23 n.s.
Figure 3, Chemistry Ph.3's Three to Five Years I-IV on 2 = .25 11.6
After Receivtng the Degree (X=239) I-IV, 1, 2 on 3 = .L!3 PC.05 I-IV, 1, 2 on 4 - .26 n.5.
I-IV, 1, 2, 3, 4 on 5 - .53 pi.05 All or, 6 - .44 pc.S
-19-
The personal characteristics of alumni, other than academic ability, are represented in this analysis by age and years since receiving the degree. Most of the chemistry alumni (65) were 30 to 32 years of age when they completed the questionnaire; 11 were under 30. These ages suggest a pattern of baccalaureate degree, followed by four or five years of study to complete the degree between 1970 and 1972 and have three to five years of postdegree experience prior to completing the questionnaire. This is consistent with the observation that the younger graduates tended to have higher academic credentials (test scores and program prestige), which help pave the way for rapid completion of graduate training. Relationships in the path diagram also indicate that the younger alumni were more likely to have gone into research positions; the older graduates were more likely to have taken positions in teaching. The positive relationship between age at time of degree and research productivity is consistent with results reported by Hagstrom (1971) and Clemente (1973).
As can be seen in Figure 3, the strongest influence on the research productivity of chemists is employment in a research or research and teaching position that provides many opportunities for research and does not interfere with the preparation of articles or books. As we saw in Table 2, there are research jobs for chem- ists in a variety of settings, and they differ in the extent to which they support and encourage professional productivity. The achieved level of productivity in the early years appears to be determined more by these factors than by differences in the academic ability or training of the graduates. All the variables in the model up to this point have a multiple correlation of .53 with productivity or account for about 28 percent of the observed variance in the factor representing the publications and presentations of these young chemists.
The model hypothesizes that all the variables, including productivity, will influence income. Elements of the model found to have an independent influence on income were years since Ph.D. (those who earned their degrees in 1970 were making more money than those who received degrees in 1972); a job in research or, particu- larly, in teaching (nonacademic employers and administrative posi- tions pay more than academic employers); and the quality of the graduate program (graduates of high prestige programs are more likely to take academic positions and, consequently, receive less income.) At least at this early stage of these chemists' careers, differences in their research productivity appear to have no signi- ficant impact on their incomes.
History. The sample of young professional historians is smaller than the samples in the other fields, and the results must be considered more tentatively. Almost all of them reported employ- ment in colleges and universities. The mean scores of male historians
-2O-
on some of the major variables of interest are shown in Table 3, together with similar information separately for those employed as faculty members at Ph.D. universities and faculty members at two- and four-year colleges.
As in the other fields, the average GRE scores of these respon- dents were considerably higher than the test scores of GRE test takers in general. In the verbal area, the average score was at the 80th percentile among men who took the test in the mid-1960s, the quantitative score was at the 51st percentile, and the Advanced History Test score was at the 80th percentile.
Historians reported fewer professional articles and fewer presentations at national meetings than did chemists or psycholo- gists; however, they were much more likely to write scholarly book reviews than were graduates in the other fields (see Appendix B, Table 3). Writing and publishing books is considered more important in evaluating the professional performance of historians than for academicians in the other two fields (Centra, 1977), but apparently there has not yet been time for book publishing to be demonstrated by many of these young scholars.
Historians also reported lower annual incomes than did gradu- ates in the other fields. There were fewer historians in high-pay- ing nonacademic kinds of employment; in addition, the incomes reported by those in academe were lower than the incomes of academic chemists and psychologists. The historians also averaged slightly older in age, with about a quarter of the graduates over age 30 when they received their degrees.
Although historians employed as faculty members at Ph.D. universities tended to come from prestigious graduate programs, reported primary job responsibility for research as well as teach- ing, reported their jobs provided many opportunities for research, and reported above average professional productivity, the data in Table 3 suggest that they were not very different in most respects from the historians who were teaching in two- and four-year colleges. The other historians-- almost a quarter of the sample--were employed in positions too varied for summarization. Regardless of employment setting, however, the correlations at the bottom of Table 3 indicate a consistently negative relationship between GRE Aptitude Test scores and research productivity in the early professional years. The correlations reflect the pattern, noted earlier, of many publica- tions reported by the few men in the sample who had GRE verbal ability scores below 500.
It is not clear whether the finding of more publications by those with lower test scores is characteristic of young Ph.D.'s, or whether it represents sampling error. It is most extreme in the sample of historians (an average of 7.4 articles for nine

-21-
Table 3. History
Academic and Employment Characteristics of White Male Ph.D.'s Three to Five Years After the Degree
Current Employment
2-/4- Ph.D. year
Total univ. colleges N (142)* (40) (70)
1. 2. 3. 4.
5.
6. 7. 8. 9.
10.
11. 12.
13. 14.
GRE-V GRE-Q GRE-Adv. Reputational rating of graduate facultya Age Current job:b
Many research opportunities Interferes tith writing Enjoyable Worthwhile accomplishment
Mean number of articles and book chapters >lean number of authored/edited books Xean number of regional/national presentations Income (in thousands) Correlations with number of articles/book chapters:
GRE-V GRE-Q GRE-Adv. Reputational rating of grad. fat.
634 647 610 570 568 558 636 637 630
3.38 3.76 3.15 33.89 33.13 34.24
1.90 2.45 1.66 1.82 1.55 1.91 2.43 2.64 2.46 2.39 2.56 2.41
2.79 3.85 2.78 .35 .51 .31
1.86 2.77 1.80 15.2 14.9 14.7
-.24 -.36 -.17 -.14 -.14 -.15
00 .03 .02 -.12 -.16 -.17
a5=distinguished, 4=strong, 3=good, 2=adequate, l=marginal
b 3=-:ery descriptive, 2=somewhat descriptive, l=not descriptive
*Other employment: Academic administration, primary or secondary teaching, research agency, business or government, self-employed, other position, no answer (32).
-22-
men with GRE verbal scores below 500, compared to an average of 2.7 by larger numbers of men in each category of scores between 500 and 750), resulting in a significant negative correlation between the academic ability and productivity factors (-.28), but the phenomenon was also observed in the publication reports of chemists and psychol- ogists. This suggests that the history results are not entirely the product of chance. One possible explanation is that persons with GRE scores below about 550 are admitted to academically oriented Ph.D. programs only if they present some very strong compensating strength as well as a strong will to succeed. Though they have now received their degrees, they may still be exhibiting a strong drive to succeed and to be accepted professionally and, in fact, may have published more articles than their colleagues. If so, a longer period of time would be required to see whether or not they are able to maintain this early publication lead. For this sample, however, the statistical relationship is negative, despite an entirely flat pattern of publications reported by those with test scores between 550 and 750.
The relationships among varizbles in the causal model are shown for historians in Figure 4. The GRE verbal score is the best determiner of the academic ability factor; neither under- graduate nor graduate grades are good indicators. Number of articles in professional journals and single chapters in books, though not numerous, are the best indicators of the productivity factor. The academic quality of the program is represented by peer ratings, program emphasis on research, resources, and quality of the entering students.
The academic quality of the program granting the Ph.D. influ- enced the primary job activities of graduates; graduates of the more research-oriented programs were more likely to be in jobs that include both research and teaching, while graduates of programs with lower academic quality tended toward jobs that involved only teach- ing. Those in research positions were more likely to publish, as anticipated. It should be noted, however, that research historians always combine research with teaching; they do not have access to nonacademic research positions like those available to chemists and psychologists. Only 32 percent identified with research as well as teaching as a primary job activity, in contrast to 67 percent of chemists and 44 percent of psychologists who said they do research or research and teaching. Half the historians said their jobs concerned teaching only, more than twice as many as in the other fields. Obviously, "research" means something different to histo- rians, and engagement in it may depend more on personal inclination
4 See Appendix B, Tables l-4, for zero-order correlations
between the variables in the model and model variables in each factor.

f 3Many i Research
of Faculty J I
Multiple Correlations:
IV 1 I
Years rll since Ph.D.
Figure 4. History Ph.D. '8 Three to Five Years After Receiving the Degree (N-142)
I-IV on 1 - .30 n.s. I-IV on 2 - .30 n.6.
I-IV, 1, 2 on 3 - .53 PC.05 I-IV, 1, 2 on 4 - .28 n.s.
I-IV, 1, 2, 3, 4 on 5 = .52 PC.05 . All on 6 - .43 n.6.

-24-
than on small differences in measured academic ability or in the structural support of a job.
As predicted in the theoretical model, research productivity among historians helps to explain income. Other factors influencing income include age (older graduates tend to make more money) and job setting (as in the other fields, those in research and teaching or just teaching earn less than administrators or those employed outside academe).
The multiple correlations in the explanatory model for histori- ans are very similar to the multiple correlations obtained for chemists, with about 27 percent of the variance in research produc- tivity accounted for by the independent variables and the job setting. Any positive link between academic ability and productiv- ity for historians must operate through the academic quality of the graduate program (r = .45), since the negative direct relationship between ability and productivity persists even when the other variables in the model are held constant. This may be a statistical artifact reflecting the particular distribution of the variables in this sample, or it may result from influences not in the model, such as personal drive, or vagaries of the match between candidates and jobs.
Psychology. The personal, academic, and employment character- istics of the psychology alumni are summarized in Table 4. As a group, these men had an average GRE verbal score at the 78th percentile among male test takers in the mid-1960s; their average quantitative score was at the 65th percentile, while their average score on the Advanced Psychology Test was at the 78th percentile. Men with the highest average test scores, and with degrees from the highest rated departments, tended to be employed as faculty members in Ph.D. universities or as researchers in nonprofit agencies, government, or business. Almost all the men indicated that their primary job activity was research or research and teaching. The researchers in nonprofit settings reported the most opportunity for research and the greatest number of publications and presenta- tions. Faculty members at two- and four-year colleges, whose primary job activity usually was teaching, also reported a fairly high number of professional publications. Clinicians reported the smallest average number of publications; they also reported the highest level of enjoyment and sense of worthwhile accomplishment in their jobs. As with chemists, income was less for those in academic positions or research in nonprofit agencies and more for clinicians and those with research or administrative positions in business, industry, or government.
Correlations between the self-reported number of journal publications and GRE scores, reported at the bottom of Table 4, are consistently near zero or negative except for the small group of graduates employed as administrators in business or government;

Table 4: Psychology Academic and Employment Characteristics of White Male Ph.D.'s
Three to Five Years After the Degree
Current Employment
Variables
2-/4- Research Admin. Ph.D. year Non- in in Clinical/ univ. college profit business/ business/ self-
Total faculty faculty research gov't. gov't. empl. N (221)* (58) (49) (17) (12) (15) (41)
1. GRE-V 629 650 627 645 635 624 613 2. GRE-Q 631 656 628 653 648 596 609 3. GRE-Adv. 631 655 646 641 623 595 613 4. Reputational rating of graduate
facultya 5, Age
3.19 3.58 2.99 3.40 3.43 2.63 2.83 32.15 31.47 32.94 32.82 32.17 32.60 31.90
Current job:b 6. Many research opportunities 7. Interferes with writing 8. Enjoyable 9. Worthwhile accomplishment
10. Mean number of articles and book chapters
2.23 2.64 1.86 2.88 2.25 2.13 2.00 1.71 1.53 1.78 1.35 2.08 1.73 1.90 I 2.60 2.48 2.65 2.65 2.17 2.53 2.71 2.51 2.45 2.45 2.59 1.83 2.60 2.61 F
11. Mean number of authored/edited books 12. Mean number of regional/national
presentations 13. Income (in thousands) 14. Correlations with number of
articles/book chapters: GRE-V GRE-Q GRE-Adv. Reputational rating of grad. fat.
5.40 .lO
3.44 19.5
-.05 - . 0.2
.02
.14
9.21 5.42 6.81 5.17 4.00 2.31 .16 .04 .25 .oo .08 .08
5.60 2.71 4.88 2.50 5.23 1.18 18.9 15.6 20.2 22.1 26.9 22.5
-.21 -.33 -.67 -.05 .29 00 -.13 -.35 -.05 -.70 .22 .lO -.15 -.09 -.41 -.08 .41 -.08
.07 .07 -.22 -.33 -.09 .ll
a5=d_istinguished, 4=strong, 3=good, 2=adequate, l=marginal
b 3=3ery descriptive, 2=somewhat descriptive, l=not descriptive
*Other employment: Postdoctoral fellowship, academic administration, other position, no answer (29)
-26-
though these men tended to come from the least prestigious programs and to average slightly lower test scores than the men in the other employment groups, they reported moderate opportunity for research and many presentations at regional and national meetings. It may be that there is more opportunity for a relationship between productiv- ity and ability to be demonstrated in this group than within more homogeneous groups. However, because of the small sample size, most of these correlations do not reach the level of statistical signifi- cance, and they cannot be viewed as more than suggestive.
The path coefficients of variables to explain professional productivity and income among psychologists are presented in Figure 5. Like those in chemistry and history, the men who were older than average when they received their degrees were more likely to be found in teaching than in jobs with other primary responsibilities. Also again, there is a fairly strong relationship between the independent variables of academic ability and quality of the graduate program (r = .51; see Appendix B for correlations between variables in each factor and estimates of correlations between factors and variables in the path model). The academic ability factor is also positively correlated with research as a primary job activity (.23) and many research opportunities on the job (.20). However, the relationship between quality of the graduate program and these variables is even stronger, and this relationship results in positive path coefficients in the model (program quality through research position and research opportunity to productivity).
Employment in a position with research as a primary job activi- ty is the most important variable in accounting for variation in the professional productivity of psychologists, influencing productivity directly as well as through the level of research opportunity on the job. Other influences are employment as a faculty member with primary responsibility for teaching (academics as well as research- ers published more than administrators or clinicians--see Table 4), years since receiving the degree (1970 graduates had published more than 1972 graduates), and academic ability (with program reputation, job responsibilities, and other factors taken into account, there was some tendency for those with lower scores on the academic ability factor to have higher scores on the professional produc- tivity factor). Taken together, all the explanatory variables account for about 45 percent of the variance in the professional productivity of psychologists, with a multiple correlation of .67.
Even though psychologists with the highest publication rates tend to be in the lowest-paying jobs, the path analysis indicates that these young psychologists are beginning to experience some income benefit from their professional productivity. The other variables in the model that influence income are negative: employ- ment in research or teaching and quality of the graduate program (administrators and clinicians receive higher pay than do academi-

GRE Adv.
f 3 Many
e
Opportunities
Interference
~"Cec?dlng" Programs
Figure 5. Psychology Ph.D.'8 Three to Five Years After Receiving the Degree (N-221)
Multiple
I-IV,

-28-
cians, and they tend to have graduated from less prestigious programs). The multiple correlation of all the variables with income is .50.
Summary and Interpretation of Study 1 Results
The results of this study concerning the relationship between evidence of academic aptitude prior to beginning graduate study and professional accomplishments three to five years after receiving the doctoral degree --almost certainly at least 10 years later, with all the associated intervening influences-- suggest a number of threads of consistency, despite the weaknesses in data quality that must be expected when dealing almost entirely with self-reported information and with relatively small samples. First, the subjects in all three fields had test scores well above average when compared to.GRE test takers in general. In history and psychology, fewer than 20 percent of these men had GRE verbal scores below 550; in chemistry, only 13 percent had quantitative scores below 600. About 25 percent of the historians and psychologists had verbal scores above 700, while more than half the chemists had quantitatives scores above 700. Clearly it was a superior group in ability as well as academic achievement.
The high average level of ability confirms our expectation in this regard; however, the narrow range of talent makes it difficult to demonstrate relationships between talent and the kinds of accom- plishment that may also reflect training, motivation, opportunity, encouragement, and other unknown and unmeasured influences. In addition, almost all the subjects had less than five years since receiving their Ph.D. 's to establish themselves professionally. And all of them entered the labor market in the early 197Os, at a time when many academic institutions were reducing faculty size and there was increasing competition for appropriate positions both within and outside the academic community. It may well be that a longer span of time is needed to settle into a pattern of profes- sional productivity, particularly when jobs are tight and many of them provide little incentive or reward for research activity.
Despite these problems, a number of results were consistent across three disciplines as different as chemistry, history, and psychology. First, the data supported the hypothesis that the same measures represent the constructs of academic ability, graduate program quality, and scholarly productivity in all three fields. High-loading variables were slightly different from discipline to discipline, but the basically stable factors encourage more widespread use of multiple measures such as the ones employed here to improve the reliability of the measurement of these constructs in future research. In this study, the use of multiple measures of a student's academic ability and a program's academic quality to
-29-
correct for the attenuating effect of measured error was particular- ly helpful in showing the strong interacting effects of student ability and quality of the doctoral program on postdegree employment.
Not surprisingly, research as a major job activity and employ- ment in a position that provided many opportunities for research were major explanatory variables of productivity in all three disciplines. Such positions were most likely to be held by gradu- ates of high prestige programs who completed their degrees at relatively young ages; however, many other factors (personal prefer- ence, job availability, etc.) also contributed to the determination of employment setting, as indicated by an average multiple correla- tion of only about .3 between the four independent variables in the model and either research or teaching as the primary job activity.
For all three fields, income was more closely related to employment setting and number of years of experience than to specific differences in ability or training, although both high ability and Ph.D. training could be considered preconditions for appointment to the kinds of positions held by most of these doctorates.
In summary, we conclude from these data concerning young professionals in chemistry, history, and psychology that, at least in their early years of career development, academic ability above the average is not an important direct contributor to success as measured by research productivity or income. The absence of such a relationship may simply reflect the fact that our subjects had not yet had an opportunity to demonstrate stable patterns of scholarly activity; greater competition in the job market, with wider dispersion of graduates from the most academically-oriented programs, may also decrease the likelihood of demonstrating such a relationship among those who have recently received their Ph.D.'s. Clearly, information about job settings and responsibilities is an essential element in any study that attempts to determine the factors that contribute to the early career achievement of recent Ph.D.'s.
Study 2
Doctoral Recipients Five and Thirteen Years Later
The second study used data from the Women, Men and the Doctorate report (Centra, 1974), which included a sample of 3,658 men and women who had received the doctorate in approximately 1950, 1960, or 1968. The purpose of that survey was to describe the professional development and status of women doctorates relative to a matched sample of men with doctorates. Men and women were matched by year of degree, field of study, and institution of the degree. Of the

-3o-
total sample, 1,524 had received doctorates in 1960 or 1968 in four subject field groups: humanities, 431; social sciences, 469; biological sciences, 365; and physical sciences, 259 (1950 graduates were excluded because very few GRE scores were on file for them). Of this group, GRE scores were located for 355. Scores were found for only 43 of the humanities doctorates so they were excluded from further analysis. Scores were available for 94 of the respon- dents in social sciences, 115 in biological sciences, and 103 in physical sciences. Those not found either did not take the GRE at all or did not take it within five years of the time they completed their bachelor's degree. The final sample included fewer women than expected, largely because of the difficulty of finding scores of women who, because of marriage or divorce, had different last names at the time they registered for the GRE.
Since the survey questionnaire was administered in 1973, the sample included men and women who had held a doctorate for either 5 or 13 years. For the subsample used in this study, major fields of study were grouped into discipline areas to provide large enough N's for analyses. In natural sciences, the largest number was in chemistry (58); in social sciences , psychology composed the largest major field group (28).
The survey questionnaire, which is in Appendix C, included questions on graduate school experiences, employment patterns, publication rates, and annual income. The specific variables used in this study are listed in Table 5 along with a mean or percentage value for each variable by field of study. As indicated in the table, the percentage of males varied between 57 percent in biolog- ical sciences and 70 percent in social sciences. The social science doctorates were just under 30 years old and there had been close to seven years between their B.A. and Ph.D. degrees. By contrast, the biological and physical science doctorates were younger --approximately 27 and a half years old--and spent less time between degrees (a little over five and a half years). These figures were less than those reported for the total sample. For example, physical science doctorates in the Women, Men and the Doctorate sample were between 29 and 30 years of age and had averaged seven to eight years between degrees. The differences are undoubtedly due to the difficulty in locating GRE scores for older graduates who might not have taken the examination around the year of their B.A. and who therefore would be excluded from this subsample.
It was also more difficult to locate scores for the 1960 graduates. As indicated in Table 5, between 84 and 87 percent of the samples in the three discipline groups had received their Ph.D.s in 1968. With only 15 to 20 doctorates in each field from the earlier time period, the results for those groups should be interpreted cautiously.

-31-
Table 5
Mean of Percentage Estimate for Each Variable, by Field of Study
Variable
Social Biological Physical Sciences Sciences Sciences
1. Sex, percentage male
2. Age at Ph.D.
3. Years between Ph.D. and B.A.
4. Year of Ph.D., percentage 1968
5. Percentage had teaching assistantship
6. Percentage had research assistantship
7. Percentage had fellowship or scholarship
8. Years predoctoral professional experience
9. Percentage of years employed full-time
10. Years in field of study (l=none, 5=all)
11. Academic ability: GRE-V
GRE-Q
GRE Advanced Test
12. Graduate department rating, 5=highest
-_. 13. Percentage in academic employment
14. Percentage teaching
15. Percentage doing research
16. Productivity: Books as sole or sr. author
Books as jr. author or editor
Professional articles
N=94
70
29.5
6.9
86
69
52
75
1.5
93
4.7
610
585
633
2.9
71
52
15
.47
.21
8.8
17. Annual salary (approximate) $18,900.
N=115 N=103
57 63
27.5 27.3
5.6 5.7
87 84
68 83
56 69
90 80
.7 .6
92 94
4.5 4.4
611 612
611 686
635 672
2.9 3.2
77 74
36 29
34 48
.04 .06
.13 .12
8.9 9.2
$17,800. $17,900.

-32-
Certain graduate school experiences were hypothesized to be associated with postgraduate employment and, ultimately, with research productivity. These consisted of whether the graduates had held a teaching or research assistantship, or had received a fellowship or scholarship. The majority of Ph.D.s had held an assistantship, with the highest percentages in physical sciences. Fellowships or scholarships were even more prevalent, having been received by three-fourths of the social scientists, 80 percent of the physical scientists, and 90 percent of biological science doctorates. As also shown in Table 5, over 70 percent of the doctorates in each of the three fields were employed in an academic setting. Fifty-two percent of the social science Ph.D.s said their current major job activity was teaching, compared to 36 percent of the biological science group and 29 percent of the physical scientists. Being in research was certainly expected to lead to more books and articles published: 48 percent of the physical scientists and 34 percent of the biological scientists reported research as their major activity, compared to only 15 percent of the social scientists. The remainder in each disciplinary group, between a fourth to a third, were largely administrators; in the case of social scientists, a small portion were clinicians or provided a service to clients.
Other variables that might be expected to affect research productivity were the number of years of predoctoral professional experience, the percentage of postdoctoral years employed full time, and proportion of these postdoctoral years directly related to one's field of study. As indicated in Table 5, an average of over 90 percent of the Ph.D.s had worked full time, with most in employment directly related to their field. Social science doctorates had averaged a year and a half predoctoral professional experience, which was a little over twice as much as doctorates in the other two fields.
Finally, the questionnaire provided information on the two dependent variables used in this study: productivity and income. Income from employment and related professional activities averaged just under $19,000 for social science doctorates and about a thousand less for biological and physical science doctorates (who were generally two years younger than the social scientists). At this stage in their careers, the social science majors had produced more books than did the Ph.D.s in biological or physical sciences, but there was essentially no difference in the average number of articles published by graduates in the three disciplines-- approximately 9, as indicated in Table 5.
-33-
In the path analysis, the construct "productivity" included the number of articles published, the number of books as sole or senior author, and the number of books as junior author or editor. The confirmatory factor analyses indicated that the number of articles was consistently the best measure of productivity for graduates of each of the three disciplines (see Figures 6, 7, and 8); the weights for scholarly articles were .71 in the social sciences, .69 in the biological sciences, and .61 in the physical sciences. The number of books as a junior author or editor had very high weights for physical sciences (.86) and social sciences (.71), but not for biological sciences (.28). The number of books as sole or senior author had the smallest weight in determining productivity: .52 for physical and social sciences, and .34 for biological sciences. Most like1 .y, the la rge number of doctorates who had not yet any books produced these small weights for the factor.
A second cons truct in the path analysis, academic ability, had three indicators: GRE verbal, quantitative and Advanced Test scores. The average scores for test takers in each of the disciplinary groups were well above the median for the total GRE test-taking population. As shown in Table 5, the GRE verbal scores were very similar for the three disciplines, between 610 and 612, approximately the 79th percentile among all test takers.
yhich is The
published
quantitative scores varied more for the three groups, with social sciences averaging 585 (64th percentile), biological sciences averaging 611 (71st percentile), and physical sciences highest at 686 (86th percentile). On the Advanced Test, the average scores
i for eat (based
h disc on the
plinary group were comparative data fo
generally r the disc
above the iplines in
50th percentile each grouping).
In the physical sciences, academic ability was best measured by the Advanced Test, as shown by the factor weight in Figure 6. The loading of .99 compares to only .31 for GRE quantitative score and .27 for GRE verbal score. The Advanced Test score also had the greatest weight in the social sciences (.94, see Figure 8), although GRE verbal score was also fairly high (.68). For the biological sciences, the verbal score had the greatest weight (.97, see Figure 7); the Advanced Test score followed at .64, and the GRE quantitative score loaded .52. Squaring each of the above weights provides an estimate of the common variance between test scores and the academic ability factor scores (that is, the reliability of each variable as a measure of ability).
5 See footnote 3.

-34-
The last variable included in the analysis was ratings of the graduate departments. These ratings were based on judgments provided by a national sample of peers from the same fields, as reported by Cartter (1966). Some departments were rated "distin- guished" with scores between 4 and 5, while others were not listed in the Cartter report and were coded 1 for the analysis. Other categories were "strong" (scores of between 3 and 4), "good" (3.0), and "adequate plus" (2.0). The mean scores given in Table 5 for departments in the three discipline groups are each around 3.0, suggesting that most of the Ph.D. 's in the study sample had received degrees from departments that were rated above average.
The zero-order correlations among the variables and the path analysis results will be discussed next for each of the three major field areas. Because of the limited sample sizes and the large number of variables analyzed, only path coefficients of .20 or greater are given.
Phvsical Sciences
The path model and path coefficients among the variables for the physical science doctorates are given in Figure 6. Zero-order correlations are presented in Table 6. The strongest influence on productivity was when and where the Ph.D. was received. Because they had more time in which to publish, those who held the doctorate for 13 years were more productive than those who held it for only 5 years; the path coefficient was .38. Ratings of the graduate program had a moderate path coefficient with productivity (.21). Although the academic ability factor did not affect productivity directly, it did correlate .22 with graduate program ratings, indicating that ability helped determine where one went to graduate school, which in turn influenced productivity. Other independent influences on productivity were having had a research assistantship in graduate school (.21), not having had a teaching assistantship, and being employed in acad= (.20). The multiple correlations of all 15 variables on productivity was .62, meaning that about 36 percent of the variance in productivity was accounted for by the variables included in the study.
The multiple correlation of all the variables, including productivity, on income was even higher: .76. Several of the variables had significant independent effects on income. Being employed in a nonacademic setting (academic = -.35) or doing something other than teaching (teaching = -.30) led to higher incomes for physical scientists; so did the extent to which one had been employed full time (.27). And so too did productivity (.24): those who had published more tended to earn more money. Men also tended to earn higher incomes than women, as indicated by the -.22 path coefficient with sex. This means that after controlling for

I 2. Age at Ph.D. I
I 3. Tim between i'i1.D. and B.A. I \1 wl 1 I gooks as sole 11
I Academic Employment J 1 senior"f;uthor ] 1 ‘“~f”5d4~~5”’ I
6. Had research assistantship
7. Had fellowship or scholarship income
8. Prcdoctornl professional experience A
9. Years employed full time c
Multiple correlation:
1 through 12 on 13 = .33 n.s. 1 " i2 on 14 - .37 n.6. 1 " 12 on 15 - .42 n.8. 1 I# 15 on 16 - .62 sig. .OOOl 1 " 16 on 17 = .76 sig. .OOOO
Figure 6. Physical Science Doctor;.tes, Study 2 (N-103)

Table 6
Correlations Among Principal Variables
Physical Sciences (N=103)
12 3 4 5 6 7 8 9 lo 11 12 13 14 15 16
1. Sex (l=Male, 2=Female)
2. Age at Ph.D.
3. Time between Ph.D. and B.A.
4. Year of Ph.D. (1960=2, 1968=1)
5. Had teaching assistantship
6. Had research assistantship
7. Had fellowship or scholarship
8. Predoctoral professional experience
9. Full-time employment (%)
10. Years in field of study (X)
11. Academic ability factor
12. Graduate department rating
13. In academic employment
14. In teaching
15. In research
16. Productivity factor
17. Income
03
09 81
-33_ -03 -09
-02 19 07 03
09 03 05 06 23
-14 14 12 05 -23 14
07 55 58 00 -11 -09 05 --
-34 13 07 12 -05 -10 13 03
12 01 -03 00 11 05 -08 -05 -30
-11 -28 -12 08 -00 10 26 -07 -01 -07
-03 -08 -06 01 11 -02 07 -14 -05 18 22
18 13 11 -17 -09 03 08 14 -07 09 -15 -04
-09 00 00 08 00 -07 11 10 -02 22 -04 -14 29
00 -04 -05 -14 -05 02 00 -10 16 22 07 28 -10 -61
-15 07 -05 33 -18 12 04 09 13 20 -05 22 16 -06 24
-42 01 -05 38 -10 -07 -03 04 38 -07 17 03 -47 -28 09 25 --
Note: Underlined correlations are significantly different from zero at the .Ol level.
-37-
all other variables, including ability, training, type of employment and productivity, women on the average still earned less than men.
Biological Sciences
As indicated by the path coefficients presented in Figure 7, the variables that most determined productivity for the biologi- cal science doctorates were length of professional employment (years since Ph.D., .96) and current employment where one's major job activity was research (.42). The extent to which individuals had been employed in their field of study also affected productivity moderately (.20). Because only 13 percent of the biological science doctorates in the sample were 1960 graduates, the very large path coefficient between year of Ph.D. and productivity may be due to the high publication rates of a small, nonrepresentative sample. The prediction of productivity from the first 15 variables was perfect (multiple correlation of 1.00) because of the .96 path coefficient between year of Ph.D. and productivity.
Five of the variables influenced income directly but pro- ducing articles or books was not one of these, even though the zero-order correlation between productivity and income was .63 (see Table 7). Larger incomes were apparently earned by those in administration than by those in teaching or research. As shown in Figure 7, the path coefficient between teaching as a primary job activity and income was -.52; for research as a primary activity and income it was -.41. Income was also influenced by being an earlier Ph.D. graduate (.34) and by having worked most of the postdoctoral years on a full-time basis (.34). Being a woman, among the biological scientists, also meant receiving less income (-.29), again with all other variables controlled. Women were also more likely to be in teaching (-. 23) and, as indicated above, this too would independent- ly contribute to less income.
Academic ability was not related to either productivity or income. Both the path coefficients and the zero-order correla- tions were trivial. Indeed, for this sample, academic ability was not even related to the ratings of the graduate program. For these biological scientists, then, the number of books and articles were determined to a large extent by number of years of postdegree employment and employment as a researcher.
Social Sciences
The social science doctorates varied more than physical or biological science doctorates in the time they took to complete their Ph.D. and in the amount of time in predoctoral work experi- ence. And as the previous discussion indicated, more of them

2. Age at Ph.D. *
4. Year of Ph.D.
5. Had teaching assistantship
6. HnJ rcsearctl assistantship
7. Had fcllouship or scholarship
8. Predoctoral professional experience
9. Years employed full time
12. Rating of Graduate Program
.Figure 7. Biological Science Doctorwes, Study 2 (N=llS)
Hultiplc correlation:
1 through 12 on 13 - .41 n.sr 1 8, 12 on 14 - .39 n.s. 1 " 12 on 15 = .15 sig. .02 1 II 15 on 16 - 1.00 slg. 1 It 16 on 17 - .8/( 3ig. .OOO

Table 7
Correlations Among Principal Variables
Biological Sciences (N=ll5)
1. Sex (l=Male, 2=Female)
2. Age at Ph.D.
3. Time between Ph.D. and B.A.
4. Year of Ph.D. (1960=2, 1968=1)
5. Had teaching assistantship
6. Had research assistantship
7. Had fellowship or scholarship
8. Predoctoral professional experience
9. Full-time employment (%)
10. Years in field of study
11. Academic ability factor
12. Graduate department rating
13. In academic employment
14. In teaching
15. In research
16. Productivity factor
17. Income
-17
-24 68 --
-34 15 20
-16 02 01 10
-34 07 10 12 17
11 02 08 03 -10 -24
-06 67 48 20 -01 14 -01 --
-36 07 02 12 22 20 -10 13
18 -02 -05 03 08 06 06 -05 -12
14 -38 -27 -16 02 -19 09 -37 -16 34 .- -
02 -11 00 -06 -08 -13 01 -09 -07 10 01
14 07 04 02 -14 -22 10 -09 -17 24 19 01
-14 -01 00 -18 18 07 -06 -06 12 08 -03 -07 10
15 -07 -16 -11 -23 -12 04 -05 02 30 20 17 12 -53
-35 10 10 92 05 10 06 18 25 28 -13 10 -05 -22 26 --
-49 12 18 62 10 24 -01 23 40 -17 -14 01 -16 -30 -15 63
Note: Underlined correlations are significantly different from zero at the .Ol level.
-4o-
considered teaching as their major activity. These differences contributed to a different pattern of relationships among the variables analyzed for social science doctorates, as the path model illustrates (Figure 8). The amount of time between the B.A. and Ph.D. degrees influenced productivity more than any other variable, with those spending more time also publishing more (path coefficient of .64). But the path coefficient of -.29 between productivity and predoctoral work experience indicates that it depends how the time was spent. If the time between degrees was spent at a full-time job, it generally did not result in more publications; but if, for example, it was spent in working with a major professor on a re- search project for an extended period of time, then it often did lead to more publications. The low zero-order correlation between productivity and time between degrees (.05, see Table 8) does not control for the various ways in which the time might have been spent. The fact that age also influenced productivity, with younger social scientists being more productive (-.23), also sup- ports this interpretation.
Although the zero-order correlation between academic ability and productivity was only .09 (see Table 8), the path model indi- cates that academic ability did have some direct influence on productivity (path coefficient of .26). After controlling for the other variables in the study, then, social scientists with higher test scores did tend to publish more. Conducting research as a primary job activity also influenced productivity (.32) as did teaching (.31); in other words, social science doctorates who reported a large number of publications might be researchers or, more likely, teachers who also carried on an active research pro- gram. The remaining social scientists in the group, largely admini- strators or clinicians, had published much less.
As Figure 8 also indicates, doctorates who reported teaching as their primary activity also tended to come from the more highly rated social science programs (.36). Program ratings, moreover, did not affect productivity directly but rather indirectly through the kinds of jobs in which they placed their graduates (teaching at institutions where research and publication were also expected).
A final variable that influenced productivity was the length of time since earning the doctorate (.25). As with the other disci- plines, more time with a doctorate resulted in greater productivity.
Several of the variables affected income directly, though productivity was not one of them. Higher academic ability resulted in higher income (.25) independent of type of employment, rating of graduate school, or other variables. Being employed at a college or

3. Time between Ph.D. and B.A.
4. Year of Ph.D. ,
5. Had teaching assistantship
6. Had rescnrch assistantship
7. Had fellowship or scholarship .
8. PretlocLor31 professional experience
3. Years empioyed full time
*Productivity factor weights:
Professional articles .71 Books, sole or sr. author .52 Books, jr. author or editor .71
or’ (;rnJuatc Program
Figure 8. Social Science Doctorat%, Study 2 (N-94)
Multiple correlation:
1 through 12 on 13 - .50 sig. .02 1 " 12 on 14 - .50 sig. .02 1 II 12 on 15 - .30 n.s. 1 " 15 on 16 = .51 sig. .05 1 " 16 on 17 - .79 sig. .GO
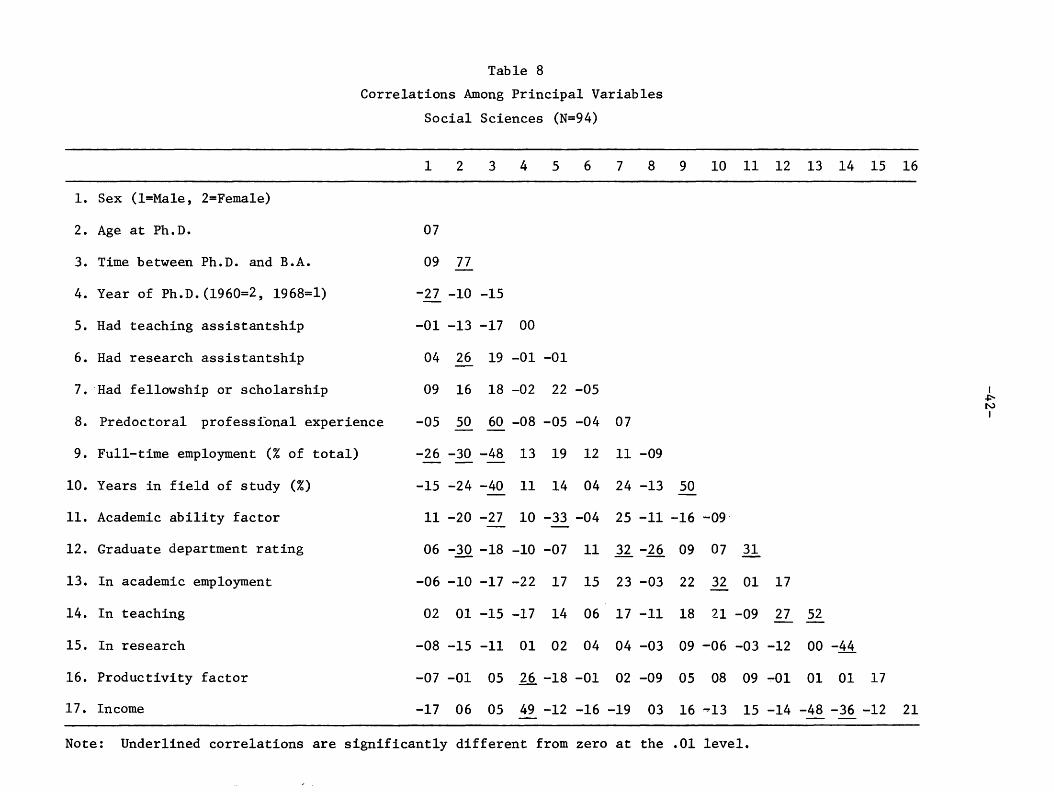
Table 8
Correlations Among Principal Variables
Social Sciences (N=94)
12 3 4 5 6 7 8 9 10 11 12 13 14 15 16
1. Sex (l=Male, 2=Female)
2. Age at Ph.D.
3. Time between Ph.D. and B.A.
4. Year of Ph.D.(1960=2, 1968=1)
5. Had teaching assistantship
6. Had research assistantship
7. Had fellowship or scholarship
8. Predoctoral professional experience
9. Full-time employment (% of total)
10. Years in field of study (X)
11. Academic ability factor
12. Graduate department rating
13. In academic employment
14. In teaching
15. In research
16. Productivity factor
17. Income
07
09 77
-27 -10 -15
-01 -13 -17 00
04 26 19 -01 -01
09 16 18 -02 22 -05
-05 50 60 -08 -05 -04 07 --
-26 -30 -48 13 19 12 11 -09 --m
-15 -24 -40 11 14 04 24 -13 50
11 -20 -27 10 -33 -04 25 -11 -16 -09
06 -20 -18 -10 -07 11 32 -26 09 07 31 --
-06 -10 -17 -22 17 15 23 -03 22 32 01 17
02 01 -15 -17 14 06 17 -11 18 21 -09 27 52 --
-08 -15 -11 01 02 04 04 -03 09 -06 -03 -12 00 -44
-07 -01 05 26 -18 -01 02 -09 05 08 09 -01 01 01 17
-17 06 05 49 -12 -16 -19 03 16 -13 15 -14 -48 -36 -12 21 --
Note: Underlined correlations are significantly different from zero at the .Ol level.
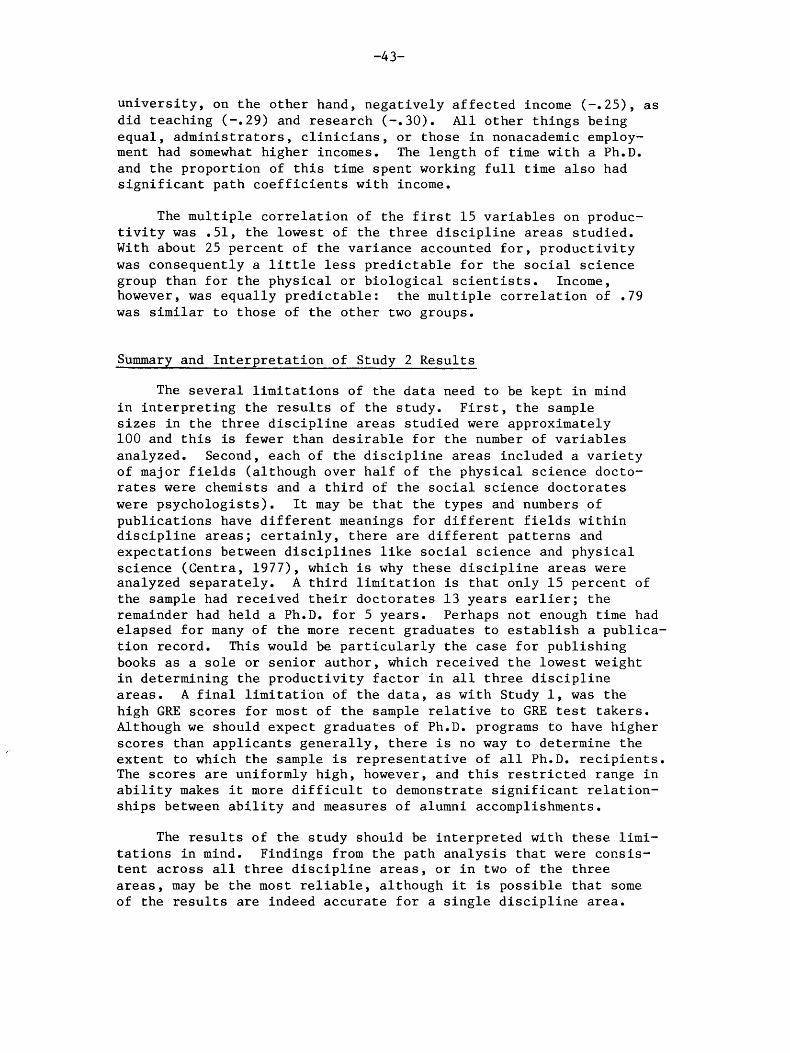
-43-
university, on the other hand, negatively affected income (-.25), as did teaching (-. 29) and research (-.30). All other things being equal, administrators, clinicians, or those in nonacademic employ- ment had somewhat higher incomes. The length of time with a Ph.D. and the proportion of this time spent working full time also had significant path coefficients with income.
The multiple correlation of the first 15 variables on produc- tivity was .51, the lowest of the three discipline areas studied. With about 25 percent of the variance accounted for, productivity was consequently a little less predictable for the social science group than for the physical or biological scientists. Income, however, was equally predictable: the multiple correlation of .79 was similar to those of the other two groups.
Summary and Interpretation of Study 2 Results
The. several limitations of the data need to be kept in mind in interpreting the results of the study. First, the sample sizes in the three discipline areas studied were approximately 100 and this is fewer than desirable for the number of variables analyzed. Second, each of the discipline areas included a variety of major fields (although over half of the physical science docto- rates were chemists and a third of the social science doctorates were psychologists). It may be that the types and numbers of publications have different meanings for different fields within discipline areas; certainly, there are different patterns and expectations between disciplines like social science and physical science (Centra, 1977), which is why these discipline areas were analyzed separately. A third limitation is that only 15 percent of the sample had received their doctorates 13 years earlier; the remainder had held a Ph.D. for 5 years. Perhaps not enough time had elapsed for many of the more recent graduates to establish a publica- tion record. This would be particularly the case for publishing books as a sole or senior author, which received the lowest weight in determining the productivity factor in all three discipline areas. A final limitation of the data, as with Study 1, was the high GRE scores for most of the sample relative to GRE test takers. Although we should expect graduates of Ph.D. programs to have higher scores than applicants generally, there is no way to determine the extent to which the sample is representative of all Ph.D. recipients. The scores are uniformly high, however, and this restricted range in ability makes it more difficult to demonstrate significant relation- ships between ability and measures of alumni accomplishments.
The results of the study should be interpreted with these limi- tations in mind. Findings from the path analysis that were consis- tent across all three discipline areas, or in two of the three areas, may be the most reliable, although it is possible that some of the results are indeed accurate for a single discipline area.

-44-
Type of employment and length of time since receiving the Ph.D. affected productivity most consistently. Being primarily in research or in a teaching and research position were most predictive of the productivity factor, the number of articles and books pub- lished. Academic ability as measured by GRE scores did not directly influence type of employment. In other words, in these samples GRE scores did not determine whether Ph.D.'s took jobs with primary activity as teachers, researchers, administrators, managers, or clinicians, or whether doctorates worked in academic or nonacademic settings.
In addition to type of employment, the quality of the doctorate's graduate program as determined by the Cartter (1966) ratings influ- enced productivity moderately in two of the discipline areas. Academic ability was correlated with program quality as well, so GRE scores may have had some indirect effect on productivity through the quality of the graduate program attended. Graduate school experi- ences, such as having a research assistantship, had a modest influence on productivity or type of employment in only one of the discipline areas. Academic ability had a moderately direct effect on productiv- ity in one discipline area--social sciences. In all three disci- pline areas, the zero-order correlations were insignificant, but controlling for other individual characteristics included in the study did result in the one significant path coefficient between ability and productivity.
The multiple correlations of all the variables in the study on productivity were significant for all three disciplines (highly significant for two). The diversity in the sample, in particular the variation in the length of time that the Ph.D. had been held (5 or 13 years), contributed greatly to the high multiple correlations.
The largest and most consistent determinant of income was type of employment, followed not surprisingly, by length of time with a doctorate. In all three discipline areas, teachers and researchers earned less than administrators and others despite similar back- grounds. In line with these results , productivity influenced income directly (and moderately) in only one of the three areas. Thus, administrators, for one, have the highest incomes but, as pointed out earlier, have not published as much as researcher-teachers. Academic ability had a small direct effect on income in one area and did not have any indirect effects to speak of. Income, then, is something that was generally determined by factors other than academic ability, at least for these samples. One of these factors would appear to be the sex of the individual. Other studies have uncovered differential incomes for men and women with similar experiences and qualifications (Centra, 1974; Johnson & Stafford, 1973); but the path analysis in this study controlled for several additional variables, such as academic ability, productivity, and predoctoral experience, and found that, in two of the areas, being a
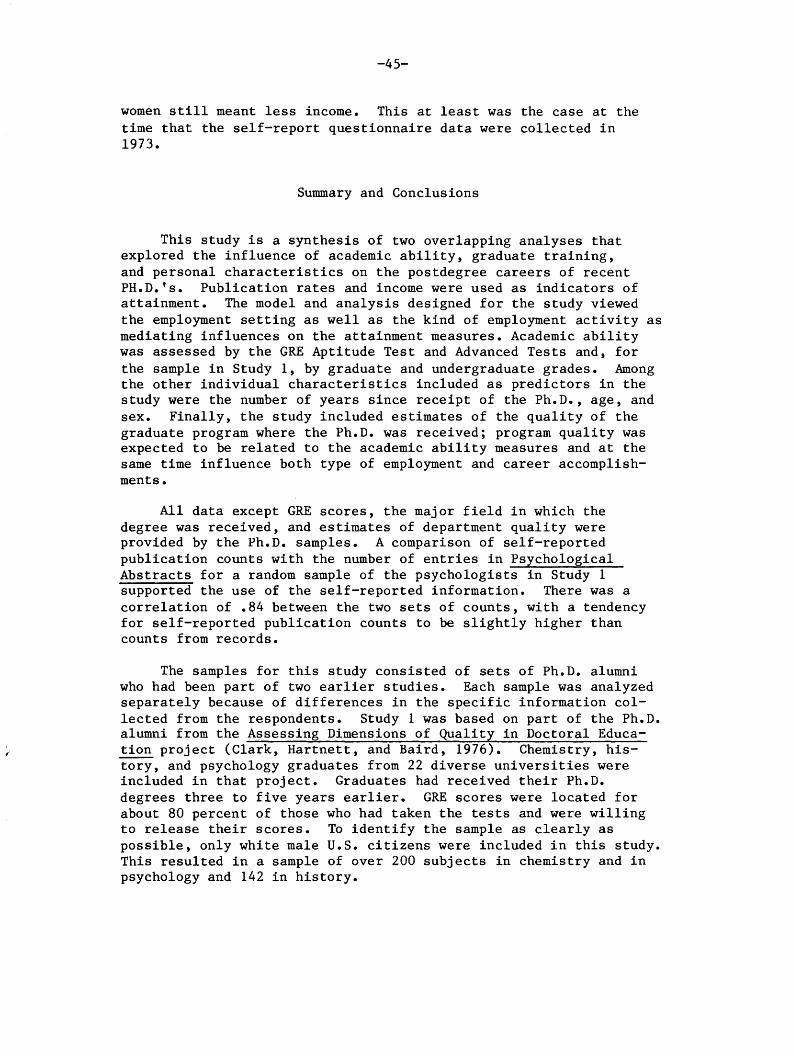
-45-
women still meant less income. This at least was the case at the time that the self-report questionnaire data were collected in 1973.
Summary and Conclusions
This study is a synthesis of two overlapping analyses that explored the influence of academic ability, graduate training, and personal characteristics on the postdegree careers of recent PH.D.%. Publication rates and income were used as indicators of attainment. The model and analysis designed for the study viewed the employment setting as well as the kind of employment activity as mediating influences on the attainment measures. Academic ability was assessed by the GRE Aptitude Test and Advanced Tests and, for the sample in Study 1, by graduate and undergraduate grades. Among the other individual characteristics included as predictors in the study were the number of years since receipt of the Ph.D., age, and sex. Finally, the study included estimates of the quality of the graduate program where the Ph.D. was received; program quality was expected to be related to the academic ability measures and at the same time influence both type of employment and career accomplish- ments.
All data except GRE scores, the major field in which the degree was received, and estimates of department quality were provided by the Ph.D. samples. A comparison of self-reported publication counts with the number of entries in Psychological Abstracts for a random sample of the psychologists in Study 1 supported the use of the self-reported information. There was a correlation of .84 between the two sets of counts, with a tendency for self-reported publication counts to be slightly higher than counts from records.
The samples for this study consisted of sets of Ph.D. alumni who had been part of two earlier studies. Each sample was analyzed separately because of differences in the specific information col- lected from the respondents. Study 1 was based on part of the Ph.D. alumni from the Assessing Dimensions of Quality in Doctoral Educa- tion project (Clark, Hartnett, and Baird, 1976). Chemistry, his- tory, and psychology graduates from 22 diverse universities were included in that project. Graduates had received their Ph.D. degrees three to five years earlier. GRE scores were located for about 80 percent of those who had taken the tests and were willing to release their scores. To identify the sample as clearly as possible, only white male U.S. citizens were included in this study. This resulted in a sample of over 200 subjects in chemistry and in psychology and 142 in history.

-46-
The second study used data from the Women, Men and the Doctorate survey (Centra, 1974). In comparison to the sample for Study 1, this second sample was more diverse: about 15 percent had received their degrees 13 years earlier, while the remainder had received a Ph.D. 5 years prior to being contacted; just over a third were women; and their degrees came from 88 universities. Relative to the Study 1 sample, however, the sample size was somewhat smaller. GRE scores were available for 94 of the respondents in social sciences, 115 in biological sciences, and 103 in physical sciences. Graduates were grouped into these broad discipline areas in order to provide large enough N's for analysis.
The average GRE scores for the samples in Study 1 and Study 2 were well above the median for the GRE test-taking population. Since these were Ph.D. graduates rather than applicants, it is not surprising that their scores would be relatively higher. It is difficult to judge how representative the samples are of all Ph.D. recipients, but it is likely that the samples included a wider range of measured ability level than have most previous studies.
An hypothesized causal model of variables to explain differ- ences in outcomes (number of publications or income) was evaluated through the use of path analysis. Path (partial regression) coefficients were computed; these provided estimates of the associa- tion between pairs of variables when all other variables in the model are statistically controlled. The model included three factors or constructs that were assessed by multiple measures: academic ability, productivity, and, in Study 1, program quality. Academic ability consisted of the GRE verbal and quantitative ability, and Advanced Test scores for all six of the major fields or discipline areas studied; for three fields (Study 1), undergraduate and graduate school grades were also included. A confirmatory factor analysis indicated that graduate grades, and to a lesser extent undergraduate grades, had the smallest loadings and were therefore the least reliable measures of the construct "academic ability". It is likely that the severe restriction in the range of grades given in most graduate programs leads to relatively unreli- able estimates of academic performance, resulting in the very small contribution of this variable to the ability factor.
The productivity factor included the number of professional articles and books for all six analyses; in Study 1, it also included the number of presentations at regional or national meetings, book chapters, and book reviews. In general, the number of authored books received the smallest loading and was therefore the least reliable indicator of productivity, especially for the Ph.D.'s who had received their degrees only three to five years earlier. Since most of the graduates had not yet published a book, it may be that the number of books will provide a more reli- able indicator of productivity at a later time.

-47-
The academic quality of the program was assessed through multiple measures only in Study 1. The highest loadings were on measures of the research orientation of the program and the quality of the graduate faculty. In Study 2, ratings of graduate faculty provided by a national sample of peers from the same fields, as reported by Cartter (1966), were used as an estimate of program quality.
Results based on any one of the six major field or discipline areas from the two studies may be subject to sampling or measurement error. But some fairly consistent findings emerge when viewing the results across all six analyses. Although the academic ability construct did not generally affect productivity or income directly, it correlated significantly with the quality of the program that granted the Ph.D. (A median corelation of .43 between the three GRE scores and reputational ratings in Study 1.) Program quality, in turn, was an important determinant of whether graduates were employed in positions that emphasized research or teaching and research. Employment in such positions, according to the path analyses, influenced productivity in each of the subsamples. Thus, ability and training appeared to influence productivity largely through the employment setting and the primary work activity.
The other direct influences on productivity were the number of years since receving the doctorate or other time-related variables. Most porfessional publications and presentations come after receiving the doctoral degree; it is not surprising, therefore, that those who received their degrees in 1970 had been more produc- tive than those who received degrees in 1972, or that those who received their degrees 13 years rather than 5 years earlier had published more. The length of time since earning the doctorate also positively influenced income in five out of six of the subsamples. Productivity helped to determine income in the samples of histori- ans, psycholigists, and physical scientists, but not in the other three samples. Employment as a college or university faculty member, or as an academic or nonacademic researcher, had a negative impact on income in all six subsamples. Those employed as administrators or as clinicians tended to report higher earnings. Academic ability, for the most part, did not affect income.
Study 2, with both men and women in the sample, also demonstra- ted sex differences in income. The path analyses indicated that women in the biological and physical sciences earned less than men in these areas after all other variables in the study were controlled. In other words, after taking into account such critical vari- ables as productivity, type of employment, and length of experience, women reported less income than men. Income included not only salary but consulting fees, royalties, and other professionally related activities. It is possible that men had more opportunities for these salary supplements than did women. Thus, it is not clear

-48-
if the sex differences in incomes might reflect bias.
were also salary differences that
Previous research conducted with samples having similar amounts of postdoctoral experience as most of the Ph.D's in this study also reported no significant relationship between GRE scores and number of publications (Folger, Astin, and Bayer, 1970). The possibility that additional time and experience might produce at least modest correlations between GRE scores and publications is indicated by findings from Creager and Harmon (1966) and, more recently, by Schrader (1977). In these studies a minimum of 10 years in which to carry out research and publish.the results produced higher corrrelations with citation counts. Even with more time, however, it is unlikely that GRE scores or other esti- mates of academic ability would be highly related to such career attainments as publictions and income in ways that are independent of employment and other personal characteristics. Indeed, the results of this study are not unlike those conducted with samples of physicians that were mentioned earlier (Price, et al., 1971) and masters of business administration. The Crooks, et al., study (1979) of MBAs found little relationship between indicators of career progress (salary, management level reached, satisfaction, and other measures) and either admission test scores or grades. However, MBAs with different personal characteristics did go into different kinds of positions, and while the kind of data used to make admis- sions decisions did not predict career progress in these positions, personal characteristics did do so.
In conclusion, although there have been a number of studies concerning the publication records of academicians, the study reported here is among the first to systematically investigate the determinants of scholarly productivity more generally. Several consistent results emerged from six seaparate analyses despite differences in academic area and relatively small sample sizes. Efforts in future studies to measure additional variables and to amass larger samples should produce even more definitive results.
-49-
References
Baird, L. L. Using self-reports to predict student performance. New York: College Entrance Examination Board, 1976.
Bayer, A. E., & Folger, J. Some correlates of a citation measure of productivity in science. Sociology of Education, 1966, 39, 381-390.
Cartter, A. M. An assessment of quality in graduate education. Washington, D.C.: American Council on Education, 1966.
Centra, J. A. Women, men and the doctorate. Princeton, N.J.: Educational Testing Service, 1974.
Centra, J. A. How universities evaluate faculty performance: A survey of department heads. GRE Board Research Report No. 75-5bR, Princeton, N.J.: Educational Testing Service, 1977.
Clark, M. J., Hartnett, R. T., & Baird, L. L. Assessing dimensions of quality in doctoral education: A technical report of a national study in three fields. Princeton, N. J.: Educational Testing Service, 1976.
Clemente, F. Early career determinants of research productivity. American Journal of Sociology, 1973, 78, 409-419.
Creager, J. A., & Harmon, L. R. On-the-job validation of selection variables. Technical Report No. 26, Office of Scientific Personnel, National Academy of Sciences, National Research Council, Washington, D.C., 1966.
Crooks, L. A., Campbell, J. T., Rock, D. A. Predicting career progress of graduate students in management. Research Report 79-15. Princeton, N. J.: Educational Testing Service, 1979.
Folger, J. K., Astin, H. S., & Bayer, A. E. Human resources and higher education. New York: Russell Sage Foundation, 1970.
Fulton, O., & Trow, M. Research activity in American higher education. Sociology of Education, 1974, 47, 29-73.
Hagstrom, W. Inputs, outputs and the prestige of university science departments. Sociology of Education, 1971, 44, 375-397.

-5o-
Harrell, T. W. The personality of high earning MBAs in big business. Personnel Psychology, 1969, 22, 457-463.
Johnson, G. E. & Stafford, F. P. The earnings and promotion of women faculty. Department of Economics, University of Michigan, 1973.
Joreskog, K. G. A general approach to confirmatory maximum likelihood factor analysis. Psychometrika, 1969, 34, 183-202.
Kaufman, H. G. Relations of ability and interest to currency of professional knowledge among engineers. Journal of Applied Psychology, 1972, 56, 495-499.
Lannholm, G. V., Marco, G. L., Schrader, W. B. Cooperative studies of predicting graduate school success. Graduate Record Examinations Special Report No. 68-3. Princeton, N.J.: Educational Testing Service, 1968.
Price, P. B., Taylor, C. W., Nelson, D. E., Lewis, E. G., Loughmiller, G. D., Mathiesen, R., Murray, S. L., & Maxwell, J. G. Measurement and predictors of physician performance. Salt Lake City, Utah: LLR Press, 1971.
Schrader, W. B. Admission test scores as predictors of career achievement in psychology. Research Report 76-1R. Princeton, N.J.: Educational Testing Service, 1978.
Werts, C. E., ii Linn, R. L. Path analysis: Psychological examples. Psychological Bulletin, 1970, 74, 193-212.
Willingham, W. W. Predicting success in graduate education. Science, 1974, 183, 273-278.

-51-
Appendix A
THE COUNCIL OF
GRADUATE SCHOOLS
IN THE UNITED STATES
One DuPont Cirde, N.W., Washington, D. C. 2OO36 l Phone: Area Code 202: 22.3-j 791
June, 1975
Dear Graduate School Alumnus:
J. BOYD PAGE Preden t
We need your help in a major national research effort to develop better ways of describing university programs of doctoral study. Sponsored by the Council of Graduate Schools with funds from the National Science Foundation, the project is collecting information from faculty members, doctoral students, and department alumni in three departments at 20 randomly selected universities across the country. Your former department is one of those chosen for partici- pation in the field study.
The questionnaire on the following pages will take about a half-hour of your time to complete. An envelope is provided to insure the confidentiality of your responses; your completed questionnaire will be seen only by the research staff, and summaries of the information will not identify univer- sities by name in any report of the project. However, your former department will receive a facul ty members
S
9
umma ry of respons es made by it s do ct oral students, graduate and alumni that can be used f or s el .f-study and program
improvement.
The purpose of this project is to identify and measure a variety of characteristics of doctoral programs that are related to the achievement of educational excellence. In addition to the usefulness of such measures for program review, they would improve information available for the guidance of prospective graduate students.
We think you will find the questionnaire interesting to answer and invite your comments on the items as well as your experiences in this program.
', The accuracy of the research findings, and of the summary report that
will be returned to your department, is dependent on your candid response to the following questions. We believe the importance of the study will justify the time you give it. Please complete the questionnaire and return it while you have it at hand.
On behalf of the Council of Graduate Schools, I thank you for your cooperation.
Sincerely,
President

Please print: Your name
awarded you your doctorate
-52-
.(. . . *I’
Field
University which
CGS GRADUATE ALUMNI QUESTIONNAIRE
1. To what extent do you agree with the fol ,,-Ging statements about the department in which you did your doctoral study and its doctoral programs of study? Please give your opinion based on your best recollection of your graduate school experiences. (Circle one number on each line.)
a.
b.
c.
d.
e.
f.
g*
h.
i.
j-
k.
1.
a
Agree strongly (4) Agree with reservations (3)
Disagree with reservations (2) Disagree strongly (1)
A single "school of thought" or scholarly viewpoint L I 11 dominated the department.. . . . . . . . . . . . . ‘. . . . . . 1 2 ’ 3 4
It was fairly common for students in the department to get the feeling that they were being used or exploited by members of the faculty.. . . . . . . . . . . . . . . . . . . . 1 2 3 4
I consider the graduate program one of the best in the field.. . 1 2 3 4
The department had a humane environment characterized by mutual respect and concern between students and professors.. . 1 2 3 4
Departmental practices created a lot of tension in students. . . 1 2 3 4
I would advise a friend with similar interests to study in this department.. . . . . . . . . . . . . . . . . . . 1 2 3 4
There were many opportunities to take courses in other programs and fields. . . . . . . . . . . . . . . . . . . . . . 1 2 3 4
I learned a great deal as a student in this department.. . . . . 1 2 3 4
Faculty members emphasized ways in which knowledge and skills in the field could be used to solve social problems and improve society. . . . . . . . . . . . . . . . . . . . . . . . 1 2 3 4
Competition among students was encouraged in the department. . . 1 2 3 4
Students supported and helped each other meet the academic demands of the program.. . . . . . . . . . . . . . . . . . l . 1 2 3 4
The department was a stimulating and exciting place to study.. . 1 2 3 4
How would you rate your former department's faculty and programs? If an item listed below doesn't apply to your field, or if you feel you cannot respond, skip the item. (Circle one number on each line.)
Excellent (4) Good (3) ’
Fair (2) Poor (1)
2. Characteristics of the Graduate Faculty 1111
a.
b.
c.
d.
Accessibility to students . . . . . . . . . . . . . . . . . . . . 1 2 3 4
Useful criticism of your work .................. 1 2 3 4
Concern for your professional development ............ 1 2 3 4
Guidance in the selection of courses .............. 1 2 3 4
CopyrIght @ 1975 by Educational Testing Service. All rights reserved.
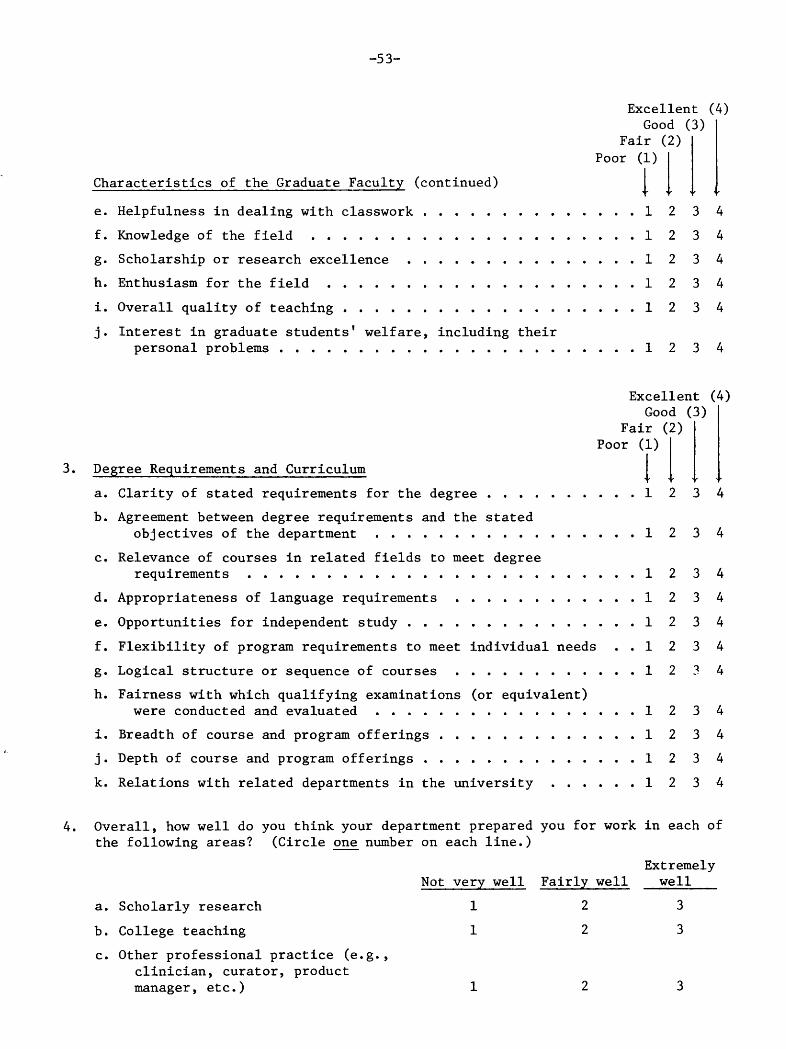
-53-
Excellent (4) Good (3)
Fair (2) Poor (1)
Characteristics of the Graduate Faculty (continued) ,111
e. Helpfulness in dealing with classwork . . . . . . . . . . . . . . 1 2 3 4
f. Knowledge of the field . . . . . . . . . . . . . . . . . l . . l 1 2 3 4
g. Scholarship or research excellence . . . . . . . . . . . . . . . 1 2 3 4
h. Enthusiasm for the field . . . . . . . . . . . . . . . . . . . . 1 2 3 4
i. Overall quality of teaching . . . . . . . . . . . . . . . . . . . 1 2 3 4
j* Interest in graduate students' welfare, including their personal problems . . . . . . . . . . . . . . . . . . . . . . . 1 2 3 4
Excellent (4) Good (3)
Fair (2) Poor (1)
3. Degree Requirements and Curriculum !1lI
a. Clarity of stated requirements for the degree . . . . . . . . . . 1 2 3 4
b. Agreement between degree requirements and the stated objectives of the department . . . . . . . . . . . . . . . . . 1 2 3 4
c. Relevance of courses in related fields to meet degree requirements . . . . . . . . . . . . . . . . . . . . . . . . . 1 2 3 4
d. Appropriateness of language requirements . . . . . . . . . . . . 1 2 3 4
e. Opportunities for independent study . . . . . . . . . . . . . . . 1 2 3 4
f. Flexibility of program requirements to meet individual needs . . 1 2 3 4
g. Logical structure or sequence of courses . . . . . . . . . . . . 1 2 3 4
h. Fairness with which qualifying examinations (or equivalent) were conducted and evaluated . . . . . . . . . . . . . . . . . 1 2 3 4
i. Breadth of course and program offerings . . . . . . . . . . . . . 1 2 3 4
j. Depth of course and program offerings . . . . . . . . . . . . . . 1 2 3 4
k. Relations with related departments in the university . . . . . . 1 2 3 4
4. Overall, how well do you think your department prepared you for work in each of the following areas? (Circle one number on each line.)
Extremely Not very well Fairly well well
a. Scholarly research 1 2 3
b. College teaching 1 2 3
c. Other professional practice (e.g., clinician, curator, product manager, etc.) 1 2 3
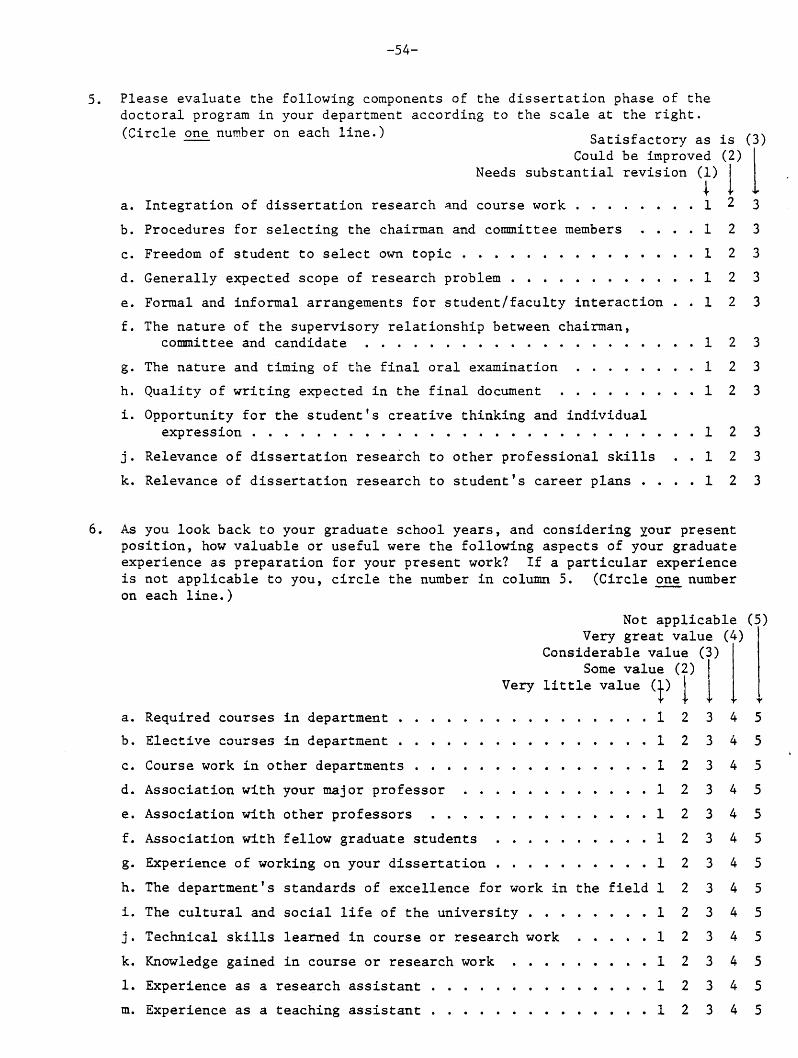
-54-
5. Please evaluate the following components of the dissertation phase of the doctoral program in your department according to the scale at the right. (Circle one number on each line.) Satisfactory as is (3)
Could be improved (2) Needs substantial revision (1)
1 Ii r a. Integration of dissertation research and course work . . . . . . . . 1 2 3
b. Procedures for selecting the chairman and committee members . . . . I 2 3
c. Freedom of student to select own topic . . . . . . . . . . . . . . . 1 2 3
d. Generally expected scope of research problem . . . . . . . . . . . . 1 2 3
e. Formal and informal arrangements for student/faculty interaction . . 1 2 3
f. The nature of the supervisory relationship between chairman, committee and candidate . . . . . . . . . . . . . . . . . . . . . 1 2 3
g. The nature and timing of the final oral examination . . . . l . . . 1 2 3
h. Quality of writing expected in the final document . . . . . . . . . 1 2 3
i. Opportunity for the student's creative thinking and individual expression............................ 1 2 3
jg Relevance of dissertation research to other professional skills . . 1 2 3
k. Relevance of dissertation research to student's career plans . . . . 1 2 3
6. As you look back to your graduate school years, and considering your present position, how valuable or useful were the following aspects of your graduate experience as preparation for your present work? If a particular experience is on
a.
b.
c.
d.
e.
f.
g-
h.
i.
j.
k.
1.
m.
not applicable to you, circle the number in column 5. (Circle one number each line.)
Not applicable (5) Very great value (4)
Considerable value (3) Some value (2)
Very little value ( iii
) I Y
Required courses in department . . . . . . . . . . . . . . l l 1 2 3 4 5
Elective courses in department . . . . . . . . . . . . . . s l 1 2 3 4 5 .
Course work in other departments . . . . l . . . . . . . . . l 1 2 3 4 5
Association with your major professor . . . . . . . . l . l l 1 2 3 4 5
Association with other professors . . . . . . . . . . . l l . 1 2 3 4 5
Association with fellow graduate students . . . . . . . . l l 1 2 3 4 5
Experience of working on your dissertation . . . . . . l l . l 1 2 3 4 5
The department's standards of excellence for work in the field 1 2 3 4 5
The cultural and social life of the university . . . . . l . . 1 2 3 4 5
Technical skills learned in course or research work . . l . l 1 2 3 4 5
Knowledge gained in course or research work . . . l . . . l l 1 2 3 4 5
Experience as a research assistant . . . . . . . . . . . . . . 1 2 3 4 5
Experience as a teaching assistant . . . . . . . . . . . . . . 1 2 3 4 5

-55-
To be able to analyze our results as meaningfully as possible, we would like to know a few things about you. Please check one response or fill in the blank for each of the following items.
7. What is your sex?
() Male ( ) Female
8. What is your age?
9. Are you a United States citizen?
() Yes ( ) No
10. How
()
do you describe yourself?
() () () ()
() ()
American Indian or Native American
Black, Afro-American or Negro Mexican-American or Chicano Oriental or Asian-American Puerto Rican or Spanish-
speaking American White or Caucasian Other
11. Approximately what overall grade average did you receive in under- graduate school, and what grades did you receive in graduate study? (Important: If your college did not use letter grades--A, B, C, etc. --please mark the letter grade that is the closest equivalent to your grade average. Circle one number in each column.)
Graduate grades Undergraduate grades
# 1 C or lower (2.49 or below) 1 1
C+ (2.50 - 2.99) 2 2
B (3.00 - 3.24) 3 3
B+ (3.25 - 3.49) 4 4
A to A+ (3.50 - 3.99) 5 5
All A's (4.00) 6 6
No grades 7 7
13. Indicate (a) your field of graduate study and (b) the one sub-specializa- tion with which youidentify most closely.
(a) Field
I (9) Specialization ( )
1 1 I ( ) CHEMISTRY ( ) Analytical ( ) Biochemical ( ) Inorganic
j. ( ) Organic ( ) Physical ( ) Other
( ) HISTORY ( ) Ancient ( ) Medieval ( ) Modern
( ) PSYCHOLOGY ( ) Educational ( ) Measurement ( ) Personality ( ) Developmental ( ) Experimental
( ) American ( ) Third-world ( > Other
( ) Clinical ( ) Social ( ) Other
( ) Organizational
14. How helpful were each of the follow- ing in finding a job for you when you completed doctoral study? (Circle one number on each-ne.) Very helpful (3)
Of some help (2) Not at all helpful (1)
My department's formal or 111 informal efforts . . . . 1 2 3
The assistance of individual professors . . ‘1 2 3
The university placement office . . . . . . . . . 1 2 3
Openings listed with professional association 1 2 3
Letters sent directly to prospective employers . . 1 2 3
12. In what year did you receive your doctorate?
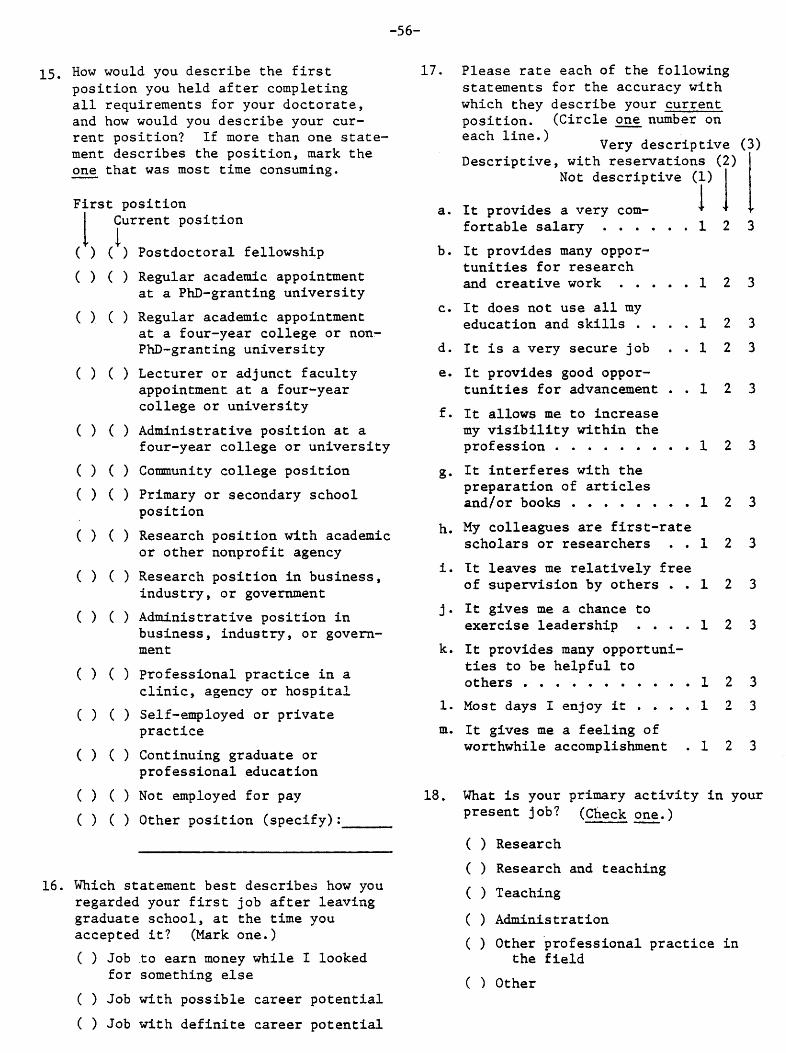
-56-
15.
16.
How would you describe the first position you held after completing all requirements for your doctorate, and how would you describe your cur- rent position? If more than one state- ment describes the position, mark the one that was most time consuming.
First position 1 Current position
1 1 0 0
0 0
0 0
0 0
0 0
0 0
0 0
0 0
0 0
0 0
0 0
0 0
0 0
0 0
0 0
Postdoctoral fellowship
Regular academic appointment at a PhD-granting university
Regular academic appointment at a four-year college or non- PhD-granting university
Lecturer or adjunct faculty appointment at a four-year college or university
Administrative position at a four-year college or university
Community college position
Primary or secondary school position
Research position with academic or other nonprofit agency
Research position in business, industry, or government
Administrative position in business, industry, or govem- ment
Professional practice in a clinic, agency or hospital
Self-employed or private practice
Continuing graduate or professional education
Not employed for pay
Other position (specify):
Which statement best describes how you regarded your first job after leaving graduate school, at the time you accepted it? (Mark one.)
( > Job for
( ) Job
( > Job
to earn money while I looked something else
with possible career potential
with definite career potential
17. Please rate each of the following statements for the accuracy with which they describe your current position. (Circle one number on each line.)
a.
Very descriptive (3) Descriptive, with reservations (2)
Not descriptive (1) I I I
It provides a very com- J 4 J fortable salary . . . . . . 1 2 3
b.
c.
d.
e.
f.
g*
h.
i.
k.
1.
m.
It provides many oppor- tunities for research and creative work . . . . . 1 2 3
It does not use all my education and skills . . . . 1 2 3
It is averysecurejob . . 1 2 3
It provides good oppor- tunities for advancement . . 1 2 3
It allows me to increase my visibility within the profession . . . . . . . . l 1 2 3
It interferes with the preparation of articles and/or books . . . . . . . . 1 2 3
My colleagues are first-rate scholars or researchers . . 1 2 3
It leaves me relatively free of supervision by others . . 1 2 3
It gives me a chance to exercise leadership . . . . 1 2 3
It provides many opportuni- ties to be helpful to others . . . . . . . . . . . 1 2 3
Most days I enjoy it . . . . 1 2 3
It gives me a feeling of worthwhile accomplishment . 1 2 3
18. What is your primary activity in your present job? (Check one.) --
( ) Research
( ) Research and teaching
( ) Teaching
( ) Administration
( ) Other professional practice in the field
( ) Other
-57-
19.
20.
21.
22.
23.
24.
25.
Is your present position:
( ) Full time
( ) Part time
26.
If you hold an academic position, what is your present academic rank?
( ) Do not hold rank designation
( ) Professor
( ) Associate professor
( ) Assistant professor
( ) Lecturer or Instructor
( ) Other
What is your approximate annual income from employment and related professional activities (e.g., honoraria, royalties)? Include salary before deductions but without fringe benefits paid by the employer. (Check one.) --
( ) Less than $10,000
( ) $10,000 - $14,999
( ) $15,000 - $19,999
( ) $20,000 - $24,999
( ) $25,000 - $29,999
( ) $30,000 - or above
If you hold an academic position, how would you describe your prospects for tenure?
( > Very good
( ) Good
( ) Unsure
( ) Poor
( > Very poor
27. Please list the number of your publi- cations or presentations in each of the following areas. Include items prepared alone or in collaboration with others.
Publications Number
Since completing your dissertation, have you done subsequent research in the same area as that of your dissertation? ( ) Yes ( ) No
Professional articles and single chapters in books
Scholarly book reviews
Authored books
Edited books or anthologies
Monographs and manuals
Presentations
Have you published any part of your At regional or national dissertation? ( ) Yes ( ) No professional meetings
To what extent is your job related to your graduate field of study?
( ) Not at all related
( ) Somewhat related
( > Highly related
At scholarly colloquia at own or other institution
Did you ever take the Graduate Record Examinations?
Do you consider yourself under- employed in your present position because it is not in your field or not consistent with your level of training and experience?
( ) Yes
28.
29.
30.
( ) Yes ( ) No
If yes, would you be willing to release your scores for research purposes?
( ) Yes ( ) No
( ) No
If yes, what is your best recol- lection of the month and year when you last took the test?
Month Year
-58-
We invite your additional comments about your former department as a place for doctoral study. Your reactions to this questionnaire as a means of systematically collecting the opinions of graduate school alumni about their programs are also welcome.
Please seal your completed questionnaire in the accompanying envelope and drop it in the mail. Thank you for completing the questionnaire.
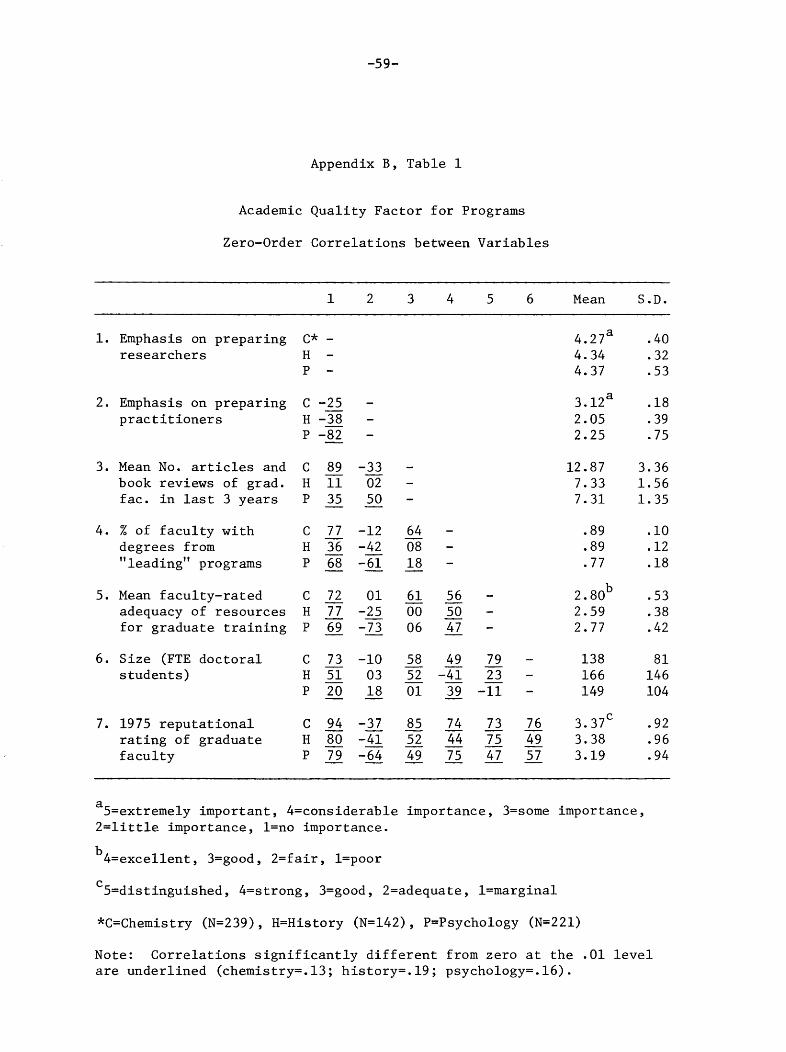
-59-
Appendix B, Table 1
Academic Quality Factor for Programs
Zero-Order Correlations between Variables
12 3 4 5 6 Mean S.D.
1. Emphasis on preparing C* - 4.27a .40 researchers H - 4.34 .32
P - 4.37 .53
2. Emphasis on preparing C -25 - 3.12a .18 practitioners H-3 - 2.05 .39
P-E - 2.25 .75
3. Mean No. articles and C 89 -33 book reviews of grad. H 11 02 fat. in last 3 years P 35 50 --
4. % of faculty with c 77 -12 degrees from H 36 -42 "leading" programs P 68 -zi --
5. Mean faculty-rated C 72 01 adequacy of resources H 77 -25 for graduate training P 69 -% --
6. Size (FTE doctoral c 73 -10 students) H 51 03
P -% 18 --
7. 1975 reputational c 94 -37 rating of graduate H 80 -;;;i faculty P 79 -=z --
64 08 18
61 00 06
58 52 01
85 52 49
56 - 50 - 47-
49 79 --G 23 39 -ii
74 73 44 75 75 47 --
12.87 3.36 7.33 1.56 7.31 1.35
.89 .lO
.89 .12
.77 .18
2.80b .53 2.59 .38 2.77 .42
138 81 166 146 149 104
76 3.37c 49 3.38 57 3.19
.92
.96
.94
a5=extremely important, 4=considerable importance, 3=some importance, 2=little importance, l=no importance.
b4 =excellent, 3=good, 2=fair, l=poor
'5=distinguished, Cc=strong, 3=good, 2=adequate, l=marginal
*C=Chemistry (N=239), H=History (N=142), P=Psychology (N=221)
Note: Correlations significantly different from zero at the .Ol level are underlined (chemistry=.13; history=.19; psychology=.16).
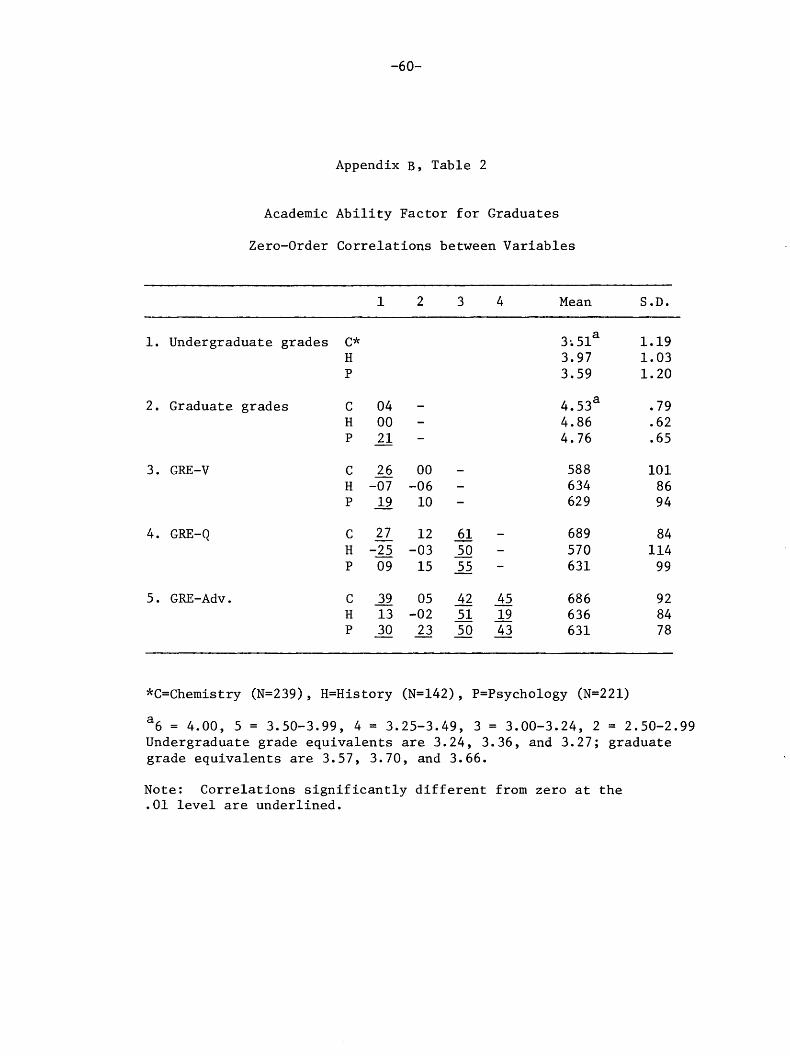
-6O-
Appendix B, Table 2
Academic Ability Factor for Graduates
Zero-Order Correlations between Variables
12 3 4 Mean S.D.
1. Undergraduate grades C* H P
2. Graduate grades C 04 H 00 P 21
3. GRE-V C 26 00 588 H -07 -06 634 P _lJ 10 629
4. GRE-Q C 27 H -z P 09
5. GRE-Adv. C 39 H 13 P 30
12 61 - 689 84 -03 50 - 570 114
15 55 - 631 99
05 -02 23
3;51a 3.97 3.59
4.53a .79 4.86 .62 4.76 .65
42 45 686 51 19 636 50 43 631 --
1.19 1.03 1.20
101 86 94
92 84 78
*C=Chemistry (N=239), H=History (N=142), P=Psychology (N=221)
a6 = 4.00, 5 = 3.50-3.99, 4 = 3.25-3.49, 3 = 3.00-3.24, 2 = 2.50-2.99 Undergraduate grade equivalents are 3.24, 3.36, and 3.27; graduate grade equivalents are 3.57, 3.70, and 3.66.
Note: Correlations significantly different from zero at the .Ol level are underlined.

-61-
Appendix B, Table 3
Research Productivity Factor for Graduates
Zero-Order Correlations between Variables
12 3 4 5 6 Mean S.D.
1.
2.
3.
4.
5.
6.
7.
Number of professional c* - 6.67 7.15 articles and single H - 2.79 3.83 chapters in books P - 5.40 5.82
Number of scholarly book reviews
c 02 - .ll .74 H 45 - 3.04 6.69 PE- .33 1.29
Number of authored books
c -01 02 - H 16 06 - P 26 24 - --
.06 .55
.23 .45
.07 .29
Number of edited c -01 03 _7J - .03 .25 books or antho- H 14 06 17 - .13 .37 logies P 22 06 -04 - .02 .15
Number of monographs and manuals
c -04 02 13 16 - .16 .60 H -10 -06 15 24 - .06 .23 P 07 04 17 -E - .18 .54
Number of presenta- c 49 -04 -01 -01 15 - 2.16 2.87 tions at regional or H =% 30 14 19 ?@ - 1.86 2.29 national Prof. mtgs. P 53-B 27 ?ji- 27 - 3.44 4.74
No. presentations at C 28 06 16 18 17 34 ---- 2.18 4.08 1.33 2.57 2.02 3.72
scholarly colloquia at H 26 12 10 14 10 45 own or other inst'n P -% 00 07 06 16 44 --
*C=Chemistry (N=239), H=History (N=142), P=Psychology (N=221)
Note: Correlations significantly different from zero at the .Ol level are underlined.
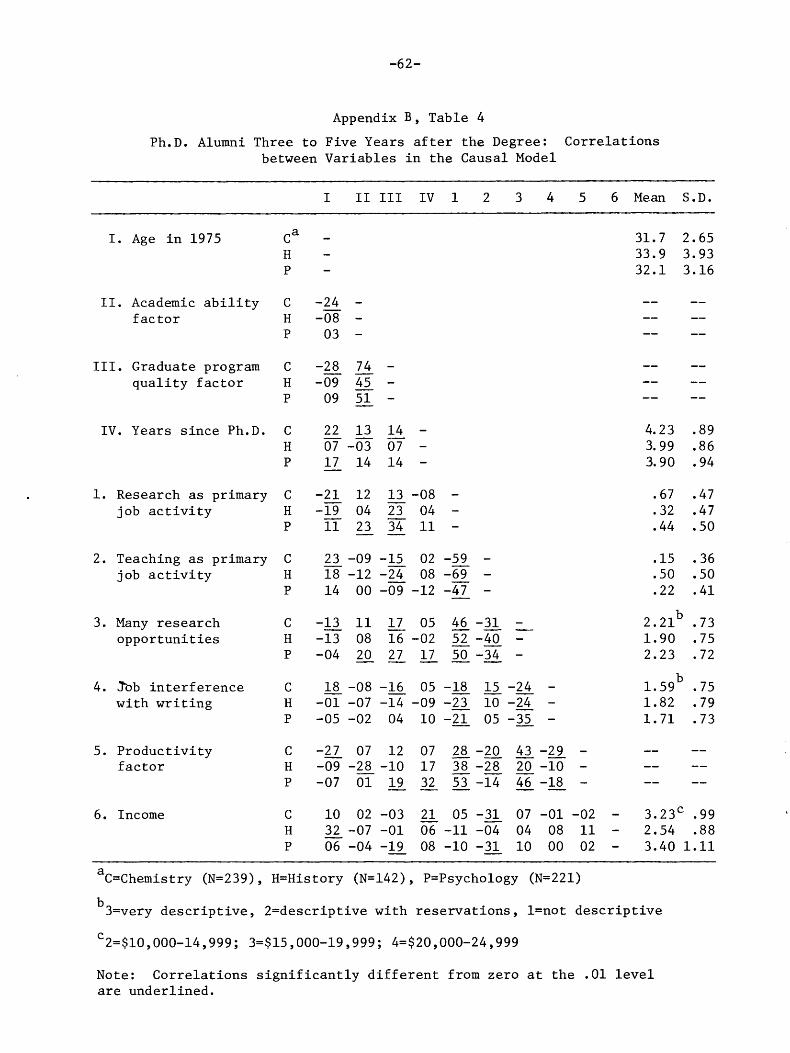
-62-
Appendix B, Table 4
Ph.D. Alumni Three to Five Years after the Degree: Correlations between Variables in the Causal Model
I II III IV 1 2 3 4 5 6 Mean S.D.
I. Age in 1975
II. Academic ability factor
III. Graduate program quality factor
IV. Years since Ph.D.
1.
2.
3.
4.
5.
6.
Research as primary job activity
Teaching as primary job activity
Many research opportunities
Sbb interference with writing
Productivity factor
Income
Ca H P
c H P
C H P
C H P
C H P
C H P
C H P
C H P
C H P
C H P
31.7 2.65 33.9 3.93 32.1 3.16
-24 - -08 -
03 -
-28 74 - -09 45 -
09 51 -
22 13 14 - 4.23 .89 07-0307- 3.99 .86 17 14 14 - 3.90 .94
-21 12 13 -08 - -19 04 23 04 -
11 23 34 11 - --
23 -09 -15 02 -59 - 18 -12 -24 08 -69 - 14 00 -09 -12 -47 -
.67 .47
.32 .47
.44 .50
015 .36 .50 .50 .22 .41
-13 11 17 05 46 -31 - -13 08 16 -02 52 -40 r -04 20 27 17 50-34 - -----
18 -08 -16 05 -18 15 -24 - Z-07 -14-09 -23 E-24 - -05 -02 04 10 -21 05 -35 -
2.21b .73 1.90 .75 2.23 .72
1.5gb .75 1.82 .79 1.71 .73
-27 07 12 07 28 -20 43 -29 - -09 -28 -10 17 38-28 z-10 - -07 E 19 32 53 -14 46 -18 - --- --
10 02 -03 21 05 -31 07 -01 -02 32 -07 -01 06 -11 -?%- 04 08 11 06-04 -19 08 -10 -31 10 00 02
3.23' .99 2.54 .88 3.40 1.11
aC=Chemistry (N=239), H=History (N=142), P=Psychology (N=221)
b 3=very descriptive, 2=descriptive with reservations, l=not descriptive
c2=$10,000-14,999; 3=$15,000-19,999; 4=$20,000-24,999
Note: Correlations significantly different from zero at the .Ol level are underlined.
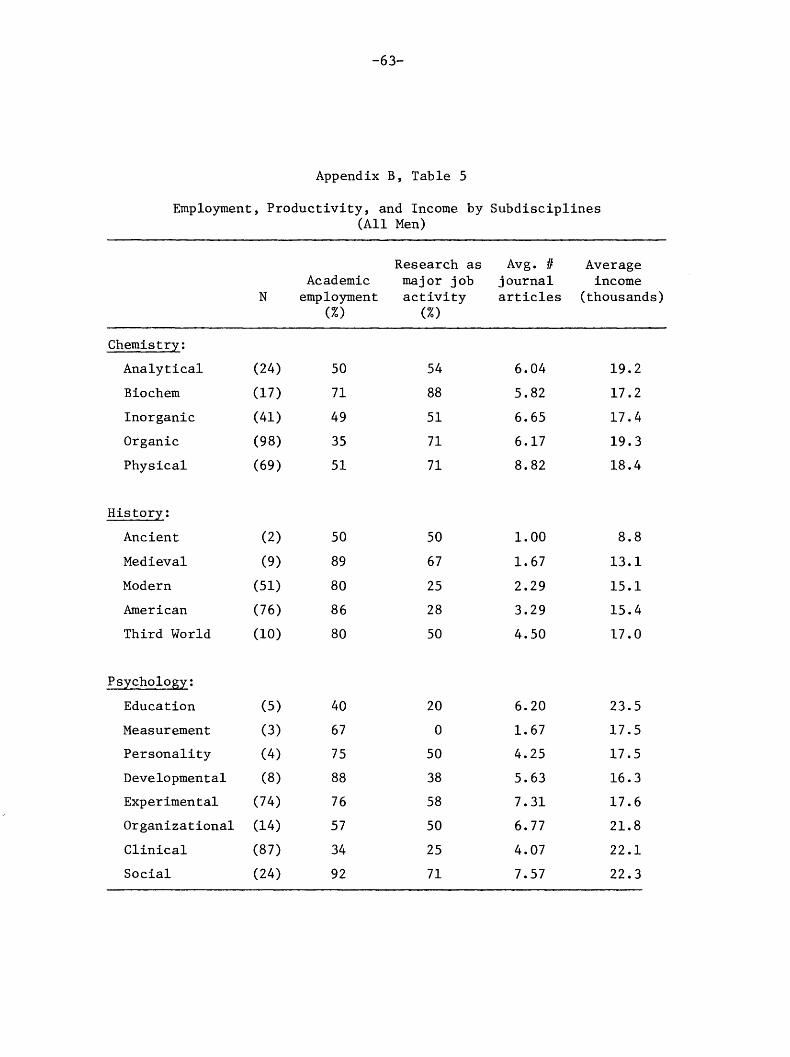
-63-
Appendix B, Table 5
Employment, Productivity, and Income by Subdisciplines (All Men)
Research as Avg. I” Average Academic major job journal income
N employment activity articles (thousands) (X) (2)
Chemistrv:
Analytical
Biochem
Inorganic
Organic
Physical
History:
Ancient
Medieval
Modern
American
Third World
Psychology:
Education
Measurement
Personality
Developmental
Experimental
Organizational
Clinical
Social
(24) 50 54 6.04 19.2
(17) 71 88 5.82 17.2
(41) 49 51 6.65 17.4
(98) 35 71 6.17 19.3
(69) 51 71 8.82 18.4
(2) 50 50 1.00 8.8
(9) 89 67 1.67 13.1
(51) 80 25 2.29 15.1
(76) 86 28 3.29 15.4
(10) 80 50 4.50 17.0
(5) 40 20 6.20 23.5
(3) 67 0 1.67 17.5
(4) 75 50 4.25 17.5
(8) 88 38 5.63 16.3
(741 76 58 7.31 17.6
(14) 57 50 6.77 21.8
(87) 34 25 4.07 22.1
(24) 92 71 7.57 22.3
-65-
Appendix C
SURVEY OF DOCTORAL
RECIPIENTS
GRADUATE RECORD EXAMINATIONS BOARD

-67- -.
Survey of Doctoral Recipients
All responses given on this questionnaire will be strictly confidential. If, however, you object strongly to a question, you need not answer it. Space is provided on the last page for any comments you wish to make.
1. What is your sex? (Circle one)
Male . . . . . . . . . . . . . . . . . . . . . . . . . . . . 1 Female ,,.......,..,............. 2
2. What was your age when you received the doctorate? . . . . . . . . . . . . . . . . . . . . . . . . . . . . . . . .
3. How many calendar years elapsed between the time you received your bachelor's degree and the award of your doctoral degree? . . . .
4. Regarding your predoctoral work experience, approximately how many years were you employed professionally?
Number of Years (Circle one)
None . . . . . . . . . . . . . . . . . . . . . . . . . . . 1 1 or 2 . . . . . . . . . . . . . . . . . . . . . . . . . . . 2
3 or 4 . . . . . . . . . . . . . . . . . . . . . . . . . . . 3
5 or 6 . . . . . . . . . . . . . . . . . . . . . . . . . . . 4
7 or more . . . . . . . . . . . . . . . . . . . . . . . . 5
5. Regarding your doctoral study (Circle one number experience: for each question)
a.
b.
C.
d.
e.
Were you ever a teaching assistant? . . . . . . . . . . . . . . . . . . .
Were you ever a research assistant? . . . . . . . . . . . . . . . . . . .
Were you awarded a fellow- ship or scholarship for any part of your doctoral educa- tion? . . . . . . . . . . . . . . . . . . . . . . . .
Was there a faculty member who took a special interest in your progress as a graduate student? . . . . . . . . . . . . . . . . . . . . .
Was there a faculty member who took a special interest in your professional career after you earned the doctorate? . . . .
Yes No --
1 2
1 2
1 2
1 2
1 2
Employment
Questions 6-17 concern your employment since obtaining the doctorate. If you have not been employed at any
time since you received the doctorate, check here g and skip to question18, page 4.
6. Of the years since you obtained a doctorate, how many were spent in the following:
8. Were you employed immediately after receiving the doctorate?
(Circle one)
a.
b.
C. Y
d.
I e.
f.
7. Approximately what percentage of your total
Full-time employment . . . . .
Part-time employment . . . . .
Postdoctoral study , . . . . . .
Not employed (housewife, unemployed, on leave, etc.) . . . . . . . . . . . . . . . . ...*
Retired . . . . . . . . . . . . . . . . . .
Total (should equal years since doctorate was awarded) . . . . . . . . . . .
(Write number of years)
employment (since receiving your doctorate) has been directly related to your field of study?
(Circle one) All or nearly all . . . . . . . . . . . . . . . 1 More than 50% . . . . . . . . . . . . . . . . . . . 2 About half . . . . . . . . . . . . . . . . . . . . . . 3 Less than 50% . . . . . . . . . . . . . . . . . . . 4 Very little or none . . . . . . . . . . . . . 5
Yes, continued in full-time position I had while working on degree . . . . . . . . . . . . . . . . . . . . . . . . 1
Yes, other full-time (includes postdoctoral fellowship) . , . . . . . . . 2
Yes, part-time . . . . . . . . . . . . . . . . . . . 3
No, not for one or more years . . . . 4
9. What is your current employment status? (Respond
in Column A) How much time would you prefer to be working? (Column B)
(Circle one in each column) A Current B Preferred
Full-time . . . . . . . . . . . . . 1 1
Over half-time but less than full-time . . . . . . 2 2
Less than half-time .., 3 3
Not employed . . . . . . . . . . 4 4

-68- -2-
10. From the following list indicate: a. your current employer or circumstance b. your first employer after award of doctorate.
(Circle one in each column)
Current First post- employment doctoral
employment .
Not presently employed for pay ................................................ Retired, don't expect to work again ........................................... Four-year college that does not offer a doctoral degree ....................... University that offers doctoral degree ........................................ Two-year college .............................................................. Elementary or secondary school or school system ............................... My own professional office or professional partnership ........................ Self-employed in business ..................................................... Postdoctoral fellowship ....................................................... Private profit-making company ................................................. Nonprofit research organization or institution, not part of a university ...... Public or private welfare organization ........................................ Hospital or clinic ............................................................ Federal government ............................................................ State or local government ..................................................... Church or religious organization .............................................. Other (Specify)
1 2 3
5 6 7 8 9
10 11 12 13 14 15 16 17
3 4 5 6 7 8 9
10 11 12 13 14 15 16 17
The following questions concern present employment. If you are not currently employed, skip to question 17 (bottom of page 3).
11. From the list below, select your current major job activity. If your job activity is not listed, write it in as "other."
(Circle one)
Teaching .................................................... 1 Research, scholarly writing, artistic production ............ 2 Administration or management ................................ 3 Professional service to patients or clients ................. 4 Other professional .......................................... 5 White collar, clerical or sales ............................. 6 Skilled or semiskilled worker ............................... 7 Other (Specify) 8
12. Approximately how many hours per week do you spend both in your job and in professionally related activities?
Total
13. Rate your satisfaction with each of the following aspects of your current job.
a.
b.
C.
d.
e.
f.
g*
h.
Very Satisfied
Job security . . . . . . . . . . . . . . . . 4
Salary ,..............,...... 4
Advancement opportunities . . . 4
Your rank or status . . . . . . . . . 4
Relations with colleagues . . . 4
Policies and practices of employer . . . . . . . . . . . . . . . . . 4
The work itself . . . . . . . . . . . . . 4
Overall satisfaction with the job . . . . . . . . . . . . . . . . . . . . . 4
(Circle one number in each line) Somewhat Somewhat Very Satisfied Dissatisfied Dissatisfied
3 2 1
3 2 1
3 2 1
3 2 1
3 2 1
3 2 1
3 2 1
3 2 1
Not Applicable \
0
0

-69-
-3-
14. What is your approximate annual income from employment and related professional activities (e.g., honoraria, royalties)? Include salary before deductions but withorfringe benefits paid by the employer. (Circle one)
less than $5,000 .............. 1 $18,000 - $19,999 ............. 8 $5,000 - $7,999 ............. 2 $20,000 - $21,999 ............. 9 $8,000 - $9,999 ............. 3 $22,000 - $23,999 ............. 10 $10,000 - $11,999 ............. 4 $24,000 - $25,999 ............. 11 $12,000 - $13,999 ............. 5 $26,000 - $27,999 ............. 12 $14,000 - $15,999 ............. 6 $28,000 - $30,999 ............. 13 $16,000 - $17,999 ............. 7 over $31,000 .................. 14
15. If you are currently on the staff of a college or university, answer the following question. If not, skip to question 16.
a. What is your rank or position? (Circle one)
Research appointment without faculty status ................
Instructor or lecturer .....................................
Assistant professor ........................................
Associate professor ........................................
Professor ..................................................
Department head ............................................
Dean or president ..........................................
Other administrative position ..............................
Other (Specify)
b. Do your interests lie primarily in teaching or in research? (Circle one)
c. What
16. Looking back, do you wish you had:
a. Gone into another graduate field of study entirely? ........... 1 2 3
b. Gone into a different specialty within your field? ............ 1 2 3
Very heavily in research ................................... 1
In both, but leaning toward research ....................... 2
In both, but leaning toward teaching ....................... 3
Very heavily in teaching ................................... 4
Neither .................................................... 5
are your teaching responsibilities this year? (Circle one)
Entirely undergraduate ..................................... 1
Some undergraduate, some graduate .......................... 2
Entirely graduate .......................................... 3
Not teaching this year ..................................... 4
(Circle one number in each line)
Yes No Uncertain --
C. Built a career with a different type of employer? ............. 1 2 3
d. Not bothered to obtain a doctorate? ........................... 1 2 3
17. Write your total number of publications in the following categories, using a zero for "none." Include any
articles or books that have been accepted for publication but have not yet appeared.
a. How many books have you had published: b. Approximately how many professional articles
as a sole or senior author? have you had published in journals or maga- zines (either alone or in collaboration)?
as junior author or as editor?

The next question concerns possible reasons for unemployment during the time you have had a doctorate. If you have always been employed, skip to question 19.
18. If you are currently unemployed, circle (in Column A) the appropriate reason(s) from the list below. Do the same under Column B for any other periods of unemployment during the time you have had your doctorate.
(Circle all that apply in each column)
A B Current Other periods
unemployment of unemployment
I did not receive an offer . . . . . . . . . . . . . . . . . . . . . . . . . . . . . . . . . . . . . . . . . . 1 1
I received an offer but I felt that it was not commensurate with my ability, training or interests . . . . . . . . . . ..I....................... 2 2
I received an offer but did not like the geographical location . . . . . . 3 3
No suitable jobs were available in the same locale as spouse's job . . 4 4
I was not employed employer . . . . . . . . . .
because of anti-nepotism policy of spouse's . . . . . . . . . . . ,....................... . . . . . . . . . . . . . . . 5 5
I was pregnant . . . . . . . . . . . . . . . . . . . . . . . . . . . . . . . . . . . . . . . . . . . . . . . . . . . . . . 6 6
I had poor health ................................................... 7 7
I did not want to work .............................................. 8 8
Spouse did not want me to work . . . . . . . . . . . . . . . . . . . . . . . . . . . . . . . . . . . . . . 9 9
I did not want to teach ,,........................................... 10 10
I could not find competent domestic help or day care for children . . . 11 11
I retired . . . . . . . . . . . . . . . . . . . . . . . . . . . . . . . . . . . . . . . . . . . . . . . . . . . . . . . . . . . 12 12
Other (Specify) 13 13
19. Which one of the following statements regarding women's rights and opportunities best describes you? (Circle one)
I spend a great deal of time and effort working to increase women's rights and opportunities . . . . . . . . . . . . . . . . . . . . . . . . . . . . . . . . . . . . . . . . . . . . . . . . . . . . 1
I spend some time and effort working to increase women's rights and opportunities . . . . . . . . . . . . . . . . . . . . . . . . . . . . . . . . . . . . . . . . . . . . . . . . . . . . . . . . . . . . . . . 2
I support most women's rights efforts, but I'm not actively involved myself . . . . . . . . . . . . . . . . . . . . . . . . . . . . . . . . . . . . . . . . . . . . . . . . . . . . . . . . . . . . . . . . . . . . . . 3
I'm not interested in women's rights, one way or another . . . . . . . . . . . . . . . . . . . . 4
I'm opposed to increasing women's rights . . . . . . . . . . . . . . . . . . . . . . . . . . . . . . . . . . . . 5
Marital and Family Profile
20. What is your current marital status? (Circle one),
Married (once only) . . . . . . . . . . . . . . . . 1 Married (remarried) . . . . . . . . . . . . . . . . 2 Separated . . . . . . . . . . . . . . . . . . . . . . . . . . 3 Single (never married) . . . . . . . . . . . . . 4 Single (divorced) . . . . . . . . . . . . . . . . . . 5 Single (widowed) . . . . . . . . . . . . . . . . . . . 6 Single (member of religious order).. 7
If you have never married, you may skip to the section reserved for comments, page 6,
21. How many children have you had (or adopted)? (Circle one)
None . . . . . . . . . . . . . . . . . . . . . . . . . . . . . . . 1 1 or 2 . . . . . . . . . . . . . . . . . . . . . . . . . . . . . 2 3 or 4 . . . . . . . . . . . . . . . . . . . . . . . . . . . . . 3 5 or more . . . . . . . . . . . . . . . . . . . . . . . . . . 4
22.
23.
When were your children born in relation to your earning the doctorate? (Circle one)
All born before degree earned . . . 1 At least one born before, one or
more after degree earned . . . . . . 2 All children born after degree
earned . . . . . . . . . . . . . . . . . . . . . . . . 3
When is the first time you were married in relation to your earning the doctorate?
(Circle one)
First married before starting degree . . . . . . . . . . . . . . . . . . . . . . . . 1
First married while earning degree . . . . . . . . . . . . . . . . . . . . . . . . 2
First married after receiving degree . . . . . . . . . . . . . . . . . . . . . . . . 3

-71- -5-
The remaining questions ask about your current pouse. If you are not currently married, skip to the ection for your written comments on page 6.
4. What is your spouse's educational attainment level? (Circle one)
High school education or less . . . . 1 Some college . . . . . . . . . . . . . . . . . . . . . 2 Graduated from college . . . . . . . . . . . 3 Masters degree or some graduate school . ..*....................... 4 Earned doctorate or professional degree (Ph.D., Ed.D., M.D., LL.B., etc.) ..,.................. 5
5. Which one of the following describes your spouse's employment during your marriage?
(Circle one)
Has been employed full time all or almost all the time . . . . . . . . . . . . . . 1 Has been employed full time more than half the time . . . . . . . . . . . . . . . 2 Has been employed full time less than half the time . . . . . . . . . . . . . . . 3 Has had part-time employment . . . . . 4 Very little or no employment . . . . . 5
If you have been married more than once, answer question 23.
(Circle one)
29. a. In terms of educational attainment, how does your present spouse compare with your first spouse?
Present spouse has had more education . . . . . . . . . . . . . . . . . . . . . . . . . . Present spouse has had less education . . . . . . . . . . . . ..*........... Equal level of education . . . . . . . . . . .
b. In terms of support of your career, how does your present spouse compare with your first spouse?
Present spouse is more supportive of my career . . . . . . . . . . . . . . . . . . . . . . . Present spouse is less supportive of my career . . . . . . . . . . . . . . . ...*.... Both supported my career about equally . . . . . . . . . . . ..e..............
Please go to next page for comment section.
6. Is your spouse currently employed? (Circle one)
Yes, full time ................... 1 Yes, part time ................... 2 No ............................... 3 (skip to question 28)
7. Which one of the following describes your spouse's current employment? (Circle one)
Teaching, administration, or research in an educational setting . . . . . . . . . . . . . . . . . . . . . . . . . . 1 Other professional ,.............. 2 Managerial; owner of business or farm . . . . . . . . . . . . . . . . . . . . . . . . . . . . . 3 White collar, clerical or sales . . .4
1 Skilled or semi-skilled worker . . . 5 Other (Specify) 6
8. To what extent has your spouse's job deterred you from considering a job that would require a move to another community?
(Circle one)
Major deterrent . . . . . . . . . . . . . . . . . . 1 Minor deterrent . . . . . . . . . . . . . . . . . . 2 No deterrent . . . . . . . . . . . . . . . . . . . . . 3 Not applicable to me . . . . . . . . . . . . . 4

-72-
Additional Comments:
but Please feel free to elaborate on any of your previous
which may have been overlooked in the questionnaire.
Thank you for your time and cooperation.
Please return questionnaire to: Educational Testing Service Princeton, New Jersey 08540
ATTN: J. CENTRA R-227
answers or to add anything else you consider importr
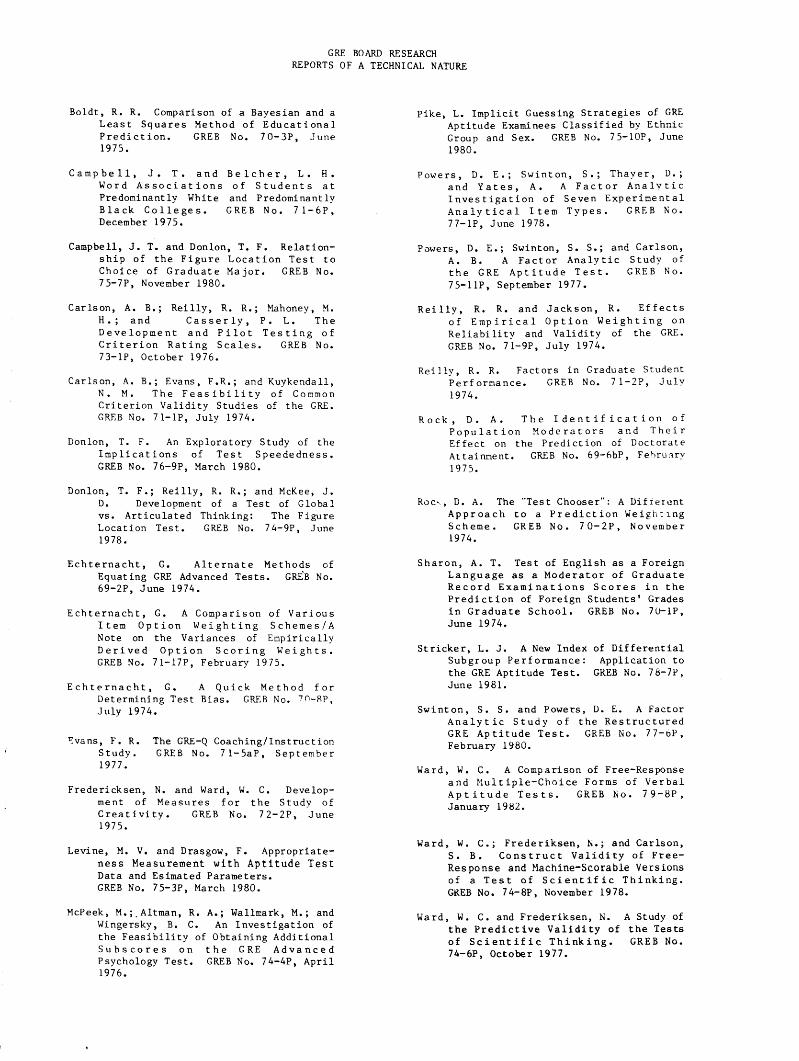
GRE BOARD RESEARCH REPORTS OF A TECHNICAL NATURE
Boldt, R. R. Comparison of a Bayesian and a Pike, L. Implicit Guessing Strategies of GRE Least Squares Method of Educational Aptitude Examinees Classified by Ethnic Prediction. GREB No. 70-3P, June Group and Sex. GREB No. 75-lOP, June 1975. 1980.
Campbell, J. T. and Belcher, L. H. Word Associations of Students at Predominantly White and Predominantly Black Colleges. GREB No. 71-6P, December 1975.
Powers, D. E.; Swinton, S.; Thayer, D.; and Yates, A. A Factor Analvtic Investigation of Seven Experimental Analytical Item Types. GREB No. 77-lP, June 1978.
Campbell, J. T. and Donlon, T. F. Relation- ship of the Figure Location Test to Choice of Graduate Major. GREB No. 75-7P, November 1980.
Powers, D. E.; Swinton, S. S.; and Carlson, A. B. A Factor Analytic Study of the GRE Aptitude Test. GREB No. 75-llP, September 1977.
Carlson, A. B.; Reilly, R. R.; Mahoney, M. H l ; and Casserly, P. L. The Development and Pilot Testing of Criterion Rating Scales. GREB No. 73-lP, October 1976.
Reilly, R. R. and Jackson, R. Effects of Empirical Option Weighting on Reliability and Validity of the GRE. GREB No. 71-9P, July 1974.
Carlson, A. B.; Evans, F.R.; and Kuykendall, N. M. The Feasibility of Common Criterion Validity Studies of the GRE. GREB No. 71-lP, July 1974.
Reilly, R. R. Factors in Graduate Student Performance. GREB No. 71-2P, July 1974.
Donlon, T. F. An Exploratory Study of the Implications of Test Speededness. GREB No. 76-9P, March 1980.
Rock, D. A. The Identification of Population Moderators and Their Effect on the Prediction of Doctorate Attainment. GREB No. 69-6bP, February 1975.
Donlon, T. F.; Reilly, R. R.; and McKee, J. D. Development of a Test of Global vs. Articulated Thinking: The Figure Location Test. GREB No. 74-9P, June 1978.
Rot\, D. A. The "Test Chooser": A Difrerent Approach to a Prediction Weighting Scheme. GREB No. 70-2P, November 1974.
Echternacht, G. Alternate Methods of Equating GRE Advanced Tests. GRE‘B No. 69-2P, June 1974.
Echternacht, G. A Comparison of Various Item Option Weighting Schemes/A Note on the Variances of Empirically Derived Option Scoring Weights. GREB No. 71-17P, February 1975.
Sharon, A. T. Test of English as a Foreign Language as a Moderator of Graduate Record Examinations Scores in the Prediction of Foreign Students' Grades in Graduate School. GREB No. 7U_lP, June 1974.
Echternacht, G. A Quick Method for Determining Test Bias. GREB NO. 'o-8P, July 1974.
Stricker, L. J. A New Index of Differential Subgroup Performance: Application to the GRE Aptitude Test. GKEB No. 78-7P, June 1981.
I Evans, F. R. The GRE-Q Coaching/Instruction
Study. GREB No. 71-5aP, September 1977.
Swinton, S. S. and Powers, D. E. A Factor Analytic Study of the Restructured GRE Aptitude Test. GREB No. 77-bP,
February 1980.
Fredericksen, N. and Ward, W. C. Develop- ment of Measures for the Study of Creativity. GREB No. 72-2P, June 1975.
Ward, W. C. A Comparison of Free-Response and Multiple-Choice Forms of Verbal Aptitude Tests. GREB No. 79-8P, January 1982.
Levine, M. V. and Drasgow, F. Appropriate- ness Measurement with Aptitude Test Data and Esimated Parameters. GREB No. 75-3P, March 1980.
Ward, W. C.; Frederiksen, N.; and Carlson, S. B. Construct Validity of Free- Response and Machine-Storable Versions of a Test of Scientific Thinking. GKEB No. 74-8P, November 1978.
McPeek, M.;. Altman, R. A.; Wallmark, M.; and Wingersky, B. C. An Investigation of the Feasibility of Obtaining Additional Subscores on the GRE Advanced Psychology Test. GREB No. 74-4P, April 1976.
Ward, W. C. and Frederiksen, N. A Study of the Predictive Validity of the Tests of Scientific Thinking. GREB No. 74-6P, October 1977.