concerns: austrian study on effects of reach action ... · list of figures ... 2007. in austria the...
TRANSCRIPT

EUROPEAN COMMISSION ENVIRONMENT DIRECTORATE-GENERAL Green Economy Chemicals ENTERPRISE AND INDUSTRY DIRECTORATE-GENERAL Consumer, Environmental and Health Technologies REACH Chemicals
Brussels, 11/05/2015 Doc. CA/MS/33/2015
18th Meeting of Competent Authorities for REACH and CLP (CARACAL) 23 – 24 June 2015
CCAB, Brussels, Belgium Concerns: Austrian study on effects of REACH Agenda Point: Info point 11 (provisionally) Action Requested: For information.
(Document submitted by Austrian CA)
denkstatt GmbH Hietzinger Hauptstraße 28 · 1130 Wien, Austria
T (+43)1 786 89 00 F (+43)1 786 89 00-15 E [email protected] W www.denkstatt.at
Final Report March 2015
Version 1.1
Final Report of the study
"REACH - Evaluation of the impact on the affected industries and the whole economy in Austria"
Authors:
Denkstatt:
DI Dr. Christian Plas
DI Johann Schweighofer
DI Magdalena Schwärz
Institute for Industrial Research:
Dr. Bernhard Mahlberg
Vienna University of Technology, Center of Public Finance and Infrastructure Policy:
Univ.-Prof. Dr. Michael Getzner
Univ.-Ass.in Mag.a Denise Zak
Commissioned by: The Austrian Federal Ministry of Agriculture, Forestry,
Environment and Water Management

Final Report March 2015
2
Content
1 Content and objective ................................................................................... 3
2 Implementation experience in Austria ........................................................ 3
2.1 Experience workshop on REACH .............................................................. 3
2.2 Stakeholder Survey ................................................................................ 4
2.3 Registrations Austria .............................................................................. 6
2.4 Cost Scenarios ...................................................................................... 6
3 Macroeconomic Effects ................................................................................. 7
3.1 Initial Values of the Analysis ................................................................... 7
3.2 Effects on Prices, Production, Value Added, Wages and Salaries and
Employment .......................................................................................... 9
4 Benefit-Cost-Analysis ................................................................................. 12
4.1 The Model ............................................................................................ 13
4.2 Results ................................................................................................ 14
References ....................................................................................................... 17
List of figures ................................................................................................... 18
List of tables ..................................................................................................... 18
Appendix of “Macroeconomic Effects” .............................................................. 19

Final Report March 2015
3
1 Content and objective
The objective of this study is to analyse and quantify the impact of the Regulation (EC)
no. 1907/2006 (REACH) on the Austrian economy so far, which came in force on June 1st
2007. In Austria the companies and authorities affected by the regulation are now al-
ready familiar with the requirements of the REACH Regulation, due to the almost six-year
period of implementation. For this reason, experiences concerning the impact of this
regulation, which is the focus of the study, are available.
The first part of the study deals with the impacts on the companies and their experiences
on registrations and accrued costs.
As a first step, a direct stakeholder survey through interviews and a workshop was con-
ducted. Within the study, companies of various industries were interviewed for a detailed
survey. This ensures that the effects were queried directly by the companies concerned
and thus the space for purely theoretical considerations has been minimized. The infor-
mation from the companies is, along with the existing statistical and economic data, the
base for the analysis.
As a next step and in addition to general research, statistics on registrations to the Euro-
pean Chemicals Agency (ECHA) were requested and cost scenarios for Austria are made.
In the second part of the study, the effects of EU chemicals policy on the whole Austrian
economy are analysed and quantified as far as possible. The analysis consists essentially
of comparative static comparison of the hypothetical situation without REACH Regulation
and the currently given situation after the entry into force of REACH Regulation. As a
central methodological approach, input-output analysis is used. The investigation focuses
on static effects.
In the third part a benefit-cost-analysis framework is applied to determine the feasibility
and economic efficiency of the REACH system by quantifying and monetizing all relevant
benefits and costs that are associated with the implementation of this regulation. Public
and occupational health benefits, environmental benefits and business benefits are fore-
most analyzed.
2 Implementation experience in Austria
2.1 Experience workshop on REACH
To collect data about the impact of REACH directly by the affected companies, an initial
workshop with participants of different roles within the meaning of REACH was held. The
participants of the workshop can be categorized in manufacturers, importers,
downstream users, distributors and experts. The aim of the workshop was a comparison
of the advantages and disadvantages of REACH from the perspective of the stakeholders.
Benefits accruing to the companies as well as to the Austrian economy due to REACH
were assessed and evaluated. The outcomes were generated within several workshops.
Statements on the subjects material management, dealing with examination and
registration fees, international competition, as well as strategies and business models
were collected in order to reflect an atmospheric picture of the sectors affected.
The results shown in Table 1 reflect an overview of the general perception of the impact
of REACH on the various groups.

Final Report March 2015
4
Table 1: Main results of the workshop
positive experiences negative experiences
Customer relationships have improved SME feel disadvantaged (complexity, in-
ternal efforts…)
Mass flows are more transparent Bureaucracy is seen as a burden
More information is available (e.g. ECHA
Homepage)
Uncertainty about completion of registra-
tion dossier
Knowledge Management has improved
(circulation of studies)
In the context of global competition more
inspections by inspectors are necessary
The documentation in safety data sheets
has improved
The translation of safety data sheets (e.g.
for export) is too cost and time-consuming
REACH is not only a legal compliance in-
strument, but a marketing tool
Worries about guaranty of data security by
ECHA
The awareness regarding SVHC substances
has improved
REACH applies also to downstream users
have problems with REACH (under-
standing, complexity, benefits)
The communication along the supply chain
has improved
The effective implementation of REACH to
the end consumer is missing
Consortia and SIEFs are well established REACH is not yet in the minds of the em-
ployees
The impacts of REACH are seen quite differently among the various groups. The picture
of the differential exercise is confirmed in the workshop rounds: the group of producers
sees REACH rather positive, the downstream-users remain also six years after the im-
plementation of REACH skeptical and consider REACH as an additional burden. The work-
shop also points out that the size of the company has an influence in assessing the im-
pacts of REACH. Unlike large companies, small and medium enterprises (SME) see them-
selves often overwhelmed of this new requirements and disadvantaged compared to
large companies. Furthermore, the conclusion could be that it makes a clear difference
whether you are a manufacturer of e.g. electrical goods or chemical products. If a com-
pany or person is consistently dealing with chemical substances and matters, they get
quickly familiar with REACH. Companies, who are suddenly confronted with chemicals at
the product level, have their difficulties with the requirements of REACH.
2.2 Stakeholder Survey
To obtain significant data for a qualitative and quantitative illustration of the impact of
REACH on the effected branches in Austrian, a detailed survey among companies from
relevant industries has been carried out. Objective of the survey was to get an idea of
the attitude of the affected companies towards REACH. Furthermore additional data to
the existing statistical and economic data was to be collected straight from these
companies and used for the subsequent evaluation. In total, 25 responses from about
300 requests have been processed (response rate about 8%). Emphasis was placed on
the widest possible diversity of sampled companies. The companies interviewed
represent different industries, company sizes and roles within the meaning of REACH.

Final Report March 2015
5
The survey was carried out using the following media:
Questionnaires
Personal interviews
Telephone interviews
Emails
As also stated by the participants of the initial workshop (see chapter 2.1), i.e. the
improvement of customer relations since the implementation of REACH, is considered as
a positive development by the respondents. In general, both the manufacturers and the
downstream users from different branches say that the situation for clients and customer
relations has improved. Moreover, an increased exchange within the supply chain is
seen.
When asked about the possibility of developing new business models due to REACH,
large companies state that the actual development remains behind the expectations.
SME, however, see no chance of new business models through REACH.
When asked whether REACH creates new jobs, the companies responded that they see
this opportunity only in the areas of consulting, government and test laboratories.
In the area of information and security gains, large companies that have already
established a (safety) management system before REACH, see no added value of the
required documentation. Smaller companies are often not familiar or even overburdened
with a management system and systematic approach as REACH demands.
The question whether REACH has improved the documentation arise a mixed perception.
About half of the companies surveyed have noticed a positive change. While smaller
companies affirm the improved documentation, large companies tend to be rather less
convinced of the benefits of improved documentation.
In the interviews, the companies were also asked about other economic positive
changes. The responses to this question vary a lot and also reflect the general attitude
towards the regulation. About a third state that there is no economic benefit or that it is
at least not yet visible.
Competitive advantage and differentiation from non-EU countries cannot be generated,
according to respondents. This applies especially for SME, but also for large companies
hardly any competitive advantage due to REACH is seen.
Many companies attempted the offered “REACH Multiplikatorenlehrgang” by the Austrian
Federal Economic Chamber, and a very positive response was noted. Otherwise, the
companies try to make use of documents found in the internet or offered by the WKO.
The safety data sheet (SDS) has already been an important tool for managing chemicals
before the introduction of REACH. In general, the preparation and standardization of
safety data sheets according to REACH requirements is considered to be very useful and
important. In contrast, the chemical safety report, which is mandatory for a quantity of
10 tons/year, is rated less useful.
A definite trend can be observed concerning innovation and substitution. This is due to
the increased pressure on hazardous substances, which is not always seen positively by
the companies. There is the general tendency to change the product range to replace
hazardous substances.
The survey shows that the additional costs for companies caused by REACH can only be
partially passed on to the customers, since they do not accept a higher price and do not
see REACH compliance as an argument for a price increase.
The general attitude of companies regarding REACH is very diverse. As already shown in
the experience workshop (see chapter 2.1) the size of the company plays a major role on
Final Report March 2015
6
the general attitude of the company. Large companies tend to see REACH more positive
than SME.
A further part of the survey was to quantify the costs related to REACH accruing for the
companies (see chapter 2.4).
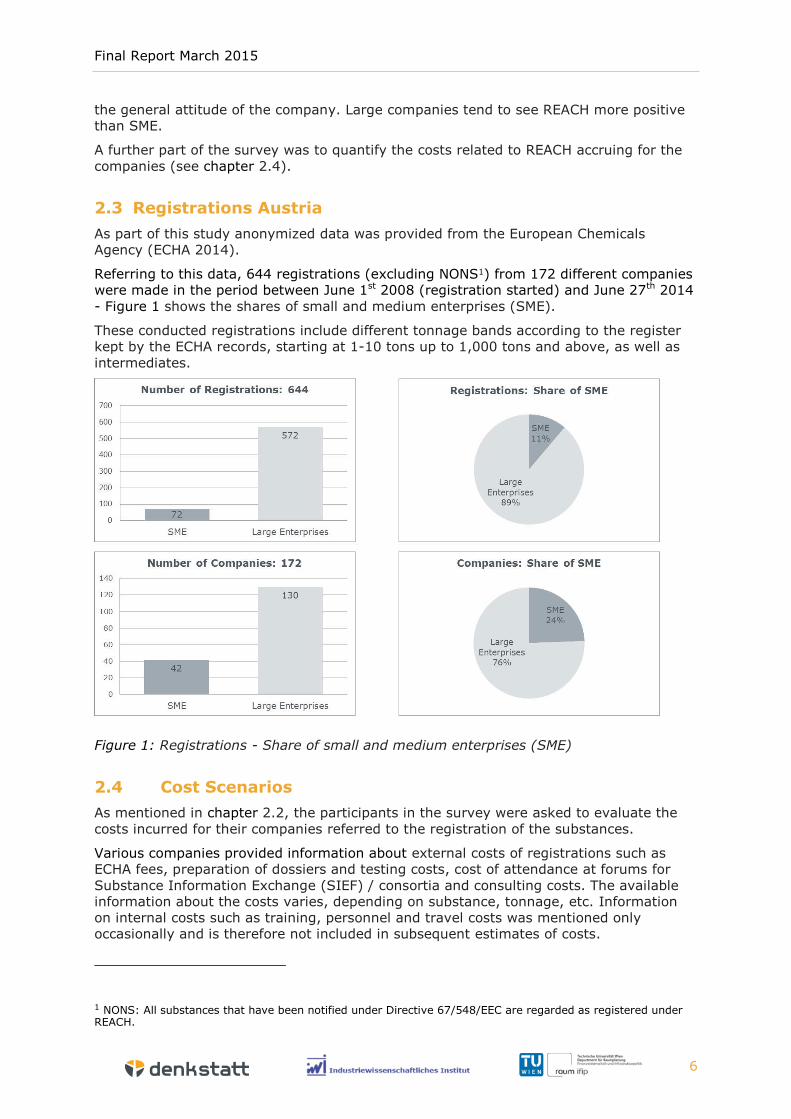
2.3 Registrations Austria
As part of this study anonymized data was provided from the European Chemicals
Agency (ECHA 2014).
Referring to this data, 644 registrations (excluding NONS1) from 172 different companies
were made in the period between June 1st 2008 (registration started) and June 27th 2014
- Figure 1 shows the shares of small and medium enterprises (SME).
These conducted registrations include different tonnage bands according to the register
kept by the ECHA records, starting at 1-10 tons up to 1,000 tons and above, as well as
intermediates.
Figure 1: Registrations - Share of small and medium enterprises (SME)
2.4 Cost Scenarios
As mentioned in chapter 2.2, the participants in the survey were asked to evaluate the
costs incurred for their companies referred to the registration of the substances.
Various companies provided information about external costs of registrations such as
ECHA fees, preparation of dossiers and testing costs, cost of attendance at forums for
Substance Information Exchange (SIEF) / consortia and consulting costs. The available
information about the costs varies, depending on substance, tonnage, etc. Information
on internal costs such as training, personnel and travel costs was mentioned only
occasionally and is therefore not included in subsequent estimates of costs.
1 NONS: All substances that have been notified under Directive 67/548/EEC are regarded as registered under REACH.

Final Report March 2015
7
According to ECHA (2014) the costs for Austrian companies invoiced by ECHA since
1st June 2008 were specified at EUR 8.3 million.
To perform a rough estimate of costs for all registrations of Austrian companies until
June 27th 2014, costs were estimated in two different scenarios.
From company details and the number of registrations (ECHA data 2014) “average
minimum total costs” and “average maximum total costs” are calculated in a first step.
For the scenario “average” the mean value of the already calculated average total cost
(min, max) is formed.
For the scenario “average max” the average maximum total costs are used.
According to this, for the scenario “average” costs of approximately EUR 53 million, and
for the scenario “average max” costs of approximately EUR 86 million arises within the
observation period from June 1st 2008 to June 27th 2014.
The German study “Schwachstellenanalyse der Registrierungspflichten durch die europäi-
sche Chemikalienverordnung REACH” (Nationaler Normenkontrollrat, 2012) and a study
of CSES (2012) show a similar cost magnitude.
3 Macroeconomic Effects
In this chapter the effects of EU chemicals policy on the whole Austrian economy are
analyzed and quantified as far as possible. The analysis consists essentially of compara-
tive static comparison of the hypothetical situation without REACH Regulation and the
currently given situation after the entry into force of REACH Regulation. As a central
methodological approach, input-output analysis2 is used. The investigation focuses on
static effects.
First, external costs (registration fees, appraisal costs, participation charges for SIEFs,
etc.) identified in chapter 2.4 are set in relation to value added and gross wages and
salaries of the Austrian economy as a whole as well as the affected industries. Thereaf-
ter, the impacts on the price system and on further economic characteristics - namely
private consumption, production, value added and employment – are analyzed.
3.1 Initial Values of the Analysis
The external costs are presented and interpreted in relation to the overall economic value
added3 and total gross wages and salaries4 of 2010 (the latest input-output table is for
that year). A distinction is made between the two scenarios “average” and “average
max” described in chapter 2.4. All expenses are considered as a part of value added. The
registration fees belong to the payments for government licenses and fees in the sense
of national accounts and thus pertain to other taxes on production, which in turn are a
part of value added. The other expenditures (appraisal costs, participation charges for
2 Readers interested in details of the input-output analysis are referred to Miller and Blair (2009) and Holub and Schnabl (1994) among others.
3 The production of goods involves not only the consumption of intermediate goods but also of production fac-tors, which also have to be remunerated. These production factors can be viewed as services that are them-selves not produced and include human labour, the use of land and of long-lived means of production such as buildings, machinery, etc. Their remunerations consist mainly of wages and salaries and depreciation. Together with other components such as net operating surplus, social security contributions and taxes they are referred to as value added.
4 Gross wages and salaries are the sum of current – i.e. regular – earnings from employment, including holiday and Christmas bonuses, holiday and Christmas bonus payments to construction workers and the termination benefits.

Final Report March 2015
8
SIEFs, etc.) are also assigned to value added because they probably are mostly person-
nel expenses, imputed depreciation and the like. This information about costs comes
from chapter 2.4 of this study and serves as initial values for further calculations. They
are shown, broken down into the directly affected commodity groups, in Table 2. The
expenditures incurred so far for REACH thus amount to between approx. EUR 53 million
and approx. EUR 86 million, with approx. EUR 36 million to approx. EUR 58 million for
chemical products.
Table 2: External costs, absolute values (in million EUR)
Name of commodities Scenario
“average”
Scenario
“average max”
Other mining and quarrying products 0.4 0.7
Paper and paper products 0.07 0.1
Coke and refined petroleum products 6.2 10.1
Chemicals and chemical products (incl. pharmaceuticals) 35.6 58.2
Other non-metallic mineral products 1.5 2.4
Basic metals 7.2 11.7
Electrical equipment 1.5 2.4
Total 52.7 85.6
Table 3: External costs in relation to value added in 2010 of the respective commodity group (in percent)
Name of commodities Scenario
“average”
Scenario
“average max”
Other mining and quarrying products 0.08 0.13
Paper and paper products 0.00 0.00
Coke and refined petroleum products 0.20 0.33
Chemicals and chemical products (incl. pharmaceuticals) 0.55 0.90
Other non-metallic mineral products 0.05 0.08
Basic metals 0.09 0.14
Electrical equipment 0.03 0.04
Total 0.02 0.03

Final Report March 2015
9
Table 4: External costs in relation to wages and salaries in 2010 of the respective com-modity group (in %)
Name of commodities Scenario
“average”
Scenario
“average max”
Other mining and quarrying products 0.30 0.49
Paper and paper products 0.01 0.01
Coke and refined petroleum products 6.27 10.19
Chemicals and chemical products (incl. pharmaceuticals) 3.73 6.05
Other non-metallic mineral products 0.13 0.22
Basic metals 0.54 0.88
Electrical equipment 0.10 0.17
Total 0.05 0.07
The figures shown relate to the entire period since REACH entered into force. They could
be divided into individual years. Due to the absence of any information about the distri-
bution to individual years, a separation was not possible. In Table 3 and Table 4, the ex-
penses incurred are shown in relation to total value added and total gross wages and
salaries in 2010. Taking all affected commodities together, the shares in value added are
less than one percent and as a share of the overall economy they amount to 0.03%. In
the case of gross wages and salaries the expenditure reached more than one percent
only for coke and refined petroleum products as well as for chemical products (incl.
pharmaceuticals). Overall, this share is just up to 0.07%.
3.2 Effects on Prices, Production, Value Added, Wages and Sala-ries and Employment
An input-output price model is used to investigate the effects of external costs on the
price structure in a first step. The chosen procedure is shown schematically in Figure 2
Figure 2: Approach in analyzing the impact of REACH on the price structure
The starting point is the external costs, which represent increased use of primary inputs
(e.g. labour) in the model. These cost increases imply that value added increases in the
production of the goods concerned. The model accounts for interdependences of eco-
nomic activities and determines the extent to which the increase in value added in some
goods is propagated through the economy and reflected in all other prices.

Final Report March 2015
10
Table 5: Changes of prices, ten most affected products (in %)
Name of commodities Scenario
“average”
Scenario
“average max”
Chemicals and chemical products (incl. pharmaceuticals) 0.227 0.369
Other mining and quarrying products 0.052 0.084
Coke and refined petroleum products 0.045 0.073
Basic metals 0.037 0.060
Other non-metallic mineral products 0.031 0.050
Textiles 0.016 0.027
Rubber and plastics products 0.012 0.020
Electrical equipment 0.011 0.018
Beverages and tobacco products 0.009 0.014
Paper and paper products 0.008 0.013
Other products (average) 0.001 0.002
Total 0.008 0.014
Note: The commodities textile, rubber and plastic products as well as beverages and tobacco products are indi-
rectly affected by the price increases in the commodities covered by REACH.
The results of the estimates are shown in Table 5. To interpret this correctly, it should be
noted that the considerations are solely related to the change in the cost and value
added structure that is induced by the introduction of REACH. Therefore, the price
changes are described in addition to other economic developments, such as inflation. It
should also be noted that the calculations are carried out under the assumption that all
expenses are incurred within one year of REACH. The results are therefore more likely to
be regarded as an upper limit. As can be seen from Table 5, the impact on the aggregate
price level is low. The weighted average5 of individual price changes is 0.008 to 0.014%.
The chemical products are by far the most affected. Their price changes ranges from
0.227 to 0.369%. For all other goods, inflation effects are found only in the range of
tenths of percent.
In the next step, the impact of REACH on production, value added, gross wages and sala-
ries and employment is examined. For this purpose, first the shifts in private consump-
tion demand triggered by changes in the price structure are quantified. The price elastic-
ities needed are taken from Engelputzeder (2005). Then the effects on production, value
added, gross wages and salaries, and employment are estimated using a demand-driven
input-output model. The procedure is shown schematically in Figure 3
5 The price changes of commodities are weighted with the proportions of the goods in the domestic demand.

Final Report March 2015
11
Figure 3: Approach in analyzing the impact of REACH on private consumption, produc-tion, value added, gross wages and salaries and employment
The impacts on the overall economy are shown in Table 6, while the results broken down
by individual commodity groups are presented in tables in the Appendix. The calculations
are again performed under the assumption that all costs of REACH are incurred within
one year. The estimates suggest that, in total, the decline in private consumption is be-
tween EUR 497 thousand and EUR 809 thousand, in production between EUR 927 thou-
sand and EUR 1.5 million, in value added between EUR 417 and 679 thousand, in gross
wages and salaries between EUR 149 thousand and EUR 242 thousand, and in employ-
ment from 7.6 to 12.4 jobs or from 6.2 to 10.0 full-time equivalents. All these values are
significantly lower than one-thousandth of the respective indicator of the Austrian econ-
omy.
Table 6: Changes of private consumption, production, value added, wages and salaries, and employment
Indicator Scenario
“average”
Scenario
“average max”
Private consumption (in 1,000 EUR) -497.1 -809.0
Production (in 1,000 EUR) -927.1 -1,508.5
Value added (in 1,000 EUR) -417.4 -679.1
Gross wages and salaries (in 1,000 EUR) -148.5 -241.6
Employment (in jobs) -7.6 -12.4
Employment (in full-time equivalence) -6.2 -10.0

Final Report March 2015
12
4 Benefit-Cost-Analysis
A benefit-cost-analysis framework is applied to determine the feasibility and economic
efficiency of the REACH system by quantifying and monetizing all relevant benefits and
costs that are associated with the implementation of this regulation.
Public and occupational health benefits, environmental benefits and business benefits are
foremost analyzed. In general, the quantification of these benefits is a difficult task to
undertake even though the implementation of REACH has already started in 2008. With
regard to business benefits a quantification and monetization of business benefits (e.g.
competitive advantages and disadvantages) was not feasible. Thus, business benefits are
only considered in a qualitative way for the in depth analysis. In another survey relevant
organizations6 were asked, how and to what extent REACH has brought benefits for hu-
man and environmental health. As a result, the respondents stated that quantifying
REACH related effects would not be possible. This result is in line with a recent statement
of the European Commission (2013). In this paper, no quantitative measures but positive
trends are made out:
If compared with the pre-REACH situation, the quality, amount and stringency of
the information available for risk assessment has improved.
In the supply chain more information and improved safety data sheets result in a
more appropriate risk management. Thus, the nominal risk has been benefited
end-users, such as article producers.
Increased obligations on SVHC (Candidate listing and Authorisation provisions)
have already led towards the substitution of those substances through the supply
chain.
For the Benefit-Cost-Analysis the following data are used:
Health impacts: For skin and respiratory diseases, statistics on sick leave, hospital
discharges, and number and costs of occupational diseases that are associated
with chemical exposure are used. Data on poisoning and burns are provided by
the Austrian Road Safety Board. Prevalence, incidence and mortality data for can-
cer are also included in the model.
Environmental impacts: trend in hazardous waste quantities and the contamina-
tion of soil as well as ground water protection efforts are included in the model,
based on statistical data and numbers of the Environment Agency Austria
Cost estimates used in our model are based on the business survey and aggregat-
ed data provided by ECHA (see chapter 2.4).
6 Verein für Konsumenteninformation, Kuratorium für Verkehrssicherheit, Vergiftungsinformationszentrale, Bundesministerium für
Arbeit, Soziales und Konsumentenschutz (Sektion Konsumentenpolitik, Abteilung Produktsicherheit sowie Sektion Arbeitsrecht und
Zentral-Arbeitsinspektorat, Abteilung Arbeitsmedizin und Arbeitshygiene), Umweltbundesamt (Arbeitsgruppe Human-Bio-
Monitoring) Universität für Bodenkultur (Institut für Wald-, Umwelt- und Ressourcenpolitik, Institut für Siedlungswasserbau, Indust-
riewasserwirtschaft und Gewässerschutz sowie Institut für Bodenforschung), Technische Universität Wien (Institut für Wassergüte,
Ressourcenmanagement und Abfallwirtschaft), Wirtschaftskammer Österreich (Umwelt- und Energiepolitik, Sparte Industrie)

Final Report March 2015
13
4.1 The Model
Basically, the time frame for the model is defined from 2014-2044. As REACH has been
incrementally implemented since 2008, cost estimates are considered from that date. In
the model, the scenarios are based on Austria’s population forecast (Statistics Austria,
2014a).
Health benefits
In the context of REACH skin diseases (dermatitis), respiratory diseases (asthma, lung
diseases due to external agents) und cancers are important in terms of public as well as
occupational health. In this chapter assumptions for the model and underlying values are
presented.
According to the literature (Getzner 2006) 15-36% of occupational skin diseases require
medical consultation. In our model 25% of occupational skin disease cases indicate med-
ical consultations. Thus, a rather median scenario is assumed. For sick leave cases it is
assumed that 3% of dermatitis cases are related to chemical exposure. The same ap-
proach was assumed for respiratory diseases. Unfortunately, no data on indicated medi-
cal consultations were available and thus remain unconsidered in the model. Overall, if
REACH delivers its full potential for reducing adverse health effects in terms of respirato-
ry and skin diseases, we assume a conservative estimate of a 5% reduction owing to
REACH for each medical condition (“REACH effect”). The baseline values for the economic
valuation are summarized below (cf. Getzner 2006).
Table 7: Economic Valuation of relevant medical conditions (EUR per case, 2013 prices)
Medical condition EUR per case (2013)
Respiratory disease with medical consultation 1,076.18
Respiratory disease without medical consultation 849.36
Respiratory disease with sick leave 1,987.67
Respiratory disease with hospital stay 10,864.32
Skin disease with medical consultation 270.25
Skin disease without medical consultation 144.78
Skin disease with sick leave 1,224.57
Cancer (sick leave and hospital stay) 651,497.02
Value of a statistical life 4,488,000.00
Poisoning and burns 3,000.00
Multiple Chemical Sensitivity 30
Source: adjusted values based on Getzner 2006 and the sources specified there
Particularly good data are available for cancer. Based on Musu (2005) it was assumed
that 4% of all cancer cases are related to chemical exposure. This value corresponds to
the lower bound of available estimates. The economic valuation relies on the “value of a
statistical life” (ExternE 1999).
National data regarding “Multiple Chemical Sensitivity” (MCS) are not available. Based on
a literature review, we found prevalence rates ranging from 0.5-9% (Hausteiner et al
2005). Owing to impeded classification and the variety of symptoms we assume a preva-
lence rate of 0.5% for Austria. To our knowledge no economic valuations have been es-

Final Report March 2015
14
timated so far. We assume a lump sum of EUR 30 per case/year with respect to the vari-
ety and differing severity of symptoms.
We assume that 3% of all sick leave cases of poising and burns in the home and leisure
sector are associated with REACH relevant chemicals. The economic value is based on
expert’s opinion, but includes direct costs only.
Environmental impacts
Hazardous waste, soil contamination and ground water protection
We analyzed the development of hazardous waste amounts from 1998-2007 based on
NAMEA (“National Accounting Matrix including Environmental Accounts”) (Statistics Aus-
tria 2014b) and projected the outcomes to the timeframe of the model. In economic
terms the estimate of EUR 200 per ton is based on expert’s opinion.
Based on a report of the Environment Agency (2007) the costs of the remediation of con-
taminated sites were estimated at EUR 64.38 million per year. Water cleaning costs
amount to EUR 0.16/m2. Owing to REACH a 5% reduction of adverse environmental ef-
fects and related damage costs is assumed.
Costs
The costs are taken from the scenario “average” as described before (see chapter 2.4)
and amount to EUR 53 million for the period from 2008 to date (2014). The average an-
nual costs serve as a basis for extrapolation. We assume that from 2018-2044 30% of
average costs are incurred. The “average max” scenario is considered in the course of
the sensitivity analyses.
4.2 Results
The following results of the benefit-cost-analysis demonstrate the effects of REACH. This
“main scenario” implies the most reasonably estimated mean values for all benefits and
costs considered in the model. We conducted sensitivity analyses to range in the results
of the main scenario. Based on these analyses the relevant influences and thresholds for
a benefits surplus for Austria are discussed.
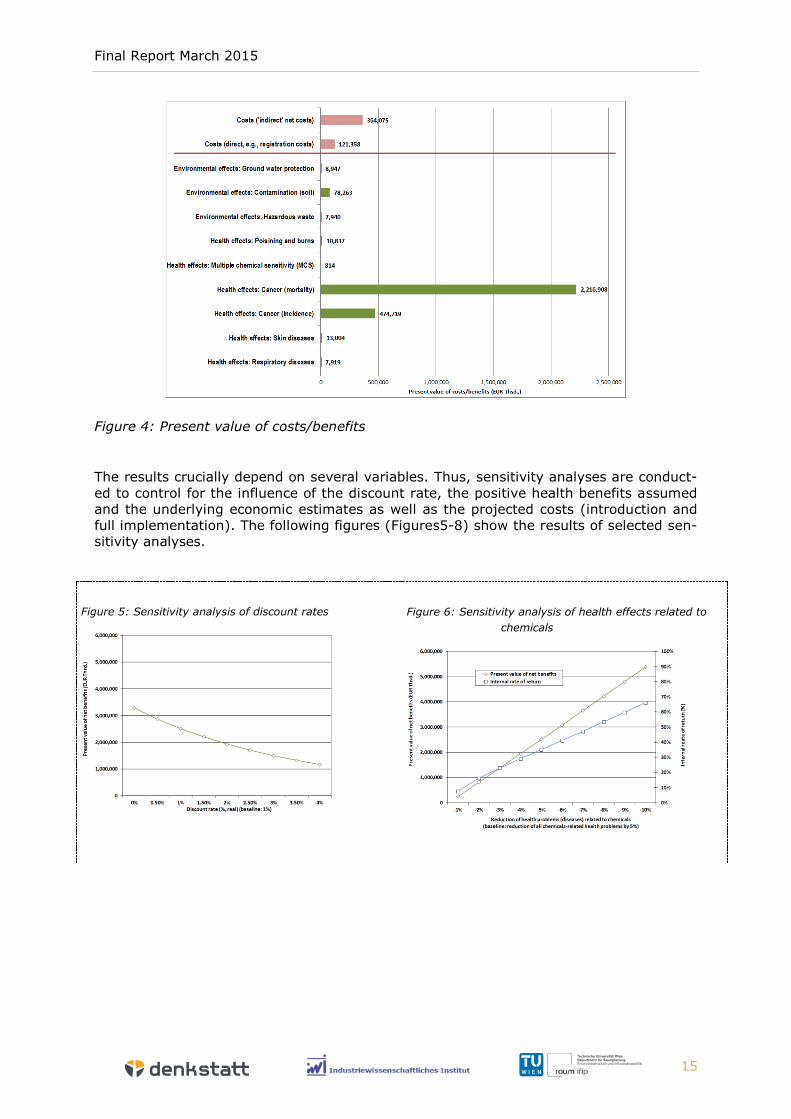
The main scenario shows that the adoption of REACH results in a considerable economic
resource gain (e.g. benefits of private households, public budgets and companies; pre-
sent value of net benefits) that amounts to about EUR 2.5 bn (Table 8). The high effi-
ciency of REACH is also indicated by the internal interest rate (about 35%) and the bene-
fit-cost ratio amounting to about 9.
Table 8: Results of the Benefit-Cost-Analysis, main scenario
Variable Characteristic
Present value of net benefits 2,511,193 Thsd. EUR
Internal rate of return 35.14%
Annuity 97,304 Thsd. EUR
Benefit-cost-ratio 9.15
Present value of total benefits 2,819,351 Thsd. EUR
Present value of total costs 308,158 Thsd. EUR
Assumptions: time frame 2008-2044; positive health effects come into effect in 2014, discount rate: 1.00% (real).
Final Report March 2015
15
Figure 4: Present value of costs/benefits
The results crucially depend on several variables. Thus, sensitivity analyses are conduct-
ed to control for the influence of the discount rate, the positive health benefits assumed
and the underlying economic estimates as well as the projected costs (introduction and
full implementation). The following figures (Figures5-8) show the results of selected sen-
sitivity analyses.
Figure 5: Sensitivity analysis of discount rates
Figure 6: Sensitivity analysis of health effects related to
chemicals
Final Report March 2015
16
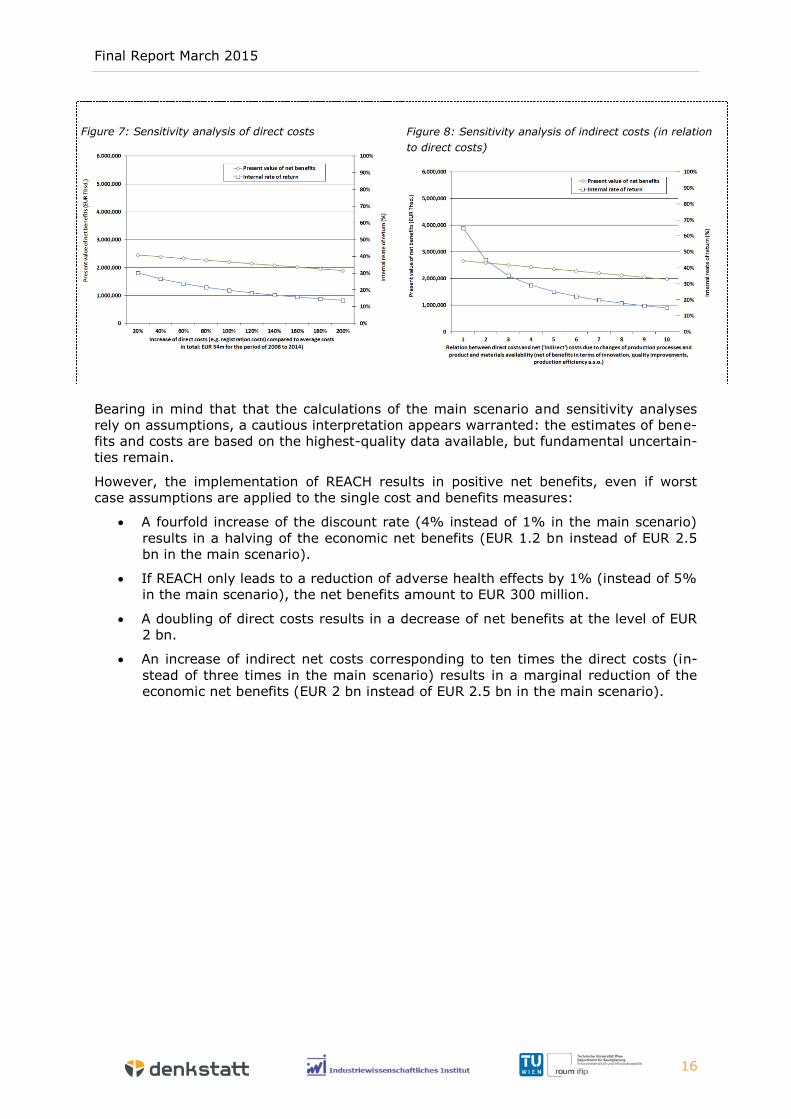
Figure 7: Sensitivity analysis of direct costs
Figure 8: Sensitivity analysis of indirect costs (in relation
to direct costs)
Bearing in mind that that the calculations of the main scenario and sensitivity analyses
rely on assumptions, a cautious interpretation appears warranted: the estimates of bene-
fits and costs are based on the highest-quality data available, but fundamental uncertain-
ties remain.
However, the implementation of REACH results in positive net benefits, even if worst
case assumptions are applied to the single cost and benefits measures:
A fourfold increase of the discount rate (4% instead of 1% in the main scenario)
results in a halving of the economic net benefits (EUR 1.2 bn instead of EUR 2.5
bn in the main scenario).
If REACH only leads to a reduction of adverse health effects by 1% (instead of 5%
in the main scenario), the net benefits amount to EUR 300 million.
A doubling of direct costs results in a decrease of net benefits at the level of EUR
2 bn.
An increase of indirect net costs corresponding to ten times the direct costs (in-
stead of three times in the main scenario) results in a marginal reduction of the
economic net benefits (EUR 2 bn instead of EUR 2.5 bn in the main scenario).

Final Report March 2015
17
References
CSES (2012): Interim Evaluation: Functioning of the European chemical market after the
introduction of REACH. Centre for Strategy & Evaluation Services, Kent, UK
ECHA (2014): Anonymisierte Daten zu den österreichischen Registrierungen (zur Verfü-
gung gestellt von ECHA)
Engelputzeder, N. (2005): Ökonometrische Analyse des Konsums der Österreicher, Tech-
nische Universität Wien
Europäische Kommission (2013): Gesamtbericht zu REACH. COM(2013)49 final, Brüssel
http://eur-lex.europa.eu/legal-
content/DE/TXT/PDF/?uri=CELEX:52013DC0049&from=DE
ExternE (1999): Externalities of Energy. Volume 7: Methodology update 1998. European
Commission, Brussles
Getzner, M. (2006): Kosten und Nutzeffekte der Chemikalienpolitik. volkswirtschaftliche
Kosten-Nutzen-Analyse der neuen EU-Chemiepolitik (REACH) für Österreich. LIT Verlag,
Wien
Hausteiner, C., Bornschein, S., Hansen, J., Zilker, T., Förstl, H. (2005): Self-reported
chemical sensitivity in Germany: A population-based survey. International Journal of Hy-
giene and Environmental Health, 208(4), 271–278.
Holub, H.W. & Schnabl, H. (1994): Input-Output-Analyse: Einführung, Verlag Oldenburg,
München und Wien
Miller, R.E. & Blair, P.E. (2009): Input-output analysis: foundations and extensions,
Cambridge University Press, Cambridge
Musu, T. (2004): REACHing the workplace. How workers stand to benefit from the new
European policy on chemical agents. TUTB, Brussels, Belgium
Nationaler Normenkontrollrat (2012): Schwachstellenanalyse der Registrierungspflichten
durch die europäische Chemikalienverordnung REACH, Berlin, Deutschland
Statistics Austria (2010): Grundsystematik der Güter ÖCPA 2008. Band 1: Einführung,
Grundstruktur, Alphabetikum, Wien
Statistics Austria (2014a): Demographische Prognosen. Online available:
http://www.statistik.at/web_de/statistiken/bevoelkerung/demographische_prognosen/in
dex.html
Statistics Austria (2014b): Namea. Online available:
http://www.statistik.at/web_de/statistiken/energie_und_umwelt/umwelt/namea/index.ht
ml
Umweltbundesamt (2012): Bestandsaufnahme der Abfallwirtschaft in Österreich. Status-
bericht 2012, Wien

Final Report March 2015
18
List of figures
Figure 1: Registrations - Share of small and medium enterprises (SME) ..................... 6
Figure 2: Approach in analyzing the impact of REACH on the price structure ............... 9
Figure 3: Approach in analyzing the impact of REACH on private consumption,
production, value added, gross wages and salaries and employment .......... 11
Figure 4: Present value of costs/benefits .............................................................. 15
Figure 5: Sensitivity analysis of discount rates ...................................................... 15
Figure 6: Sensitivity analysis of health effects related to chemicals .......................... 15
Figure 7: Sensitivity analysis of direct costs .......................................................... 16
Figure 8: Sensitivity analysis of indirect costs (in relation to direct costs) ................. 16
List of tables
Table 1: Main results of the workshop ................................................................... 4
Table 2: External costs, absolute values (in million EUR) ......................................... 8
Table 3: External costs in relation to value added in 2010 of the respective commodity
group (in percent) ................................................................................. 8
Table 4: External costs in relation to wages and salaries in 2010 of the respective
commodity group (in %) ......................................................................... 9
Table 5: Changes of prices, ten most affected products (in %) ............................... 10
Table 6: Changes of private consumption, production, value added, wages and
salaries, and employment ..................................................................... 11
Table 7: Economic Valuation of relevant medical conditions (EUR per case, 2013
prices) ................................................................................................ 13
Table 8: Results of the Benefit-Cost-Analysis, main scenario .................................. 14
Table 9: Changes of private consumption, ten most affected products (in 1,000 EUR)19
Table 10: Changes of production, ten most affected products (in 1,000 EUR) ............ 19
Table 11: Changes of value added, ten most affected products (in 1,000 EUR) .......... 20
Table 12: Changes of wages and salaries, ten most affected products (in 1,000 EUR) . 20
Table 13: Changes of employment, ten most affected products (in jobs) ................... 21
Table 14: Changes of employment, ten most affected products (in full-time equivalence)
......................................................................................................... 21

Final Report March 2015
19
Appendix of “Macroeconomic Effects”
Table 9: Changes of private consumption, ten most affected products (in 1,000 EUR)
Name of commodities Scenario
“average”
Scenario
“average max”
Chemicals and chemical products (incl. pharmaceuticals) -239.2 -389.2
Accommod. services; food a. beverage serving services -177.6 -288.9
Food products -59.5 -96.8
Beverages, Tobacco products -56.7 -92.3
Electrical equipment -38.5 -62.6
Telecommunications services -34.4 -56.0
Land transport services a. transport services via pipelines -31.2 -50.7
Air transport services -28.2 -45.8
Real estate services -14.0 -22.8
Specialised construction works -13.7 -22.2
Other products 195.8 318.4
Total -497.1 -809.0
Table 10: Changes of production, ten most affected products (in 1,000 EUR)
Name of commodities Scenario
“average”
Scenario
“average max”
Chemicals and chemical products (incl. pharmaceuticals) -267.0 -434.6
Accommod. services; food a. beverage serving services -182.5 -296.9
Food products -81.2 -132.1
Beverages, Tobacco products -74.0 -120.4
Electricity, gas, steam and air conditioning -68.3 -111.1
Telecommunications services -46.5 -75.6
Land transport services a. transport services via pipelines -46.3 -75.2
Products of agriculture, hunting and related services -41.6 -67.7
Electrical equipment -40.1 -65.1
Wholesale trade, exc. o. motor vehicles a. -cycles -36.6 -59.5
Other products -43.1 -70.3
Total -927.1 -1,508.5

Final Report March 2015
20
Table 11: Changes of value added, ten most affected products (in 1,000 EUR)
Name of commodities Scenario
“average”
Scenario
“average max”
Accommod. services; food a. beverage serving services -112.1 -182.4
Chemicals and chemical products (incl. pharmaceuticals) -59.4 -96.7
Beverages, Tobacco products -25.4 -41.3
Real estate services -23.8 -38.7
Wholesale trade, exc. o. motor vehicles a. -cycles -22.2 -36.1
Food products -21.1 -34.4
Telecommunications services -19.3 -31.4
Land transport services a. transport services via pipelines -19.2 -31.2
Products of agriculture, hunting and related services -16.8 -27.3
Electrical equipment -14.6 -23.7
Other products -83.5 -135.9
Total -417.4 -679.1
Table 12: Changes of wages and salaries, ten most affected products (in 1,000 EUR)
Name of commodities Scenario
“average”
Scenario
“average max”
Accommod. services; food a. beverage serving services -34.1 -55.4
Chemicals and chemical products (incl. pharmaceuticals) -25.0 -40.7
Land transport services a. transport services via pipelines -11.6 -18.8
Food products -11.0 -17.8
Wholesale trade, exc. o. motor vehicles a. -cycles -8.5 -13.8
Electrical equipment -7.7 -12.6
Specialised construction works -6.7 -10.9
Beverages, Tobacco products -5.5 -8.9
Telecommunications services -5.4 -8.8
Employment services -5.0 -8.1
Other products -28.1 -45.7
Total -148.5 -241.6
Final Report March 2015
21
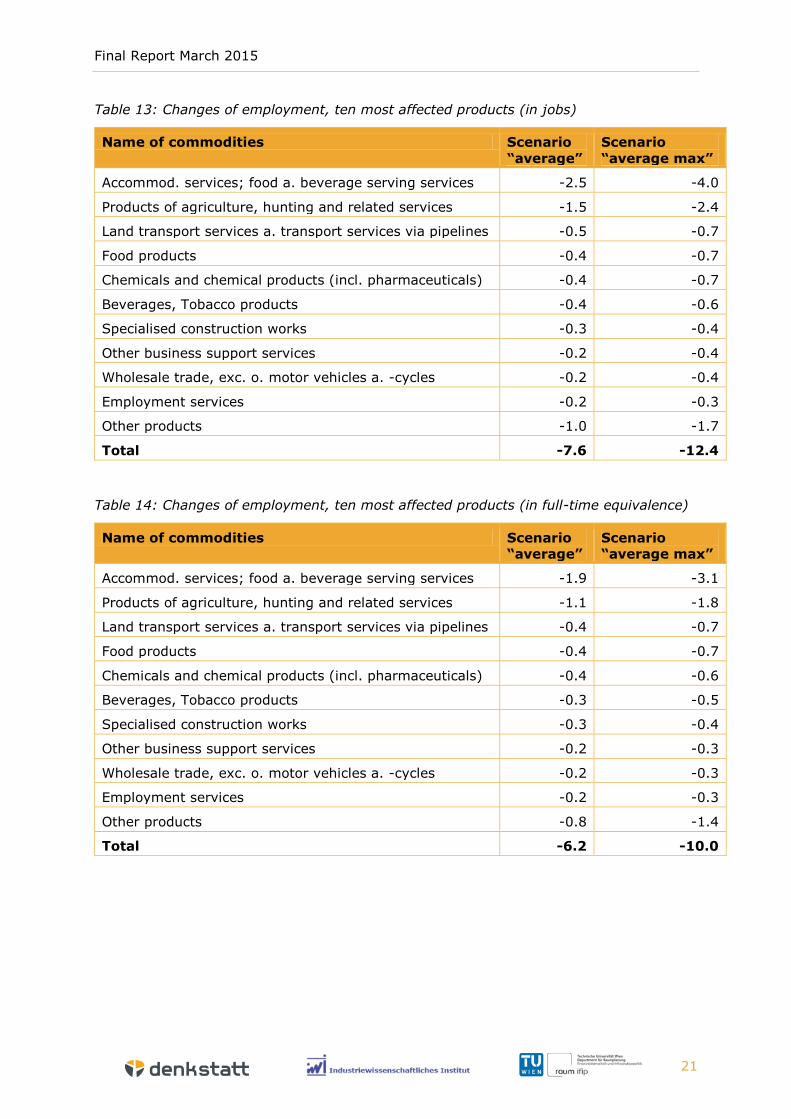
Table 13: Changes of employment, ten most affected products (in jobs)
Name of commodities Scenario
“average”
Scenario
“average max”
Accommod. services; food a. beverage serving services -2.5 -4.0
Products of agriculture, hunting and related services -1.5 -2.4
Land transport services a. transport services via pipelines -0.5 -0.7
Food products -0.4 -0.7
Chemicals and chemical products (incl. pharmaceuticals) -0.4 -0.7
Beverages, Tobacco products -0.4 -0.6
Specialised construction works -0.3 -0.4
Other business support services -0.2 -0.4
Wholesale trade, exc. o. motor vehicles a. -cycles -0.2 -0.4
Employment services -0.2 -0.3
Other products -1.0 -1.7
Total -7.6 -12.4
Table 14: Changes of employment, ten most affected products (in full-time equivalence)
Name of commodities Scenario
“average”
Scenario
“average max”
Accommod. services; food a. beverage serving services -1.9 -3.1
Products of agriculture, hunting and related services -1.1 -1.8
Land transport services a. transport services via pipelines -0.4 -0.7
Food products -0.4 -0.7
Chemicals and chemical products (incl. pharmaceuticals) -0.4 -0.6
Beverages, Tobacco products -0.3 -0.5
Specialised construction works -0.3 -0.4
Other business support services -0.2 -0.3
Wholesale trade, exc. o. motor vehicles a. -cycles -0.2 -0.3
Employment services -0.2 -0.3
Other products -0.8 -1.4
Total -6.2 -10.0