concentrator process development phase iv flotation … of rambler - concentrator... · 5.3.4 lock...
TRANSCRIPT

572 New Maryland Highway, Suite B
New Maryland, New Brunswick Canada, E3C 1K1
Telephone: (506) 454-2359 Fax: (506) 454-2355 [email protected]
Rambler Metals and Mining Canada Limited Rambler Property
Concentrator Process Development Phase IV Flotation Bench Scale Lock Cycle Test Program
December 19th, 2008
FINAL REPORT PROJECT NUMBER 6409-04
REVISION: 02
Prepared By:
Stephanie M. Scott, P. Eng.
Review By:
Tim R. McKeen, P. Eng.
Prepared For:
Rambler Metals and Mining Canada Limited Baie Verte, Newfoundland, Canada

Rambler Metals and Mining Canada Limited Rambler Property
Concentrator Process Development Phase IV Flotation Bench Scale Lock Cycle Test Program
TABLE OF CONTENTS
SECTION 1.0 - EXECUTIVE SUMMARY ........................................................................................................... 1 SECTION 2.0 - INTRODUCTION........................................................................................................................ 6
2.1 Background.............................................................................................................................................. 6 2.2 Project Objectives .................................................................................................................................... 8
SECTION 3.0 - SAMPLE PREPARATION AND CHARACTERIZATION........................................................ 10 3.1 Metal and Elemental Assays.................................................................................................................. 10 3.2 Mineralogical Review ............................................................................................................................. 12 3.3 Bond Work Index.................................................................................................................................... 13 3.4 Specific Gravity and Bulk Density Analysis ........................................................................................... 13
SECTION 4.0 - TEST WORK DESCRIPTION AND RATIONALE................................................................... 14 4.1 Literature Search and Reagent Selection.............................................................................................. 14 4.2 Preliminary Rougher and Rougher-Scavenger Batch Flotation Tests................................................... 16 4.3 Cleaning Flotation Tests ........................................................................................................................ 18 4.4 Lock Cycle Flotation Test....................................................................................................................... 21 4.5 Ore Variability Flotation Tests................................................................................................................ 22 4.6 Concentrate Dewatering Tests .............................................................................................................. 23 4.7 Tailings Leachability and Treatability Tests ........................................................................................... 23
SECTION 5.0 - DISCUSSION OF RESULTS................................................................................................... 24 5.1 Rougher and Rougher-scavenger Batch Flotation Tests....................................................................... 24
5.1.1 Primary (Rougher) Flotation Optimum Grind Size Determination .................................................. 24 5.1.2 Rougher Flotation Reagent Scheme Selection .............................................................................. 29 5.1.3 Rougher Flotation Kinetics ............................................................................................................. 32 5.1.4 Summary of Batch Rougher Flotation Test Results ....................................................................... 34
5.2 Cleaning Batch Flotation Tests .............................................................................................................. 35 5.2.1 Cleaner Flotation Optimum Regrind Determination ....................................................................... 35 5.2.2 Optimization of Cleaner Flotation Process Conditions................................................................... 37 5.2.4 Summary of Batch Cleaner Flotation Test Results ........................................................................ 41
5.3 Lock Cycle Flotation Tests..................................................................................................................... 41 5.3.1 Assessment of Lock Cycle Test Approach to Steady-State........................................................... 43 5.3.2 Summary of Lock Cycle Test Results............................................................................................. 48 5.3.3 Lock Cycle Flowsheet Mass Balance Model .................................................................................. 49 5.3.4 Lock Cycle Bulk Particle Size Distribution and Copper/Zinc Assays in Particle Size Fractions..... 57 5.3.5 Lock Cycle Process Stream Physical Properties ........................................................................... 59 5.3.6 Lock Cycle Process Water Analysis ............................................................................................... 59
5.4 Ore Variability Flotation Tests................................................................................................................ 61 5.5 Concentrate Dewatering Tests .............................................................................................................. 62
5.5.1 Sedimentation Tests....................................................................................................................... 62 5.5.2 Pressure Filtration Tests................................................................................................................. 63
5.6 Tailings Leachability and Treatability Tests ........................................................................................... 65

5.7 Quality Assurance Check on Assays..................................................................................................... 67 SECTION 6.0 - CONCLUSIONS....................................................................................................................... 69
6.1 Characterization of Ore Samples........................................................................................................... 69 6.2 Selection of Primary and Regrind Particle Size ..................................................................................... 70 6.3 Selection of Reagent Scheme and Reagent Dosages .......................................................................... 70 6.4 Assessment of Batch Flotation and Reagent Conditioning Residence Times ...................................... 70 6.5 Process Flowsheet Selection................................................................................................................. 72 6.6 Lock Cycle Copper Recovery and Concentrate Quality ........................................................................ 72 6.7 Solids Sedimentation and Dewatering.................................................................................................... 73 6.8 Ore Variability Tests............................................................................................................................... 73 6.9 Tailings Leachability and Treatment ...................................................................................................... 74 6.10 Process Water Quality ......................................................................................................................... 74 6.11 Quality Assurance of Assay Results .................................................................................................... 75
SECTION 7.0 - RECOMMENDATIONS............................................................................................................ 76 7.1 Confirmation of 1807 Zone Run-of-Mine Ore Characteristics and Grade ............................................. 76 7.2 Optimization of Reagent Dosages ......................................................................................................... 76 7.3 Detailed Mineralogy on Copper Concentrates....................................................................................... 77 7.4 Optimization of Cleaner Flotation Batch Residence Time ..................................................................... 77 7.5 Process Flowsheet Design .................................................................................................................... 77 7.6 Additional Lock Cycle Test..................................................................................................................... 77 7.7 Processing of Ore from Lower Footwall Zone ....................................................................................... 78
LIST OF FIGURES
Figure 1: Overview Block Diagram - Illustration of "Closed Circuit" Flotation Used for Lock Cycle Test ....... 4 Figure 2: Overview Block Diagram - Illustration of "Open Circuit" Flotation Concept..................................... 4 Figure 3: Overview SEM Image of Rambler 1600 Level Ore Sample .......................................................... 13 Figure 4: Malvern Particle Size Distribution Data for Primary Grind............................................................. 25 Figure 5: Wet Sieve Particle Size Distribution Data for Primary Grind ......................................................... 25 Figure 6: Primary Grind Calibration Curve for Bench Scale Test Work........................................................ 26 Figure 7: Copper Rougher Grade-Recovery Curve Relative to Grind Size .................................................. 27 Figure 8: Zinc Rougher Grade-Recovery Curve Relative to Grind Size ....................................................... 27 Figure 9: Gold Rougher Grade-Recovery Curve Relative to Grind Size ...................................................... 28 Figure 10: Silver Rougher Grade-Recovery Curve Relative to Grind Size..................................................... 28 Figure 11: Copper Recovery and Mass Rejection Rates for Rougher Scoping Flotation Tests..................... 30 Figure 12: Copper and Zinc Grades in Concentrate for Rougher Scoping Flotation Tests............................ 30 Figure 13: Copper-Zinc Separation Efficiency for Rougher Scoping Flotation Tests ..................................... 31 Figure 14: Copper and Gold Recovery to Concentrate for Rougher Scoping Flotation Tests ....................... 32 Figure 15: Effect of Zinc Depressant Dosage on Flotation Kinetics for Proposed Reagent Scheme............. 33 Figure 16: Effect of pH and Aero 5100 Promoter Dosage on Flotation Kinetics for Alternative Reagent
Scheme.......................................................................................................................................... 33 Figure 17: Copper Grade-Recovery Curves for Cleaner Regrind Batch Flotation Tests................................ 36 Figure 18: Zinc Grade-Recovery Curves for Cleaner Regrind Batch Flotation Tests..................................... 37 Figure 19: Copper Grade-Recovery Results for Batch Cleaner Flotation Tests............................................. 38 Figure 20: Zinc Grade and Copper Recovery for Batch Cleaner Flotation Tests ........................................... 38 Figure 21: Magnitude of Recirculating Loads and Copper Recovery for Batch Cleaner Flotation Tests ....... 39 Figure 22: Copper and Zinc Recovery with Respect to First Cleaning Stage Batch Flotation Time .............. 40 Figure 23: Copper and Zinc Grades with Respect to First Cleaning Stage Batch Flotation Time.................. 40

Figure 24: Schematic Representation of Lock Cycle Flowsheet .................................................................... 42 Figure 25: Combined Weights of lock Cycle Products and Comparison to Weight of Fresh Ore Feed ......... 44 Figure 26: Stabilization of Recycle Stream Weights as Lock Cycle Test Approaches Steady-State ............. 44 Figure 27: Trend of Copper Grades in Final Concentrate and Tailings as Lock Cycle Test Approaches
Steady-State .................................................................................................................................. 45 Figure 28: Trend of Copper Distribution Between Final Concentrate and Tailings as Lock Cycle Test
Approaches Steady-State.............................................................................................................. 46 Figure 29: Trend of Zinc Grades in Final Concentrate and Tailings as Lock Cycle Test Approaches Steady-
State............................................................................................................................................... 46 Figure 30: Trend of Zinc Distribution Between Final Concentrate and Tailings as Lock Cycle Test
Approaches Steady-State.............................................................................................................. 47 Figure 31: Mass Balance Simulation Print-Out for Case A............................................................................. 50 Figure 32: Sensitivity Analysis on Rougher-scavenger Flotation Cell Operating Parameters........................ 52 Figure 33: Mass Balance Simulation Print-Out for Case B............................................................................. 53 Figure 34: Mass Balance Simulation Print-Out for Case C............................................................................. 54 Figure 35: Sensitivity Analysis on Maximum Tolerable Zinc Head Grade...................................................... 55 Figure 36: Sensitivity Analysis on Maximum Tolerable Lead Head Grade..................................................... 56 Figure 37: Sensitivity Analysis on Maximum Tolerable Mercury Head Grade................................................ 56 Figure 38: Malvern Particle Size Distribution Data for Selected Process Streams from Lock Cycle Test #8 58 Figure 39: Settling Curve for Copper Concentrate Without Flocculant........................................................... 63 Figure 40: Concentrate Filtration Curve for Test A ......................................................................................... 64 Figure 41: Concentrate Filtration Curve for Test B ......................................................................................... 64 Figure 42: Results of Assay QA Checks for Iron, Copper, Zinc and Lead ..................................................... 68 Figure 43: Results of Assay QA Checks for Gold and Silver.......................................................................... 68
LIST OF TABLES
Table 1: Guidelines for Run-of-Mine Grade Control Based on Meeting Target Concentrate Impurity Limits.... 3 Table 2: Copper Concentrate Product Quality Specifications............................................................................ 9 Table 3: Head Sample Assay Data for Major Metals ....................................................................................... 10 Table 4: Head Sample Assay Data for Trace Elements .................................................................................. 10 Table 5: Solids Specific Gravity and Bulk Density of Crushed and Ground Ore ............................................. 13 Table 6: Matrix of Test Conditions for Preliminary Rougher-Scavenger Batch Flotation Tests....................... 17 Table 7: Matrix of Test Conditions for Batch Cleaner Flotation Tests.............................................................. 19 Table 8: P80 for Various Rod Mill Grind Times Determined by Malvern and Wet Sieve PSD Analysis.......... 24 Table 9: Summary of Rougher Flotation Kinetics for Selected Reagent Schemes ......................................... 34 Table 10: Summary of Lock Cycle Test Results .............................................................................................. 48 Table 11: Lock Cycle Flotation Circuit Operating Parameters ........................................................................ 49 Table 12: Summary of Particle Size Distribution Analysis for Selected Lock Cycle Process Streams............ 57 Table 13: Distribution of Copper and Zinc Within Selected Process Stream Particle Size Fractions.............. 58 Table 14: Summary of Physical Properties for Selected Lock Cycle Process Streams .................................. 59 Table 15: Lock Cycle Process Water Analysis................................................................................................. 59 Table 16: Summary of Ore Variability Batch Rougher Flotation Tests ............................................................ 61 Table 17: Summary of Pressure Filtration Test Data ....................................................................................... 63 Table 18: Results of Modified Acid-Base Accounting by Sobek Method ......................................................... 65 Table 19: TCLP Leachate Test Results and Relative CEPA Limits................................................................. 65 Table 20: Ore Sample Head Grades and Comparison to SRK Mineral Resource Estimate Grades .............. 69 Table 21: Summary of Lock Cycle Test Reagent Dosages ............................................................................. 70

LIST OF APPENDICES
APPENDIX A: Rambler Memo RE: Selection of Samples for the Phase IV Flotation Flowsheet Bench Scale Test Program
APPENDIX B: RPC Mineral Benefication Report No. PET-J1726 APPENDIX C: RPC Mineralogy Report No. PET-J1726 APPENDIX D: SGS Mineral Services Report No. 11707-002

QUALIFIER
Thibault & Associates Inc. is an engineering firm specializing in the development and design of industrial metallurgical and chemical processing systems. This study is provided pursuant to the written acceptance of proposal no. 164-04, Rev.01 dated June 6th, 2008, between Rambler Metals and Mining Canada Limited and Thibault & Associates Inc. The study and the subsequent findings of this report are based solely on the development status of the Rambler Property as of this date. Bench scale test program results and flowsheet design are specific to the mini bulk ore sample collected by and determined to be representative of run-of-mine ore by Rambler Metals and Mining Canada Limited (reference memo from Larry Pilgrim, P.Geo. to Thibault & Associates Inc. dated August 4th, 2008, RE: Selection of Samples for the Phase IV Flotation Flowsheet Bench Scale Test Program, Rambler Property for Rambler Metals and Mining Canada Limited). The study and report are limited to the work scope defined by the proposal. The literature referenced in this report relies on the accuracy of the publications and test methods. The report is for the consideration of Rambler Metals and Mining Canada Limited and may not be published or distributed without written consent. Distribution of the report is limited and an authorized distribution of the report shall be based on the complete report. Thibault & Associates Inc. is not liable for any losses, expenses or damages occasioned by the use or distribution of this report, other than the contractual obligations of Thibault & Associates Inc. to Rambler Metals and Mining Canada Limited. Subject as aforesaid, the distribution of the report as issued by Thibault & Associates Inc. is authorized as follows:
REPORT STATUS NUMBER OF COPIES
SUBMITTED TO REVISION AND DATE
Draft Report 1 (pdf) Peter Mercer - Rambler Metals & Mining PLC Rev 00 December 5, 2008
Draft Report 1 (pdf) Peter Mercer - Rambler Metals & Mining PLC Rev 01 December 17, 2008
Final Report 1 (pdf) 4 hard copies
Peter Mercer - Rambler Metals & Mining PLC Rev 02 December 19, 2008
Professional Engineer Professional Engineer Stephanie M. Scott, P.Eng. Tim R. McKeen, P. Eng Thibault & Associates Inc. Thibault & Associates Inc.
Professional seal is affixed to original document signed and dated on December 19th, 2008
Professional seal is affixed to original document signed and dated on December 19th, 2008

Rambler Metals and Mining Canada Limited Project 6409-04 Final Report Phase IV Flotation Bench Scale Lock Cycle Test Program Page 1 of 78
Thibault & Associates Inc.
Applied Process Chemical Engineering
SECTION 1.0 - EXECUTIVE SUMMARY
A bench scale test program was developed and managed by Thibault & Associates Inc. to identify a commercially viable flotation flowsheet, reagent scheme and design basis for process equipment sizing as required for definitive design of a copper flotation circuit proposed for the Rambler copper - gold property located near Baie Verte, Newfoundland and Labrador. The test program was executed by the Research and Productivity Council of Fredericton, New Brunswick, using ore samples collected by Rambler Metals and Mining Canada Limited from the 1600 level, 1807 zone (both 1600 level and 1807 zones are defined as massive sulphide) and Lower Footwall Zone (silica base copper deposit) on July 04, 2008. Previous bench scale flotation tests were completed by SGS Lakefield Research Limited of Lakefield, Ontario, on November 12, 2007, as a preliminary metallurgical characterization of the ore zones. The characterization study indicated significant variability in the flotation characteristics of each zone and further studies were recommended by SGS to identify a reagent scheme that would simultaneously optimize on grade and recovery of copper while improving on the selectivity of copper flotation for massive sulphide type ore. The present study was initiated as a result of these recommendations and the scope of the test program was defined based on the following objectives: The design of a flotation flowsheet based on selective flotation of copper and optimum rejection of zinc. Minimum overall bench scale flotation circuit copper recovery of 94% and minimum copper grade of 24.0
wt% Cu in the final concentrate. The target specifications for impurities, based on selective flotation of copper, were to achieve less than
2.5 wt% zinc, 0.5 wt% lead, 1000 ppm arsenic, 500 ppm antimony, 400 ppm bismuth and less than 10 ppm of mercury in the final concentrate.
NOTE: These parameters were defined by Rambler as conservative target impurity specifications for the test
program and are based on standards set by Noranda copper smelter schedules for the former Ming Mine operation as of 1995. Based on recent discussions with commodity traders, Rambler is confident that maximum impurity levels of 3.0% for zinc and 1.0% for lead are typical in the industry.
Define precious metal recovery (gold and silver) based on recovery with copper concentrate and
independent circuits for further recovery of precious metals by processing the tailings may be considered at a later date.
Confirmation that the selected reagent scheme will maintain comparable copper grade-recovery
relationships and copper-zinc separation efficiency based on processing of ore from different zones. A bulk sample of ore from the 1600 level was used to develop the reagent scheme and define the flotation process flowsheet for the concentrator. It should be noted that the ore samples from the 1600 level were considered by Rambler to represent a worst case scenario for impurity levels and the reagent scheme - flowsheet developed by this study should be capable of processing ore from the various ore zones. Based on the resource delineation and assessment completed to date by Rambler, the bulk sample of ore from the 1600 level has mineralogical characteristics similar to the 1807 zone.

Rambler Metals and Mining Canada Limited Project 6409-04 Final Report Phase IV Flotation Bench Scale Lock Cycle Test Program Page 2 of 78
Thibault & Associates Inc.
Applied Process Chemical Engineering
It was demonstrated from the bench scale and lock cycle test program that the reagent scheme as proposed results in excellent copper recovery and the rejection of zinc can be achieved to comply with smelter specifications. It was also concluded that the flotation flowsheet and process design should incorporate features that will maximize flexibility to accommodate ore variability. Reagent Scheme For Selective Copper Flotation
A detailed literature review was completed to define copper flotation reagent schemes currently in use at full scale commercial copper concentrators. It was found that reagent schemes for selective flotation of chalcopyrite varied widely and are highly dependent on the site-specific characteristics of the ore being processed. The reagent scheme as proposed herein is commonly used at various copper concentrators and the reagent dose will vary based on the specific ore composition. It was determined that the ability to efficiently recover copper and reject zinc from the flotation circuit was highly dependent on the target grind specification (i.e. improving on copper-zinc liberation). A primary grind size of approximately 80% passing 60 micron through the rougher circuit followed by a regrind on the rougher concentrate to approximately 80% passing 20 micron was defined for optimum separation of the copper and zinc. It was concluded that the grind specification is a key design parameter for processing of the massive sulphide ore. The recovery of copper was found to be dependent on both flotation residence time and reagent selection. Batch flotation residence times in the range of 15 to 20 minutes per stage have been defined by the study as being optimum for high recovery of copper. The proposed reagent scheme for process design and plant start-up is described below and involves the combined use of zinc sulphate and sodium cyanide, which was deemed necessary for depression of zinc with the high zinc head grade encountered in the 1600 level mini-bulk sample. The use of zinc sulphate and cyanide as a zinc depressant could potentially be eliminated for ore zones with lower zinc head grades. Collector / Promoter: Potassium amyl xanthate (KAX) and Aerophine 3418A Zinc Depressants: Zinc sulphate (ZnSO4) and sodium cyanide (NaCN) Frother: Methyl isobutyl carbinol (MIBC) Alkalinity Control (pH): Lime (CaO) Selective Copper Flotation Flowsheet
The recommended flotation flowsheet was developed from bench scale batch flotation test data and an industry standard “lock cycle” flotation test. The configuration of unit operations (rougher, scavenger and cleaner configuration) identified for the lock cycle test was based on maximizing copper recovery and employing a selective copper reagent scheme for optimum zinc rejection. The lock cycle flowsheet has been referenced as "closed circuit" (illustrated by Figure 1) and was characterized as having a very high recovery of copper, but limited zinc rejection rates as a result of high recirculating loads. The closed circuit flowsheet is recommended for high copper recovery and processing of low zinc ores. The lock cycle test performed on the bulk sample of ore from the 1600 level using the closed circuit concept resulted in an average grade and recovery of copper of 29.1% Cu and 92.4% respectively. The flotation

Rambler Metals and Mining Canada Limited Project 6409-04 Final Report Phase IV Flotation Bench Scale Lock Cycle Test Program Page 3 of 78
Thibault & Associates Inc.
Applied Process Chemical Engineering
circuit was modelled based on data from eight lock cycle tests to simulate a long term steady-state operation with respect to impurity rejection. Due to high recirculating loads generated in the "closed circuit" lock cycle test, zinc rejection was somewhat lower than that observed in batch tests. From the model, it was found that, with the "closed circuit" flowsheet, the final concentrate may contain elevated concentrations of zinc (4.19% Zn), lead (0.78% Pb) and mercury (53 ppm Hg). An optional "open circuit" flowsheet configuration (illustrated by Figure 2) has been recommended for processing of ores that contain high zinc. The "open circuit" flowsheet is based on the elimination of the rougher-scavenger flotation stage (shown with counter-current cleaner flotation to reduce recirculating zinc loads). The open flotation circuit is designed to operate at a slightly lower design copper recovery to allow for increased impurity rejection using the same reagent scheme as in the closed circuit process. From the model, it is predicted that by using the open flotation circuit for processing of ore with high zinc (typical of the 1600 level) that the final concentrate copper grade will be about 29% to 30% Cu with a decrease in the overall copper recovery of approximately 3.5% and significantly lower zinc grade of 1.94% Zn. It was concluded that the proposed reagent scheme provides an optimum copper grade-recovery relationship and an open flotation circuit will be required to process high zinc ores. The test program has identified a optional flowsheet which may be selected by the operator based on a flexible process piping design for the concentrator. It is recommended that the design of the flotation flowsheet include a piping configuration that allows for i) the rougher-scavenger flotation cells to be by-passed such that rougher tails are routed directly to tailings management and ii) counter-current flow can be utilized in the cleaner operation to lower the recirculating loads. In addition to the adoption of a fully flexible copper flotation circuit, controlling run-of-mine (ROM) head grades is a recommended operating practice for mining operations to assure compliance with target concentrate quality specifications. The mass balance model was used to estimate the maximum tolerable head grades of zinc, lead and mercury for both the closed and open circuit flowsheet configurations. The results are summarized in Table 1.
Table 1: Guidelines for Run-of-Mine Grade Control Based on Meeting Target Concentrate Impurity Limits
Metal Closed Flotation
Maximum Ore Grade Open Flotation
Maximum Ore Grade Concentrate Quality
Guidelines
Zinc 1.46% Zn 3.15% Zn 2.50% Zn
Lead 0.175% Pb 0.175% Pb 0.500% Pb
Mercury 4.72 ppm Hg 8.73 ppm Hg 10.00 ppm Hg

Rambler Metals and Mining Canada Limited Project 6409-04 Final Report Phase IV Flotation Bench Scale Lock Cycle Test Program Page 4 of 78
Thibault & Associates Inc.
Applied Process Chemical Engineering
Figure 1: Overview Block Diagram - Illustration of "Closed Circuit" Flotation Used for Lock Cycle Test
Crushing
Copyright Thibault & Associates Inc. 2008
Grinding
Rougher Flotation
Regrind
Tailings Management
Stage 1 CleanerFlotation
Run-of-mine Ore
Final Tailing
Copper Concentrate
Tail
Conc
Stage 2 CleanerFlotation
Stage 3 CleanerFlotation
Tail
Tail
Tail
Conc
Conc
Conc
Figure 2: Overview Block Diagram - Illustration of "Open Circuit" Flotation Concept
Rambler Metals and Mining Canada Limited Project 6409-04 Final Report Phase IV Flotation Bench Scale Lock Cycle Test Program Page 5 of 78
Thibault & Associates Inc.
Applied Process Chemical Engineering
Waste Management The assessment of the flotation tailings stability and process water chemistry (as a result of the bench scale lock cycle test) was completed to identify metals that may have an impact on the waste management design. It was concluded that standard waste management systems could be employed to assure environmental compliance. The build-up of selenium in the process water from the lock cycle test has indicated that the design of a process water management system should allow for a bleed stream to control water quality. Selenium removal from wastewater can be accomplished by conventional methods such as co-precipitation with iron to comply with environmental guidelines. Recovery and reuse of the process water for flotation has been proposed by previous process engineering studies. Use of cyanide as a flotation reagent will require conventional treatment of the process bleed water (using well defined cyanide destruction process technology) to assure compliance with wastewater guidelines. The flotation tailings recovered from the lock cycle test are typical of massive sulphide deposit processing and were found to be acid generating according to the results of modified acid-base accounting analysis. Various metals such as cadmium, copper, lead, selenium and zinc were leached from the tailings under mildly acidic conditions; however, at pH 8.5, concentrations of trace elements in the leachate were all below the applicable effluent guidelines as defined by Newfoundland and Labrador Regulation 65/03. A conventional lime neutralization system for tailings treatment and disposal of tailings under a water cover is recommended to assure compliance with tailings disposal regulatory guidelines. Process Equipment Sizing Parameters In addition to the flowsheet development tests, bench scale tests were completed to develop equipment sizing data for the grinding mills, flotation cells and concentrate dewatering equipment. The design parameters are based on the 1600 level ore characteristics. The grinding mill power requirements were found to be lower and cleaner flotation times longer than what is considered to be typical for copper – base metal sulphide ore and are subject to confirmation prior to process equipment procurement.

Rambler Metals and Mining Canada Limited Project 6409-04 Final Report Phase IV Flotation Bench Scale Lock Cycle Test Program Page 6 of 78
Thibault & Associates Inc.
Applied Process Chemical Engineering
SECTION 2.0 - INTRODUCTION
2.1 Background
Thibault & Associates Inc. have previously completed three phases of process development studies for Rambler Metals and Mining Canada limited (Rambler) including an assessment of the existing copper concentrator at the historic Rambler site (Phase I), ore zone characterization (Phase II) and scoping study (Phase III) that defines a conceptual flowsheet for copper flotation (reference Thibault & Associates Inc. Report No. 6409-02 dated December 21st, 2007). The flotation process block diagrams issued for Phase II and process flowsheets presented in Phase III (reference to flowsheet drawings 6409-0503-10-01 to 6409-0503-80-01 inclusive prepared by Thibault & Associates Inc.) were based on industrial standard process technology for chalcopyrite flotation and did not include ore specific lock cycle or pilot scale flotation tests. The flowsheet as defined by the scoping study will provide a design basis for the Phase IV Flotation Bench Scale Lock Cycle Test Program. Rambler Metals and Mining Canada Limited have also recently completed an NI 43-101 compliant mineral resource estimate for the Rambler Property - Ming Mine, located near Baie Verte, Newfoundland (reference SRK Consulting (Canada) Limited Report No. 3CR010.001 dated June 12th, 2008) and preliminary bench scale batch flotation characterization studies by SGS Lakefield completed on the 1807 zone and massive sulphide zone (reference SGS Lakefield Research Limited Report No. 11707-001 dated February 1st, 2008). The preliminary bench scale flotation studies by SGS defined technical limitations to achieving acceptable copper grade and recovery using conventional copper flotation technology. A flotation reagent scheme capable of simultaneously optimizing on copper and gold recovery, flotation kinetics and rejection of impurities such as zinc (selectivity of flotation) was not defined as a result of the original characterization studies. Additional bench scale studies and lock cycle testing were recommended by SGS Lakefield research Limited to identify a reagent scheme and a flotation flowsheet for copper concentrate production from the massive sulphide ore zones and are the subject of the present study. Rambler Metals and Mining Canada Limited have proposed a mine development plan that is initially based on production from the massive sulphide ore zones and 1807 zone with subsequent production from the footwall zones. An extended life of the mine is based on production from the lower footwall zone with indicated resource of about 8.7 million tonnes at 1.68% copper and 0.08 g/t gold. NI 43-101 compliant mineral resource estimates as of June, 2008 for the Rambler Property - Ming Mine are given by SRK Consulting (Canada) Limited Report No. 3CR010.001. and can be accessed through the company's website (www.ramblermines.com). The SRK Minerals Resource Statement for the Ming Mine Project reports resource classification assays as follows:
1807 Zone Measured mineral resource: 233,000 tonnes grading 4.17% copper, 1.93 g/t gold and 0.70% zinc Indicated mineral resource: 108,000 tonnes grading 4.68% copper, 1.59 g/t gold and 0.53% zinc Inferred mineral resource: 32,000 tonnes grading 4.18% copper, 2.79 g/t gold and 0.47% zinc North and South Massive Sulphide Zones Measured mineral resource: 252,000 tonnes grading 1.88% copper, 2.62 g/t gold and 0.52% zinc Indicated mineral resource: 413,000 tonnes grading 1.87% copper, 2.40 g/t gold and 0.58% zinc Inferred mineral resource: 1,039,000 tonnes grading 1.52% copper, 1.50 g/t gold and 0.70% zinc

Rambler Metals and Mining Canada Limited Project 6409-04 Final Report Phase IV Flotation Bench Scale Lock Cycle Test Program Page 7 of 78
Thibault & Associates Inc.
Applied Process Chemical Engineering
Lower Footwall Zones Indicated mineral resource: 8,664,000 tonnes grading 1.68% copper, 0.08 g/t gold and 0.01% zinc Inferred mineral resource: 2,006,000 tonnes grading 1.55% copper, 0.07 g/t gold and 0.00% zinc Upper Footwall Zones Indicated mineral resource: 390,000 tonnes grading 2.99% copper, 0.25 g/t gold and 0.03% zinc
Within the massive sulphide and 1807 zones; however, there are sub-zones that contain much higher zinc levels and the flotation reagent scheme and flowsheet will need to be designed to accommodate changes in ore head grade while maintaining an acceptable product quality. Bulk samples of ore provided by Rambler for the preliminary bench scale ore characterization work at SGS Lakefield contained 1.25% and 1.71% zinc in the massive sulphide and 1807 zones, respectively, and flotation tests using a standard chalcopyrite flotation reagent scheme defined limitations to the flotation of copper as follows: slow flotation kinetics (batch flotation times in excess of 25 minutes); need for sulphidization reagents to achieve copper flotation; poor overall recovery of copper in the range of 80 to 88%; low gold recovery in the range of 40% to 68%, and; poor zinc rejection during copper flotation. On July 4th, 2008, a 400 kilogram mini-bulk ore sample was obtained from the 1600 level in the now dewatered Ming Mine for use in the bench scale lock cycle test work. The sample was collected and blended by Rambler Metals and Mining Canada Limited as per the procedure outlined in the memo "RE: Selection of Samples for the Phase IV Flotation Flowsheet Bench Scale Test Program, Rambler Property for Rambler Metals and Mining Canada Limited", from Larry Pilgrim, P.Geo. to Thibault & Associates Inc. dated August 4th, 2008, and included as Appendix A. This sample assayed 5.21% copper, 2.60% zinc, 0.34% lead and 3.66 g/t gold. Although the 1600-level is not actually part of the 1807 zone (the 1807 zone is not currently accessible from the existing mine workings) the 1600-level mini-bulk was deemed to be representative of the 1807 zone ore by Rambler. The 1600-level ore sample contained significantly higher levels of zinc than the average grades defined for the 1807 zone in the SRK Minerals Resource Statement and may be representative of high zinc sub-zones within the 1807 ore body. Three 20 kilogram split core samples were also selected by Rambler to be used for ore variability testing, which assayed as follows:
Bucket 1: 1807 High Au - Low Zn 7.87% copper, 0.66% zinc, 0.11% lead, 2.38 g/t gold Bucket 2: 1807 High Zn 10.16% copper, 4.69% zinc, 0.17% lead, 1.92 g/t gold Bucket 3: Lower FWZ 2.42% copper, 0.05% zinc, 0.006% lead, 0.086 g/t gold

Rambler Metals and Mining Canada Limited Project 6409-04 Final Report Phase IV Flotation Bench Scale Lock Cycle Test Program Page 8 of 78
Thibault & Associates Inc.
Applied Process Chemical Engineering
2.2 Project Objectives
The overall test program objectives were based on the assessment of a reagent scheme, definition of the flotation flowsheet / mass balance and quantification of design parameters for process equipment sizing and design of the copper concentrator circuit. The test program was based on a bench scale process assessment and lock cycle flotation flowsheet simulation (designed to simulate a recirculating load by semi-batch testing), which is accepted as an industry standard test protocol for plant design. The primary focus of the present study was to identify a reagent scheme and flowsheet configuration that would maximize zinc rejection and gold recovery while maintaining optimal grade and recovery of copper to the final concentrate product. The proposed test program as defined herein did not include continuous pilot scale testing for flowsheet optimization and definitive flowsheet design and further test work may be necessary to optimize on certain process conditions prior to plant start-up. The project objectives were based on development of a process flowsheet for the 1807 and massive sulphide (north and south) zones as follows: Identification of a reagent scheme for copper – gold flotation and grind specifications for the production
of copper concentrate. The minimum specifications for the copper concentrate are based on standard smelter schedules. Definitive smelter schedules to be defined by Rambler Metals and Mining Canada Limited. The design approach was based on the selection of a reagent scheme which is selective for copper (with high zinc rejection / optimum suppression of zinc) and which may optimize on gold recovery (depending on gold association characteristics).
Identification of a flotation flowsheet to include unit operations for rougher, scavenger and cleaning
stages as required. The need for a regrind was also defined. The flotation flowsheet is based on bench scale batch flotation and lock cycle tests; relative to the composition of the ore as supplied by Rambler Metals and Mining Canada Limited.
Assessment of the stability and acid generating nature of the tailings (based on a water covered tailings
disposal system) and definition of tailings treatment requirements relative to submerged tailings disposal / water reclaim methods proposed by the scoping study.
Quantification of design parameters for process equipment sizing to include grinding power
requirements, flotation cell residence time requirements and flotation cell capacity based on recirculating loads, reagent consumption for both flotation and dewatering, solids dewatering equipment area requirements and tailings treatment neutralization requirements for stabilization of solids in the water covered tailings pond.
Product Quality The project objectives were based on the production of copper concentrate for sale to a copper smelter. Specifications for the minimum quality of copper concentrate and maximum levels of metal impurities (penalties to the value of concentrate) are listed in Table 2 and are based on a typical Noranda smelter schedule obtained from the former Rambler operations (1996) and are subject to further review by Rambler Metals and Mining Canada Limited.

Rambler Metals and Mining Canada Limited Project 6409-04 Final Report Phase IV Flotation Bench Scale Lock Cycle Test Program Page 9 of 78
Thibault & Associates Inc.
Applied Process Chemical Engineering
Table 2: Copper Concentrate Product Quality Specifications
PARAMETER MINIMUM VALUE MAXIMUM VALUE
Moisture 6.0 wt% H2O 8.0 wt% H2O
Copper Grade 24 wt% Cu --
Zinc Impurity Concentration -- 2.5 wt% Zn
Lead Impurity Concentration -- 0.5 wt% Pb
Arsenic Impurity Concentration -- 1,000 g/t As
Antimony Impurity Concentration -- 500 g/t Sb
Bismuth Impurity Concentration -- 400 g/t Bi
Mercury Impurity Concentration -- 10 g/t Hg
Copper Recovery The project objectives were based on achieving a minimum overall bench scale flotation circuit copper recovery of 94%. Gold Recovery - Extraction The project objectives were also based on the recovery of gold with the copper concentrate; as deemed viable using industrial standard measures for copper flotation. The flotation tests assessed the recovery of gold by various copper flotation reagent schemes. Development of additional unit operations for gold recovery from flotation tailings or ore were not included as part of the work scope. Backfill Mix Requirements The test program did not include development of mix ratios (cement, tailings and water) relative to tailings particle size distribution and mine backfill specifications. A backfill program is not required for mining of the 1807 and massive sulphide zones and will be an integral part of flowsheet development for production from the footwall zone. Zinc Suppression / Rejection to Tailings The test program was based on suppression of zinc with tailings and did not include testing of a sequential copper-zinc float (no zinc flotation circuit). Run of Mine Ore Grade and Representative Sampling The flowsheet development test program was based on obtaining a representative sample of run-of-mine ore. It was the responsibility of Rambler to manage sample collection for test purposes, to assure that the ore sample was typical of the ore zone and was based on Rambler’s sampling quality assurance procedures.

Rambler Metals and Mining Canada Limited Project 6409-04 Final Report Phase IV Flotation Bench Scale Lock Cycle Test Program Page 10 of 78
Thibault & Associates Inc.
Applied Process Chemical Engineering
SECTION 3.0 - SAMPLE PREPARATION AND CHARACTERIZATION
The 400 kg mini bulk ore sample collected by Rambler Metals and Mining Canada was received by the Research and Productivity Council (RPC) the week of July 7th, 2008. A portion of the mini bulk ore sample was nominally crushed to a P80 of about 1" to 1½" and blended for the flotation test program. Sub-samples were split and sent for metal assays (see Section 3.1), mineralogical review (see Section 3.2) and Bond Rod and Ball Mill Work Index tests (see Section 3.3) and the remainder reserved for flotation testing. The specific gravity and bulk density of the crushed and ground ore was also determined (see Section 3.4). Details of procedures for sample preparation, sample blending and sub-sample splitting are given by RPC Report No. PET-J1726 entitled, Mineral Benefication - Scoping/Optimization/Locked Cycle Flotation Tests Rambler Cu-Au Mineralization, dated December 4th, 2008); included as Appendix B. The three 20 kg core samples for ore variability testing were received by RPC on July 21st, 2008, with a sub-sample from each being sent for metal assays (see Section 3.1) and the remainder reserved for a limited number of batch flotation tests designed to assess rougher grade-recovery-time profiles of the alternative ore zones relative to the bulk (massive sulphide zone) sample using the optimized reagent scheme as a result of the bulk flotation test program.
3.1 Metal and Elemental Assays
Portions of the bulk 1600-level ore sample and three core samples from alternative ore zones were split and sent to the Minerals Engineering Center at Dalhousie University (formerly Daltech) for major metals assays, to Polymet Laboratories for gold fire assays and to Activation Laboratories for trace element analysis. The results are summarized in Tables 3 and 4 below.
Table 3: Head Sample Assay Data for Major Metals
SAMPLE ID ASSAY UNITS
Bulk 1600 Level [1] Bulk 1600 Level [2] 1807 High Au - Low Zn 1807 High Zn Lower FWZ
Iron % Fe 32.18 31.72 29.82 35.50 11.64
Copper % Cu 5.21 5.42 7.87 10.16 2.42
Zinc % Zn 2.60 2.42 0.66 4.69 0.05
Lead % Pb 0.34 0.33 0.11 0.17 0.006
Silver ppm Ag 30 31 16 21 3
Table Notes: [1] Assay of bulk sample reported at onset of bench scale test program in July, 2008. [2] Assay of bulk sample reported at onset of lock cycle tests in November, 2008.
Table 4: Head Sample Assay Data for Trace Elements
SAMPLE ID ASSAY UNITS
Bulk 1600 Level 1807 High Au - Low
Zn 1807 High Zn Lower FWZ
Gold ppm Au 3.66 2.38 1.92 0.086
Silver ppm Ag 23.4 13.1 16.5 2.65
Cadmium ppm Cd 128 43.1 271 2.4
Molybdenum ppm Mo 56 35 45 2

Rambler Metals and Mining Canada Limited Project 6409-04 Final Report Phase IV Flotation Bench Scale Lock Cycle Test Program Page 11 of 78
Thibault & Associates Inc.
Applied Process Chemical Engineering
SAMPLE ID ASSAY UNITS
Bulk 1600 Level 1807 High Au - Low
Zn 1807 High Zn Lower FWZ
Nickel ppm Ni 67.1 30.5 39 73.1
Sulphur % S > 20.0 > 20.0 >20.0 5.02
Aluminum % Al 1.15 2.23 0.36 3.75
Arsenic ppm As 1180 636 660 60
Barium ppm Ba 19 24 17 22
Beryllium ppm Be 0.2 0.2 <0.1 0.2
Bismuth ppm Bi 5.3 19.9 29.8 3.4
Bromine ppm Br < 0.5 <0.5 <0.5 <0.5
Calcium % Ca 1.17 1.13 0.29 0.28
Cobalt ppm Co 245 155 204 95
Chromium ppm Cr 28 66 10 277
Cesium ppm Cs 0.23 0.38 0.12 0.44
Hafnium ppm Hf 26.5 0.4 0.1 1
Gallium ppm Ga 0.3 6.1 5.5 9
Germanium ppm Ge < 1 1.3 1.6 0.6
Mercury ppm Hg 8.1 4 7 <1
Indium ppm In 2.7 2.3 3.8 0.6
Iridium ppb Ir 34 <5 <5 <5
Potassium % K 3.9 0.5 0.06 0.2
Lithium ppm Li < 5 3.9 0.9 9.8
Magnesium % Mg 0.21 0.49 0.08 3.6
Manganese ppm Mn 1.9 412 113 399
Sodium % Na 0.28 0.6 0.11 0.24
Niobium ppm Nb 0.9 0.7 0.2 1.5
Phosphorus % P 0.042 0.039 0.032 0.015
Rubidium ppm Rb 5.9 14.3 2.2 1.5
Rhenium ppm Re 0.029 0.01 0.01 0.007
Antimony ppm Sb 158 32.9 27.6 1.3
Scandium ppm Sc 4.3 7.2 1.2 20.8
Selenium ppm Se 114 196 227 53
Tin ppm Sn 20 17 26 6
Strontium ppm Sr 16.3 22.5 7.8 8.5
Tantalum ppm Ta <0.1 <0.1 <0.1 <0.1
Tellurium ppm Te 19.1 88.1 118 14.2
Titanium % Ti 0.08 0.09 0.01 0.08
Thorium ppm Th 1 0.6 0.3 1.6
Thallium ppm Tl 3.82 3.9 2.28 0.19
Uranium ppm U 3.2 4.1 2.6 0.6
Vanadium ppm V 116 103 76 122
Tungsten ppm W 11 <1 <1 <1

Rambler Metals and Mining Canada Limited Project 6409-04 Final Report Phase IV Flotation Bench Scale Lock Cycle Test Program Page 12 of 78
Thibault & Associates Inc.
Applied Process Chemical Engineering
SAMPLE ID ASSAY UNITS
Bulk 1600 Level 1807 High Au - Low
Zn 1807 High Zn Lower FWZ
Yttrium ppm Y 3.8 5.1 0.8 1.6
Zirconium ppm Zr 14 20 7 30
Lanthanum ppm La 2 2.6 0.5 0.9
Cerium ppm Ce 4.6 5.7 1.1 2.1
Praseodymium ppm Pr 0.6 0.9 0.2 0.3
Neodymium ppm Nd 2.4 3.6 0.6 1.3
Samarium ppm Sm 0.6 0.8 0.1 0.3
Europium ppm Eu 0.22 0.28 < 0.05 0.05
Gadolinium ppm Gd 0.7 1 0.2 0.3
Dysprosium ppm Dy 0.6 0.9 0.2 0.4
Terbium ppm Tb 0.1 0.1 < 0.1 0.1
Holmium ppm Ho 0.2 0.2 < 0.1 0.1
Erbium ppm Er 0.4 0.7 0.1 0.3
Thulium ppm Tm 0.1 0.1 < 0.1 < 0.1
Ytterbium ppm Yb 0.4 0.6 0.1 0.3
Lutetium ppm Lu 0.1 0.1 < 0.1 0.1
Trace elements that are most likely to incur smelter penalty charges include lead, zinc, arsenic, bismuth, mercury and antimony. Of these, arsenic, zinc, mercury and lead are of the greatest concern with respect to benefication of the bulk 1600 level (massive sulphide 1807 zone) ore. At the head grades indicated in Tables 3 and 4, greater than 90% rejection of arsenic, 88% rejection of zinc, 85% rejection of mercury and 80% rejection of lead (assuming overall mass rejection rate of 88.5%) would have to be achieved overall in the flotation circuit in order to meet the typical maximum impurity limits listed in Table 2 in Section 2.2 (as defined by previous operator smelter schedule).
3.2 Mineralogical Review
A polished grain mount was produced from a portion of the bulk 1600 level massive sulphide ore sample and examined by scanning electron microscopy and energy dispersive spectrometer (SEM-EDS) at the University of New Brunswick (reference RPC Mineralogy Report No. PET-J1726, dated August 12th, 2008). The analysis concluded that the Rambler massive sulphide sample was relatively coarse grained and mainly consisted of pyrite (estimated as 65%), silicates (estimated as 15%), chalcopyrite (estimated at 15%) and sphalerite (estimated at 5%) with trace amounts of arsenopyrite and galena. Gold mineralization was not identified in the section examined. Pyrite was determined to be coarse to medium grained (50 to 300 micron) with interstitial chalcopyrite and sphalerite, with almost complete liberation of chalcopyrite estimated to be attained at a P80 of around 50 micron. Figure 3 shows a low magnification overview image of the sample with pyrite (dark grey) identified as "py", chalcopyrite (medium grey) identified as "ccp", sphalerite (light grey) identified as "sp" and galena (white) identified as "gn". See RPC Mineralogical Report No. PET-J1726 attached as Appendix C for full details of the mineralogical review.

Rambler Metals and Mining Canada Limited Project 6409-04 Final Report Phase IV Flotation Bench Scale Lock Cycle Test Program Page 13 of 78
Thibault & Associates Inc.
Applied Process Chemical Engineering
Figure 3: Overview SEM Image of Rambler 1600 Level Ore Sample
3.3 Bond Work Index
A 30 kg portion of the bulk Rambler massive sulphide ore zone sample shipped to SGS Mineral Services for grindability testing (reference SGS Mineral Services Report No. 11707-002 entitled, "The Grindability Characteristics of a Single Sample", dated September 4th, 2008, attached as Appendix D). The Bond Rod Mill Work Index and the Bond Ball Mill Work Index were determined to be 6.7 and 8.0 kWh/tonne respectively.
3.4 Specific Gravity and Bulk Density Analysis
The solids specific gravity and bulk density of both crushed and ground bulk ore sample were determined for use in process equipment, bulk storage and transport equipment sizing. The results are summarized in Table 5.
Table 5: Solids Specific Gravity and Bulk Density of Crushed and Ground Ore
SAMPLE ID SPECIFIC GRAVITY (WATER = 1.0) BULK DENSITY (g/cm3)
Bulk sample - crushed to 80% Passing 19.0 mm 3.96 2.15
Bulk sample - ground to 80% passing 60.3 micron 4.10 2.15
py
ccp
ccp
py
py
py
sp
gn

Rambler Metals and Mining Canada Limited Project 6409-04 Final Report Phase IV Flotation Bench Scale Lock Cycle Test Program Page 14 of 78
Thibault & Associates Inc.
Applied Process Chemical Engineering
SECTION 4.0 - TEST WORK DESCRIPTION AND RATIONALE
The bench scale test program was designed by Thibault & Associates Inc. and executed by RPC to identify a process flowsheet for optimum recovery of copper from the Rambler massive sulphide zones and to provide design parameters for equipment sizing and selection. Design parameters required to generate a mass balance model of the proposed flowsheet and define the basis for equipment sizing include grinding power requirements, grind size requirements, flotation cell residence time, reagent consumption, concentrate dewatering filtration requirements and tailings treatment neutralization requirements.
4.1 Literature Search and Reagent Selection
A literature search was completed to identify flotation reagents that are commonly used in commercial scale copper flotation processes and that have been proven effective for optimum recovery of copper, selectivity against pyrite and sphalerite and for co-recovery of gold. Product selection specialists at Cytec Industries Inc., a leading supplier of mining chemicals and flotation reagents (formerly known as Cyanamid). A reagent selection test matrix was proposed that included various combinations of the following collectors, promoters, pH modifiers and depressants: Collectors KAX (potassium amyl xanthate) - strong collecting power / low selectivity KIBX (potassium isobutyl xanthate) - intermediate collecting power / moderate selectivity KEX (potassium ethyl xanthate) - weak collector / high selectivity NOTE: Potassium based collector reagents KAX, KEX and KIBX are also sometimes referred to as PAX,
PEX and PIBX and the two acronyms are used interchangeably in industry. Promoters Aerophine 3418A (sodium diisobutyldithiophosphinate) - phosphine derivative commonly used in copper
flotation circuits exhibiting benefits of: increased recovery of associated precious metals (e.g. gold and silver) higher recovery and selectivity in the flotation of complex ores improved selectivity against pyrite reduction in dosage compared to xanthates
Aero 5100 (functionalized dithiocarbamate) - highly selective oily (non water soluble) promoter that has gained significant popularity in the last 10-15 years for selective flotation of copper from complex ores as a result of exhibiting: very high selectivity against pyrite, pyrrhotite, unactivated sphalerite and galena in mildly alkaline
circuits significant reduction in lime dosage (effective at lower pH range) rapid flotation kinetics
Aerofloat 208 (sodium diethyl and butyldithiophosphates) - water soluble promoter commonly used in flotation of gold, silver and copper ores
Aero 5688 (monothiophosphate) - novel water soluble promoter found to be particularly effective for selective flotation of precious metals in alkaline circuits, but which has not been used extensively in commercial scale applications.

Rambler Metals and Mining Canada Limited Project 6409-04 Final Report Phase IV Flotation Bench Scale Lock Cycle Test Program Page 15 of 78
Thibault & Associates Inc.
Applied Process Chemical Engineering
pH Modifiers Lime (Ca(OH)2) Sodium Carbonate (Na2CO3) Zinc Depressants Zinc sulphate (ZnSO4) Sodium metabisulphite (Na2S2O5) Sodium cyanide (NaCN) Frother MIBC (methyl isobutyl carbinol) - aliphatic alcohol frother used extensively in most types of froth flotation
circuits The literature search was primarily focussed on identification of flotation reagents commonly used for selective flotation of copper-zinc-gold ores and obtaining typical flowsheets for commercial scale copper flotation circuits that use similar reagent combinations to those proposed for the test work. It was concluded that reagent schemes and flowsheet layout were unique to each processor and had been designed based on extensive bench scale test work and full scale plant trials. Commonalities noted amongst several of the flowsheets included: Use of sequential flotation to produce a primary copper concentrate and a secondary zinc (and/or lead)
concentrate. In these circuits, the tails from the copper rougher flotation stage were typically directed to the zinc circuit following activation of the sphalerite with copper sulphate reagent. Zinc circuits were typically operated at alkaline pH of 10.0 to 12.0.
Use of staged conditioning for addition of zinc depressants (such as zinc sulphate, sodium cyanide and sulphidizing reagents), collectors, promoters and frother. Zinc depressants were typically either added to the primary grinding mill or to a pre-conditioning stage prior to addition of collectors or promoters.
Use of dedicated conditioning tanks for both the rougher and cleaner feed streams. Use of regrind in the cleaner circuit. Wide variations between different operations were found with respect to the following: pH in the copper circuit. Operating pH in the copper circuit varied from mildly acidic (pH 4.0 to 6.5) to
highly alkaline (pH 10.5 to 11.5) and some processors found it effective to operate the grinding mills, conditioning stages and flotation cells at different pH values with some conditioning at low pH and floating at higher pH.
Reagent schemes, combinations of collectors / promoters, types and combinations of zinc depressants, reagent dosages and reagent point of addition.
Use of rougher-scavenger flotation cells and number of cleaner flotation stages. Destination of recirculating loads such as rougher tails, rougher-scavenger concentrate and tails, tails
from cleaning stages, etc. As a result, it was determined that the design of the Rambler copper flotation flowsheet would be based on common industrial practices, but with unique design aspects being derived from the results of the present batch and lock cycle flotation tests.

Rambler Metals and Mining Canada Limited Project 6409-04 Final Report Phase IV Flotation Bench Scale Lock Cycle Test Program Page 16 of 78
Thibault & Associates Inc.
Applied Process Chemical Engineering
4.2 Preliminary Rougher and Rougher-Scavenger Batch Flotation Tests
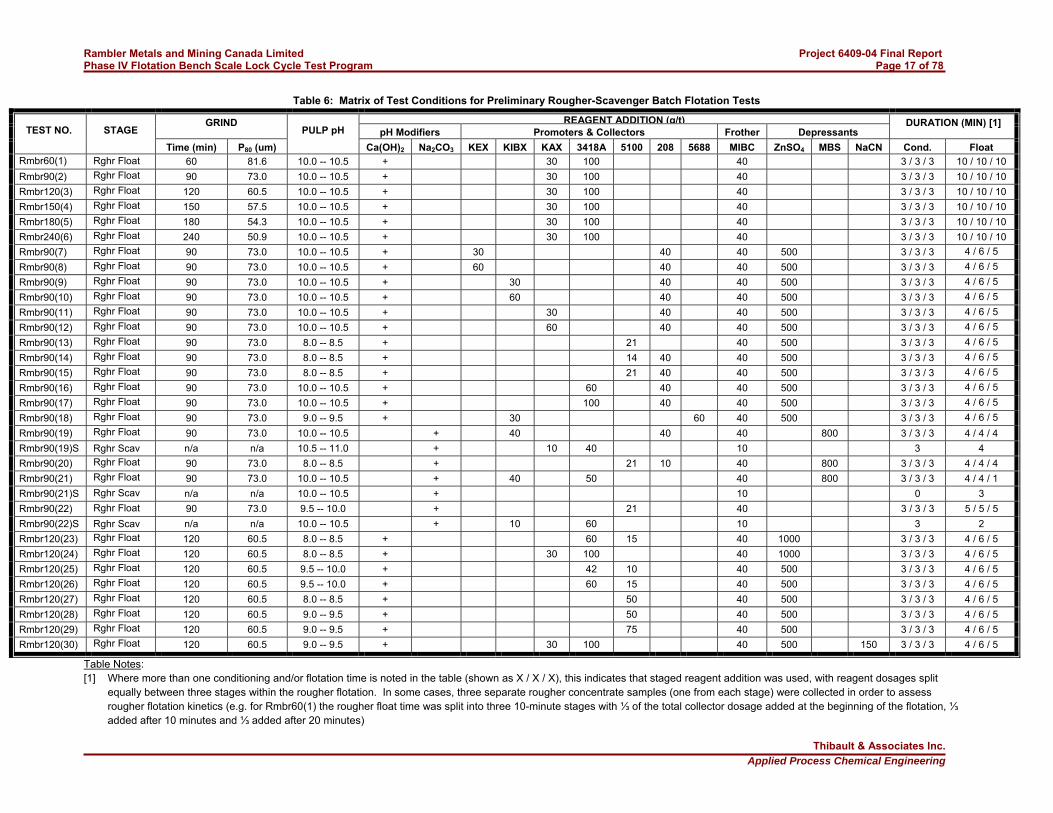
A matrix of thirty preliminary rougher and batch flotation tests was completed on the massive sulphide zone (1600 level) mini-bulk ore sample to determine the optimum primary (rougher flotation) grind specification, reagent scheme and reagent dosages. The results of these tests were analyzed based on copper and gold recovery, selectivity with respect to zinc and overall rejection of mass (i.e. rejection of gangue materials to the rougher tails) within the rougher circuit. In general, the rougher circuit is typically operated to optimize on recovery of the valuable metals (copper, gold, silver), while the cleaner circuit is operated to achieve the desired grade of copper in the final concentrate; however, a minimum grade of copper in the rougher concentrate must also be achieved to provide an acceptable feed to the cleaners. Reagent dosages for rougher-scavenger floats are based on the mass of solids in the feed to the rougher-scavenger. Test conditions for the preliminary rougher and rougher-scavenger batch flotation tests are summarized in Table 6. Specific test procedures are described in RPC Mineral Benefication Report No. PET-J1726 included as Appendix B.
Rambler Metals and Mining Canada Limited Project 6409-04 Final Report Phase IV Flotation Bench Scale Lock Cycle Test Program Page 17 of 78
Thibault & Associates Inc.
Applied Process Chemical Engineering
Table 6: Matrix of Test Conditions for Preliminary Rougher-Scavenger Batch Flotation Tests
REAGENT ADDITION (g/t)GRIND pH Modifiers Promoters & Collectors Frother Depressants
DURATION (MIN) [1] TEST NO. STAGE
Time (min) P80 (um)
PULP pH
Ca(OH)2 Na2CO3 KEX KIBX KAX 3418A 5100 208 5688 MIBC ZnSO4 MBS NaCN Cond. Float Rmbr60(1) Rghr Float 60 81.6 10.0 -- 10.5 + 30 100 40 3 / 3 / 3 10 / 10 / 10
Rmbr90(2) Rghr Float 90 73.0 10.0 -- 10.5 + 30 100 40 3 / 3 / 3 10 / 10 / 10
Rmbr120(3) Rghr Float 120 60.5 10.0 -- 10.5 + 30 100 40 3 / 3 / 3 10 / 10 / 10
Rmbr150(4) Rghr Float 150 57.5 10.0 -- 10.5 + 30 100 40 3 / 3 / 3 10 / 10 / 10
Rmbr180(5) Rghr Float 180 54.3 10.0 -- 10.5 + 30 100 40 3 / 3 / 3 10 / 10 / 10
Rmbr240(6) Rghr Float 240 50.9 10.0 -- 10.5 + 30 100 40 3 / 3 / 3 10 / 10 / 10
Rmbr90(7) Rghr Float 90 73.0 10.0 -- 10.5 + 30 40 40 500 3 / 3 / 3 4 / 6 / 5 Rmbr90(8) Rghr Float 90 73.0 10.0 -- 10.5 + 60 40 40 500 3 / 3 / 3 4 / 6 / 5 Rmbr90(9) Rghr Float 90 73.0 10.0 -- 10.5 + 30 40 40 500 3 / 3 / 3 4 / 6 / 5 Rmbr90(10) Rghr Float 90 73.0 10.0 -- 10.5 + 60 40 40 500 3 / 3 / 3 4 / 6 / 5 Rmbr90(11) Rghr Float 90 73.0 10.0 -- 10.5 + 30 40 40 500 3 / 3 / 3 4 / 6 / 5 Rmbr90(12) Rghr Float 90 73.0 10.0 -- 10.5 + 60 40 40 500 3 / 3 / 3 4 / 6 / 5 Rmbr90(13) Rghr Float 90 73.0 8.0 -- 8.5 + 21 40 500 3 / 3 / 3 4 / 6 / 5 Rmbr90(14) Rghr Float 90 73.0 8.0 -- 8.5 + 14 40 40 500 3 / 3 / 3 4 / 6 / 5 Rmbr90(15) Rghr Float 90 73.0 8.0 -- 8.5 + 21 40 40 500 3 / 3 / 3 4 / 6 / 5 Rmbr90(16) Rghr Float 90 73.0 10.0 -- 10.5 + 60 40 40 500 3 / 3 / 3 4 / 6 / 5 Rmbr90(17) Rghr Float 90 73.0 10.0 -- 10.5 + 100 40 40 500 3 / 3 / 3 4 / 6 / 5 Rmbr90(18) Rghr Float 90 73.0 9.0 -- 9.5 + 30 60 40 500 3 / 3 / 3 4 / 6 / 5 Rmbr90(19) Rghr Float 90 73.0 10.0 -- 10.5 + 40 40 40 800 3 / 3 / 3 4 / 4 / 4
Rmbr90(19)S Rghr Scav n/a n/a 10.5 -- 11.0 + 10 40 10 3 4
Rmbr90(20) Rghr Float 90 73.0 8.0 -- 8.5 + 21 10 40 800 3 / 3 / 3 4 / 4 / 4
Rmbr90(21) Rghr Float 90 73.0 10.0 -- 10.5 + 40 50 40 800 3 / 3 / 3 4 / 4 / 1
Rmbr90(21)S Rghr Scav n/a n/a 10.0 -- 10.5 + 10 0 3
Rmbr90(22) Rghr Float 90 73.0 9.5 -- 10.0 + 21 40 3 / 3 / 3 5 / 5 / 5
Rmbr90(22)S Rghr Scav n/a n/a 10.0 -- 10.5 + 10 60 10 3 2
Rmbr120(23) Rghr Float 120 60.5 8.0 -- 8.5 + 60 15 40 1000 3 / 3 / 3 4 / 6 / 5
Rmbr120(24) Rghr Float 120 60.5 8.0 -- 8.5 + 30 100 40 1000 3 / 3 / 3 4 / 6 / 5
Rmbr120(25) Rghr Float 120 60.5 9.5 -- 10.0 + 42 10 40 500 3 / 3 / 3 4 / 6 / 5
Rmbr120(26) Rghr Float 120 60.5 9.5 -- 10.0 + 60 15 40 500 3 / 3 / 3 4 / 6 / 5
Rmbr120(27) Rghr Float 120 60.5 8.0 -- 8.5 + 50 40 500 3 / 3 / 3 4 / 6 / 5
Rmbr120(28) Rghr Float 120 60.5 9.0 -- 9.5 + 50 40 500 3 / 3 / 3 4 / 6 / 5
Rmbr120(29) Rghr Float 120 60.5 9.0 -- 9.5 + 75 40 500 3 / 3 / 3 4 / 6 / 5
Rmbr120(30) Rghr Float 120 60.5 9.0 -- 9.5 + 30 100 40 500 150 3 / 3 / 3 4 / 6 / 5
Table Notes: [1] Where more than one conditioning and/or flotation time is noted in the table (shown as X / X / X), this indicates that staged reagent addition was used, with reagent dosages split
equally between three stages within the rougher flotation. In some cases, three separate rougher concentrate samples (one from each stage) were collected in order to assess rougher flotation kinetics (e.g. for Rmbr60(1) the rougher float time was split into three 10-minute stages with ⅓ of the total collector dosage added at the beginning of the flotation, ⅓ added after 10 minutes and ⅓ added after 20 minutes)

Rambler Metals and Mining Canada Limited Project 6409-04 Final Report Phase IV Flotation Bench Scale Lock Cycle Test Program Page 18 of 78
Thibault & Associates Inc.
Applied Process Chemical Engineering
4.3 Cleaning Flotation Tests
A matrix of ten cleaning flotation tests was completed on rougher concentrates produced from the proposed reagent scheme (KAX plus 3418A collector / promoter combination, MIBC frother and lime as pH modifier) selected from preliminary rougher scoping tests (rougher concentrate produced under conditions identical to test no. Rmbr90(2) with addition of 500 g/t of zinc sulphate to improve on zinc depression) to determine requirements for re-grind of the cleaner feed and reagent dosages. Two additional cleaner flotation tests were completed using the rougher concentrates produced from test nos. Rmbr120(28) and Rmbr120(30) using alternative reagent schemes (see Table 6 for complete list of rougher conditions). One final cleaner test was performed using a slight variation on the proposed reagent scheme (rougher concentrate produced under conditions identical to test no. Rmbr90(2) with addition of 1000 g/t of zinc sulphate to improve on zinc depression) to obtain detailed data on the cleaner flotation kinetics. All of the cleaner tests utilized lime for pH control. Reagent dosages are based on the mass of solids fed to the cleaner. The results of these tests were analyzed based on copper and gold recovery, selectivity with respect to zinc and ability to achieve target grades of copper (minimum 24% Cu w/w) and zinc (maximum 2.5% Zn w/w) in the final concentrate product. Test conditions for the cleaning flotation tests are summarized in Table 7.

Rambler Metals and Mining Canada Limited Project 6409-04 Final Report Phase IV Flotation Bench Scale Lock Cycle Test Program Page 19 of 78
Thibault & Associates Inc.
Applied Process Chemical Engineering
Table 7: Matrix of Test Conditions for Batch Cleaner Flotation Tests
REAGENT ADDITION (g/t)GRIND / REGRIND Promoters & Collectors Frother Depressants
DURATION [1] TEST NO. STAGE
Time (min) P80 (um)
PULP pH
KAX 3418A 5100 208 MIBC ZnSO4 MBS NaCN Conditioning (min) Float (min)
Rougher 90 73.0 10.0 -- 10.5 30 100 40 500 5 / 5 / 5 8 / 6 / 4
Cleaner 1 n/a 39.9 10.0 -- 10.5 15 500 1 15
Cleaner 2 n/a 10.0 -- 10.5 10 1 15 Rmbr-1-Clnr
Cleaner 1 Scav. n/a 10.0 -- 10.5 5 10 5 8
Rougher 90 73.0 10.0 -- 10.5 30 100 40 500 5 / 5 / 5 8 / 6 / 4
Cleaner 1 15 sm. mill 37.6 10.0 -- 10.5 15 500 1 15
Cleaner 2 n/a 10.0 -- 10.5 10 1 15 Rmbr-2-Clnr
Cleaner 1 Scav. n/a 10.0 -- 10.5 5 10 5 8
Rougher 90 73.0 10.0 -- 10.5 30 100 40 500 5 / 5 / 5 8 / 6 / 4
Cleaner 1 10 sm. Mill 30.8 10.0 -- 10.5 15 500 1 15
Cleaner 2 n/a 10.0 -- 10.5 10 1 15 Rmbr-3-Clnr
Cleaner 1 Scav. n/a 10.0 -- 10.5 5 10 5 8
Rougher 90 73.0 10.0 -- 10.5 30 100 40 500 5 / 5 / 5 8 / 6 / 4
Cleaner 1 15 med. Mill 30.5 10.0 -- 10.5 15 500 1 15
Cleaner 2 n/a 10.0 -- 10.5 10 1 15 Rmbr-4-Clnr
Cleaner 1 Scav. n/a 10.0 -- 10.5 5 10 5 8
Rougher 90 73.0 10.0 -- 10.5 30 100 40 500 5 / 5 / 5 8 / 6 / 4
Cleaner 1 30 med. Mill 25.1 10.0 -- 10.5 10 33.3 15 500 5 15
Cleaner 2 n/a 10.0 -- 10.5 10 1 15 Rmbr-5-Clnr
Cleaner 1 Scav. n/a 10.0 -- 10.5 20 10 5 8
Rougher 90 73.0 10.0 -- 10.5 30 100 40 500 5 / 5 / 5 8 / 6 / 4
Cleaner 1 30 med. Mill 25.1 10.5 -- 11.0 15 80 15 500 3 / 3 10 / 8
Cleaner 2 n/a 10.5 -- 11.0 5 15 10 5 15 Rmbr-6-Clnr
Cleaner 1 Scav. n/a 10.5 -- 11.0 2 5 5 5 8
Rougher 90 73.0 10.0 -- 10.5 30 100 40 500 5 / 5 / 5 8 / 6 / 4
Cleaner 1 30 med. Mill 25.1 10.5 -- 11.0 15 80 15 1000 3 / 3 10 / 8
Cleaner 2 n/a 10.5 -- 11.0 5 15 10 5 15 Rmbr-7-Clnr
Cleaner 1 Scav. n/a 10.5 -- 11.0 2 5 5 5 8
Rougher 90 73.0 10.0 -- 10.5 30 100 40 500 5 / 5 / 5 8 / 6 / 4
Cleaner 1 30 med. Mill 25.1 10.5 -- 11.0 15 80 15 500 800 3 / 3 10 / 8
Cleaner 2 n/a 10.5 -- 11.0 5 15 10 5 15 Rmbr-8-Clnr
Cleaner 1 Scav. n/a 10.5 -- 11.0 2 5 5 5 20

Rambler Metals and Mining Canada Limited Project 6409-04 Final Report Phase IV Flotation Bench Scale Lock Cycle Test Program Page 20 of 78
Thibault & Associates Inc.
Applied Process Chemical Engineering
REAGENT ADDITION (g/t)GRIND / REGRIND Promoters & Collectors Frother Depressants
DURATION [1] TEST NO. STAGE
Time (min) P80 (um)
PULP pH
KAX 3418A 5100 208 MIBC ZnSO4 MBS NaCN Conditioning (min) Float (min)
Rougher 90 73.0 10.0 -- 10.5 30 100 40 500 5 / 5 / 5 8 / 6 / 4
Cleaner 1 30 med. Mill 25.1 10.0 -- 10.5 15 80 15 1000 3 / 3 10 / 10
Cleaner 2 n/a 10.0 -- 10.5 10 1000 5 15 Rmbr-9-Clnr
Cleaner 1 Scav. n/a 10.0 -- 10.5 5 1000 5 20
Rougher 90 73.0 10.0 -- 10.5 30 100 40 500 5 / 5 / 5 8 / 6 / 4
Cleaner 1 30 med. Mill 25.1 10.0 -- 10.5 15 80 15 1000 5 / 5 10 / 10
Cleaner 2 n/a 10.0 -- 10.5 10 1000 5 15 Rmbr-10-Clnr
Cleaner 1 Scav. n/a 10.0 -- 10.5 5 1000 5 20
Rougher 90 73.0 10.0 -- 10.5 30 100 40 1000 5 / 5 / 5 8 / 6 / 4
Cleaner 1 30 med. Mill 25.1 10.0 -- 10.5 15 80 15 1000 800 5 / 5 8 / 7 Rmbr-11-Clnr
Cleaner 1 Scav. n/a 10.0 -- 10.5 10 10 5 1000 5 20
Rougher 120 60.5 9.0 -- 9.5 50 40 500 5 / 5 / 5 4 / 6 / 5
Cleaner 1 30 med. Mill 20.0 9.0 -- 9.5 5 6 10 500 10 ZnSO4 / 5 15
Cleaner 2 n/a 9.0 -- 9.5 5 5 15 Rmbr-12-Clnr
Cleaner 1 Scav. n/a 9.0 -- 9.5 5 5 20
Rougher 120 60.5 9.0 -- 9.5 30 100 40 500 150 5 / 5 / 5 4 / 6 / 5
Cleaner 1 30 med. Mill 20.0 9.0 -- 9.5 5 30 10 500 150 10 ZnSO4 / 5 / 5 8 / 7
Cleaner 2 n/a 9.0 -- 9.5 3 15 5 5 15 Rmbr-13-Clnr
Cleaner 1 Scav. n/a 9.0 -- 9.5 2 5 5 5 20
Table Notes: [1] Where more than one conditioning and/or flotation time is noted in the table (shown as X / X / X), this indicates that staged reagent addition was used, with reagent dosages split
equally between three stages within the rougher flotation. In some cases, more than one concentrate sample (one from each stage) were collected in order to assess rougher and/or cleaner flotation kinetics. "10 ZnSO4" signifies that a 10 minute pre-conditioning stage for conditioning of zinc depressant reagents was employed.

Rambler Metals and Mining Canada Limited Project 6409-04 Final Report Phase IV Flotation Bench Scale Lock Cycle Test Program Page 21 of 78
Thibault & Associates Inc.
Applied Process Chemical Engineering
4.4 Lock Cycle Flotation Test
Based on selection of optimum process conditions from batch rougher / cleaner / scavenger flotation tests and determination of a conceptual flowsheet for production of copper concentrate, one lock cycle test was performed, consisting of eight complete cycles. In each complete test cycle, middlings (in the form of cleaner tails and scavenger concentrates and tails) are recycled to the appropriate flotation stage in the subsequent cycle in order to simulate continuous process operation using bench scale batch flotation equipment. Between cycles, middling streams are filtered and the wet cake mass recorded to give an indication of when and if the middlings weights stabilize. Each cycle produces a final tails and a final concentrate which are dried, weighed and assayed. A continuous process is most accurately represented when the lock cycle test reaches equilibrium - usually after 4 to seven cycles have been completed. Equilibrium is said to be reached when, for at least two consecutive cycles: the weights of recycle streams stabilize; the combined weights of the final concentrate plus the final tails stabilize and approximate the weight of
fresh ore charged to each new cycle; the assays of the final concentrate and the final tails stabilize and the calculated head assay
approximates the actual head assay; metallurgical distribution between the final concentrate and the final tails stabilize. During the lock cycle tests, the following analyses were carried out to facilitate comprehensive characterization of the flowsheet subsequent to the completion of the testing: Solids dry mass was determined after each of the eight cycles for:
secondary cleaner concentrate (final concentrate) rougher-scavenger tails (final tails)
Filter cake wet mass was determined during each of the eight cycles for: rougher concentrate rougher-scavenger concentrate cleaner-scavenger concentrate cleaner-scavenger tails secondary cleaner tails
Preliminary XRF(x-ray fluorescence) and definitive metal assays for Cu / Zn / Fe / Pb of final concentrate and final tails upon completion of each cycle.
Definitive assay for Cu / Zn / Fe / Pb / Ag / Au, trace metals analysis for As / Hg / Sb / Bi and dry mass upon completion of the last (8th) cycle for: rougher feed rougher concentrate rougher tails rougher-scavenger concentrate rougher-scavenger tails (final tails) primary cleaner feed primary cleaner concentrate primary cleaner tails cleaner-scavenger concentrate cleaner-scavenger tails secondary cleaner concentrate (final concentrate)

Rambler Metals and Mining Canada Limited Project 6409-04 Final Report Phase IV Flotation Bench Scale Lock Cycle Test Program Page 22 of 78
Thibault & Associates Inc.
Applied Process Chemical Engineering
secondary cleaner tails Malvern particle size distribution upon completion of the last (8th) cycle for:
primary grind mill product rougher concentrate rougher-scavenger tails (final tails) regrind mill product secondary cleaner concentrate (final concentrate)
pulp percent solids, pulp specific gravity and solids specific gravity upon completion of the last (8th) cycle for: rougher feed rougher-scavenger tails (final tails) primary cleaner feed secondary cleaner concentrate (final concentrate)
distribution of copper and zinc within selected particle size fractions upon completion of the last (8th) cycle for: fresh ore feed rougher-scavenger tails (final tails) secondary cleaner concentrate (final concentrate)
general inorganic chemistry and trace metals analysis of process water upon completion of the last (8th) cycle for: process water filtered from rougher-scavenger tails (final tails) process water filtered from secondary cleaner concentrate (final concentrate)
4.5 Ore Variability Flotation Tests
One set of batch rougher flotation tests was completed on each of three alternative ore zone samples using the optimum set of conditions determined for the conceptual flowsheet for processing of the 1807 zone (1600 level mini bulk ore sample) to assess the performance of the proposed flowsheet with respect to variable ore characteristics. Performance is assessed based on grade-recovery-time profiles of copper, zinc, lead, iron, silver and gold. Final concentrates from all three ore variability flotation tests were assayed for Cu / Zn / Fe / Pb / Ag / Au by definitive assay methods and for trace metals As / Hg / Sb / Bi. Samples of alternative ore zone samples for ore variability flotation tests were selected and collected by Rambler Metals and Mining Canada Limited and were received at RPC on July 21st, 2008, labelled as follows: 1807 High Au - Low Zinc 1807 High Zn Lower FWZ Head assays of the three samples are given in Table 3 and trace element analysis is listed in Table 4.
Rambler Metals and Mining Canada Limited Project 6409-04 Final Report Phase IV Flotation Bench Scale Lock Cycle Test Program Page 23 of 78
Thibault & Associates Inc.
Applied Process Chemical Engineering
4.6 Concentrate Dewatering Tests
Final concentrate from lock cycle flotation tests will be used to determine sedimentation rates (solids settleability) and filtration rates. The ability to meet copper concentrate end user moisture specifications using pressure filtration technology will be assessed and flocculation requirements determined.
4.7 Tailings Leachability and Treatability Tests
Tests were completed using tailings from lock cycle test #8 to assure compliance with tailings pond effluent discharge limits. Tailings stability including determination of the acid generating potential and potential for metals release (leachability) were assessed based on leach solution (water) dissolved oxygen levels, pH and contact time. Design requirements for tailings treatment using conventional treatment methods were defined.

Rambler Metals and Mining Canada Limited Project 6409-04 Final Report Phase IV Flotation Bench Scale Lock Cycle Test Program Page 24 of 78
Thibault & Associates Inc.
Applied Process Chemical Engineering
SECTION 5.0 - DISCUSSION OF RESULTS
5.1 Rougher and Rougher-scavenger Batch Flotation Tests
5.1.1 Primary (Rougher) Flotation Optimum Grind Size Determination
The first set of six batch rougher flotation tests were performed using the proposed reagent scheme (KAX plus 3418A collector / promoter combination, MIBC frother and lime as pH modifier to adjust pH within the range of 10.0 to 10.5) while making stage-wise adjustments to the nominal grind size (P80) of the feed from coarse to fine by increasing the residence time in the primary grinding mill for each subsequent test. The primary grind mill used throughout the batch rougher flotation tests was a rod mill charged with 1760 g of fresh ore (crushed to a P80 of 1" to 1½") for each batch. The particle size distribution of the feed to each rougher float was determined using a Malvern particle size distribution (PSD) analyzer. PSD results from the Malvern analyzer were checked by wet sieve analysis for three of the six different grind sizes. Where discrepancies existed between Malvern PSD data and wet sieve analysis, the P80 determined by wet sieve analysis is considered to be more accurate. The results of the particle size distribution analyses are presented in Table 8 and Figures 4, 5 and 6.
Table 8: P80 for Various Rod Mill Grind Times Determined by Malvern and Wet Sieve PSD Analysis
TEST NO. ROD MILL GRIND TIME (MIN) P80 by Malvern PSD Analysis (µm) P80 by Wet Sieve Analysis (µm)
Rmbr60(1) 60 81.6 not determined
Rmbr90(2) 90 77.5 73.0
Rmbr120(3) 120 60.3 60.5
Rmbr150(4) 150 63.2 57.5
Rmbr180(5) 180 54.3 not determined
Rmbr240(6) 240 50.9 not determined

Rambler Metals and Mining Canada Limited Project 6409-04 Final Report Phase IV Flotation Bench Scale Lock Cycle Test Program Page 25 of 78
Thibault & Associates Inc.
Applied Process Chemical Engineering
0.0
10.0
20.0
30.0
40.0
50.0
60.0
70.0
80.0
90.0
100.0
0.0 20.0 40.0 60.0 80.0 100.0 120.0 140.0 160.0 180.0 200.0
Size (µm)
%P
assi
ng
60 min
90 min
120 min
150 min
180 min
240 min
Figure 4: Malvern Particle Size Distribution Data for Primary Grind
0.0
10.0
20.0
30.0
40.0
50.0
60.0
70.0
80.0
90.0
100.0
20.0 40.0 60.0 80.0 100.0 120.0 140.0 160.0 180.0
Microns
%P
assi
ng
90 min
120 min
150 min
Figure 5: Wet Sieve Particle Size Distribution Data for Primary Grind

Rambler Metals and Mining Canada Limited Project 6409-04 Final Report Phase IV Flotation Bench Scale Lock Cycle Test Program Page 26 of 78
Thibault & Associates Inc.
Applied Process Chemical Engineering
y = 0.0012x2 - 0.5198x + 108.71R2 = 0.9826
0.0
10.0
20.0
30.0
40.0
50.0
60.0
70.0
80.0
90.0
100.0
50 70 90 110 130 150 170 190 210 230 250
Time (min)
P80
(M
icro
n)
P80 vs Grind Time
Poly. (P80 vs Grind Time)
Figure 6: Primary Grind Calibration Curve for Bench Scale Test Work
The resulting rougher concentrates from the six grind selection tests were assayed to determine grades and recovery for copper, zinc, iron, lead, silver and gold. Grade-recovery curves for copper, zinc, gold and silver relative to the nominal grind size (P80) of the feed are presented in Figures 7, 8, 9 and 10.

Rambler Metals and Mining Canada Limited Project 6409-04 Final Report Phase IV Flotation Bench Scale Lock Cycle Test Program Page 27 of 78
Thibault & Associates Inc.
Applied Process Chemical Engineering
92.0
93.0
94.0
95.0
96.0
97.0
98.0
99.0
100.0
50.0 55.0 60.0 65.0 70.0 75.0 80.0 85.0
Grind Size P80 (um)
Co
pp
er R
eco
very
(%
)
4.0
6.0
8.0
10.0
12.0
14.0
16.0
18.0
20.0
Co
pp
er G
rad
e (%
)
Cu Recovery
Cu Grade
Figure 7: Copper Rougher Grade-Recovery Curve Relative to Grind Size
76.0
78.0
80.0
82.0
84.0
86.0
88.0
90.0
92.0
50.0 55.0 60.0 65.0 70.0 75.0 80.0 85.0
Grind Size P80 (um)
Zin
c R
eco
very
(%
)
4.0
4.5
5.0
5.5
6.0
6.5
7.0
7.5
8.0
Zin
c G
rad
e (%
)
Zn Recovery
Zn Grade
Figure 8: Zinc Rougher Grade-Recovery Curve Relative to Grind Size
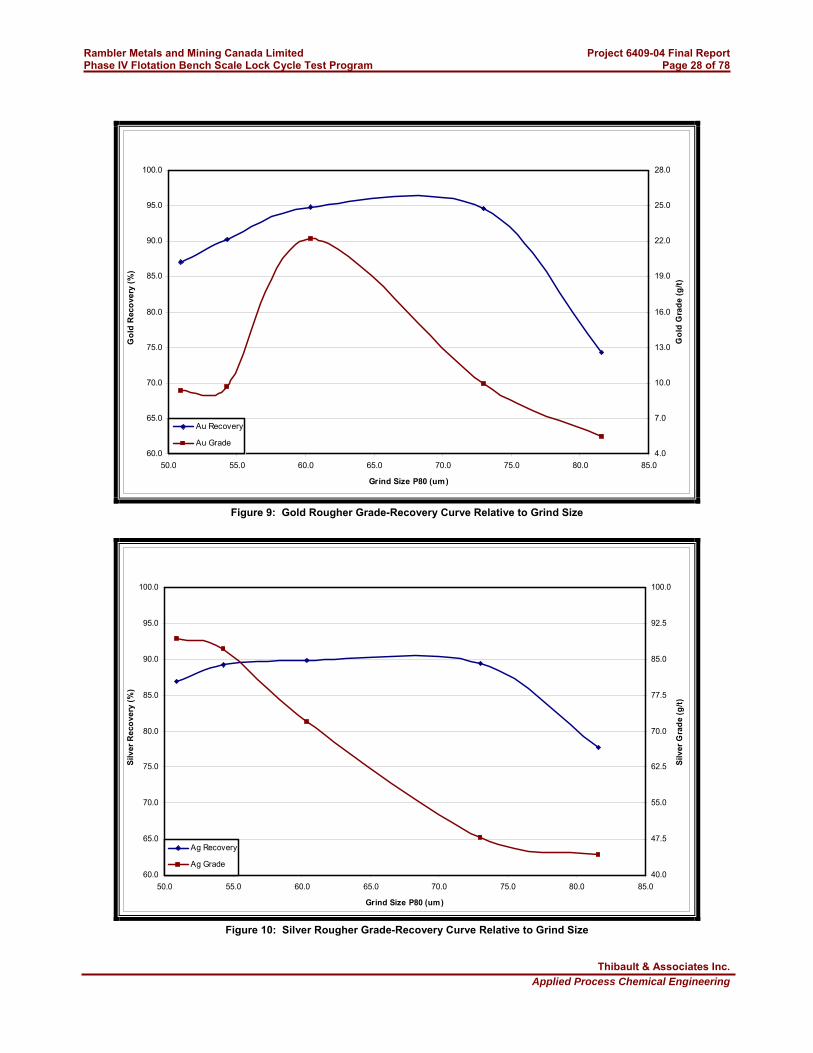
Rambler Metals and Mining Canada Limited Project 6409-04 Final Report Phase IV Flotation Bench Scale Lock Cycle Test Program Page 28 of 78
Thibault & Associates Inc.
Applied Process Chemical Engineering
60.0
65.0
70.0
75.0
80.0
85.0
90.0
95.0
100.0
50.0 55.0 60.0 65.0 70.0 75.0 80.0 85.0
Grind Size P80 (um)
Go
ld R
eco
very
(%
)
4.0
7.0
10.0
13.0
16.0
19.0
22.0
25.0
28.0
Go
ld G
rad
e (g
/t)
Au Recovery
Au Grade
Figure 9: Gold Rougher Grade-Recovery Curve Relative to Grind Size
60.0
65.0
70.0
75.0
80.0
85.0
90.0
95.0
100.0
50.0 55.0 60.0 65.0 70.0 75.0 80.0 85.0
Grind Size P80 (um)
Silv
er R
eco
very
(%
)
40.0
47.5
55.0
62.5
70.0
77.5
85.0
92.5
100.0
Silv
er G
rad
e (g
/t)
Ag Recovery
Ag Grade
Figure 10: Silver Rougher Grade-Recovery Curve Relative to Grind Size

Rambler Metals and Mining Canada Limited Project 6409-04 Final Report Phase IV Flotation Bench Scale Lock Cycle Test Program Page 29 of 78
Thibault & Associates Inc.
Applied Process Chemical Engineering
As can be seen from Figure 7, recovery of copper in the rougher concentrate generally increases with decreasing grind size, but reaches a plateau at a P80 of 73.0 micron indicating that this is the optimum grind size required to maximize copper recovery while minimizing capital and operating costs associated with primary grinding stages. Since copper is the primary metal of interest in the Rambler ore, the initial grind size for batch rougher flotation tests was selected as 73.0 micron. The grade-recovery curves for gold and silver, shown in Figures 9 and 10, look very similar to that of copper and also supports a primary grind specification of 80% passing 73.0 micron in the rougher stage. Zinc recovery, shown in Figure 8, does not plateau in the same manner as it did for copper and gold, and begins to decrease below a P80 of about 60 micron. This would seem to indicate that liberation of the zinc and, hence, more effective copper-zinc separation may be optimized at a finer grind size down to a P80 of 50 micron or less and supports the need for investigating use of a regrind on the cleaner feed. Subsequent batch rougher flotation tests were also carried out with a primary grind size of 80% passing 60.3 micron (120 minute batch grinding mill residence time) in an effort to improve on copper-zinc separation efficiency in the rougher circuit.
5.1.2 Rougher Flotation Reagent Scheme Selection
Sixteen additional rougher and three additional rougher-scavenger flotation tests were carried out using the feed grind specification defined above (90 minutes primary grinding to give P80 of 73.0 micron). Eight rougher flotation tests were subsequently performed using a feed grind specification of 80% passing 60.5 micron or 120 minutes residence time in the primary grinding mill. Since these tests were performed utilizing a wide variety of process conditions, each test result was plotted as a single point in Figures 11, 12 and 13 to facilitate side-by-side comparison of all of the results. A total of 22 different conditions are compared in the Figures. The most important test conditions are given in the legend and full details of rougher flotation test conditions are given in Table 6 and in the data tables of Appendix B. The results were evaluated based on the initial target performance criteria, listed in order of importance: greater than 94% recovery of copper greater than 70% rejection of mass (rejection of gangue materials and pyrite) to the rougher tails greater than 15% copper in feed to the cleaning stages minimize zinc grade in the feed to the cleaners (initial target set at <3.0% Zn in rougher concentrate) and
maximize copper-zinc separation efficiency maximize recovery of gold with copper concentrate

Rambler Metals and Mining Canada Limited Project 6409-04 Final Report Phase IV Flotation Bench Scale Lock Cycle Test Program Page 30 of 78
Thibault & Associates Inc.
Applied Process Chemical Engineering
0.0
10.0
20.0
30.0
40.0
50.0
60.0
70.0
80.0
90.0
100.0
30.0 40.0 50.0 60.0 70.0 80.0 90.0 100.0
Cu Recovery to Concentrate (%)
Mas
s R
ejec
tio
n t
o T
ails
(%
)KAX 30g/ t ; 3418A 100 g/ t ; pH=10.0; Rmbr90(2)
KEX 30g/ t ; 208 40g/ t ; ZnSO4 500 g/ t ; pH=10.0; Rmbr90(7)
KEX 60g/ t ; 208 40g/ t ; ZnSO4 500g/ t ; pH=10.0; Rmbr90(8)
KIBX 30g/ t ; 208 40g/ t ; ZnSO4 500g/ t ; pH=10.0; Rmbr90(9)
KIBX 60g/ t ; 208 40g/ t ; ZnSO4 500g/ t ; pH=10.0; Rmbr90(10)
KAX 30g/ t ; 208 40g/ t ; ZnSO4 500g/ t ; pH=10.0; Rmbr90(11)
KAX 60g/ t ; 208 40g/ t ; ZnSO4 500g/ t ; pH=10.0; Rmbr90(12)
5100 21g/ t ; ZnSO4 500g/ t ; pH=8.0; Rmbr90(13)
5100 14g/ t ; 208 40g/ t ; ZnSO4 500g/ t ; pH=8.0; Rmbr90(14)
5100 21g/ t ; 208 40g/ t ; ZnSO4 500g/ t ; pH=8.0; Rmbr90(15)
3418A 60g/ t ; 208 40g/ t ; ZnSO4 500g/ t ; pH=10.0; Rmbr90(16)
3418A 100g/ t ; 208 40g/ t ; ZnSO4 500g/ t ; pH=10.0; Rmbr90(17)
5688 60g/ t ; KIBX 30g/ t ; MBS 800 g/ t ; pH=9.0; Rmbr90(18)
208 40g/ t ; KIBX 40g/ t ; MBS 800g/ t ; Soda Ash; pH=10.0; Rmbr90(19)
5100 21g/ t ; 208 10g/ t ; MBS 800g/ t ; Soda Ash; pH=8.0; Rmbr90(20)
3418A 50g/ t ; KIBX 40g/ t ; MBS 800g/ t ; Soda Ash; pH=10.0;
Rmbr90(21)
KAX 30g/ t ; 3418A 100g/ t ; ZnSO4 500g/ t ; pH=10.0; Rmbr-1-Rghr
KAX 30g/ t ; 3418A 100g/ t ; ZnSO4 1000g/ t ; pH=10.0; Rmbr-11-Rghr
5100 50g/ t ; ZnSO4 500g/ t ; pH=8.0; Rmbr120(27)
5100 50g/ t ; ZnSO4 500g/ t ; pH=9.0; Rmbr120(28)
5100 75g/ t ; ZnSO4 500g/ t ; pH=9.0; Rmbr120(29)
KAX 30g/ t ; 3418A 100g/ t ; ZnSO4 500g/ t ; NaCN 150g/ t ; pH=9.0;
Rmbr120(30)
Performance Target
Figure 11: Copper Recovery and Mass Rejection Rates for Rougher Scoping Flotation Tests
0.0
5.0
10.0
15.0
20.0
25.0
30.0
35.0
0.0 2.0 4.0 6.0 8.0 10.0 12.0
Zn Grade in Concentrate (%)
Cu
Gra
de
in C
on
cen
trat
e (%
)
KAX 30g/ t ; 3418A 100 g/ t ; pH=10.0; Rmbr90(2)
KEX 30g/ t ; 208 40g/ t ; ZnSO4 500 g/ t ; pH=10.0; Rmbr90(7)
KEX 60g/ t ; 208 40g/ t ; ZnSO4 500g/ t ; pH=10.0; Rmbr90(8)
KIBX 30g/ t ; 208 40g/ t ; ZnSO4 500g/ t ; pH=10.0; Rmbr90(9)
KIBX 60g/ t ; 208 40g/ t ; ZnSO4 500g/ t ; pH=10.0; Rmbr90(10)
KAX 30g/ t ; 208 40g/ t ; ZnSO4 500g/ t ; pH=10.0; Rmbr90(11)
KAX 60g/ t ; 208 40g/ t ; ZnSO4 500g/ t ; pH=10.0; Rmbr90(12)
5100 21g/ t ; ZnSO4 500g/ t ; pH=8.0; Rmbr90(13)
5100 14g/ t ; 208 40g/ t ; ZnSO4 500g/ t ; pH=8.0; Rmbr90(14)
5100 21g/ t ; 208 40g/ t ; ZnSO4 500g/ t ; pH=8.0; Rmbr90(15)
3418A 60g/ t ; 208 40g/ t ; ZnSO4 500g/ t ; pH=10.0; Rmbr90(16)
3418A 100g/ t ; 208 40g/ t ; ZnSO4 500g/ t ; pH=10.0; Rmbr90(17)
5688 60g/ t ; KIBX 30g/ t ; MBS 800 g/ t ; pH=9.0; Rmbr90(18)
208 40g/ t ; KIBX 40g/ t ; MBS 800g/ t ; Soda Ash; pH=10.0; Rmbr90(19)
5100 21g/ t ; 208 10g/ t ; MBS 800g/ t ; Soda Ash; pH=8.0; Rmbr90(20)
3418A 50g/ t ; KIBX 40g/ t ; MBS 800g/ t ; Soda Ash; pH=10.0;
Rmbr90(21)
KAX 30g/ t ; 3418A 100g/ t ; ZnSO4 500g/ t ; pH=10.0; Rmbr-1-Rghr
KAX 30g/ t ; 3418A 100g/ t ; ZnSO4 1000g/ t ; pH=10.0; Rmbr-11-Rghr
5100 50g/ t ; ZnSO4 500g/ t ; pH=8.0; Rmbr120(27)
5100 50g/ t ; ZnSO4 500g/ t ; pH=9.0; Rmbr120(28)
5100 75g/ t ; ZnSO4 500g/ t ; pH=9.0; Rmbr120(29)
KAX 30g/ t ; 3418A 100g/ t ; ZnSO4 500g/ t ; NaCN 150g/ t ; pH=9.0;
Rmbr120(30)
Performance Target
Figure 12: Copper and Zinc Grades in Concentrate for Rougher Scoping Flotation Tests
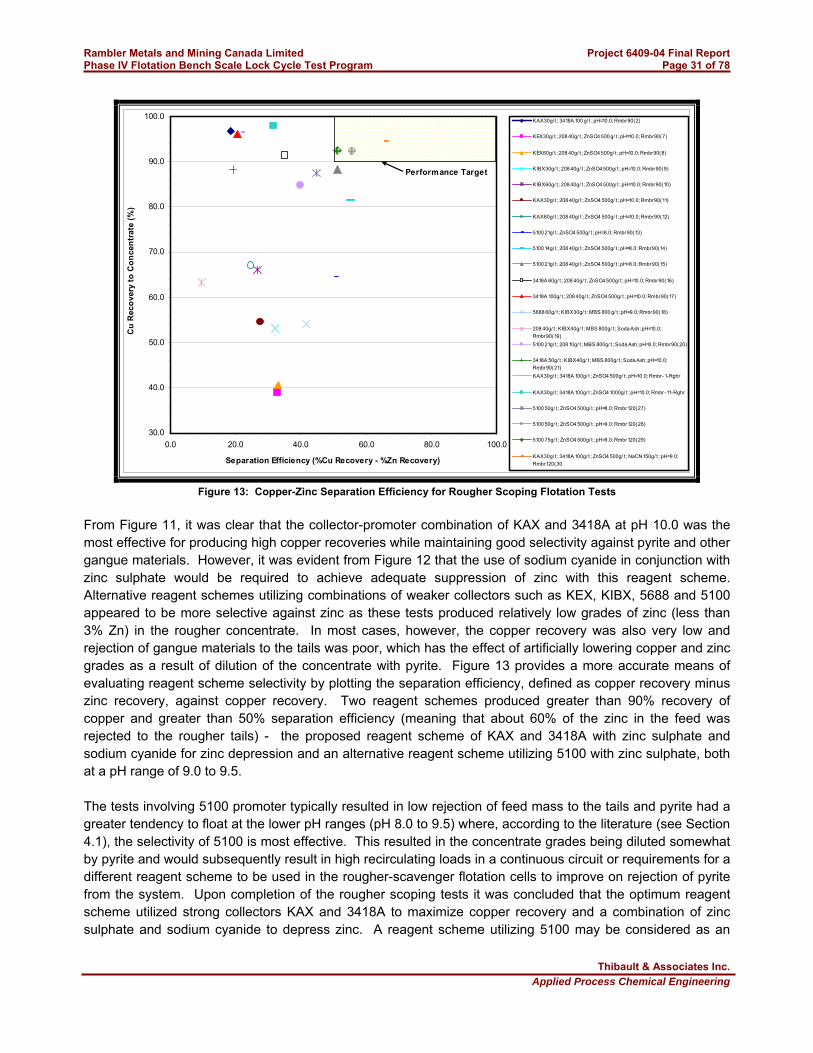
Rambler Metals and Mining Canada Limited Project 6409-04 Final Report Phase IV Flotation Bench Scale Lock Cycle Test Program Page 31 of 78
Thibault & Associates Inc.
Applied Process Chemical Engineering
30.0
40.0
50.0
60.0
70.0
80.0
90.0
100.0
0.0 20.0 40.0 60.0 80.0 100.0
Separation Efficiency (%Cu Recovery - %Zn Recovery)
Cu
Rec
ove
ry t
o C
on
cen
trat
e (%
)KAX 30g/ t ; 3418A 100 g/ t ; pH=10.0; Rmbr90(2)
KEX 30g/ t ; 208 40g/ t ; ZnSO4 500 g/ t ; pH=10.0; Rmbr90(7)
KEX 60g/ t ; 208 40g/ t ; ZnSO4 500g/ t ; pH=10.0; Rmbr90(8)
KIBX 30g/ t ; 208 40g/ t ; ZnSO4 500g/ t ; pH=10.0; Rmbr90(9)
KIBX 60g/ t ; 208 40g/ t ; ZnSO4 500g/ t ; pH=10.0; Rmbr90(10)
KAX 30g/ t ; 208 40g/ t ; ZnSO4 500g/ t ; pH=10.0; Rmbr90(11)
KAX 60g/ t ; 208 40g/ t ; ZnSO4 500g/ t ; pH=10.0; Rmbr90(12)
5100 21g/ t ; ZnSO4 500g/ t ; pH=8.0; Rmbr90(13)
5100 14g/ t ; 208 40g/ t ; ZnSO4 500g/ t ; pH=8.0; Rmbr90(14)
5100 21g/ t ; 208 40g/ t ; ZnSO4 500g/ t ; pH=8.0; Rmbr90(15)
3418A 60g/ t ; 208 40g/ t ; ZnSO4 500g/ t ; pH=10.0; Rmbr90(16)
3418A 100g/ t ; 208 40g/ t ; ZnSO4 500g/ t ; pH=10.0; Rmbr90(17)
5688 60g/ t ; KIBX 30g/ t ; MBS 800 g/ t ; pH=9.0; Rmbr90(18)
208 40g/ t ; KIBX 40g/ t ; MBS 800g/ t ; Soda Ash; pH=10.0;
Rmbr90(19)
5100 21g/ t ; 208 10g/ t ; MBS 800g/ t ; Soda Ash; pH=8.0; Rmbr90(20)
3418A 50g/ t ; KIBX 40g/ t ; MBS 800g/ t ; Soda Ash; pH=10.0;
Rmbr90(21)
KAX 30g/ t ; 3418A 100g/ t ; ZnSO4 500g/ t ; pH=10.0; Rmbr-1-Rghr
KAX 30g/ t ; 3418A 100g/ t ; ZnSO4 1000g/ t ; pH=10.0; Rmbr-11-Rghr
5100 50g/ t ; ZnSO4 500g/ t ; pH=8.0; Rmbr120(27)
5100 50g/ t ; ZnSO4 500g/ t ; pH=9.0; Rmbr120(28)
5100 75g/ t ; ZnSO4 500g/ t ; pH=9.0; Rmbr120(29)
KAX 30g/ t ; 3418A 100g/ t ; ZnSO4 500g/ t ; NaCN 150g/ t ; pH=9.0;
Rmbr120(30
Performance Target
Figure 13: Copper-Zinc Separation Efficiency for Rougher Scoping Flotation Tests
From Figure 11, it was clear that the collector-promoter combination of KAX and 3418A at pH 10.0 was the most effective for producing high copper recoveries while maintaining good selectivity against pyrite and other gangue materials. However, it was evident from Figure 12 that the use of sodium cyanide in conjunction with zinc sulphate would be required to achieve adequate suppression of zinc with this reagent scheme. Alternative reagent schemes utilizing combinations of weaker collectors such as KEX, KIBX, 5688 and 5100 appeared to be more selective against zinc as these tests produced relatively low grades of zinc (less than 3% Zn) in the rougher concentrate. In most cases, however, the copper recovery was also very low and rejection of gangue materials to the tails was poor, which has the effect of artificially lowering copper and zinc grades as a result of dilution of the concentrate with pyrite. Figure 13 provides a more accurate means of evaluating reagent scheme selectivity by plotting the separation efficiency, defined as copper recovery minus zinc recovery, against copper recovery. Two reagent schemes produced greater than 90% recovery of copper and greater than 50% separation efficiency (meaning that about 60% of the zinc in the feed was rejected to the rougher tails) - the proposed reagent scheme of KAX and 3418A with zinc sulphate and sodium cyanide for zinc depression and an alternative reagent scheme utilizing 5100 with zinc sulphate, both at a pH range of 9.0 to 9.5. The tests involving 5100 promoter typically resulted in low rejection of feed mass to the tails and pyrite had a greater tendency to float at the lower pH ranges (pH 8.0 to 9.5) where, according to the literature (see Section 4.1), the selectivity of 5100 is most effective. This resulted in the concentrate grades being diluted somewhat by pyrite and would subsequently result in high recirculating loads in a continuous circuit or requirements for a different reagent scheme to be used in the rougher-scavenger flotation cells to improve on rejection of pyrite from the system. Upon completion of the rougher scoping tests it was concluded that the optimum reagent scheme utilized strong collectors KAX and 3418A to maximize copper recovery and a combination of zinc sulphate and sodium cyanide to depress zinc. A reagent scheme utilizing 5100 may be considered as an
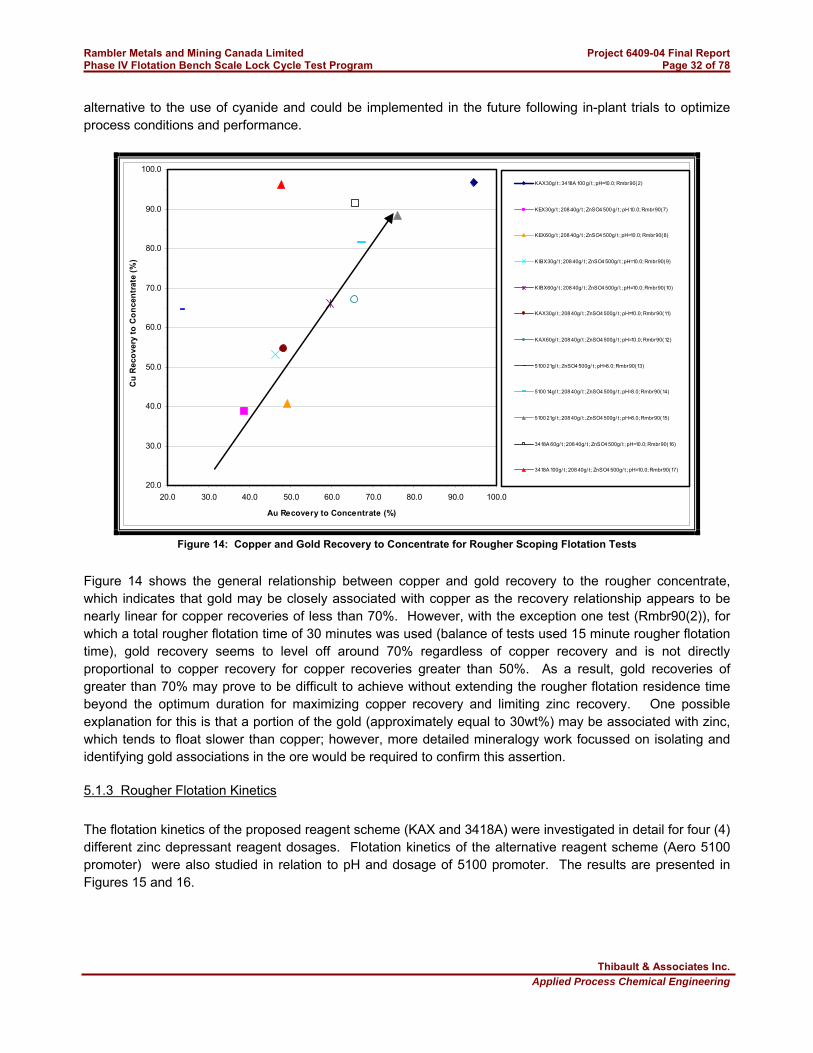
Rambler Metals and Mining Canada Limited Project 6409-04 Final Report Phase IV Flotation Bench Scale Lock Cycle Test Program Page 32 of 78
Thibault & Associates Inc.
Applied Process Chemical Engineering
alternative to the use of cyanide and could be implemented in the future following in-plant trials to optimize process conditions and performance.
20.0
30.0
40.0
50.0
60.0
70.0
80.0
90.0
100.0
20.0 30.0 40.0 50.0 60.0 70.0 80.0 90.0 100.0
Au Recovery to Concentrate (%)
Cu
Rec
ove
ry t
o C
on
cen
trat
e (%
)
KAX 30g/ t ; 3418A 100 g/ t ; pH=10.0; Rmbr90(2)
KEX 30g/ t ; 208 40g/ t ; ZnSO4 500 g/ t ; pH 10.0; Rmbr90(7)
KEX 60g/ t ; 208 40g/ t ; ZnSO4 500g/ t ; pH=10.0; Rmbr90(8)
KIBX 30g/ t ; 208 40g/ t ; ZnSO4 500g/ t ; pH=10.0; Rmbr90(9)
KIBX 60g/ t ; 208 40g/ t ; ZnSO4 500g/ t ; pH=10.0; Rmbr90(10)
KAX 30g/ t ; 208 40g/ t ; ZnSO4 500g/ t ; pH=10.0; Rmbr90(11)
KAX 60g/ t ; 208 40g/ t ; ZnSO4 500g/ t ; pH=10.0; Rmbr90(12)
5100 21g/ t ; ZnSO4 500g/ t ; pH=8.0; Rmbr90(13)
5100 14g/ t ; 208 40g/ t ; ZnSO4 500g/ t ; pH=8.0; Rmbr90(14)
5100 21g/ t ; 208 40g/ t ; ZnSO4 500g/ t ; pH=8.0; Rmbr90(15)
3418A 60g/ t ; 208 40g/ t ; ZnSO4 500g/ t ; pH=10.0; Rmbr90(16)
3418A 100g/ t ; 208 40g/ t ; ZnSO4 500g/ t ; pH=10.0; Rmbr90(17)
Figure 14: Copper and Gold Recovery to Concentrate for Rougher Scoping Flotation Tests
Figure 14 shows the general relationship between copper and gold recovery to the rougher concentrate, which indicates that gold may be closely associated with copper as the recovery relationship appears to be nearly linear for copper recoveries of less than 70%. However, with the exception one test (Rmbr90(2)), for which a total rougher flotation time of 30 minutes was used (balance of tests used 15 minute rougher flotation time), gold recovery seems to level off around 70% regardless of copper recovery and is not directly proportional to copper recovery for copper recoveries greater than 50%. As a result, gold recoveries of greater than 70% may prove to be difficult to achieve without extending the rougher flotation residence time beyond the optimum duration for maximizing copper recovery and limiting zinc recovery. One possible explanation for this is that a portion of the gold (approximately equal to 30wt%) may be associated with zinc, which tends to float slower than copper; however, more detailed mineralogy work focussed on isolating and identifying gold associations in the ore would be required to confirm this assertion.
5.1.3 Rougher Flotation Kinetics
The flotation kinetics of the proposed reagent scheme (KAX and 3418A) were investigated in detail for four (4) different zinc depressant reagent dosages. Flotation kinetics of the alternative reagent scheme (Aero 5100 promoter) were also studied in relation to pH and dosage of 5100 promoter. The results are presented in Figures 15 and 16.

Rambler Metals and Mining Canada Limited Project 6409-04 Final Report Phase IV Flotation Bench Scale Lock Cycle Test Program Page 33 of 78
Thibault & Associates Inc.
Applied Process Chemical Engineering
0.0
10.0
20.0
30.0
40.0
50.0
60.0
70.0
80.0
90.0
100.0
0 5 10 15 20 25 30 35 40
Cumulation Rougher Float Time (min)
Cu
mu
lati
ve C
op
per
Rec
ove
ry (
%)
0.0
10.0
20.0
30.0
40.0
50.0
60.0
70.0
80.0
90.0
100.0
Cu
mu
lati
ve Z
inc
Rec
ove
ry (
%)
Cu Recovery - 0 g/t ZnSO4
Cu Recovery - 500 g/t ZnSO4
Cu Recovery - 1000 g/t ZnSO4
Cu Recovery - 500 g/t ZnSO4 + 150 g/t NaCN
Zn Recovery - 0 g/t ZnSO4
Zn Recovery - 500 g/t ZnSO4
Zn Recovery - 1000 g/t ZnSO4
Zn Recovery - 500 g/t ZnSO4 + 150 g/t NaCN
Figure 15: Effect of Zinc Depressant Dosage on Flotation Kinetics for Proposed Reagent Scheme
0.0
10.0
20.0
30.0
40.0
50.0
60.0
70.0
80.0
90.0
100.0
0 2 4 6 8 10 12 14 16 18 20
Cumulation Rougher Float Time (min)
Cu
mu
lati
ve C
op
per
Rec
ove
ry (
%)
5100 50.1 g/t; ZnSO4 500 g/t; pH 8.0-8.5
5100 50.1 g/t; ZnSO4 500 g/t; pH 9.0-9.5
5100 75.0 g/t; ZnSO4 500 g/t; pH 9.0-9.5
3418A 100 g/t; KAX 30 g/t; ZnSO4 500 g/t; NaCN 150 g/t; pH 9.0-9.5
Figure 16: Effect of pH and Aero 5100 Promoter Dosage on Flotation Kinetics for Alternative Reagent Scheme

Rambler Metals and Mining Canada Limited Project 6409-04 Final Report Phase IV Flotation Bench Scale Lock Cycle Test Program Page 34 of 78
Thibault & Associates Inc.
Applied Process Chemical Engineering
Using the proposed reagent scheme, the flotation kinetics for copper improved with higher dosages of zinc sulphate alone and were slowed slightly by addition of sodium cyanide. From Figure 15, following a batch flotation time of 10 minutes, copper recovery increases from 71% with no zinc depressant added to over 92% with 1000 g/t of zinc sulphate addition. Using the same 10 minute batch flotation time as a benchmark, zinc recovery was suppressed to 18% when 500 g/t of zinc sulphate was combined with 150 g/t of sodium cyanide compared to recoveries of between 42% and 64% without cyanide. This may indicate that zinc sulphate alone does not act primary as a zinc depressant, but rather as an activator for copper. The kinetics for the preferred reagent scheme of KAX, 3418A, zinc sulphate and sodium cyanide are also plotted in Figure 16 along with the kinetics of the alternative reagent scheme using Aero 5100 promoter. The flotation kinetics with the use of 5100 are much slower at the lower pH range of 8.0 to 8.5 than at the higher pH range of 9.0 to 9.5 for the same promoter dosage and improve slightly with higher promoter dosage. Although the flotation kinetics with 5100 at pH 9.0 to 9.5 are slightly faster relative to use of sodium cyanide with the proposed scheme, copper recoveries level off at about 95% with the alternative reagent scheme and it is suspected that copper recovery in the rougher circuit may have to be compromised in order to gain selectivity without the use of sodium cyanide. Copper recoveries following a batch flotation time of 10 minutes, batch flotation times required to achieve minimum 90% recovery of copper and batch flotation times to achieve minimum 96% recovery are summarized for both reagent schemes in Table 9.
Table 9: Summary of Rougher Flotation Kinetics for Selected Reagent Schemes
ZINC DEPRESSANT DOSAGE
BATCH FLOTATION TIME (MIN) COLLECTER TYPE AND DOSAGE (g/t)
pH
ZnSO4 (g/t) NaCN (g/t)
COPPER RECOVERY AFTER
10 MINUTES (%) 90% Recovery 96% Recovery
KAX 30g/t; 3418A 100g/t 10.0-10.5 0 0 71 16.5 19.0
KAX 30g/t; 3418A 100g/t 10.0-10.5 500 150 85 11.0 17.5
KAX 30g/t; 3418A 100g/t 10.0-10.5 500 0 92 10.0 14.0
KAX 30g/t; 3418A 100g/t 9.0-9.5 1000 0 95 11.0 16.5
5100 50g/t 8.0-8.5 500 0 79 20.0 n/a
5100 50g/t 9.0-9.5 500 0 91 9.5 n/a
5100 75 g/t 9.0-9.5 500 0 91 8.5 n/a
5.1.4 Summary of Batch Rougher Flotation Test Results
From the matrix of rougher scoping tests performed, it was determined that a minimum primary grind specification of 80% passing 73.0 micron was required to optimize on copper recovery and that finer grinding to a P80 of 60 micron or less would increase zinc liberation and improve on copper-zinc separation efficiency. A proposed copper flotation reagent scheme employing the combination of a strong collector (KAX) and promoter selective against pyrite (3418A) resulted in very high copper recoveries of greater than 96% and use of alternative collectors and promoters such as KEX, KIBX, 5688 and 5100 typically resulted in low copper recoveries on the order of 40% to 90% and/or low copper grades in the concentrate as a direct result of insufficient mass rejection of gangue materials and specifically pyrite to the tails. The use of a cyanide-free reagent scheme for zinc depression was relatively unsuccessful and typically produced rougher concentrates containing greater than 5% Zn. Addition of 500 g/t of zinc sulphate plus 150

Rambler Metals and Mining Canada Limited Project 6409-04 Final Report Phase IV Flotation Bench Scale Lock Cycle Test Program Page 35 of 78
Thibault & Associates Inc.
Applied Process Chemical Engineering
g/t sodium cyanide to the proposed reagent scheme was required to minimize zinc grades in the batch rougher concentrate. In general, none of the reagent schemes tested were effective for depressing lead and lead concentrations in the rougher concentrates ranged from 0.5% to 1.0% over the range of rougher process conditions tested. Selectivity against lead was not initially identified as one of the project objectives and further batch flotation tests may be necessary to optimize on co-depression of lead and zinc in a selective copper flotation circuit if run-of mine lead head grades similar to those found in the mini-bulk sample from the 1600 level are expected for the 1807 zone ore. Using the proposed reagent scheme with both zinc sulphate and sodium cyanide for zinc depression, a minimum batch flotation time of 17.5 minutes is required in the rougher-scavenger circuit to achieve 96% recovery of copper. For the lock cycle tests, a batch flotation time in the rougher of 15 minutes was selected, with reagent addition divided into three stages. A batch flotation of 5 minutes (single stage reagent addition) was set for the rougher-scavenger. Since no batch rougher-scavenger flotation tests had been completed prior to the start of the lock cycle using the proposed reagent scheme with both zinc sulphate and sodium cyanide, the reagent dosages proposed for the lock cycle were defined as 20% of the rougher reagent dosage. Lime consumption from batch rougher flotation tests indicates that an average of 1.75kg per tonne of fresh ore feed is required to maintain the pulp pH at 10.0 to 10.5 and an average of 1.47 kg per tonne is required to maintain the pulp pH at 9.0 to 9.5 during the rougher flotation (based on 15 minute batch rougher float time). Reagent dosages selected for the lock cycle test are summarized in Figure 24.
5.2 Cleaning Batch Flotation Tests
5.2.1 Cleaner Flotation Optimum Regrind Determination
The first set of five (5) batch cleaner flotation tests were performed using the proposed reagent scheme (KAX plus 3418A collector / promoter combination, zinc sulphate for zinc depression, MIBC frother and lime as pH modifier to adjust pH within the range of 10.0 to 10.5) while adjusting the nominal regrind size (P80) of the cleaner feed by using different size ball mills and by changing the residence time for regrinding in the mill. The particle size distribution of the cleaner feed was determined using a Malvern particle size distribution (PSD) analyzer. In the first three tests (Rmbr-1-Clnr to Rmbr-3-Clnr), no additional collector / promoter reagents were added. In the fourth test, very little concentrate was collected and the test was stopped. For Rmbr-5-Clnr, additional collector and promoter (KAX and 3418A) were added to improve on recovery. Grade-recovery curves for copper and zinc relative to cleaner feed particle size are given by Figures 17 and 18.

Rambler Metals and Mining Canada Limited Project 6409-04 Final Report Phase IV Flotation Bench Scale Lock Cycle Test Program Page 36 of 78
Thibault & Associates Inc.
Applied Process Chemical Engineering
0.0
10.0
20.0
30.0
40.0
50.0
60.0
24.0 26.0 28.0 30.0 32.0 34.0 36.0 38.0 40.0 42.0
Regrind Size P80 (um)
Co
pp
er R
eco
very
(%
)
0.0
5.0
10.0
15.0
20.0
25.0
30.0
Co
pp
er G
rad
e (%
)
Cu Recovery Rmbr-1-Clnr to Rmbr-3-Clnr
Cu Recovery Rmbr-5-Clnr
Cu Grade Rmbr-1-Clnr to Rmbr-3-Clnr
Cu Grade Rmbr-5-Clnr
Figure 17: Copper Grade-Recovery Curves for Cleaner Regrind Batch Flotation Tests
From Figure 17, it can be seen that, through the first three cleaner regrind tests copper grade and recovery in the 2nd cleaner concentrate was relatively constant and copper recoveries were very low at less than 50%. High recirculating loads were being generated as a result of low concentrate collection rates in the first and second cleaning stages and non-selective flotation of copper (copper grades of 12% to 20% in first and second cleaner tails represented high losses. In an attempt to improve copper recovery in Rmbr-5-Clnr, 10 g/t of KAX collector and 33.3 g/t 3418A promoter were added to the first cleaner feed; however, copper recovery was only marginally improved to 51.5% and copper grade to 27%.

Rambler Metals and Mining Canada Limited Project 6409-04 Final Report Phase IV Flotation Bench Scale Lock Cycle Test Program Page 37 of 78
Thibault & Associates Inc.
Applied Process Chemical Engineering
0.0
10.0
20.0
30.0
40.0
50.0
60.0
24.0 26.0 28.0 30.0 32.0 34.0 36.0 38.0 40.0 42.0
Regrind Size P80 (um)
Zin
c R
eco
very
(%
)
0.0
5.0
10.0
15.0
20.0
25.0
30.0
Zin
c G
rad
e (%
)
Zn Recovery Rmbr-1-Clnr to Rmbr-3-Clnr
Zn Recovery Rmbr-5-Clnr
Zn Grade Rmbr-1-Clnr to Rmbr-3-Clnr
Zn Grade Rmbr-5-Clnr
Figure 18: Zinc Grade-Recovery Curves for Cleaner Regrind Batch Flotation Tests
The effect of regrind particle size is much more dramatic in the case of zinc, as shown in Figure 18, where zinc recovery dropped to about 11% at the finer cleaner feed particle size from 40% to 50% zinc recovery in tests having a coarser regrind size. Zinc grades in the second cleaner concentrate also dropped to 2.25% from 10% with the finer regrind size, which supports previous assertions that that the ore must be ground relatively fine in order to effectively liberate and separate zinc from the copper concentrate. As a result, a cleaner feed regrind specification of 80% passing 25.1 micron (30 minutes regrinding in medium ceramic ball mill) was defined for subsequent batch cleaning flotation tests.
5.2.2 Optimization of Cleaner Flotation Process Conditions
Six additional cleaner flotation tests (Rmbr-6-Clnr to Rmbr-11-Clnr) were carried out, each consisting of two cleaning stages and a cleaner-scavenger stage, using the regrind specification defined above (30 minutes regrinding in medium ceramic ball mill to give P80 of 25.1 micron). Each of the six tests utilized the same rougher concentrate as feed to the cleaners, the same collector / promoter reagent scheme and reagent dosages, with zinc depressant dosages being varied throughout and slightly lower pH being used in the last two tests. Two further cleaning tests were performed at a finer grind size of 80% passing 22.5 micron - one using the alternative reagent scheme (Rmbr-12-Clnr) and the other using the proposed reagent scheme plus sodium cyanide for zinc depression (Rmbr-13-Clnr). Since these tests were performed utilizing a variety of process conditions, each test result was plotted as a single point in Figures 19, 20 and 21 to facilitate side-by-side comparison of all of the results. The test conditions are summarized in the legend and complete details of cleaner flotation test conditions are given in Table 7 and in the data tables of Appendix B. The results were evaluated mainly on achieving target copper and zinc grades in the final concentrate, but were also assessed based on maintaining high copper recoveries and minimizing recirculating loads.

Rambler Metals and Mining Canada Limited Project 6409-04 Final Report Phase IV Flotation Bench Scale Lock Cycle Test Program Page 38 of 78
Thibault & Associates Inc.
Applied Process Chemical Engineering
30.0
40.0
50.0
60.0
70.0
80.0
90.0
100.0
20.00 22.00 24.00 26.00 28.00 30.00 32.00
Cu Grade in Concentrate (%)
Cu
Rec
ove
ry t
o C
on
cen
trat
e (%
)pH=10.5; P80=39.9; ZnSO4 500 g/t; Rmbr-1-Clnr
pH=10.5; P80=37.6; ZnSO4 500 g/t; Rmbr-2-Clnr
pH=10.5; P80=30.8; ZnSO4 500 g/t; Rmbr-3-Clnr
pH=10.5; P80=25.1; ZnSO4 500 g/t; 3418A 33.3 g/t;KAX 10 g/t; Rmbr-5-Clnr
pH=11.0; P80=25.1; ZnSO4 500 g/t; 3418A 95 g/t;KAX 15 g/t; Rmbr-6-Clnr
pH=11.0; P80=25.1; ZnSO4 1000 g/t; 3418A 95 g/t;KAX 15 g/t; Rmbr-7-Clnr
pH=11.0; P80=25.1; ZnSO4 500g/t; M BS 800g/t;3418A 95g/t; KAX 15g/t; Rmbr-8-Clnr
pH=10.5; P80=25.1; ZnSO4 1000g/t; 3418A 80g/t;KAX 15g/t; Rmbr-9-Clnr
pH=10.5; P80=25.1; ZnSO4 1000g/t; 3418A 80g/t;KAX 15g/t; Rmbr-10-Clnr
pH=9.5; P80=20.0; ZnSO4 500g/t; 5100 5g/t; 2086g/t; Rmbr-12-Clnr
pH=9.5; P80=20.0; ZnSO4 500g/t; NaCN 150g/t;3418A 45 g/t; KAX 8g/t; Rmbr-13-Clnr
Figure 19: Copper Grade-Recovery Results for Batch Cleaner Flotation Tests
30.0
40.0
50.0
60.0
70.0
80.0
90.0
100.0
0.00 2.00 4.00 6.00 8.00 10.00 12.00
Zn Grade in Concentrate (%)
Cu
Rec
ove
ry t
o C
on
cen
trat
e (%
)
pH=10.5; P80=39.9; ZnSO4 500 g/t; Rmbr-1-Clnr
pH=10.5; P80=37.6; ZnSO4 500 g/t; Rmbr-2-Clnr
pH=10.5; P80=30.8; ZnSO4 500 g/t; Rmbr-3-Clnr
pH=10.5; P80=25.1; ZnSO4 500 g/t; 3418A 33.3 g/t;KAX 10 g/t; Rmbr-5-Clnr
pH=11.0; P80=25.1; ZnSO4 500 g/t; 3418A 95 g/t;KAX 15 g/t; Rmbr-6-Clnr
pH=11.0; P80=25.1; ZnSO4 1000 g/t; 3418A 95 g/t;KAX 15 g/t; Rmbr-7-Clnr
pH=11.0; P80=25.1; ZnSO4 500g/t; M BS 800g/t;3418A 95g/t; KAX 15g/t; Rmbr-8-Clnr
pH=10.5; P80=25.1; ZnSO4 1000g/t; 3418A 80g/t;KAX 15g/t; Rmbr-9-Clnr
pH=10.5; P80=25.1; ZnSO4 1000g/t; 3418A 80g/t;KAX 15g/t; Rmbr-10-Clnr
pH=9.5; P80=20.0; ZnSO4 500g/t; 5100 5g/t; 2086g/t; Rmbr-12-Clnr
pH=9.5; P80=20.0; ZnSO4 500g/t; NaCN 150g/t;3418A 45 g/t; KAX 8g/t; Rmbr-13-Clnr
Figure 20: Zinc Grade and Copper Recovery for Batch Cleaner Flotation Tests

Rambler Metals and Mining Canada Limited Project 6409-04 Final Report Phase IV Flotation Bench Scale Lock Cycle Test Program Page 39 of 78
Thibault & Associates Inc.
Applied Process Chemical Engineering
30.0
40.0
50.0
60.0
70.0
80.0
90.0
100.0
40.0 50.0 60.0 70.0 80.0 90.0 100.0
Magnitude of Recirculating Loads (as % of Cleaner Feed Mass)
Cu
Rec
ove
ry t
o C
on
cen
trat
e (%
)
pH=10.5; P80=39.9; ZnSO4 500 g/t; Rmbr-1-Clnr
pH=10.5; P80=37.6; ZnSO4 500 g/t; Rmbr-2-Clnr
pH=10.5; P80=30.8; ZnSO4 500 g/t; Rmbr-3-Clnr
pH=10.5; P80=25.1; ZnSO4 500 g/t; 3418A 33.3 g/t;KAX 10 g/t; Rmbr-5-Clnr
pH=11.0; P80=25.1; ZnSO4 500 g/t; 3418A 95 g/t;KAX 15 g/t; Rmbr-6-Clnr
pH=11.0; P80=25.1; ZnSO4 1000 g/t; 3418A 95 g/t;KAX 15 g/t; Rmbr-7-Clnr
pH=11.0; P80=25.1; ZnSO4 500g/t; M BS 800g/t;3418A 95g/t; KAX 15g/t; Rmbr-8-Clnr
pH=10.5; P80=25.1; ZnSO4 1000g/t; 3418A 80g/t;KAX 15g/t; Rmbr-9-Clnr
pH=10.5; P80=25.1; ZnSO4 1000g/t; 3418A 80g/t;KAX 15g/t; Rmbr-10-Clnr
pH=9.5; P80=20.0; ZnSO4 500g/t; 5100 5g/t; 2086g/t; Rmbr-12-Clnr
pH=9.5; P80=20.0; ZnSO4 500g/t; NaCN 150g/t;3418A 45 g/t; KAX 8g/t; Rmbr-13-Clnr
Figure 21: Magnitude of Recirculating Loads and Copper Recovery for Batch Cleaner Flotation Tests
As depicted in Figure 19, there were four sets of cleaner tests that produced copper grades of greater than 24% in the final concentrate with copper recoveries of greater than 75%. From Figure 21 it is clear that the higher copper recoveries obtained in tests Rmbr-6-Clnr through Rmbr-8-Clnr, Rmbr-11-Clnr and Rmbr-13-Clnr were a direct result of increases in the mass of cleaner concentrate collected. Only one test, utilizing the proposed reagent scheme with both zinc sulphate and sodium cyanide for zinc depression, produced final concentrate zinc grades of less than 2.5% while maintaining copper recovery above 75%. 5.2.3 Cleaner Flotation Kinetics The flotation kinetics of the first cleaner stage were investigated in detail for the proposed reagent scheme with regrind to 80% passing 25.1 micron, pH adjusted 10.0 to 10.5 with lime, 10 g/t KAX, 50 g/t 3418A, 1000 g/t zinc sulphate and 800 g/t sodium metabisulphite added for zinc depression. The results are presented in Figures 22 and 23.
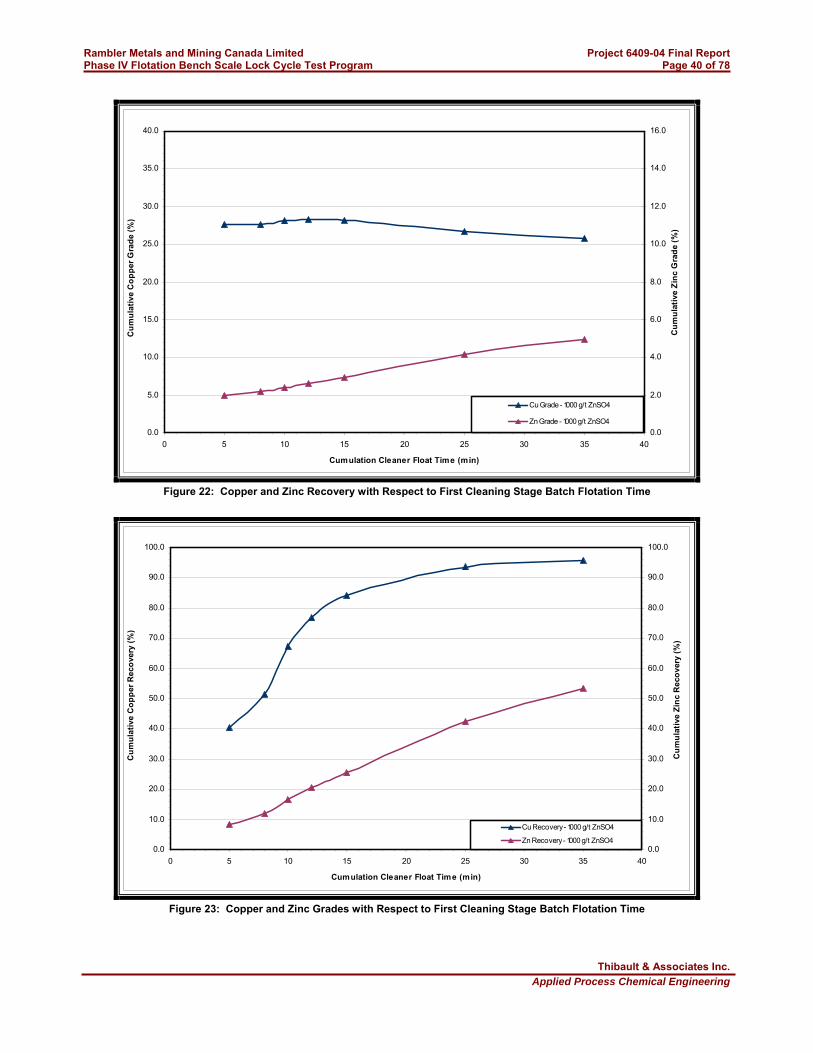
Rambler Metals and Mining Canada Limited Project 6409-04 Final Report Phase IV Flotation Bench Scale Lock Cycle Test Program Page 40 of 78
Thibault & Associates Inc.
Applied Process Chemical Engineering
0.0
5.0
10.0
15.0
20.0
25.0
30.0
35.0
40.0
0 5 10 15 20 25 30 35 40
Cumulation Cleaner Float Time (min)
Cu
mu
lati
ve C
op
per
Gra
de
(%)
0.0
2.0
4.0
6.0
8.0
10.0
12.0
14.0
16.0
Cu
mu
lati
ve Z
inc
Gra
de
(%)
Cu Grade - 1000 g/t ZnSO4
Zn Grade - 1000 g/t ZnSO4
Figure 22: Copper and Zinc Recovery with Respect to First Cleaning Stage Batch Flotation Time
0.0
10.0
20.0
30.0
40.0
50.0
60.0
70.0
80.0
90.0
100.0
0 5 10 15 20 25 30 35 40
Cumulation Cleaner Float Time (min)
Cu
mu
lati
ve C
op
per
Rec
ove
ry (
%)
0.0
10.0
20.0
30.0
40.0
50.0
60.0
70.0
80.0
90.0
100.0
Cu
mu
lati
ve Z
inc
Rec
ove
ry (
%)
Cu Recovery - 1000 g/t ZnSO4
Zn Recovery - 1000 g/t ZnSO4
Figure 23: Copper and Zinc Grades with Respect to First Cleaning Stage Batch Flotation Time

Rambler Metals and Mining Canada Limited Project 6409-04 Final Report Phase IV Flotation Bench Scale Lock Cycle Test Program Page 41 of 78
Thibault & Associates Inc.
Applied Process Chemical Engineering
From the graphs, it can be seen that flotation kinetics for both copper and zinc are relatively slow in the first cleaner stage and batch cleaner flotation times may need to be extended up to 20 minutes or more in order to optimize on copper recovery, as the recovery is still increasing steadily after 15 minutes. It was assumed that the flotation kinetics in the cleaner circuit would be similar with the use of the cyanide to aid in zinc depression.
5.2.4 Summary of Batch Cleaner Flotation Test Results
From the matrix of cleaner flotation tests performed, it was determined that a minimum regrind specification of 80% passing 25.1 micron was required to improve on liberation and separation of zinc in the cleaning stages. The proposed flotation reagent scheme selected for the rougher circuit also produced good results in the cleaner circuit and the reagent scheme should be kept consistent throughout all copper flotation stages to allow for recycling of process water from one stage to another and to avoid cross-contamination or unwanted interaction between reagents in various stages. The use of a cyanide-free reagent scheme for zinc depression was again relatively unsuccessful and typically produced cleaner concentrates containing greater than 3.0% Zn. Addition of 500 g/t of zinc sulphate plus 150 g/t sodium cyanide to the proposed reagent scheme was required to achieve zinc grades of less than 2.5% in the batch cleaner concentrate without generating large copper losses and high recirculating loads in the cleaner circuit. Using the proposed reagent scheme with both zinc sulphate and sodium cyanide for zinc depression, a batch flotation time of at least 15 minutes in the first cleaner stage (assumed to be the same for the second cleaner stage) is required to optimize copper recovery and minimize recirculating loads. For the lock cycle tests, an initial batch flotation time in both the first and second cleaner stages of 15 minutes was selected. A batch flotation time of 20 minutes was initially selected for the cleaner-scavenger. Lime consumption from batch cleaner flotation tests indicates that an average of 1.43 kg per tonne of cleaner feed or 0.43 kg per tonne of fresh ore feed is required to maintain the pulp pH at 10.0 to 10.5. Reagent dosages selected for the lock cycle test are summarized in Figure 24.
5.3 Lock Cycle Flotation Tests
A schematic representation of the lock cycle test process flow is given by Figure 24. All critical process conditions are summarized on the schematic. The results of the lock cycle test are primarily used to predict the process outcome at steady-state using a mass balance simulation.

Rambler Metals and Mining Canada Limited Project 6409-04 Final Report Phase IV Flotation Bench Scale Lock Cycle Test Program Page 42 of 78
Thibault & Associates Inc.
Applied Process Chemical Engineering
Figure 24: Schematic Representation of Lock Cycle Flowsheet

Rambler Metals and Mining Canada Limited Project 6409-04 Final Report Phase IV Flotation Bench Scale Lock Cycle Test Program Page 43 of 78
Thibault & Associates Inc.
Applied Process Chemical Engineering
5.3.1 Assessment of Lock Cycle Test Approach to Steady-State
In section 4.4, several different methods of evaluating whether or not a lock cycle test has reached steady-state were discussed. Figures 25, 26, 27, 28, 29 and 30 illustrate the practical application of these methods in assessing the approach to steady state over the eight lock cycle tests performed. NOTE: The following minor adjustments were made to the original process conditions in Figure 24 during the
course of the lock cycle test based on preliminary inter-cycle test results, including non-definitive XRF assay of final concentrate and tails and wet mass of recirculating streams, in order to assure that the project objectives were met in terms of achieving the required concentrate specifications for copper grade / recovery and maximum level of impurities as defined in section 2.2.
For lock cycle tests #3 and #4, the flotation times in the primary, secondary and cleaner-
scavenger stages were adjusted to 25, 20 and 20 minutes respectively in order to collect more final concentrate and improve the overall copper recovery.
In lock cycle test #5 the flotation times in the primary, secondary and cleaner-scavenger stages were reset back to the original condition of 15, 15 and 20 minutes respectively, to respond to rising zinc grades in the final concentrate. For lock cycle tests #6, #7 and #8, the flotation times were re-adjusted slightly 15, 20 and 20 minutes respectively in an effort to strike a balance between lowering the concentrate zinc grades and improving copper recovery.
In lock cycle tests #6, #7 and #8, conditioning of the recycle streams to the rougher flotation cells (i.e. rougher-scavenger concentrate and cleaner-scavenger tails) with 500 g/t of zinc sulphate and 150 g/t of sodium cyanide was also introduced to counteract rising zinc grades in the final concentrate. This process modification is shown in Figure 24.
In lock cycle test #7 and 8, the dosages of collectors 3418A and KAX were reduced to 75% of their original values in the rougher stage to stabilize the mass of rougher concentrate being collected, as it was believed that a build-up of collector reagents in the circuit may be responsible for increased recovery of gangue materials, including zinc, to the concentrate.

Rambler Metals and Mining Canada Limited Project 6409-04 Final Report Phase IV Flotation Bench Scale Lock Cycle Test Program Page 44 of 78
Thibault & Associates Inc.
Applied Process Chemical Engineering
1200.0
1350.0
1500.0
1650.0
1800.0
1950.0
0 1 2 3 4 5 6 7 8 9
Lock Cycle No.
Mas
s (g
)
M ass of Final Products from Each Cycle
M ass of Fresh Ore Feed to Each Cycle
Figure 25: Combined Weights of lock Cycle Products and Comparison to Weight of Fresh Ore Feed
0.0
100.0
200.0
300.0
400.0
500.0
600.0
0 1 2 3 4 5 6 7 8 9
Lock Cycle No.
Mas
s (g
)
Scavenger Concentrate (Wet M ass)
Second Cleaner Tails (Wet M ass)
Tertiary Cleaner Concentrate (Wet M ass)
Tertiary Cleaner Tails (Wet M ass)
Figure 26: Stabilization of Recycle Stream Weights as Lock Cycle Test Approaches Steady-State

Rambler Metals and Mining Canada Limited Project 6409-04 Final Report Phase IV Flotation Bench Scale Lock Cycle Test Program Page 45 of 78
Thibault & Associates Inc.
Applied Process Chemical Engineering
20.0
23.0
26.0
29.0
32.0
35.0
0 1 2 3 4 5 6 7 8 9
Lock Cycle No.
Co
pp
er G
rad
e in
Co
nce
ntr
ate
(wt%
)
0.00
0.15
0.30
0.45
0.60
0.75
Co
pp
er G
rad
e in
Tai
ling
s (w
t%)
Final Concentrate Cu Grade
Final Tailings Cu Grade
Figure 27: Trend of Copper Grades in Final Concentrate and Tailings as Lock Cycle Test Approaches Steady-State
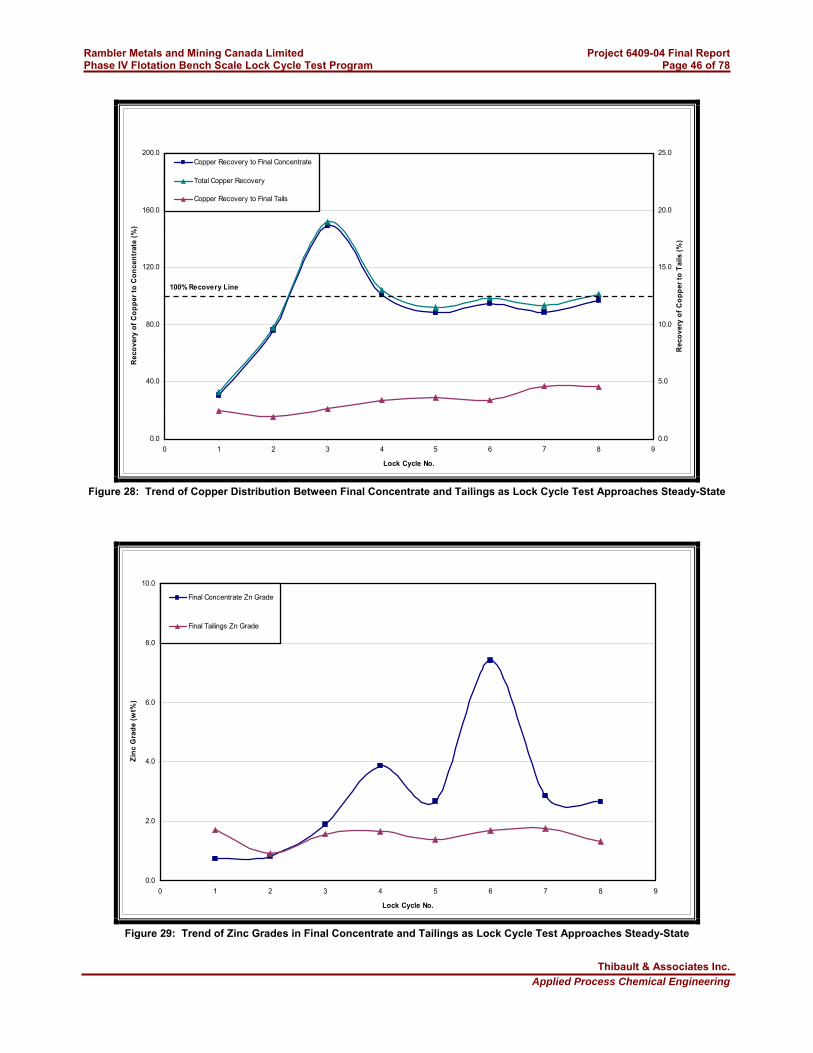
Rambler Metals and Mining Canada Limited Project 6409-04 Final Report Phase IV Flotation Bench Scale Lock Cycle Test Program Page 46 of 78
Thibault & Associates Inc.
Applied Process Chemical Engineering
0.0
40.0
80.0
120.0
160.0
200.0
0 1 2 3 4 5 6 7 8 9
Lock Cycle No.
Rec
ove
ry o
f C
op
per
to
Co
nce
ntr
ate
(%)
0.0
5.0
10.0
15.0
20.0
25.0
Rec
ove
ry o
f C
op
per
to
Tai
ls (
%)
Copper Recovery to Final Concentrate
Total Copper Recovery
Copper Recovery to Final Tails
100% Recovery Line
Figure 28: Trend of Copper Distribution Between Final Concentrate and Tailings as Lock Cycle Test Approaches Steady-State
0.0
2.0
4.0
6.0
8.0
10.0
0 1 2 3 4 5 6 7 8 9
Lock Cycle No.
Zin
c G
rad
e (w
t%)
Final Concentrate Zn Grade
Final Tailings Zn Grade
Figure 29: Trend of Zinc Grades in Final Concentrate and Tailings as Lock Cycle Test Approaches Steady-State

Rambler Metals and Mining Canada Limited Project 6409-04 Final Report Phase IV Flotation Bench Scale Lock Cycle Test Program Page 47 of 78
Thibault & Associates Inc.
Applied Process Chemical Engineering
0.0
40.0
80.0
120.0
160.0
200.0
0 1 2 3 4 5 6 7 8 9
Lock Cycle No.
Rec
ove
ry o
f Z
inc
to C
on
cen
trat
e (%
)
0.0
40.0
80.0
120.0
160.0
200.0
Rec
ove
ry o
f Z
inc
to T
ails
(%
)
Zinc Recovery to Final Concentrate
Total Zinc Recovery
Zinc Recovery to Final Tails
100% Recovery Line
Figure 30: Trend of Zinc Distribution Between Final Concentrate and Tailings as Lock Cycle Test Approaches Steady-State
In assessing whether or not a lock cycle test reaches steady state, the most important criteria to consider is conservation of mass, as reasonable metallurgical balances and metallurgical projections can be made for a test that is unstable, but which has mass conservation (reference Mineral Processing Plant Design, Practice and Control Conference Proceedings Volume I, "Bench and Pilot Plant Programs for Flotation Circuit Design" by S.R. Williams et. al., 2002). Theoretically, mass conservation is said to be achieved when the combined mass of the product streams equals the mass of fresh ore feed charged to each cycle. In practical terms, if the combined weights of the product stream is within +/-5.0% of the feed, then a reasonable degree of mass conservation has been reached and if the input and output stream masses agree within +/-2.0%, mass conservation is considered to be very good. As demonstrated in Figure 25, the balance of mass conservation is less than +/-5.0% for the last 5 cycles and less than +/-2.0% over the final two cycles (LC #7 and LC#8).
The degree of process stability over the final two cycles is assessed based on the magnitude of recirculating loads in Figure 26, copper grades and metallurgical distribution of copper in Figures 27 and 28, and on zinc grades and metallurgical distribution of zinc in Figures 29 and 30. For lock cycle tests #7 and #8, the masses of the cleaner-scavenger concentrate (Stream 12) and tailings (Stream 13) stabilized to within +/-5.0%; however, the rougher-scavenger concentrate (Stream 05) and secondary cleaner tails (Stream 11) are still fluctuating at +/- 7.2% and +/-9.2% respectively, indicating that the mass of these streams has not yet reached a steady-state. The copper grades of both the final concentrate and final tailings streams is stable within +/-5.0% and the distribution of copper between the final concentrate and final tails is stable within +/-2.0% for the final two cycles.
In contrast, the zinc grades and distribution of the final concentrate and tailings vary relatively widely throughout the test, mainly in response to the process modifications described previously. In lock cycles #3 and #4, batch flotation times throughout the cleaner circuit were increased to improve copper recovery;

Rambler Metals and Mining Canada Limited Project 6409-04 Final Report Phase IV Flotation Bench Scale Lock Cycle Test Program Page 48 of 78
Thibault & Associates Inc.
Applied Process Chemical Engineering
however, copper recovery to the concentrate actually fell through these two cycles and a dramatic increase in both recovery of zinc and zinc grade in the final was observed. In lock cycle test #5, the cleaner flotation times were re-adjusted, and the zinc grade and recovery to the concentrate fell back to about 3% and 18%, respectively. At this time, it was ascertained from preliminary XRF analysis that zinc rejection in the rougher-scavenger circuit was inadequate, resulting in high recirculating loads of zinc to the rougher in the rougher-scavenger concentrate. Two more changes were made (pre-conditioning of recycle streams with zinc depressant reagents upstream of the rougher in lock cycle tests #6, #7 and #8 and decreased collector dosages in the rougher for lock cycle tests #7 and #8) in an attempt to stabilize zinc grades below the specified maximum impurity level of 2.5% in the final concentrate. Zinc grades and recovery to the concentrate were found to be stable within +/-3.6% and +/-0.6%, respectively, over the final two cycles; however, the grade and recovery of zinc in the final tailings was not stable and were found to be decreasing over the last two cycles, which indicates that higher zinc grades in the final concentrate may be expected with extended cycles.
5.3.2 Summary of Lock Cycle Test Results
Table 10 summarizes the results of the lock cycle test, based on the outcome from lock cycle #8. Metallurgical recoveries and mass balance are based on calculated head grades over all eight cycles.
Table 10: Summary of Lock Cycle Test Results
FINAL CONCENTRATE FINAL TAILINGS CALC. HEAD GRADE Grade Recovery Grade Recovery
MASS BALANCE [3]
Iron 32.91 wt% Fe 30.40 wt% Fe 14.8% 33.32 wt% Fe 82.3% 97.1%
Copper 5.00 wt% Cu 30.30 wt% Cu 97.0% 0.28 wt% Cu 4.6% 101.6%
Zinc 2.46 wt% Zn 2.65 wt% Zn 17.3% 1.34 wt% Zn 44.3% 61.5%
Lead 0.27 wt% Pb 0.87 wt% Pb 51.1% 0.19 wt% Pb 56.7% 107.8%
Silver 24.9 ppm [1] 96 ppm Ag 61.7% 10 ppm 31.4% 93.1%
Gold 3.02 ppm [2] 11.8 ppm Au 62.6% 1.29 ppm Au 34.7% 97.3%
Antimony 171.9 ppm [2] 202 ppm Sb 18.8% 166 ppm Sb 78.5% 97.3%
Arsenic 1549 ppm [2] 145 ppm As 1.5% 1826 ppm As 95.8% 97.3%
Bismuth 23.3 ppm [2] 50 ppm Bi 34.4% 18 ppm Bi 62.9% 97.3%
Mercury 25.0 ppm [2] 53 ppm Hg 33.9% 19.5 ppm Hg 63.4% 97.3%
Table Notes: [1] Calculated head assay is based on data from lock cycle tests #6, #7 and #8 only. [2] Calculated head assay is based on data from lock cycle test #8 only. [3] Mass balance is calculated as combined mass of stream component (e.g. copper, lead, ect.) in final products divided by the
mass of that component in the feed based on calculated head grades.
The outcome of the lock cycle test is summarized as follows: Average recovery of copper to the concentrate over the last four lock cycle tests was 92.35%, with a
range of 88.4% obtained in lock cycle #5 to 97.0% obtained in lock cycle #8 (minimum copper recovery as defined in project objectives is 94%)
Average copper concentrate grade over the last four lock cycle tests was 29.1% Cu, with a range of 28.0% Cu obtained in lock cycle #6 to 30.3% Cu obtained in lock cycle 8 (minimum copper grade as defined in project objectives is 24.0%)
Average zinc impurity concentration in concentrate over the last two cycles was 2.75% Zn, with a range of 2.85% Zn in the concentrate from lock cycle #7 and 2.65% Zn in the concentrate from lock cycle #8 (maximum zinc impurity tolerance as defined in project objectives is 2.5%)
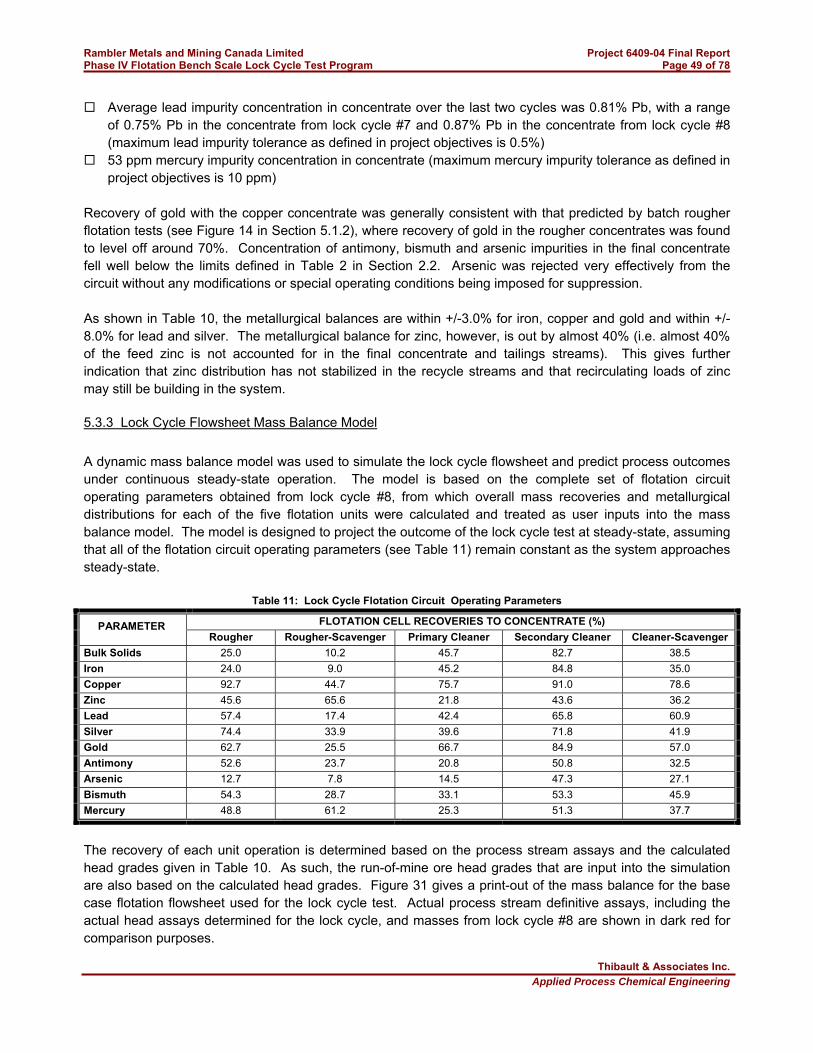
Rambler Metals and Mining Canada Limited Project 6409-04 Final Report Phase IV Flotation Bench Scale Lock Cycle Test Program Page 49 of 78
Thibault & Associates Inc.
Applied Process Chemical Engineering
Average lead impurity concentration in concentrate over the last two cycles was 0.81% Pb, with a range of 0.75% Pb in the concentrate from lock cycle #7 and 0.87% Pb in the concentrate from lock cycle #8 (maximum lead impurity tolerance as defined in project objectives is 0.5%)
53 ppm mercury impurity concentration in concentrate (maximum mercury impurity tolerance as defined in project objectives is 10 ppm)
Recovery of gold with the copper concentrate was generally consistent with that predicted by batch rougher flotation tests (see Figure 14 in Section 5.1.2), where recovery of gold in the rougher concentrates was found to level off around 70%. Concentration of antimony, bismuth and arsenic impurities in the final concentrate fell well below the limits defined in Table 2 in Section 2.2. Arsenic was rejected very effectively from the circuit without any modifications or special operating conditions being imposed for suppression. As shown in Table 10, the metallurgical balances are within +/-3.0% for iron, copper and gold and within +/-8.0% for lead and silver. The metallurgical balance for zinc, however, is out by almost 40% (i.e. almost 40% of the feed zinc is not accounted for in the final concentrate and tailings streams). This gives further indication that zinc distribution has not stabilized in the recycle streams and that recirculating loads of zinc may still be building in the system.
5.3.3 Lock Cycle Flowsheet Mass Balance Model
A dynamic mass balance model was used to simulate the lock cycle flowsheet and predict process outcomes under continuous steady-state operation. The model is based on the complete set of flotation circuit operating parameters obtained from lock cycle #8, from which overall mass recoveries and metallurgical distributions for each of the five flotation units were calculated and treated as user inputs into the mass balance model. The model is designed to project the outcome of the lock cycle test at steady-state, assuming that all of the flotation circuit operating parameters (see Table 11) remain constant as the system approaches steady-state.
Table 11: Lock Cycle Flotation Circuit Operating Parameters
FLOTATION CELL RECOVERIES TO CONCENTRATE (%) PARAMETER Rougher Rougher-Scavenger Primary Cleaner Secondary Cleaner Cleaner-Scavenger
Bulk Solids 25.0 10.2 45.7 82.7 38.5
Iron 24.0 9.0 45.2 84.8 35.0
Copper 92.7 44.7 75.7 91.0 78.6
Zinc 45.6 65.6 21.8 43.6 36.2
Lead 57.4 17.4 42.4 65.8 60.9
Silver 74.4 33.9 39.6 71.8 41.9
Gold 62.7 25.5 66.7 84.9 57.0
Antimony 52.6 23.7 20.8 50.8 32.5
Arsenic 12.7 7.8 14.5 47.3 27.1
Bismuth 54.3 28.7 33.1 53.3 45.9
Mercury 48.8 61.2 25.3 51.3 37.7
The recovery of each unit operation is determined based on the process stream assays and the calculated head grades given in Table 10. As such, the run-of-mine ore head grades that are input into the simulation are also based on the calculated head grades. Figure 31 gives a print-out of the mass balance for the base case flotation flowsheet used for the lock cycle test. Actual process stream definitive assays, including the actual head assays determined for the lock cycle, and masses from lock cycle #8 are shown in dark red for comparison purposes.

Rambler Metals and Mining Canada Limited Project 6409-04 Final Report Phase IV Flotation Bench Scale Lock Cycle Test Program Page 50 of 78
Thibault & Associates Inc.
Applied Process Chemical Engineering
Figure 31: Mass Balance Simulation Print-Out for Case A

Rambler Metals and Mining Canada Limited Project 6409-04 Final Report Phase IV Flotation Bench Scale Lock Cycle Test Program Page 51 of 78
Thibault & Associates Inc.
Applied Process Chemical Engineering
The main points that can be noted from reviewing the base case mass balance given in Figure 31 are: the process stream metal grades predicted by the model for copper, iron and lead also agree relatively
well with the definitive metal assays of those streams from lock cycle #8 and the calculated head grades agree relatively well with the actual head grades, which indicates that the metallurgical distribution of these components in the flotation circuit is stable;
the process stream zinc grades predicted by the model do not agree well with the definitive metal assays of those streams despite good agreement between the calculated and actual zinc head assays, which gives further indication that the metallurgical distribution of zinc in the flotation circuit had not stabilized at the end of lock cycle #8;
based on data from lock cycle #8 only, the calculated head grades of gold, mercury and antimony had only marginal agreement with the definitive head assays (+/-18.4% for gold, +/-23.3% for mercury and +/-30.7% for antimony) while arsenic head assays were found to agree very well (+/-1.6%) and head assays for bismuth displayed very poor agreement (+/-64.2%);
the overall recovery of copper predicted by the model at steady-state is 95.53%; however, this recovery is based on data from lock cycle test #8 only which had the highest copper recovery of all eight cycles and therefore may not provide the most representative basis for estimating steady-state copper recovery from the proposed flowsheet (i.e. actual steady state copper recovery for the proposed flowsheet may range between 88.4% to 97.0% as was observed in the final four lock cycle tests);
based on high copper grades and recoveries in the primary and secondary cleaner concentrates, there may be potential to reduce cleaner flotation residence times;
the steady-state concentration of zinc in the final concentrate predicted by the model is 4.19%, which exceeds the maximum impurity level specification defined by the project objectives;
the steady-state concentration of lead in the final concentrate predicted by the model is 0.78%, which exceeds the maximum impurity level specification defined by the project objectives, and;
the steady-state concentration of mercury in the final concentrate predicted by the model is 52.97 ppm, which exceeds the maximum impurity level specification defined by the project objectives.
Using the mass balance simulation, a sensitivity analysis was carried out to determine the effects of changing the rougher-scavenger operating parameters on the concentrate zinc grade. The results are plotted in Figure 32.

Rambler Metals and Mining Canada Limited Project 6409-04 Final Report Phase IV Flotation Bench Scale Lock Cycle Test Program Page 52 of 78
Thibault & Associates Inc.
Applied Process Chemical Engineering
1.0
2.0
3.0
4.0
5.0
20.0 30.0 40.0 50.0 60.0 70.0 80.0
Scavenger Zinc Recovery (%)
Fin
al C
once
ntr
ate
Zin
c G
rad
e (%
)
5% Mass Collection
10% Mass Collection
15% Mass Collection
20% Mass Collection
Figure 32: Sensitivity Analysis on Rougher-scavenger Flotation Cell Operating Parameters
If the run-of-mine zinc head grades remained constant at levels similar to those measured in the bulk ore sample used in the current study, the rougher-scavenger flotation circuit would have to be operated such that less than 42% (between 30% and 42% depending on mass recovery) of the zinc in the rougher-scavenger feed is recovered in the rougher-scavenger concentrate. Under the current operating conditions, the rougher-scavenger flotation recovers 65.6% of the zinc and only 44.7% of the copper in the rougher-scavenger feed. The separation efficiency of the rougher-scavenger flotation cells, defined in Section 5.1.2 as copper recovery minus zinc recovery, is actually negative and indicates that this unit is not operating to serve its intended purpose, which is to effectively reject zinc from the circuit and to recover the valuable metals (e.g. copper, silver and gold) from the rougher tails to reduce losses from the system. Based on the analysis presented above, the base case mass balance simulation (Case A - closed circuit flowsheet) was modified to simulate the operation of the circuit without the use of rougher-scavenger unit operation (i.e. rougher tailings become the final tailings from the system) and has been labelled as Case B (open circuit flowsheet). In the closed circuit lock cycle flowsheet configuration, there is only one final tailings stream where zinc and other impurities may be purged from the circuit; however, many commercial flotation circuits also purge impurities by releasing the cleaner-scavenger tails from the circuit rather than recycling this stream back to the rougher circuit. This flowsheet configuration was also simulated using the mass balance model and has been labelled as Case C. The mass balance simulation print-outs for Case B and Case C are given by Figures 33 and 34. Actual process performance and metallurgical predictions calculated by the mass balance model for Case B and Case C should be verified by performing at least one additional lock cycle test.
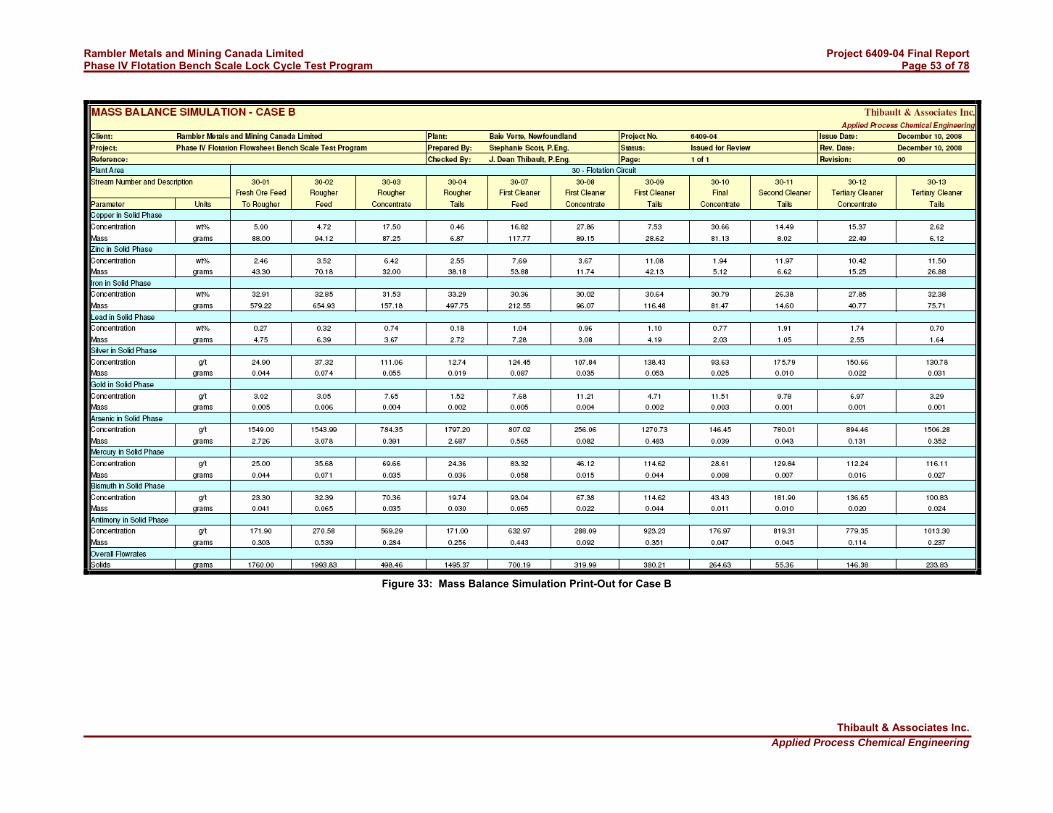
Rambler Metals and Mining Canada Limited Project 6409-04 Final Report Phase IV Flotation Bench Scale Lock Cycle Test Program Page 53 of 78
Thibault & Associates Inc.
Applied Process Chemical Engineering
Figure 33: Mass Balance Simulation Print-Out for Case B
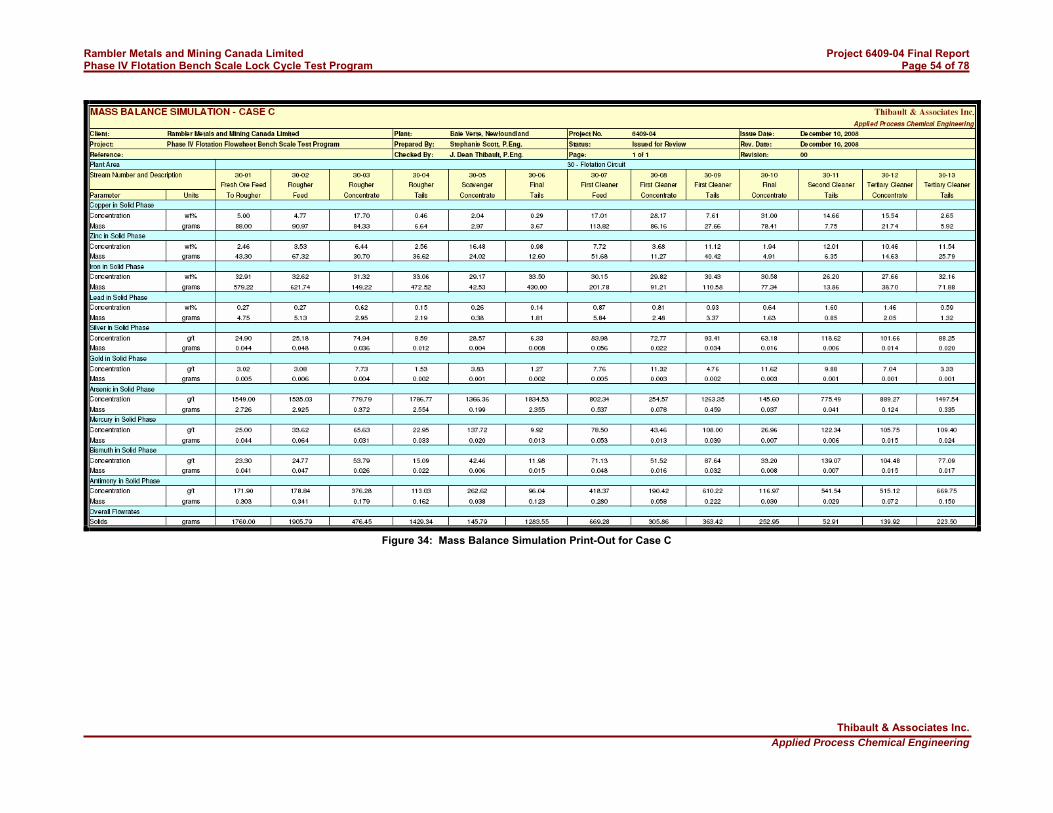
Rambler Metals and Mining Canada Limited Project 6409-04 Final Report Phase IV Flotation Bench Scale Lock Cycle Test Program Page 54 of 78
Thibault & Associates Inc.
Applied Process Chemical Engineering
Figure 34: Mass Balance Simulation Print-Out for Case C

Rambler Metals and Mining Canada Limited Project 6409-04 Final Report Phase IV Flotation Bench Scale Lock Cycle Test Program Page 55 of 78
Thibault & Associates Inc.
Applied Process Chemical Engineering
The simulation outcome presented in Figure 33 shows that, by not carrying out scavenging flotation on the rougher tails and eliminating that recirculating load, the steady-state final concentrate zinc grade predicted by the model is reduced from 4.19% to 1.94% Zn with a corresponding reduction in the overall system copper recovery from 95.53% to 92.19%. For Case C, the model predicts a similar reduction in the final concentrate zinc grade from 4.19% to 1.94% Zn accompanied by a slightly larger decrease in the overall copper recovery from 95.53% to 89.10% when the cleaner-scavenger tails are not recycled. Recoveries of silver and gold also decreased somewhat in both Case B and Case C relative to case A. To further address the issue of high zinc, lead and mercury concentrations in the concentrate, a sensitivity analysis was carried out on the base case lock cycle flowsheet and the two alternative flowsheet configurations to determine what the maximum tolerable head grades of zinc, lead and mercury would be in order to just meet the maximum specified impurity levels of 2.5% Zn, 0.5% Pb and 10 ppm Hg in the concentrate. Figures 35, 36 and 37 present the results of this analysis.
0.0
2.0
4.0
6.0
8.0
10.0
0.0 1.0 2.0 3.0 4.0 5.0 6.0
Zinc Head Grade (wt%)
Fin
al C
on
cen
trat
e Z
inc
Gra
de
(wt%
)
Case A
Case B
Case C
Figure 35: Sensitivity Analysis on Maximum Tolerable Zinc Head Grade

Rambler Metals and Mining Canada Limited Project 6409-04 Final Report Phase IV Flotation Bench Scale Lock Cycle Test Program Page 56 of 78
Thibault & Associates Inc.
Applied Process Chemical Engineering
0.0
0.3
0.5
0.8
1.0
1.3
0.0 0.1 0.2 0.3 0.4 0.5
Lead Head Grade (wt%)
Fin
al C
on
cen
trat
e L
ead
Gra
de
(wt%
)
Case A
Case B
Case C
Figure 36: Sensitivity Analysis on Maximum Tolerable Lead Head Grade
0.0
20.0
40.0
60.0
80.0
100.0
0.0 10.0 20.0 30.0 40.0 50.0
Mercury Head Grade (ppm)
Fin
al C
on
cen
trat
e M
ercu
ry C
on
ten
t (p
pm
)
Case A
Case B
Case C
Figure 37: Sensitivity Analysis on Maximum Tolerable Mercury Head Grade

Rambler Metals and Mining Canada Limited Project 6409-04 Final Report Phase IV Flotation Bench Scale Lock Cycle Test Program Page 57 of 78
Thibault & Associates Inc.
Applied Process Chemical Engineering
Figure 36 clearly shows that, for the closed circuit lock cycle flowsheet, the maximum tolerable zinc head grade that just meets the maximum specification for zinc impurity level in the final concentrate is 1.46% Zn. In order to have a reasonable "buffer zone" to avoid exceeding the maximum zinc impurity level during process upsets or even to allow slight variations in the flotation circuit operating conditions, the maximum tolerable zinc head grade is defined as 1.17% Zn, which produces a final concentrate zinc grade of 2.0% according to the mass balance model. As mentioned previously, Case B and C have similar outcomes with respect to final concentrate zinc concentrations as the magnitude of the recirculating load that is eliminated in either case is similar. For both cases, the maximum tolerable zinc head grade was determined to be 3.15% Zn in order to produce a concentrate containing less than 2.5% zinc and 2.54% Zn to produce a concentrate containing less than 2.0% zinc. A similar analysis of Figure 37 shows that, for Case A and B, the maximum tolerable lead head grade that just meets the maximum specification for lead impurity level in the final concentrate is 0.175% Pb. In order to have a reasonable "buffer zone" to avoid exceeding the maximum lead impurity level during process upsets or even to allow slight variations in the flotation circuit operating conditions, the maximum tolerable lead head grade for case A and B is defined as 0.14% Pb, which produces a final concentrate lead grade of 0.4% according to the mass balance model. In Case C, the maximum tolerable lead head grade is slightly higher, since lead is preferentially purged in the cleaner-scavenger tails and is defined as 0.21%. From Figure 37, it can be concluded that, in the base case, the concentration of mercury in the run-of-mine ore would have to be less than 4.72 ppm in order to meet the specified limit of 10 ppm Hg in the final concentrate. The maximum tolerable mercury concentration in the feed increases to 8.73 ppm for Case B and to 9.25 ppm for Case C. In reference to Table 11, the recoveries of zinc and mercury were observed to track one another, which may indicate that mercury is associated with the zinc in the ore body. In this case, run-of-mine grade control to limit zinc head grades in the feed to the flotation circuit would have an analogous effect on mercury. It also stands to reason that any process modifications that could made to increase zinc rejection would also improve on rejection of mercury with the tailings. Other than leaching of the concentrate, there is currently no commercially proven means of selectively depressing mercury in a flotation circuit. Also from Table 11, it was observed that individual flotation unit lead recoveries were significantly different from the corresponding zinc recoveries, which would indicate that lead not associated with zinc and that any process modifications made to improve on zinc rejection will not result in improved rejection of lead.
5.3.4 Lock Cycle Bulk Particle Size Distribution and Copper/Zinc Assays in Particle Size Fractions
During the final lock cycle test, samples of the primary grind mill product / fresh ore feed, the rougher concentrate (Stream 03), the final tailings (Stream 06), the regrind mill product (rougher concentrate after regrinding) and the final concentrate (Stream 10) were analyzed to determine the particle size distribution of the solids. The results are plotted in Figure 38 and summarized in Table 12.
Table 12: Summary of Particle Size Distribution Analysis for Selected Lock Cycle Process Streams
STREAM P20 (μm) P50 (μm) P80 (μm) P100 (μm)
Primary Grind Mill Product 15.5 micron 39.0 micron 69.3 micron 140 micron
Rougher Concentrate 8.2 micron 19.0 micron 37.2 micron 162 micron
Final Tailings 11.5 micron 30.0 micron 61.3 micron 121 micron
Regrind Mill Product 6.0 micron 13.0 micron 22.5 micron 57.7 micron

Rambler Metals and Mining Canada Limited Project 6409-04 Final Report Phase IV Flotation Bench Scale Lock Cycle Test Program Page 58 of 78
Thibault & Associates Inc.
Applied Process Chemical Engineering
STREAM P20 (μm) P50 (μm) P80 (μm) P100 (μm)
Final Concentrate 4.7 micron 8.7 micron 15.0 micron 42.9 micron
0.0
10.0
20.0
30.0
40.0
50.0
60.0
70.0
80.0
90.0
100.0
0.0 20.0 40.0 60.0 80.0 100.0 120.0 140.0
Size (µm)
%P
assi
ng
Primary Grind Mill Product
Rougher Concentrate - Stream 03
Final Tailings - Stream 06
Regrind Mill Product
Final Concentrate - Stream 12
Figure 38: Malvern Particle Size Distribution Data for Selected Process Streams from Lock Cycle Test #8
It was noted from Figure 38 that the product from the primary grind mill (a bench scale rod mill) had a relatively wide particle size distribution ranging from a P20 of 15.5 micron to a P80 of 69.3 micron, while the final concentrate contained a very narrow range of particle sizes with P20 equal to 4.7 micron and P80 of 15.0 micron. In order to quantitatively determine if copper and/or zinc are concentrated in a particular size fraction in the combined rougher feed (Stream 02), final concentrate (Stream 10) and final tailings (Stream 06), a sample of each of these streams from lock cycle test #8 was screened into discrete particle size fractions and each fraction was then analyzed separately to establish the copper and zinc grades and distributions within that particle size fraction. The metallurgical distributions are presented in Table 13.
Table 13: Distribution of Copper and Zinc Within Selected Process Stream Particle Size Fractions
ROUGHER FEED (STREAM 02)
FINAL CONCENTRATE (STREAM 10)
FINAL TAILINGS (STREAM 06) PARTICLE SIZE FRACTION
Cu (wt%) Zn (wt%) Cu (wt%) Zn (wt%) Cu (wt%) Zn (wt%)
+230 mesh (+63 micron) 5.43% 2.15% -- -- 5.57% 5.47%
-230 mesh/+325 mesh (-63/+44 micron) 16.97% 7.63% -- -- 9.70% 19.89%
-325 mesh/+400 mesh (-44/+37 micron) 9.26% 4.58% -- -- 3.07% 10.32%
-400 mesh/+635 mesh (-37/+20 micron) 22.15% 16.50% 13.74% 10.04% 5.57% 20.36%
-635 mesh (-20 micron) 46.19% 69.15% 86.26% 89.96% 76.09% 43.96%

Rambler Metals and Mining Canada Limited Project 6409-04 Final Report Phase IV Flotation Bench Scale Lock Cycle Test Program Page 59 of 78
Thibault & Associates Inc.
Applied Process Chemical Engineering
Since the concentrate from lock cycle #8 contained only 0.6% (0.6 grams) of solids larger than 37 micron, copper and zinc could not be assayed in the larger particle size fractions for this stream. From the data presented in Table 13 it was noted that slightly less than half of the copper and more than two thirds of the zinc in the fresh ore feed are contained in the -20 micron fraction, which supports the selection of a target regrind particle size specification of 80% passing 22.5 micron in order to improve on copper-zinc liberation and maximize zinc rejection in the cleaner circuit.
5.3.5 Lock Cycle Process Stream Physical Properties
During lock cycle test #8, samples of the combined feed to the rougher (Stream 02), the combined feed to the primary cleaner (Stream 07), the final tailings (Stream 06) and the final concentrate (Stream 10) were analyzed to quantitatively determine the percent solids, pulp density and solids specific gravity. The result are summarized in Table 14.
Table 14: Summary of Physical Properties for Selected Lock Cycle Process Streams
PARAMETER ROUGHER FEED
(STREAM 02) PRIMARY CLEANER FEED
(STREAM 07) FINAL TAILINGS
(STREAM 06) FINAL CONCENTRATE
(STREAM 10)
Percent Solids (wt%, dry) 38.4 35.3 29.6 40.0
Pulp Density (g/cm3) 1.42 1.38 1.29 1.44
Solids Specific Gravity 4.27 4.44 4.05 4.14
5.3.6 Lock Cycle Process Water Analysis
During the lock cycle test, process water was recycled as much as possible in order to simulate a typical full scale flotation process. Fresh water used at the beginning of the test and for make-up during the duration of the locked cycle was de-ionized tap water, containing little to no dissolved elements or suspended solids. After the final lock cycle test, process water filtered from the final tailings (Stream 06) and final concentrate (Stream 10) streams was analyzed for general inorganic chemistry and trace metals. The results are presented in Table 15.
Table 15: Lock Cycle Process Water Analysis
PARAMETER UNITS FINAL CONCENTRATE
PROCESS WATER FINAL TAILINGS
PROCESS WATER
Sodium mg/L 24.3 38.9
Potassium mg/L 3.02 9.14
Calcium mg/L 98.2 154
Magnesium mg/L 3.24 1.63
Iron mg/L 0.03 0.07
Manganese mg/L 0.020 0.032
Copper mg/L 0.006 0.003
Zinc mg/L 0.049 0.050
Ammonia (as N) mg/L 0.10 0.55
pH pH units 7.6 7.4
Alkalinity (as CaCO3) mg/L 22 19
Chloride mg/L 60 57
Sulfate mg/L 200 400
Nitrate + Nitrite (as N) mg/L 0.27 0.52

Rambler Metals and Mining Canada Limited Project 6409-04 Final Report Phase IV Flotation Bench Scale Lock Cycle Test Program Page 60 of 78
Thibault & Associates Inc.
Applied Process Chemical Engineering
PARAMETER UNITS FINAL CONCENTRATE
PROCESS WATER FINAL TAILINGS
PROCESS WATER
o-Phosphate (as P) mg/L < 0.01 0.03
r-Silica (as SiO2) mg/L 1.3 0.9
Total Organic Carbon mg/L 8.1 11.9
Turbidity NTU 0.4 0.8
Conductivity μS/cm 668 943
Hardness (as CaCO3) mg/L 258.5 391.3
Saturation pH (5oC) pH units 8.3 8.3
Langelier Index (5oC) pH units -0.75 -0.86
Aluminum μg/L 10 37
Antimony μg/L 4.7 5.0
Arsenic μg/L 60 44
Barium μg/L 26 10
Beryllium μg/L < 0.1 < 0.1
Bismuth μg/L < 1 < 1
Boron μg/L 15 17
Cadmium μg/L 1.85 0.07
Calcium μg/L 98200 154000
Chromium μg/L < 1 < 1
Cobalt μg/L 5.2 12.8
Copper μg/L 6 3
Iron μg/L 30 70
Lead μg/L 47.5 < 0.1
Lithium μg/L 2.1 2.8
Magnesium μg/L 3240 1630
Manganese μg/L 20 32
Mercury μg/L 1.11 < 0.025
Molybdenum μg/L 4.6 35.8
Nickel μg/L 22 212
Potassium μg/L 3020 9140
Rubidium μg/L 4.8 11.0
Selenium μg/L 801 760
Silver μg/L 3.7 < 0.1
Sodium μg/L 24300 38900
Strontium μg/L 215 218
Tellurium μg/L 0.1 < 0.1
Thallium μg/L 1.0 0.2
Tin μg/L < 0.1 < 0.1
Uranium μg/L 0.1 < 0.1
Vanadium μg/L < 1 < 1
Zinc μg/L 49 50
The moderately high levels of total organic carbon (TOC) may indicate a build-up of reagents in the process water as a result of recycling. As stated earlier in Section 5.3.1, dosages of collector reagents in the rougher circuit were reduced in lock cycles #7 and #8 for this reason; however, there may still have been excess reagent in the circuit. Levels of dissolved copper are near zero, which supports the assertion that copper exists solely as chalcopyrite and that secondary copper minerals, which are more soluble, are not present in the mini-bulk ore sample used for the current study. Furthermore, dissolved copper ions are know to activate zinc, making it float more readily in the copper circuit and severely hindering efforts towards zinc depression

Rambler Metals and Mining Canada Limited Project 6409-04 Final Report Phase IV Flotation Bench Scale Lock Cycle Test Program Page 61 of 78
Thibault & Associates Inc.
Applied Process Chemical Engineering
and selective flotation. The absence of soluble copper in the process water therefore eliminates one possible cause of inefficient copper-zinc separation in the bench scale test work. From a wastewater treatment perspective, the concentration of selenium is slightly elevated and was measured at 0.801 and 0.760 mg/L (801 and 760 μg/L) in the process water streams. The limit for selenium in effluent discharged to a body of water or public sewer according to Newfoundland and Labrador Regulation 65/03, Environmental Control Water and Sewage Regulations(2003) under the Water Resources Act is 0.01 mg/L or 10 μg/L. As a result, the process water may have to be treated to remove selenium prior to being discharged. Several technologically proven and commercially available processes are available for treating wastewaters contaminated with selenium, including co-precipitation with ferrous or ferric hydroxides or adsorption onto iron-based media.
5.4 Ore Variability Flotation Tests
Three alternative ore samples were selected by Rambler and subjected to ore variability testing utilizing identical process conditions for batch rougher flotation as those used in the lock cycle test and in batch rougher flotation tests Rmbr120(30) and Rmbr120(31). The two ore variability samples from the 1807 zone (samples A and B) contained very high copper head grades with ore sample A being relatively low in zinc compared to the mini-bulk sample from the 1600 level (i.e. the zinc content of ore variability sample A was found to be more representative of the SRK mineral resource estimates published for the 1807 zone - see Section 2.1) and ore sample B being relatively high in zinc. Ore variability sample A actually contained a lower gold head grade (determined by gold fire assay than the mini-bulk sample on which the majority of the bench scale flotation testing was performed. The third ore variability sample (ore sample C) was from the lower footwall zone, which is high in silicates and relatively low in sulphides / pyrite. Ore sample C contained very little zinc, lead or gold. The results from the batch rougher flotation ore variability tests are summarized in Table 16.
Table 16: Summary of Ore Variability Batch Rougher Flotation Tests
SAMPLE ID PARAMETER Bulk 1600 Level 1807 High Au - Low Zn (A) 1807 High Zn (B) Lower FWZ (C)
Copper Head Grade 5.21% Cu 7.87% Cu 10.16% Cu 2.42% Cu
Zinc Head Grade 2.60% Zn 0.66% Zn 4.69% Zn 0.05% Zn
Lead Head Grade 0.34% Pb 0.11% Pb 0.17% Pb 0.006% Pb
Gold Head Grade 3.66 g/t Au 2.38 g/t Au 1.92 g/t Au 0.086 g/t Au
Copper Recovery in Rougher 94.8% [1] 96.5% 95.3% 99.2%
Zinc Recovery in Rougher 29.7% [1] 25.3% 11.3% 55.1%
Lead Recovery in Rougher 71.9% [1] 71.9% 70.7% 53.5%
Gold Recovery in Rougher 75.5% [1] No data [2] 75.6% 86.4%
Copper Grade (Rghr. Conc.) 19.83% Cu [1] 26.03% Cu 20.01% Cu 22.92% Cu
Zinc Grade (Rghr. Conc.) 2.87% Zn [1] 0.49% Zn 0.97% Zn 0.30% Zn
Lead Grade (Rghr. Conc.) 0.96% Pb [1] 0.25% Pb 0.26% Pb 0.029% Pb
Gold Grade (Rghr. Conc.) 8.37 g/t Au No data [2] 3.13 g/t Au 1.11 g/t Au
Antimony Grade (Rghr. Conc.) 650.8 g/t Sb [3] 48 g/t Sb [3] 32 g/t Sb 31 g/t Sb
Arsenic Grade (Rghr. Conc.) 775.3 g/t As [3] 320 g/t As [3] 422 g/t As 88 g/t As
Bismuth Grade (Rghr. Conc.) 81.0 g/t Bi [3] 331 g/t Bi [3] 302 g/t Bi 181 g/t Bi
Mercury Grade (Rghr. Conc.) 129.0 g/t Hg [3] No data [2] 5.1 g/t Hg 2.1 g/t Hg
Selenium Grade (Rghr. Conc.) 342.7 g/t Se [3] 430 g/t Se 332 g/t Se 319 g/t Se
Table Notes: [1] Data taken from batch rougher flotation test Rmbr120(31).

Rambler Metals and Mining Canada Limited Project 6409-04 Final Report Phase IV Flotation Bench Scale Lock Cycle Test Program Page 62 of 78
Thibault & Associates Inc.
Applied Process Chemical Engineering
[2] Gold and mercury assays for rougher concentrate from ore variability test A could not be determined due to analytical method limitations.
[3] Rougher concentrate trace element grades are calculated based on definitive assays of the rougher-scavenger concentrate and tails, cleaner-scavenger concentrate and tails and secondary cleaner concentrate and tails.
The reagent scheme, process conditions and flowsheet configuration proposed for benefication of the 1807 zone ore, which was applied in the lock cycle test performed using the original mini-bulk sample from the 1600 level, was found to produce similar results for the three variable ore zone samples. Copper recoveries through the rougher circuit of greater than 95% were achieved in addition to relatively high copper grades (greater than 20.0 wt% Cu) in the rougher concentrates for all three samples. Concentrations of impurities in the rougher concentrates; including zinc, lead, arsenic, antimony, bismuth and mercury; were found to be below the defined maximum limits for final concentrate. It was also noted that recovery of zinc to the rougher concentrate for ore sample A was similar to that of the bulk 1600 level ore sample (copper-zinc separation efficiency of 65% to 70%), while ore sample B demonstrated much lower zinc recovery (separation efficiency of 84%) and zinc recovery for ore sample C was much higher (separation efficiency of 44%). This preliminary data may suggest that zinc is more readily liberated (i.e. may have a coarser liberation particle size) in the ore zones containing higher zinc head grades; however; further mineralogy, copper-zinc particle size distribution analysis and/or further bench scale flotation tests would be required on several different 1807 zone ore samples containing high zinc (greater than 4.0% Zn head grade) to confirm this theory. Another possible explanation for obtaining lower zinc recovery in ore variability test B may be related to the dosage of collector reagent(s) relative to the copper and zinc head grades. In ore sample B, both the copper and zinc head grades are almost twice that of the 1600 level mini-bulk sample and more of the collector reagent would be consumed / utilized for flotation of copper, leaving excess collector to attach to and subsequently float the impurity metals such as zinc and iron. Based on these finding, further batch rougher flotation tests are recommended to optimize on collector dosage relative to copper and zinc head grades. A matrix of 20 to 30 batch rougher flotation tests is recommended, whereby five samples of 1807 zone ore having variable copper and zinc head grades would be subjected to a range of collector dosages and the resulting copper and zinc recoveries determined.
5.5 Concentrate Dewatering Tests
A blended sample of the final concentrates from all eight lock cycles was used to determine the dewatering requirements and to quantify design parameters for sedimentation (thickening) and filtration / drying of the concentrate. Thickening and/or dewatering of the tailings is not required as the final tailings from the flotation circuit will be pumped to the tailings pond as a slurry.
5.5.1 Sedimentation Tests
A sedimentation test was carried out to determine the settling characteristics of the final concentrate from the lock cycle tests at 40% solids without the addition of a flocculant to enhance the sedimentation rate. The settling curve is given by Figure 39.

Rambler Metals and Mining Canada Limited Project 6409-04 Final Report Phase IV Flotation Bench Scale Lock Cycle Test Program Page 63 of 78
Thibault & Associates Inc.
Applied Process Chemical Engineering
100.0
200.0
300.0
400.0
500.0
0.0 25.0 50.0 75.0 100.0 125.0 150.0
Cumulative Settling Time (min)
Inte
rfac
e L
evel
(m
m)
Hindered Settling Zone
Transitional Settling Zone
Compression Settling Zone
Figure 39: Settling Curve for Copper Concentrate Without Flocculant
The settling velocity of the copper concentrate solids without flocculant in the hindered settling zone is 0.0063 m/min, which is equivalent to a rise rate of 0.155 USGPM/ft2 and indicates that flocculant will be required to improve on sedimentation rates.
5.5.2 Pressure Filtration Tests
A lab scale bench pressure filter was used to define filtration rates and final moisture content of the concentrate recovered from the lock cycle test. The cake thickness is largely determined by the amount of sample available to be filtered. The first filtration run was performed at a typical feed pressure of 30 psig and produced a 12 mm (½") thick filter cake containing 18.13% residual moisture. The second test was carried out at a lower feed pressure of 10 psig and produced a 25 mm (1") thick filter cake containing 22.18% residual moisture. In both cases, the filter cake cracked towards the end of the filtration cycle, which causes short-circuiting and prevents any further moisture reduction by application of pressure or by blowing air through the cake. The test conditions and results for the two filtration tests are presented in Table 17.
Table 17: Summary of Pressure Filtration Test Data
TEST PARAMETER FILTRATION TEST A FILTRATION TEST B
Mass of Dry Concentrate Solids 1.34 kg 1.76 kg
Mass of Water Added 2.43 kg 3.05 kg
Slurry Percent Solids 35.5 wt% dry solids 36.6 wt% dry solids
Filtration Pressure 30 psig 10 psig
Filtrate Volume Collected 2.13 L 2.64 L
Filter Cake Thickness 12 mm 25 mm
Residual Moisture Content 18.13 wt% 22.18 wt%
Average Filtration Rate 42.44 L/hr 17.22 L/hr

Rambler Metals and Mining Canada Limited Project 6409-04 Final Report Phase IV Flotation Bench Scale Lock Cycle Test Program Page 64 of 78
Thibault & Associates Inc.
Applied Process Chemical Engineering
The filter throughput curves are given in Figures 40 and 41.
Concentrate Pressure Filtration Throughput Curve at 30 psig
0.0
500.0
1000.0
1500.0
2000.0
2500.0
3000.0
0.0 0.5 1.0 1.5 2.0 2.5 3.0 3.5
Cumulative Filtration Time
Cu
mu
lati
ve V
olu
me
Filt
ered
(m
L)
Figure 40: Concentrate Filtration Curve for Test A
Concentrate Pressure Filtration Throughput Curve at 10 psig
0.0
500.0
1000.0
1500.0
2000.0
2500.0
3000.0
0.0 2.0 4.0 6.0 8.0 10.0
Cumulative Filtration Time
Cu
mu
lati
ve V
olu
me
Filt
ered
(m
L)
Figure 41: Concentrate Filtration Curve for Test B

Rambler Metals and Mining Canada Limited Project 6409-04 Final Report Phase IV Flotation Bench Scale Lock Cycle Test Program Page 65 of 78
Thibault & Associates Inc.
Applied Process Chemical Engineering
As expected, decreasing the filtration pressure from 30 psig to 10 psig slowed the filtration rate by approximately three times. Despite the relatively low filtration rate and thicker cake formed, the filter cake in Test B also cracked before the end of the batch filtration time and residual moisture content remained significantly higher than the maximum acceptable concentrate moisture content specified in the project objectives of 8.0 wt%. For difficult dewatering applications where cake cracking is a problem and relatively low residual filter cake moisture contents are desired, a membrane (diaphragm) or "variable volume" filter press is often used. These filter presses are identical to a normal plate and frame filter press except that each plate incorporates an inflatable membrane into the drainage surface which is inflated at the end of the filtration cycle using a pressurized fluid to physically squeeze additional liquid from the cake. Unlike an air blow cycle on a filter press, the additional cake dryness that can be achieved using the membrane squeeze is insensitive to cake cracking. An added benefit is reduced filtration cycle times compared to standard plate and frame presses.
5.6 Tailings Leachability and Treatability Tests
A blended sample of final tailings from the lock cycle test was divided and sent for modified acid-base accounting (ABA as determined by the Sobek method), standard Toxicity Characteristic Leaching Procedure (TCLP) test (reference US EPA TCLP Test Method 1311) performed at pH 5.5 and custom TCLP test at pH 8.5. The results are presented in Tables 18 and 19.
Table 18: Results of Modified Acid-Base Accounting by Sobek Method
PARAMETER VALUE
Paste pH 6.0
Total Sulphur 39.7 wt%
Sulphate 0.060 wt%
Sulphide 39.6 wt%
Acid Production Potential 1239 kg CaCO3/tonne
Neutralization Potential (pH 8.3) 36.2 kg CaCO3/tonne
Net Neutralizing Potential (pH 8.3) - 1203 kg CaCO3/tonne
Table 19: TCLP Leachate Test Results and Relative CEPA Limits
CEPA SCHEDULE II LEACHATE TEST LIMITS
NLR 65/03 EFFLUENT LIMITS
LEACHATE PRODUCED BY STANDARD TCLP AT 5.5
LEACHATE PRODUCED BY CUSTOM TCLP AT PH 8.5 PARAMETER
Concentration in μg/L
Aluminum Limit not defined by CEPA 500 < 20 < 20
Antimony 600 Not defined 5 4
Arsenic 2,500 Not defined < 20 < 20
Barium 100,000 5,000 50 < 20
Beryllium Limit not defined by CEPA Not defined < 2 < 2
Bismuth Limit not defined by CEPA Not defined < 20 < 20
Boron 500,000 5,000 < 20 < 20
Cadmium 500 50 95.2 0.4
Calcium Limit not defined by CEPA Not defined 619000 52500
Chromium 5,000 1,000 < 20 < 20
Cobalt Not defined 94 < 2
Copper 100,000 300 600 < 20

Rambler Metals and Mining Canada Limited Project 6409-04 Final Report Phase IV Flotation Bench Scale Lock Cycle Test Program Page 66 of 78
Thibault & Associates Inc.
Applied Process Chemical Engineering
Iron 30,000 10,000 500 600
Lead 5,000 200 7340 3
Lithium Limit not defined by CEPA Not defined < 2 < 2
Magnesium Limit not defined by CEPA Not defined 3600 900
Manganese Limit not defined by CEPA Not defined 7740 30
Mercury 100 5 < 0.025 3
Molybdenum Limit not defined by CEPA Not defined < 2 < 20
Nickel Limit not defined by CEPA 500 60 2400
Potassium Limit not defined by CEPA Not defined 6300 5
Rubidium Limit not defined by CEPA Not defined 19 50
Selenium 1,000 10 40 < 2
Silver 5,000 50 < 2 40
Strontium Limit not defined by CEPA Not defined 260 < 2
Tellurium Limit not defined by CEPA Not defined < 2 4
Thallium Limit not defined by CEPA Not defined 21 < 2
Tin Limit not defined by CEPA Not defined < 2 < 2
Uranium 10,000 Not defined < 2 < 20
Vanadium Limit not defined by CEPA Not defined < 20 30
Zinc 500,000 500 17000 < 20
As is normally the case with sulphide ores, the tailings are acid producing and neutralization of the tailings with lime may be required prior to and/or following disposal of the tailings in a tailings pond. Furthermore, on-going treatment (pH adjustment) of the tailings pond water may be required to maintain the effluent pH within the acceptable pH limits of 5.5 to 9.0 (reference NLR 65/03 regulations). It should be noted; however, that the acid generating potential of the tailings as determined using the Sobek method represents a worst-case scenario based on 100% conversion of the sulphide content of the tailings to sulphuric acid and the actual neutralizing requirement would be significantly less than the reported value of 1203 kg CaCO3/tonne tailings. The results of the TCLP leachate test are used as a reference point for assessing what metals, if any, may leach from the tailings following sub-aqueous disposal in a tailings pond. The criteria limits defined in Schedule II: Leachate Test Canadian Environmental Protection Act (CEPA) Proposed Regulations are generally defined as 100 times the Canadian Drinking Water Guidelines CEPA and this standard is typically applied to the land disposal of solids wastes. As such the CEPA limits are not directly applicable to mining operations where tailings are disposed of in a tailings pond, but they do provide a means of determining the relative leachability of a solid waste, including tailings. In reference to the CEPA guidelines, which are relevant only for the standard TCLP test performed at a controlled pH of 5.5; lead concentrations in the leachate exceed the maximum limits and the solids would not be deemed suitable for land disposal (e.g. in a municipal or public landfill). More relevant to the case at hand are the NLR 65/03 effluent limits and the MMER effluent limits, which would apply to the effluent discharge from the tailings pond. MMER defines limits for arsenic, copper, lead, nickel and zinc and these limits are identical to those listed for the NLR 65/03 regulation in Table 19. The custom leach procedure was performed to simulate the leachability of metals from the tailings in a tailings pond where the pH is being maintained at 8.5. In this scenario all of the trace elements in the leachate meet the applicable limits for effluent discharge to the environment and no additional treatment of the tailings pond effluent is required prior to discharge as long as the tailings pond water is maintained at pH 8.5. Given the acid generating nature of the tailings, if no lime is added to the tailings pond to control the pH at approximately 8.5, then the pH of the effluent would become acidic. When the tailings are leached at pH 5.5

Rambler Metals and Mining Canada Limited Project 6409-04 Final Report Phase IV Flotation Bench Scale Lock Cycle Test Program Page 67 of 78
Thibault & Associates Inc.
Applied Process Chemical Engineering
(standard TCLP test), it can be seen that concentrations of cadmium, copper, lead, selenium and zinc would all exceed the maximum specified effluent concentration specified by NLR 65/03 and additional treatment would be required prior to discharge. Several technologically proven and commercially available processes are offered for treating wastewaters contaminated with heavy metals such as those listed above and treatability of the wastewater is not viewed as being an insurmountable issue. In fact, integrated wastewater treatment systems are fairly common for mining operations where sulphide ores are processed.
5.7 Quality Assurance Check on Assays
To assure the accuracy of assay results, 10 samples of varying metals composition from throughout the bench scale test program (i.e. a variety of head, concentrate and tails samples from the batch scoping, ore variability and lock cycle tests) were selected to be blended, split and analyzed for copper, zinc, lead, gold and silver by Activation Laboratories and by the Minerals Engineering Center (formerly Daltech). The analysis of the split samples by Activation laboratories agreed very well with the analysis done by the Minerals Engineering Center. The correlation coefficients (R2 value) were determined by linear regression for each metal and are listed below. The results of the quality assurance check, along with the mass balance checks that were performed on all assay data received over the duration of the test program, substantiate the reliability of the assay data that has been used to prepare this report. The assay data from the quality assurance check is plotted in Figures 42 and 43. R2 for copper assays = 0.9685 R2 for zinc assays = 0.9871 R2 for lead assays = 0.9896 R2 for gold assays = 0.9831 R2 for silver assays = 0.9697

Rambler Metals and Mining Canada Limited Project 6409-04 Final Report Phase IV Flotation Bench Scale Lock Cycle Test Program Page 68 of 78
Thibault & Associates Inc.
Applied Process Chemical Engineering
0.1
1.0
10.0
100.0
0.1 1.0 10.0 100.0
Assays Results by Minerals Engineering Center (%)
Ass
ays
Res
ult
s b
y A
ctiv
atio
n L
abo
rato
ries
(%
)
Copper (w t% Cu)
Zinc (w t% Zn)
Lead (wt% Pb)
Linear Regression Line at 1.0000
Figure 42: Results of Assay QA Checks for Iron, Copper, Zinc and Lead
0.1
1.0
10.0
100.0
1000.0
0.1 1.0 10.0 100.0 1000.0
Assays Results by Minerals Engineering Center (ppm or g/t)
Ass
ays
Res
ult
s b
y A
ctiv
atio
n L
abo
rato
ries
(p
pm
or
g/t
)
Gold (ppm Au)
Silver (ppm Ag)
Linear Regression Line at 1.0000
Figure 43: Results of Assay QA Checks for Gold and Silver

Rambler Metals and Mining Canada Limited Project 6409-04 Final Report Phase IV Flotation Bench Scale Lock Cycle Test Program Page 69 of 78
Thibault & Associates Inc.
Applied Process Chemical Engineering
SECTION 6.0 - CONCLUSIONS
6.1 Characterization of Ore Samples
Rambler collected a mini-bulk sample from the 1600 level of the now dewatered Ming Mine workings within the massive sulphide zone with the intention of providing a sample that would be sufficiently representative for determining design criteria for full scale production from the 1807 zone. It was noted that the bulk sample from the 1600 level contained slightly higher grades of copper and gold and elevated levels of zinc relative to the measured mineral resource grades established by the SRK Mineral Resource Statement (June, 2008) for the 1807 zone. A side-by-side comparison is given in Table 20.
Table 20: Ore Sample Head Grades and Comparison to SRK Mineral Resource Estimate Grades
COPPER HEAD GRADE GOLD HEAD GRADE ZINC HEAD GRADE
SRK Mineral Resource Estimate for 1807 Zone 4.17 wt% Cu 1.93 g/t Au 0.70 wt% Zn
1600 Level Mini-Bulk Ore Sample 5.21 wt% Cu 3.66 g/t Au 2.60 wt% Zn
Ore Variability Sample "A" (1807 Zone High Au) 7.87 wt% Cu 2.38 g/t Au 0.66 wt% Zn
Ore Variability Sample "B" (1807 Zone High Zn) 10.16 wt% Cu 1.92 g/t Au 4.69 wt% Zn
Ore Variability Sample "C" (Lower FWZ) 2.42 wt% Cu 0.086 g/t Au 0.05 wt% Zn
As a result, there was increased focus on maximizing zinc rejection throughout the test program in order to meet the maximum concentrate zinc impurity level defined in the project objectives as 2.5% Zn. Identification of a reagent scheme and flowsheet that would be capable of handling high zinc head grades was deemed to be critical to the process design for the Rambler concentrator, as ore head grade variability has not been fully defined. Drill core assays from the 1807 zone have identified sub-zones containing zinc concentrations of up to 5% Zn and a definitive mine plan based on blending of high and low grades ore to control run-of-mine concentrator feedstock grade from the 1807 zone has not been fully developed. The bulk density and specific gravity of the crushed (P80 = 19 mm) and ground (P80 = 60.3 μm) 1600 level
ore sample were determined to facilitate design of intermediate ore storage and conveying equipment. The crushed and ground ore samples were both found to have a bulk density of 2.15 g/cm3, which may indicate that the crushed material contains a significant fraction of fines. The solids specific gravity of the crushed material was determined to be 3.96 and the solids specific gravity of the ground material was found to be 4.10.
For the mini-bulk ore sample from the 1600 level, the Bond Rod Mill Work Index and the Bond Ball Mill
Work Index were determined to be 6.7 and 8.0 kWh/tonne, respectively. These results characterize the ore as being relatively soft in comparison to a typical sulphide/pyrite based copper ore. Use of the value for the work index as defined by this study may result in under-sizing power requirements.
The limited SEM-EDS mineralogy analysis on a sample of the unprocessed 1600 level ore concluded that
the ore sample was relatively coarse-grained and identified that copper was present solely in the form of chalcopyrite and that sphalerite is closely associated within a matrix of pyrite and chalcopyrite.
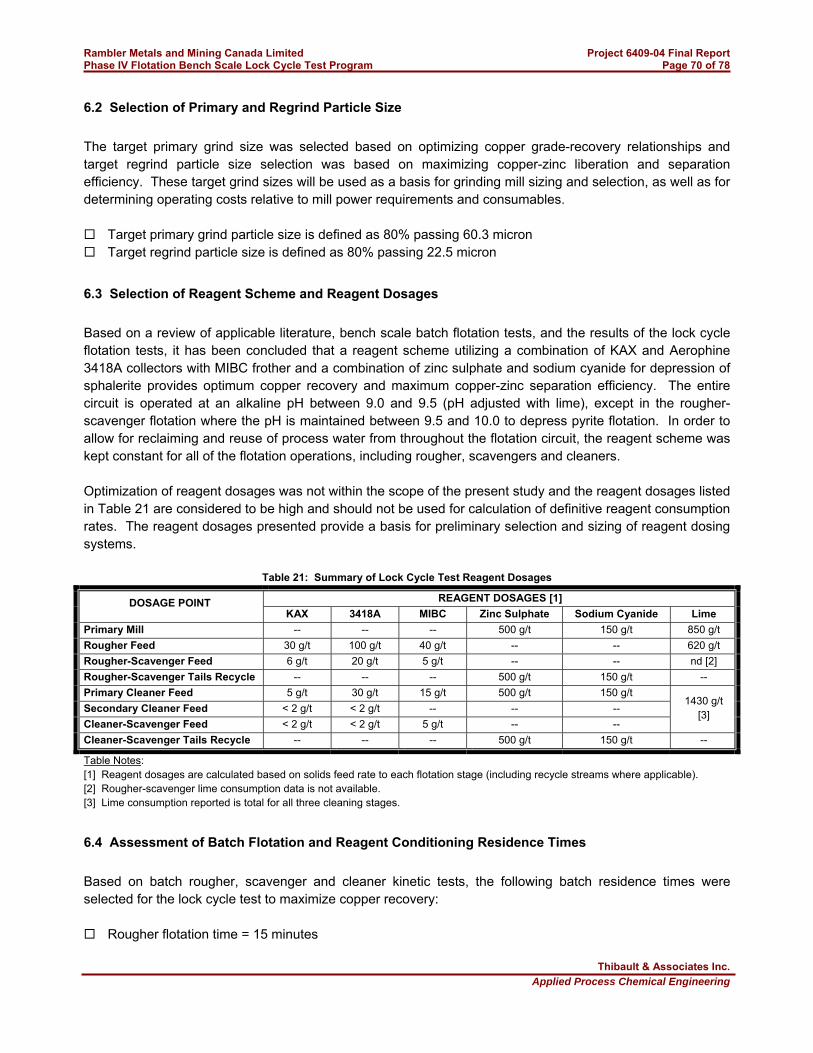
Rambler Metals and Mining Canada Limited Project 6409-04 Final Report Phase IV Flotation Bench Scale Lock Cycle Test Program Page 70 of 78
Thibault & Associates Inc.
Applied Process Chemical Engineering
6.2 Selection of Primary and Regrind Particle Size
The target primary grind size was selected based on optimizing copper grade-recovery relationships and target regrind particle size selection was based on maximizing copper-zinc liberation and separation efficiency. These target grind sizes will be used as a basis for grinding mill sizing and selection, as well as for determining operating costs relative to mill power requirements and consumables. Target primary grind particle size is defined as 80% passing 60.3 micron Target regrind particle size is defined as 80% passing 22.5 micron
6.3 Selection of Reagent Scheme and Reagent Dosages
Based on a review of applicable literature, bench scale batch flotation tests, and the results of the lock cycle flotation tests, it has been concluded that a reagent scheme utilizing a combination of KAX and Aerophine 3418A collectors with MIBC frother and a combination of zinc sulphate and sodium cyanide for depression of sphalerite provides optimum copper recovery and maximum copper-zinc separation efficiency. The entire circuit is operated at an alkaline pH between 9.0 and 9.5 (pH adjusted with lime), except in the rougher-scavenger flotation where the pH is maintained between 9.5 and 10.0 to depress pyrite flotation. In order to allow for reclaiming and reuse of process water from throughout the flotation circuit, the reagent scheme was kept constant for all of the flotation operations, including rougher, scavengers and cleaners. Optimization of reagent dosages was not within the scope of the present study and the reagent dosages listed in Table 21 are considered to be high and should not be used for calculation of definitive reagent consumption rates. The reagent dosages presented provide a basis for preliminary selection and sizing of reagent dosing systems.
Table 21: Summary of Lock Cycle Test Reagent Dosages
REAGENT DOSAGES [1] DOSAGE POINT KAX 3418A MIBC Zinc Sulphate Sodium Cyanide Lime
Primary Mill -- -- -- 500 g/t 150 g/t 850 g/t
Rougher Feed 30 g/t 100 g/t 40 g/t -- -- 620 g/t
Rougher-Scavenger Feed 6 g/t 20 g/t 5 g/t -- -- nd [2]
Rougher-Scavenger Tails Recycle -- -- -- 500 g/t 150 g/t --
Primary Cleaner Feed 5 g/t 30 g/t 15 g/t 500 g/t 150 g/t
Secondary Cleaner Feed < 2 g/t < 2 g/t -- -- --
Cleaner-Scavenger Feed < 2 g/t < 2 g/t 5 g/t -- --
1430 g/t [3]
Cleaner-Scavenger Tails Recycle -- -- -- 500 g/t 150 g/t --
Table Notes: [1] Reagent dosages are calculated based on solids feed rate to each flotation stage (including recycle streams where applicable). [2] Rougher-scavenger lime consumption data is not available. [3] Lime consumption reported is total for all three cleaning stages.
6.4 Assessment of Batch Flotation and Reagent Conditioning Residence Times
Based on batch rougher, scavenger and cleaner kinetic tests, the following batch residence times were selected for the lock cycle test to maximize copper recovery: Rougher flotation time = 15 minutes

Rambler Metals and Mining Canada Limited Project 6409-04 Final Report Phase IV Flotation Bench Scale Lock Cycle Test Program Page 71 of 78
Thibault & Associates Inc.
Applied Process Chemical Engineering
Rougher-scavenger flotation time = 5 minutes Primary cleaner flotation time = 15 minutes Secondary cleaner flotation time = 15 minutes Cleaner-scavenger flotation time = 20 minutes Upon analyzing the full set of process performance data from lock cycle #8, it was found that an acceptable copper concentrate grade (approximately 27.5% Cu) and recovery (approximately 75% based on primary cleaner feed including recycle streams) were produced in the primary cleaner. Even higher copper recovery was achieved in the secondary cleaner (approximately 91% based on secondary cleaner feed), which suggests that the batch residence times could likely be reduced to a minimum of 5 minutes in each of the three cleaner stages in a continuous circuit where the tailings from each cleaner stage are recycled to the previous flotation stage (i.e. operate the cleaner-scavenger stage as a tertiary cleaner stage with counter-current concentrate-tailings flow). A second lock cycle test would be required to confirm the overall process performance, magnitude of recirculating loads and disposition of impurity elements such as zinc, lead, arsenic, antimony, bismuth and mercury using the alternative flowsheet configuration and shorter cleaner flotation times. The flowsheet and process design for the full scale concentrator will incorporate full flexibility for operating the third cleaning stage as either a cleaner-scavenger, which will optimize on copper recovery, or as a tertiary cleaning stage, which will optimize on final concentrate copper grade. Residence times for reagent conditioning in the batch and lock cycle tests were selected based on operating conditions typically used in commercial production facilities. The reagent conditioning times selected for the lock cycle test were found to be effective and may be used as a basis for full scale equipment sizing. The fresh ore feed is conditioned with zinc sulphate and sodium cyanide in the primary grinding mill, which had a batch residence time of 120 minutes for the lock cycle test to produce the target primary grind size of 80% passing 60.3 micron. In the full scale plant, zinc sulphate and sodium cyanide would also be added in the regrind mill; however, for the lock cycle test these reagents were added to a separate cleaner feed conditioning stage, which is included in the list below. Based on bench scale testing, batch reagent conditioning residence times within the flotation circuit are defined as follows: conditioning of rougher feed with KAX and 3418A collectors = 2 minutes conditioning of rougher feed with MIBC frother = 1 minute conditioning of rougher-scavenger feed with KAX and 3418A collectors = 2 minutes conditioning of rougher-scavenger feed with MIBC frother = 1 minute conditioning of recycle streams to rougher (includes rougher-scavenger concentrate and cleaner-
scavenger tails) with zinc sulphate and sodium cyanide = 10 minutes conditioning of primary cleaner feed (includes secondary cleaner tails and cleaner-scavenger concentrate
recycle streams) with zinc sulphate and sodium cyanide = 10 minutes conditioning of primary cleaner feed (includes secondary cleaner tails and cleaner-scavenger concentrate
recycle streams) with KAX and 3418A collectors = 4 minutes conditioning of secondary cleaner feed with KAX and 3418A collectors = 4 minutes conditioning of cleaner-scavenger feed with KAX and 3418A collectors = 4 minutes conditioning of cleaner-scavenger feed with MIBC frother = 1 minute
Rambler Metals and Mining Canada Limited Project 6409-04 Final Report Phase IV Flotation Bench Scale Lock Cycle Test Program Page 72 of 78
Thibault & Associates Inc.
Applied Process Chemical Engineering
6.5 Process Flowsheet Selection The flotation flowsheet used in the lock cycle test with rougher, rougher-scavenger, regrind and two stage cleaning with cleaner-scavenger demonstrated good overall copper recovery; however, the more closed circuit approach resulted in limited zinc rejection when tested on the 1600 level mini-bulk ore sample. Using a mass balance simulation to model the lock cycle flowsheet, it was estimated that the maximum tolerable zinc head grade would be 1.46% to produce a concentrate containing less than 2.5% Zn. Similarly, maximum tolerable head grades were defined for lead (0.175% to produce concentrate containing less than 0.5% Pb) and mercury (4.72 g/t to produce a concentrate containing less than 10.0 g/t Hg) for use with the closed circuit lock cycle flowsheet. Assuming that the operating parameters of each flotation stage would essentially remain constant, the mass balance model was modified to simulate the effect of removing the rougher-scavenger unit from the process flowsheet (Case B) and to simulate the effect of directing the cleaner-scavenger tails to waste (Case C). The outcomes with respect to final concentrate copper and zinc grades were similar; however, the overall recovery of copper was reduced by approximately 3.5% in Case B and 6.5% in Case C. Therefore, it was determined that, by opening up the circuit as proposed in Case B and eliminating the rougher-scavenger, higher run-of-mine zinc head grades could be tolerated with minimal loss of copper recovery, which would allow for much greater process flexibility while maintaining production of a high quality copper concentrate.
6.6 Lock Cycle Copper Recovery and Concentrate Quality
Based on the lock cycle test, the recovery of copper over the last four cycles ranged from 88.4% to 97.0% with the average recovery being 92.4%. The mass balance simulation of the lock cycle flowsheet (Case A), which was based on unit operating parameters calculated using the set of assay data generated from lock cycle #8, predicted an overall copper recovery of 95.5% at steady state. The final concentrate copper grade ranged from 28.0 to 30.3% over the last four lock cycles with an average of 29.1%, which meets the project objective of 24.0% minimum copper recovery. As mentioned previously, high zinc head grades and zinc liberation / rejection issues presented significant challenges during both batch and lock cycle testing of the 1600 level ore. The zinc concentration in the concentrate from lock cycle #8 was 2.65%, while the mass balance for Case A predicted the steady-state concentration of zinc in the final concentrate to be 4.19%, both of which exceed the target maximum zinc impurity level of 2.50% in the concentrate. Opening up the flotation circuit as proposed in the Case B mass balance simulation results in an estimated zinc impurity concentration of 1.94% in the final concentrate when the fresh ore feed zinc head grade is kept constant at 2.46%; or can allow for a maximum tolerable zinc head grade of 3.15% to produce a concentrate containing less than 2.5% Zn. Lead and mercury concentrations in the final concentrate from lock cycle #8 also exceeded the maximum impurity levels defined in the project objectives as 0.50% Pb and 10.0 ppm Hg. The mass balance simulation predicted elevated levels of lead in the concentrate for Cases A, B and C and the proposed flowsheet modifications that were found to be effective for improving zinc rejection do not improve on rejection of lead to the extent where target concentrate grades can be met at lead head grades equivalent to those encountered in the 1600 level ore sample. The maximum tolerable lead head grades to produce a concentrate containing less than 0.5% Pb are 0.175% Pb for Cases A and B and 0.21% Pb for Case C. Results were similar for mercury and the process modifications simulated in mass balance Case B and Case C only succeeded in reducing mercury concentrations in the concentrate to just below the acceptable limits. The maximum

Rambler Metals and Mining Canada Limited Project 6409-04 Final Report Phase IV Flotation Bench Scale Lock Cycle Test Program Page 73 of 78
Thibault & Associates Inc.
Applied Process Chemical Engineering
allowable mercury head grade to produce a concentrate containing less than 10.0 ppm Hg are 4.72 ppm for Case A, 8.73 ppm for Case B and 9.25 ppm for Case C. Gold recovery in lock cycle #8 was 62.4%, which is comparable to the batch flotation gold recoveries of up to about 70%. Based on batch tests, additional gold recovery approaching 95% was only achieved with additional floatation time in the rougher and is accompanied by co-recovery of additional zinc and a significant reduction in the copper-zinc separation efficiency in the rougher circuit. As a result gold recoveries of greater than 60 to 70% may not be feasible in the flotation circuit and may have to be achieved through processing the flotation tailings.
6.7 Solids Sedimentation and Dewatering
Un-flocculated copper concentrate solids were found to have a relatively slow settling velocity of 0.0063 m/min, equivalent to a clarifier rise rate of 0.155 USGPM/ft2. As a result, a small dosage of flocculant may have to be added to the concentrate in order to improve on the thickener overflow clarity. The flocculant dosage should be carefully controlled to minimize the potential for having residual flocculant reagent leftover in the reclaim water from the thickener, which can cause operational problems in the flotation circuit. Samples of concentrate from several cycles of the lock cycle test were blended and dewatered using a bench scale pressure filter under two different conditions. The first set of conditions, using a typical feed pressure of 30 psig (resulting in an average filtration rate of 42.44 L/hr), produced a 12 mm (½") thick filter cake that cracked towards the end of the batch filtration resulting an unacceptable high (target maximum moisture content was defined as 8.0%) residual moisture content of 18.1%. The tendency for a filter cake to crack is inherent to the type of material being filtered and will typically occur when the filter cake reaches a certain minimum moisture content where the material becomes friable and breaks apart. Once the filter cake has cracked it is very difficult to press any further moisture from the product with conventional vacuum or pressure dewatering processes by continuing to applying pressure or by using an air blow cycle to dry the cake due to short circuiting through the cracks. A second dewatering test was performed at a reduced feed pressure of 10 psig and using more feed material to produce a thicker filter cake. Despite slowing the average filtration rate by nearly two and half times, the filter cake in the second trial also cracked and contained a residual moisture content of 22.2%. The fine particle size of the final concentrate (P80 = 15.0 micron) is considered to be a major contributing factor that may cause the concentrate to be difficult to dewater. A membrane style plate and frame filter press is often used in similar applications on difficult to dewater products and will be considered for the Rambler concentrator. The membrane or "variable volume" filter press improves on filter cake dryness in applications where cracking of the filter cake limits the minimum moisture content that can be achieved using conventional filter plate technology by using an inflatable diaphragm to physically squeeze additional moisture from the cake at the end of the normal filtration cycle.
6.8 Ore Variability Tests
Batch rougher flotation tests on two high grade samples from the 1807 zone (ore variability samples A and B) and one sample from the lower footwall zone (ore variability sample C) demonstrated similar performance with respect to copper recovery in comparison to the 1600 level ore sample when subjected to the same batch rougher flotation operating conditions. Copper recoveries were slightly higher for ore variability samples A and B than for the 1600 level sample and may be attributed to the higher copper grade in the feed. The rougher concentrates for ore variability samples A and B contained 0.49% Zn and 0.97% Zn respectively

Rambler Metals and Mining Canada Limited Project 6409-04 Final Report Phase IV Flotation Bench Scale Lock Cycle Test Program Page 74 of 78
Thibault & Associates Inc.
Applied Process Chemical Engineering
and graded 26.03% Cu and 20.01% Cu respectively. For ore variability sample B, which contained the highest zinc head grade at 4.69%, this represented a significant improvement in copper-zinc separation efficiency in comparison to the bulk 1600 level sample, which could be due to differences in the mineralogy between the two samples such as improved copper-zinc liberation characteristics and /or a lesser degree of zinc association with copper. Since the copper head grade of ore variability sample B was almost twice that of the 1600 level, it is also possible that overdosing of collector reagent in the batch and lock cycle tests on the bulk 1600 level sample caused the zinc to float more readily, limiting the effectiveness of the zinc depressant reagents. As a result, there is good potential for improving zinc rejection rates relative to those observed in the lock cycle test by optimizing the collector dosage, which would increase the maximum tolerable zinc head grade in the run-of-mine ore feed to the concentrator and allow for processing of high-zinc ore zones that may otherwise not have been exploitable. Copper recovery for ore variability sample C (from the lower footwall zone) was very high at over 99% and is likely a result of relatively fast flotation kinetics as observed in the SGS Lakefield Research Limited study (reference Figure 2 of SGS Report No. 11707-001), which showed that 97.9% of the copper in the feed from the lower footwall zone was recovered in the first 3 minutes of flotation with 99.2% being recovered after 15 minutes. The lower footwall zone is also known to contain very low levels of zinc, lead, arsenic, antimony and mercury, which makes the ore easier to process in that respect as well. As a result of the faster flotation kinetics and the low levels of impurities requiring separation in the lower footwall zone ore, a flotation circuit sized to process a certain tonnage of 1807 zone ore may be capable of processing up to three times that tonnage of ore from the lower footwall zone and extending the life-of mine expectancy.
6.9 Tailings Leachability and Treatment
Tailings leachability tests conducted using the standard TCLP test at pH 5.5 and a custom TCLP test carried out at pH 8.5 demonstrated that no additional treatment of the tailings pond effluent (other than pH control with lime in the tailings pond) would be required to meet the applicable limits for environmental protection defined by Newfoundland and Labrador Regulation 65/03 as long as the tailings pond pH is maintained at 8.5. The results of a modified acid base accounting test showed that the tailings are acid generating at a maximum theoretical rate of 1203 kg CaCO3 equivalent per tonne (assuming that 100% of sulphides in the tailings are oxidized to sulphuric acid) and would have the potential to acidify the tailings pond water in the absence of lime neutralization and continuous pH monitoring. In the event that the tailings pond pH were to fall to 5.5, the standard TCLP leachate test predicted that concentrations of cadmium, copper, lead, selenium and zinc may exceed the guidelines and require further treatment prior to discharge. Consequently, measures to effectively control and monitor the pH within the tailings pond will be incorporated into the process design.
6.10 Process Water Quality
During the lock cycle test, process water was recycled as much as possible to simulate the effects of process water reclaim in the plant. Analysis of the process water following lock cycle #8 showed slightly elevated levels of selenium relevant to NLR 65/03 effluent discharge criteria. Based on the overall water balance, there is potential for selenium to build-up in recycled water streams to a point where treatment for selenium removal may be required prior to discharge. Wastewater treatment processes for selenium removal are commercially available and technologically proven.

Rambler Metals and Mining Canada Limited Project 6409-04 Final Report Phase IV Flotation Bench Scale Lock Cycle Test Program Page 75 of 78
Thibault & Associates Inc.
Applied Process Chemical Engineering
6.11 Quality Assurance of Assay Results
Assay results by Activation Laboratories agreed very well with results by the Minerals Engineering Center for the 10 blended and split samples of feed, concentrate and tails that were analyzed by the two laboratories as a quality assurance check to substantiate the validity of the assay data obtained throughout the study.

Rambler Metals and Mining Canada Limited Project 6409-04 Final Report Phase IV Flotation Bench Scale Lock Cycle Test Program Page 76 of 78
Thibault & Associates Inc.
Applied Process Chemical Engineering
SECTION 7.0 - RECOMMENDATIONS
7.1 Confirmation of 1807 Zone Run-of-Mine Ore Characteristics and Grade
Based on the results of the lock cycle test and mass balance simulation, maximum tolerable head grades of zinc, lead and mercury impurities were established for the lock cycle flowsheet (Case A), and two variations on the lock cycle flowsheet (Cases B and C). The average run-of-mine ore grade and ore variability within the 1807 zone should be assessed based on full delineation of the ore body and a definitive mine plan. In particular, sub-zones of the 1807 ore body that may contain high concentrations of zinc, lead and/or mercury should be identified and delineated to allow for the development of a comprehensive mine plan that includes blending of ore mined from the various sub-zones to assure run-of-mine grade control within the specified limits of the process. Furthermore, it is recommended that the variability of the Bond Ball Mill Work Index and the Bond Rod Mill Work Index be investigated within the 1807 zone by collecting and testing a minimum of three additional ore samples to confirm that the relatively low Bond Work indices reported for the 1600 level ore sample are representative of the entire 1807 ore body grindability. Additionally, if ore from the other massive sulphide zones or lower footwall zone is intended to be processed by the concentrator to possibly extend the life-of-mine in the future, at least one representative sample from each zone should also be tested to determine its grindability characteristics. By establishing the full range of Bond Work indices that could be encountered in the various zones of the Rambler Property, provisions can be made in the selection of design parameters and general arrangement of the grinding circuit to allow for future expansion or to facilitate processing of ore from different ore zones
7.2 Optimization of Reagent Dosages
A limited amount of further bench scale testing is recommended to optimize on collector dosages for KAX and 3418A in the rougher circuit. From the lock cycle and batch ore variability tests, it was concluded that zinc rejection and copper-zinc separation efficiency was limited in the rougher and rougher-scavenger stages and may be due to overdosing of the collector reagents relative to the head grade of copper. A matrix of batch rougher flotation tests is proposed whereby three ore samples, each having significantly different copper and zinc head grades, would be subjected to a range of collector dosages to determine the optimum reagent dosage for each ore sample based on maximizing copper-zinc separation efficiency. From this data, it is anticipated that a relationship may be established between head grade and optimum reagent dosage that will allow for improved process control, reduced process sensitivity to variation in run-of-mine head grades, tighter quality control on concentrate produced and lower reagent consumption / lower operating costs. Also, as part of this bench scale work, the dosages of zinc depressant reagents, zinc sulphate and sodium cyanide, would also be optimized with the goal of minimizing and/or eliminating the use of sodium cyanide. As mentioned previously, there is a good possibility that optimization of the collector dosage relative to copper and zinc head grade will decrease the tendency for zinc to float in the rougher circuit and improve on zinc rejection rates allowing the dosage of zinc depressant reagent to be decreased significantly and hence lower operating costs. For process feasibility and economic assessment, calculation of operating costs related to reagent usage should be based on definitive reagent dosages determined from bench scale optimization tests.

Rambler Metals and Mining Canada Limited Project 6409-04 Final Report Phase IV Flotation Bench Scale Lock Cycle Test Program Page 77 of 78
Thibault & Associates Inc.
Applied Process Chemical Engineering
7.3 Detailed Mineralogy on Copper Concentrates
Mineralogical analysis using QEMSCAN (Quantitative Evaluation of Materials by Scanning Electron Microscope) technology is recommended on two to four copper concentrate samples produced from the current study to determine the degree of association between gold, copper and sphalerite in the copper concentrate. The QEMSCAN data will help confirm whether the limited copper-zinc separation efficiencies noted in several of the batch flotation tests as well as in the lock cycle test are a result of incomplete zinc liberation, limited selectivity / reagent overdosing or physical separation issues related to grind size / generation of slimes. This would also help confirm design parameters and selection criteria for the regrind mill based on particle size-liberation characteristics of the fine-grained sphalerite within the concentrate. The following concentrate samples are recommended for QEMSCAN analysis in order of priority: final concentrate from lock cycle #8 (sample labelled as LC8-Cl2C) rougher concentrate from ore variability test B (sample labelled R-V-B-RC) rougher concentrate from ore variability test A (sample labelled R-V-A-RC) rougher concentrate from Rmbr90(2) (used KAX and 3418A collectors with no zinc depressant reagent)
7.4 Optimization of Cleaner Flotation Batch Residence Time
From the results of the lock cycle test, it was determined that the batch residence time in each of the three cleaner stages was considered extensive, translating into relatively high capital costs for the cleaner flotation cells, and that these residence times could likely be reduced to 5 minutes each by recirculating the tails from each stage to the previous stage (i.e. counter-current primary-secondary-tertiary cleaner arrangement). It is therefore recommended that a limited amount of additional cleaner tests be performed to optimize on cleaner flotation residence time. Assay data and metallurgical distribution within the three cleaner stages could then be used to compare the cleaner circuit performance that would result from operating in a counter-current configuration to that obtained when operating the third cleaner as a cleaner-scavenger.
7.5 Process Flowsheet Design
In order to make the full scale process as flexible as possible, it is recommended that a rougher-scavenger stage be included, with provisions to bypass the rougher-scavenger flotation and direct the rougher tails to waste when processing ore with higher zinc head grades. In the cleaner circuit, the three cleaner flotation stages should be configured such that the operator has the option of utilizing the third stage as either a tertiary cleaner in counter-current mode (i.e. operate the circuit for grade control) or as a cleaner-scavenger (i.e. operate the circuit for maximum recovery).
7.6 Additional Lock Cycle Test
Following a limited amount of further test work as described in 7.2, 7.3 and 7.4 above, it is recommended that a second lock cycle test be performed using optimized reagent dosages, regrind size and cleaner flotation times on a representative sample of "start-up" ore from the 1807 zone to confirm all process design parameters and to provide a definitive basis for operating costs and process feasibility. The test program

Rambler Metals and Mining Canada Limited Project 6409-04 Final Report Phase IV Flotation Bench Scale Lock Cycle Test Program Page 78 of 78
Thibault & Associates Inc.
Applied Process Chemical Engineering
described; including reagent optimization, cleaner flotation time optimization and lock cycle test based on open circuit flowsheet, would be carried out in parallel to the detailed design process.
7.7 Processing of Ore from Lower Footwall Zone
To extend the life-of-mine and increase the economic viability of the project; the process design, equipment selection and plant layout should allow for future expansion and processing of ore from the lower footwall zone or from other zones on the Rambler property that display relatively fast flotation kinetics. Based on bench scale flotation kinetics and utilization of the flotation circuit for processing ore from the Footwall zone, future expansion of the crushing and grinding and the concentrate dewatering sections of the plant may be achieve up to three times the design throughput value (base on the observed flotation kinetics of the lower FWZ being up to three times faster than 1807 zone flotation kinetics and utilizing the design capacity of the proposed flotation cells for processing of 1807 ore). It is important that in-plant know-how and operator experience are developed to assure flotation operating parameters are adjusted appropriately in response to changes in feedstock. This type of know-how will be gained through operating experience and on-going metallurgical and mineralogical studies to support operation. The installation of the flotation circuit should incorporate a high degree of process flexibility that will allow the operator to make adjustments to process flow, recycle stream disposition, cleaner circuit operating mode, selection of purge streams / waste streams to tailings and reagent addition points to facilitate switching to an alternative feedstock.

APPENDIX A
Rambler Memo RE: Selection of Samples for the Phase IV Flotation Flowsheet Bench Scale Test Program

Date: August 4, 2008
To: Thibault & Associates Inc
Cc: Peter Mercer, George Ogilvie
From: Larry Pilgrim, P.Geo
RE: Selection of Samples for the Phase IV Floatation Flowsheet Bench Scale Test Program, Rambler Property for Rambler Metals and Mining Canada Limited.
On July 4, 2008 a 400 kilogram mini‐bulk ore sample was shipped to the Research and Productivity Council laboratory in Fredericton, New Brunswick. The sample was selected from the Ming Mine facility located on the Rambler Property near Baie Verte Newfoundland. The sample was obtained from the 1600 level in the now de‐watered Ming Mine and will be used in a bench scale “lock cycle” test managed by Thibault & Associates Inc. The objective of the test program is to determine a preliminary reagent scheme, flotation flowsheet and design parameters for mill processing equipment. The program is part of the ongoing development planning work being completed by Rambler on the known deposits of the Rambler Property. Three smaller batch samples were also obtained from selected drillholes as ¼ split core from representative ore zones. The batch samples will be used to complete “scoping tests” to better define the reagent scheme used with the larger sample from the 1600 level during the lock cycle test.
The development of the mill flowsheet is based on obtaining a representative sample of run‐of‐mine ore. It was the responsibility of Rambler to manage the collection/ transportation of the sample for test purposes and to assure that the ore sample was typical of the ore zones and was collected under the strict QA/QC control procedures defined by Rambler personnel. The following description outlines the procedure used by Rambler to ensure the integrity of the sample. It is the opinion of the qualified person overseeing the collection of the samples, Larry Pilgrim, that the samples were collected under Ramblers strict QA/QC procedures and that the samples are representative of run‐of mine ore. Samples could not be collected from the 1807 zone due to caving on the 1801 access; however, Rambler is confident that the 1600 level sample is comparable to the 1807 zone. The batch sample of ¼ split core from the 1807 will confirm variability if any.
1600 Level Mini‐Bulk Lock Cycle Sample
The approximate 400 kilogram mini‐bulk sample was collected from the 1600 Level. The 1600 level was selected because of its good/safe accessibility, centrally located in the Ming Massive horizon and represents at least 75% of the entire strike length of the ore zone. At the time of collection the 1600 level was the only safely accessible level having been recently rehabilitated by the Rambler mine crew. The 1600 level ore remains at least 90% un‐mined as large pillars with only several narrow stoped areas which were probably opened up for ventilation purposes during historical production days. The level appears to have been preserved during the historical production era for access to drill stations on the

north‐side of the Ming Massive Sulphides to test the up‐plunge of the 1806, 1805 and 1807 peripheral ore zones.
Rambler implemented strict quality control and supervision while collecting the mini‐bulk sample. The 1600 level sill drift back and walls were first washed with high pressure water to remove as much oxidation and slimes as possible and to better define the trace of the ore zone. Ten sample collection sites were than established that best represented the strike of the ore lens. Figure 1 shows the 1600 level with the trace of the ore zone in the back of the sill drift and the location of collection sites for the mini‐bulk sample. Pictures 1 and 2 show sample station # 8 before and after blasting. The Rambler mining crew were enlisted to use pneumatic production drills (stopers or jacklegs) to drill a tight pattern of holes at least 30 cm deep across the ore zone at each collection site. The plan was to obtain the best un‐oxidized ore representative of each area selected. After all holes were drilled in all the sample sites the sill drift floor was lined with 10 mil polyurethane sheeting. The drill holes were loaded and blasted sequentially. The miners inspected the sites and scaled the ore zones if required. The fresh ore was then
collected by the Rambler geology department in new cleaned 23 liter plastic buckets as unbiased as possible. One bucket was collected at each site and sealed with a lid for transportation by man‐carrier to Rambler’s secure core shed on surface. The samples were opened, dumped on new clean polyurethane tarps on the swept and cleaned concrete floor of the core shed. For thorough blending the buckets were repeatedly filled and dumped so that the 10 buckets represented the entire length of the sampled area ( see Picture 3). After blending the bucket samples were sealed and loaded into a steel cage with a plywood cover attached and secured with nylon zip locks (see Picture 4). The cage with buckets was placed on a wooden palette for shipping to the Research and Productivity Council laboratory in Fredericton, New Brunswick. The entire process of sampling, transportation, blending and shipping was supervised by the qualified person, Larry Pilgrim, P. Geo.
The table below outlines the results of 2 blended grab samples taken from all 10 sample stations on the 1600 level.

Table 1: Blended grab samples from 1600 level sample stations
SAMPLE Au
(g/tonne) Cu (%)
Zn (%)
25676 3.20 3.30 1.57
25677 1.74 4.30 1.97

Batch Test Samples
Three 20 kilogram ¼ split NQ size core samples were collected from several drill holes on the Rambler Property for smaller batch tests. Two of the samples were selected from drill holes that had previously intersected the 1807 zone and represented ore that had returned assayed intersections with high zinc or gold. The third sample was ¼ split from a representative intersection of the stringer Footwall Zone. Table 2 below shows the intervals selected with original corresponding assays. The core was stored prior to ¼ splitting in Rambler’s secure core shed on site and thus remained in an un‐oxidized state. Ramblers
QA/QC procedures were used in re‐sampling the cored intersections. Samples from each zone were split, bagged, labeled and placed in clean new buckets for shipping to the Research and Productivity Council laboratory in Fredericton, New Brunswick. The entire process of selection, transportation, splitting and shipping was supervised by the qualified person, Larry Pilgrim.


Table 2: List of Batch split core samples with original assays
Bucket A 1807 High Au Low zinc
BHID SAMPLE FROM (m)
TO (m)
LENGTH (m)
Au (g/tonne)
Cu (%)
Zn (%)
RM07‐18b 17031 604.83 606.10 1.27 6.00 16.00 0.93
RM07‐19 17130 590.95 592.80 1.85 2.07 5.26 0.02
RM07‐19 17135 597.40 597.80 0.40 2.69 2.33 0.13
RM07‐19a 17137 597.20 597.50 0.30 2.43 8.08 0.18
RM07‐19e 17280 592.80 593.80 1.00 2.44 15.80 0.12
RM07‐19e 17283 594.35 594.80 0.45 1.98 16.30 0.10
RM07‐19g 17372 595.90 597.07 1.17 1.98 7.71 0.06
RM07‐19g 17376 598.10 598.90 0.80 2.40 8.79 0.08
RM07‐20 17486 657.75 657.95 0.20 2.07 8.00 0.03
RM07‐20e 17708 659.60 660.60 1.00 1.79 5.68 0.28
RM07‐20h 17898 656.00 657.00 1.00 1.88 6.73 0.81
RM07‐20h 17901 657.00 657.58 0.58 10.50 3.85 0.34
RM07‐20h 17915 664.82 665.82 1.00 3.68 0.07 0.04
RM07‐20i 17918 654.25 654.85 0.60 2.87 5.50 0.06
RM07‐20j 18042 662.20 663.36 1.16 54.20 0.53 0.29
RM07‐20k 18154 653.50 654.90 1.40 1.83 4.80 0.68
RM07‐20k 18161 661.20 662.26 1.06 3.08 12.40 0.73
Bucket A composite grade 6.90 7.39 0.33
Bucket B 1807 High Zinc
RM07‐20b 17602 666.75 667.50 0.75 0.84 0.75 2.26
RM07‐20b 17603 667.50 667.85 0.35 0.79 0.50 2.68
RM07‐20b 17607 669.95 670.70 0.75 1.36 3.28 2.03
RM07‐20g 17856 653.90 654.30 0.40 0.77 4.35 4.78
RM07‐20g 17859 656.52 657.41 0.89 0.26 6.92 5.05
RM07‐20g 17863 658.30 659.27 0.97 1.49 4.11 7.55
RM07‐20h 17902 657.58 658.51 0.93 6.27 21.10 2.68
RM07‐20h 17903 658.51 659.44 0.93 2.45 16.80 3.11
RM07‐20h 17904 659.44 660.24 0.80 8.68 15.10 2.49
RM07‐20h 17905 660.24 661.03 0.79 3.05 10.70 5.61
RM07‐20h 17909 663.03 663.47 0.44 2.96 12.00 3.27
RM07‐20h 17913 664.30 664.82 0.52 1.76 15.10 4.81
RM07‐20j 18035 657.83 658.83 1.00 2.94 5.26 2.69
RM07‐20j 18036 658.83 659.56 0.73 3.96 9.13 3.18
RM07‐20j 18037 659.56 660.56 1.00 6.12 14.60 5.41
RM07‐20j 18038 660.56 661.56 1.00 5.69 15.90 3.42

RM07‐20j 18039 661.56 662.20 0.64 1.77 21.30 3.80
Bucket B composite grade 3.29 10.87 3.87
Bucket C Lower Footwall Zone
BHID SAMPLE FROM (m)
TO (m)
LENGTH (m)
Au (g/tonne)
Cu (%)
Zn (%)
RM08‐08k 19414 1180.40 1181.40 1.00 0.04 1.35 N/A
RM08‐08k 19415 1181.40 1182.40 1.00 0.16 3.80 N/A
RM08‐08k 19416 1182.40 1183.40 1.00 0.01 0.60 N/A
RM08‐08k 19417 1183.40 1184.40 1.00 0.30 5.20 N/A
RM08‐08k 19418 1184.40 1185.40 1.00 0.43 8.30 N/A
RM08‐08k 19419 1185.40 1186.40 1.00 0.18 2.60 N/A
RM08‐08k 19421 1186.40 1187.40 1.00 0.03 1.54 N/A
RM08‐08k 19422 1187.40 1188.40 1.00 0.03 1.58 N/A
RM08‐08k 19423 1188.40 1189.40 1.00 0.04 2.04 N/A
RM08‐08k 19424 1189.40 1190.40 1.00 0.02 1.62 N/A
RM08‐08k 19425 1190.40 1191.40 1.00 0.02 1.25 N/A
RM08‐08k 19426 1191.40 1192.40 1.00 0.04 2.21 N/A
RM08‐08k 19427 1192.40 1193.00 0.60 0.17 3.30 N/A
RM08‐08k 19428 1193.00 1193.60 0.60 0.03 3.40 N/A
RM08‐08k 19429 1193.60 1194.60 1.00 0.01 0.85 N/A
RM08‐08k 19431 1194.60 1195.60 1.00 0.03 0.54 N/A
RM08‐08k 19432 1195.60 1196.60 1.00 0.07 2.37 N/A
RM08‐08k 19433 1196.60 1197.60 1.00 0.08 2.23 N/A
RM08‐08k 19434 1197.60 1198.60 1.00 0.04 1.23 N/A
RM08‐08k 19435 1198.60 1199.60 1.00 0.11 2.37 N/A
RM08‐08k 19436 1199.60 1200.60 1.00 0.03 1.69 N/A
RM08‐08k 19437 1200.60 1202.00 1.40 0.16 3.70 N/A
RM08‐08k 19438 1202.00 1203.00 1.00 0.04 2.02 N/A
Bucket C composite grade 0.09 2.42 N/A
In summary Rambler personnel are quite confident that the mini‐bulk sample collected from the Ming Massive sulphide horizon on the 1600 level and the ¼ split batch core samples from the 1807 and Lower Ming Footwall Zones represents run‐of‐mine ore as requested by Thibault & Associates for the Phase IV Flotation Flowsheet Bench Scale Test Program.
Larry Pilgrim, P.Geo.
Chief Geologist
Rambler Metals and Mining Canada Ltd