computers & operations research - brian denton department of systems engineering &...
TRANSCRIPT

Optimal booking and scheduling in outpatient procedure centers
Bjorn P. Berg a,n, Brian T. Denton b,1, S. Ayca Erdogan c,2, Thomas Rohleder d,3,Todd Huschka d,3
a Department of Systems Engineering & Operations Research, George Mason University, 4400 University Drive, MS4A6, Fairfax, VA 22030, United Statesb Industrial & Operations Engineering, University of Michigan, 2893 IOE Building, 1205 Beal Avenue, Ann Arbor, MI 48109-2117, United Statesc Daniel J. Epstein Department of Industrial & Systems Engineering, University of Southern California, 3715 McClintock Ave. GER 240, Los Angeles,CA 90089, United Statesd Department of Health Sciences Research, Mayo Clinic, 200 First Street SW, Rochester, MN 55905, United States
a r t i c l e i n f o
Available online 26 April 2014
Keywords:OR in health servicesStochastic programmingSchedulingSimulation
a b s t r a c t
Patient appointment booking, sequencing, and scheduling decisions are challenging for outpatient procedurecenters due to uncertainty in procedure times and patient attendance. We extend a previously developedappointment scheduling model to formulate a model based on a two-stage stochastic mixed integerprogram for optimizing booking and appointment times in the presence of uncertainty. The objective is tomaximize expected profit. Analytical insights are reported for special cases and experimental results showthat they provide useful rules of thumb for more general problems. Three solution methods are describedwhich take advantage of the underlying structure of the stochastic program, and a series of experiments areperformed to determine the best method. A case study based on an endoscopy suite at a large medical centeris used to draw a number of useful managerial insights for procedure center managers.
& 2014 Elsevier Ltd. All rights reserved.
1. Introduction
Outpatient procedure centers (OPCs) are a growing trend forproviding specialty health care procedures (surgical or non-surgi-cal) in the United States. From 1996 to 2006, the rate of visits toOPCs in the United States increased 300% while the rate of similarvisits to surgery centers in a hospital setting remained constant[11]. The increase in visit frequency is in part due to the patientbenefits for surgery in an OPC setting including lower costs,appointment systems that are often more amenable to patientpreferences, the ability to recover at home, lower complicationrates, lower infection rates, and shorter procedure durations.
Patient appointment planning decisions are challenging forOPCs due to uncertainty in procedure times and patient atten-dance. The reasons why patients do not attend their appointments(no-show) vary widely. Contributing reasons for no-shows includea high co-pay, incomplete preparation for the procedure, trans-portation problems, and forgetfulness. No-shows cause poorresource utilization and unanticipated loss of revenue for the
provider. This problem is particularly acute for OPCs because theyoften have very high fixed costs of staff and physical resources.Due to the nature of preparation process for procedures on thepatient's behalf, OPCs have little flexibility in changing theirschedule as the day of the planned procedures approaches. Thus,OPCs have little recourse when in terms of adjusting theirschedules for no-shows or late cancellations. A review by Machariaet al. [27] reported that no-show rates range from 6 to 92% inoutpatient settings. For the endoscopy suite considered in thisarticle, no-show rates ranged between 13 and 24%, depending onthe type of procedure.
Recent attention has focused on interventions to prevent no-shows including appointment reminders or educational materialto help the patient prepare for their appointment. While inter-ventions may help reduce the no-show rate (at a cost to theprovider), high no-show rates are still reported among providers[16]. Therefore, we consider ways to mitigate the effects of no-shows through a combination of booking decisions and optimalscheduling decisions that account for uncertain procedure timeand patient attendance. Note that consistent with the appoint-ment scheduling literature we use the term sequence for the orderin which patients arrive and schedule to refer to patient interarrivaltimes given a fixed sequence.
Overbooking has been successful in other service industriesincluding airline scheduling [34], hotel booking [33], and car rental[17]. However, overbooking in OPCs presents some unique challenges.For instance, while an airline can pay an overbooked passenger to take
Contents lists available at ScienceDirect
journal homepage: www.elsevier.com/locate/caor
Computers & Operations Research
http://dx.doi.org/10.1016/j.cor.2014.04.0070305-0548/& 2014 Elsevier Ltd. All rights reserved.
n Corresponding author. Tel.: þ1 703 995 6562.E-mail addresses: [email protected] (B.P. Berg),
[email protected] (B.T. Denton), [email protected] (S. Ayca Erdogan),[email protected] (T. Rohleder), [email protected] (T. Huschka).
1 Tel.: þ1 734 763 2060.2 Tel.: þ1 213 821 0705.3 Tel.: þ1 507 284 2511.
Computers & Operations Research 50 (2014) 24–37

a later flight, it is not appropriate for a patient that has undergonepreparation for a procedure to be delayed to a later day. Furthermore,most perishable asset problems study the use of a discrete physicalasset (e.g. airplane seat and hotel room). The problem faced by healthcare providers is unique in that the asset being reserved (time with aprovider or resource) is continuous in nature and there is not a one-to-one allocation of resources to customers. Since patients may havedifferent procedure times and no-show rates, the choice of how manypatients to book on a particular day is closely related to the sequencingand scheduling decisions.
In this article, we begin by presenting a generic model for astochastic server. The objective of our model is to maximize profitwhich is defined as the difference in per patient reimbursements(revenue) and the weighted sum of costs associated with patientwaiting time, provider idle time, and overtime. Decision variablesinclude the number of patients to book on a given day, thesequence of patient arrivals during the day, and interarrival timesbetween patients. The sequencing and scheduling decisions aremade for a particular booking decision (number of patients);however, by iteratively evaluating a range of booking decisions,the optimal booking, sequencing, and scheduling decisions areformulated as a single optimization model. Procedure times andpatient attendance are random in nature and observed on the dayof service, after the appointment decisions are made. Patients areorganized into classes according to characteristics that influencetheir no-show probabilities and procedure duration distributions.We consider the perspective of the manager that needs to decideon an appointment sequence and schedule prior to receivingappointment requests. Given the historical demand of classes, acertain number of appointments for each class are reserved.As appointment requests arrive over time patients are allocatedthe first available appointment corresponding to their class andprocedure type. This process is consistent with several practiceswe have observed, including that which motivates the case studyin Section 7.
The appointment sequencing and scheduling aspect of our modelis formulated as a two-stage stochastic mixed-integer program. Weanalyze the structure of the stochastic program and we identifyseveral properties that can be exploited to achieve computationaladvantages. We consider some special cases for which it is possible toprovide sufficient conditions for the optimal sequence and schedule,and we show that these provide useful insights to the generalproblem. These insights are used to motivate heuristics that areshown to be useful for finding the optimal sequences. Three differentsolution methods are evaluated which include two decomposition-based approaches and a primal heuristic with which to begin thetraditional branch-and-bound algorithm. The decomposition-basedsolution methods take advantage of the special structure of theunderlying stochastic program. The results of our experiments areused to draw managerial insights for OPCs.
This article seeks to answer a number of important researchquestions. From the perspective of an OPC manager we investigatethe following questions: How many patients should be booked fora given day and how is the number influenced by an OPC's costs?What is the optimal arrival pattern to mitigate the risk of no-shows? What is the potential benefit of overbooking in an OPCenvironment? We evaluate the effectiveness of a single-serverapproximation, which is commonly studied in the operationsresearch literature, in the context of a real OPC. We present a casestudy based on the Division of Gastroenterology and Hepatology atMayo Clinic in Rochester, MN. The division performs minimallyinvasive, endoscopic procedures for preventive, diagnostic, andtherapeutic reasons. We use historical data to generate a set ofrealistic problem instances. Although our results are presented inthe context of an endoscopy practice, the managerial and meth-odological insights are applicable to many other contexts.
The remainder of this article is organized as follows. In Section 2we review the relevant literature on appointment scheduling sys-tems and no-shows. In Section 3 we present our model formulation.In Section 4 we present analytical insights about the structure of theoptimal sequence and schedule for a special case. In Section 5 wediscuss three solution methods that are applicable to our problem,and which take advantage of the underlying structure of our model.In Sections 6 and 7 we present numerical results comparing theproposed solution methods, and the results of the case study,respectively. Finally, in Sections 8 we summarize the most importantmanagerial insights that can be drawn from our study.
2. Literature review
In this section we review some of the relevant literature onappointment scheduling and no-shows. More comprehensivereviews of outpatient appointment scheduling are provided byCayirli and Veral [9] and Gupta and Denton [19]. Although thisarticle focuses on OPCs, the terms procedure and service, and patientand customer, are used interchangeably in referencing the literature.
Appointment scheduling in the outpatient setting has receivedconsiderable attention beginning with Bailey [1], who used a queuingmodel to compare schedules of customer arrivals at a single server.In addition to queuing models there has been a long history ofdevelopment of heuristics for appointment scheduling. Soriano [35]was among the first. The author studied a two-at-a-time heuristicmotivated by increasing provider utilization and mitigating theeffects of tardy patients. Although not explicitly motivated by no-shows, this heuristic is an early reference to the use of doublebooking to attempt to mitigate the impact of uncertainty in thepatient arrival process. However, for appointment scheduling settingssuch as OPCs, the queue does not reach a steady state.
The articles cited above assume a fixed sequence of patientarrivals to the stochastic server. Some studies relaxed this assump-tion. For example, Weiss [39] provided analytical results for a two-patient sequencing and scheduling problem, establishing sufficientconditions for the optimal schedule to follow a convex ordering ofservice time distributions. Similarly, Klassen and Rohleder [25]explored the use of service time distribution information andreported that sequencing patients by increasing duration varianceworks well when patients are dynamically scheduled and there isuncertainty in future demand classification. Similar conclusionsare reported by Rohleder and Klassen [32] for realistic clinicsettings with patient preferences and scheduler behavior uncer-tainty. Dexter and Ledolter [14] developed a Bayesian method forcalculating prediction bounds for surgical durations that can beused to sequence surgeries. Vanden Bosch and Dietz [37] used apairwise swap based heuristic to sequence patients and subse-quently determine the optimal appointment schedule. Dentonet al. [12] formulated a model to include decisions about thesequence of arrivals where total enumeration was applied to smallproblems (fewer than 5 customers) and compared to simpleheuristics for larger problems. The authors concluded that theheuristics worked well for small test cases but there were cases inwhich the heuristics performed very poorly. Extending this line ofresearch to multiple operating rooms, Mancilla and Storer [28]developed a decomposition-based algorithm for allocating andsequencing a single surgeon's procedures in two parallel operatingrooms. Considering the problem of developing surgery schedulesthat absorb the added uncertainty of emergency surgeries, Bruniet al. [8] develop a stochastic program to find optimal schedulingstrategies. A rolling horizon heuristic is presented to evaluaterescheduling and overtime use strategies.
Recently, several authors have considered models that considerthe challenge of patient no-shows. Hassin and Mendel [20]
B.P. Berg et al. / Computers & Operations Research 50 (2014) 24–37 25
explored the impact of no-shows in the context of a single serverqueuing model. The authors minimized the sum of expectedcustomer waiting and server availability costs using sequentialquadratic programming. Kim and Giachetti [24] developed astochastic booking model to determine the optimal number ofpatients to book based on conditional probabilities of no-showsand walk-ins during the day. LaGanga and Lawrence [26] devel-oped a utility function that considers the need to balance patientwaiting and overtime with the goal of serving additional patients.They used discrete event simulation and regression analysis intheir experiments and concluded that overbooking is appropriatein certain cases such as when there is a high volume of patients,high no-show rates, and low service variability. Erdogan andDenton [15] use a multi-stage stochastic program to formulatethe problem of dynamically assigning appointment times topatients when the future demand, service duration, and atten-dance are uncertain. Dynamic booking decisions were also con-sidered by Muthuraman and Lawley [29] where patient waiting,overtime, and revenue are the objectives in their queuing model,which assumes exponential service times. Zeng et al. [40]extended the work of Muthuraman and Lawley [29] to considera heuristic for overbooking patients with heterogeneous no-showprobabilities. Cayirli et al. [10] used simulation and nonlinearregression to develop an appointment system that focuses onthe dome shape appointment schedule and can be parametrizedfor individual practices based on service duration characteristicsand attendance rates. Begen and Queyranne [3] took advantage ofthe special structure of the appointment scheduling problem withdiscrete service times, no-shows, and walk-ins to find optimalappointment schedules in polynomial time; the authors specifi-cally identify the challenge of simultaneously making sequencingand scheduling decisions as important future research.
This article contributes to the literature in the following ways.First, our model combines several aspects of the literature refer-enced above including simultaneously determining the number ofpatients to book, and the patient sequence and schedule on theday of service, in the presence of procedure time and attendanceuncertainty. Unlike queuing models, our model requires no specialassumptions regarding the distributions of procedure times, no-show probabilities, or other model parameters. Second, instead ofstudying only simple heuristics using simulation models we studyoptimization methods to find exact solutions, or tight optimalitygaps when limited by computation time. While the model for-mulation presented in this article has similarities to that in [12],significant model enhancements are included in order to solvelarger instances with exact methods. Third, we present newtheoretical results for small problems that give insights into thespecial structure of optimal solutions including simple sequencingrules and the use of double booking to mitigate the risk of no-shows. We show that theoretical results are useful in providingheuristics that lead to optimal solutions, based on results from theexact solution methods. Substantial focus has been given toheuristically determining patient sequences, the performance ofmany heuristics when compared to provably optimal sequences isundetermined. Finally, we apply our model to a OPC to evaluatethe effectiveness of using a single server approximation for a morecomplicated multi-server system.
3. Model formulation and structure
We start by formulating the booking decision problem. Weassume that the goal is to maximize the difference between theexpected revenue generated from booking n patients, R(n), and theexpected variable cost associated with booking n patients, C(n). Itis important to note that there is an implicit cost of no-shows
reflected in the lost revenue. The booking decision problem can bedefined as follows:
maxn
fRðnÞ�CðnÞg; ð1Þ
where RðnÞ ¼ ðmarginal revenueÞ �∑ni ¼ 1ð1�piÞ and C(n) is the
expected weighted sum of patient waiting time, provider idlingtime, and overtime.
Since the revenue, R(n), is straightforward to compute, theremainder of this section focuses on the cost, C(n), which isdetermined by the optimal appointment sequence and schedulethat minimizes the expected costs. For a fixed n, C(n) can beformulated as a two-stage stochastic mixed-integer program. Thefirst stage decisions include sequencing patients, and determin-ing the interarrival times for each patient in a given sequence.The second stage decisions are patient waiting time, provideridling time, and overtime under each possible scenario. Theseare determined after the sequencing and scheduling decisions aremade, and patient attendance and procedure time durationsare observed. In our model we implicitly assume that there is noopportunity to modify the schedule on the day of service, i.e.,rescheduling during the day. This is reasonable since such changesare very uncommon for most service systems including OPCs.Although patients may fail to attend their appointments, weassume those patients that do attend are punctual. This isconsistent with our observations of several OPCs in which patientsare generally observed to be on time or early.
Our stochastic programming model is defined using the follow-ing notation where bold face is used to denote vectors throughout:
Indicesi; i0: indices for patientsj: index for appointment sequence slot assignmentsω: index for scenariosFixed model parametersn: number of patientscwii0 : sequence dependent waiting cost for patient i0 following
patient icsii0 : sequence dependent idling cost for idling time between
patients i0 and icl: overtime costd: planned length of clinic dayM1 and M2 : upper bounds for patient waiting and provider
idling, respectivelyScenario dependent model parametersziðωÞ: procedure duration for patient i in scenario ωAiðωÞ: attendance indicator for patient i in scenarioω (AiðωÞ ¼ 1
if the patient attends,AiðωÞ ¼ 0 otherwise)ξðωÞ: random vector containing scenario dependent
parameters, ξðωÞ ¼ ðz1ðωÞ;…; znðωÞ,A1ðωÞ;…;AnðωÞÞ where n is the number of patients, AABn, and
zARnþ
First stage decision variablesoii0 :binary precedence variable defining whether patient i is
followed by patient i0 (oii0 ¼ 1)or not (oii0 ¼ 0)qij: binary assignment variable defining whether patient i is
assigned to appointment slot j(qij ¼ 1) or not (qij ¼ 0)xi: time allotted to patient i's procedureSecond stage decision variableswii0 ðωÞ: sequence dependent waiting time for patient i0 when
preceded by patient i in scenario ω
B.P. Berg et al. / Computers & Operations Research 50 (2014) 24–3726
sii0 ðωÞ: sequence dependent idle time between patients i and i0
in scenario ωlðωÞ: total overtime for scenario ω with respect to the planned
length of clinic day dgðωÞ: total earliness of the completion of the last procedure for
scenario ωwith respect to the planned length of clinic day d
Note that for simplicity we suppress dependence of the secondstage decision variables onω in the mathematical formulation thatfollows, but the dependence of the second stage random para-meters on ω is maintained.
The length of day is the sum of procedure times for all patientsplus the idle times between each procedure. However, since the dayends when the last procedure ends, or is a no-show, we exclude theidle time following the last patient. To do this, a dummy patient isintroduced, who is always the final patient. The dummy patient haszero procedure time and defines the completion time of the final realpatient as the completion time of the clinic day. The dummy patientand the associated final appointment slot are denoted in the indicesby nþ1. Using the notation defined above, the mathematicalformulation can be written as follows.
First stage problem:
CðnÞ ¼min Qðo;q; xÞ ð2aÞ
s:t: ∑nþ1
i0 ¼ 1oii0 r1 8 i ð2bÞ
∑nþ1
i ¼ 1∑nþ1
i0 ¼ 1oii0 ¼ n ð2cÞ
qijþqi0 jþ1�1roii0 8 ði; i0; jrnÞ ð2dÞ
∑nþ1
i ¼ 1qij ¼ 1 8 j ð2eÞ
∑nþ1
j ¼ 1qij ¼ 1 8 i ð2fÞ
∑nþ1
i ¼ 1oi;nþ1 ¼ 1 ð2gÞ
∑nþ1
i ¼ 1onþ1;i ¼ 0 ð2hÞ
qnþ1;nþ1 ¼ 1 ð2iÞ
oii0 ; qijAf0;1g 8ði; i0; jÞ ð2jÞ
xiZ0 8 i; ð2kÞwhere
Qðo;q; xÞ ¼ Eξ½Q ðo;q; x; ξÞ�: ð3Þ
Second stage recourse problem:
Q ðo;q; x; ξÞ ¼min ∑nþ1
i ¼ 1∑n
i0 ¼ 1cwii0Ai0 ðωÞwii0 þ ∑
nþ1
i ¼ 1∑nþ1
i0 ¼ 1csii0 sii0 þcll ð4aÞ
s:t: wii0 rM1oii0 8 ði; i0;ωÞ ð4bÞ
sii0 rM2oii0 8 ði; i0;ωÞ ð4cÞ
� ∑nþ1
i0 ¼ 1wi0iþ ∑
nþ1
i0 ¼ 1wii0 � ∑
nþ1
i0 ¼ 1sii0 ¼ AiðωÞziðωÞ�xi 8ði : ianþ1;ωÞ ð4dÞ
∑nþ1
i ¼ 1∑n
i0 ¼ 1sii0 � lþg¼ d� ∑
nþ1
i ¼ 1AiðωÞziðωÞ 8ðωÞ ð4eÞ
wii0 ; sii0 ; l; gZ0 8ði; i0;ωÞ: ð4fÞThe formulation in (2a)–(2k) minimizes the expected costs ofpatient waiting, server idling, and overtime costs over all scenar-ios. Note that there are no direct costs associated with the firststage decisions. Constraint (2b) ensures that each patient precedesat most one other patient. Constraint (2c) ensures that everypatient, except for the dummy patient and the first patient, isincluded in exactly two precedence relationships. Constraint (2d)states that a precedence relationship can only exist if that samerelationship is defined by the appointment slot assignment deci-sions. Constraints (2e) and (2f) require that one patient is assignedto every appointment sequence slot and every patient is assignedto one appointment sequence slot. Constraints (2g)–(2i) ensurethat the dummy patient will be the last patient as defined by thebinary precedence variables and the appointment slot assignmentvariables. Binary and non-negativity restrictions on the first stagedecision variables are defined by (2j) and (2k), respectively.
If patient i does not precede patient i0, the associated sequencedependent waiting and idling times will be 0 by constraints (4b)and (4c) as enforced by M1 and M2, respectively. Constraint (4d)calculates the waiting and idling times associated with eachpatient based on the waiting time for the preceding patient. Notethat for a given patient, either the associated waiting time or idlingtime can be positive, but not both. The clinic's overtime andearliness are defined by (4e) with respect to the planned length ofthe clinic day, d. Non-negativity restrictions on the second stagedecision variables are defined by (4f).
The attendance indicator, AiðωÞ, in (4a), (4d), and (4e) isassigned according to the probability of no-show for that patient,pi, and can be written as
AiðωÞ ¼1 with probability 1�pi0 with probability pi:
(
Thus, if a patient does not show up for an appointment theattendance indicator is 0, and the procedure duration is 0 in(4a), (4d), and (4e). Note that the model allows for the possibilitythat individual no-show probabilities differ among patients.
The formulation presented in Denton et al. [12] is extended inthis formulation first through the inclusion of heterogeneous no-show probabilities, and second through the use of both prece-dence and assignment variables in order to strengthen theformulation. The use of assignment decision variables has theadvantage of not requiring sub-tour elimination constraints thatwould otherwise be necessary with the binary precedence vari-ables alone. Waiting and idling time decisions are sequencedependent since different patients may have different no-showprobabilities. Thus, binary precedence variables are included in theformulation.
4. Analytical insights
In this section we present properties of special cases thatprovide insights into the general problem. The results of thissection are important for two reasons. First the propositionsdiscussed provide some intuition behind the properties of optimalsolutions that we observe for larger practical problems. Second,they are used to motivate easy-to-implement heuristics that weevaluate in Section 6.
We consider the special case where n¼ 2; cl ¼ 0, and ziðωÞ areindependent and identically distributed for i¼1,2. Note that this isequivalent to minimizing the expected cost of waiting and server
B.P. Berg et al. / Computers & Operations Research 50 (2014) 24–37 27

idling, which is a common formulation in the appointmentscheduling literature. In comparing sequences, we assume thatthe time allotted to the first patient in each of the sequences isrepresented by x. In the case of two patients, the end of the day isdefined as when the last patient finishes, regardless of how muchtime is allotted for it. Thus, the only time allotment decision thatinfluences the waiting of the second patient or the idle timebetween the patients is the allocation of the first patient. Theexpected value of the cost function for the sequence f1;2g, denotedby Z12, is
Z12 ¼ Eω½ð1�p1Þð1�p2Þðcwðz1ðωÞ�xÞþ Þþð1�p1Þðcsðx�z1ðωÞÞþ Þþðp1ÞðcsðxÞÞ�: ð5Þ
Similarly, the expected value of the cost function for the sequence{2, 1} is
Z21 ¼ Eω½ð1�p2Þð1�p1Þðcwðz2ðωÞ�xÞþ Þþð1�p2Þðcsðx�z2ðωÞÞþ Þþðp2ÞðcsðxÞÞ�: ð6Þ
With this definition of a two patient problem we state thefollowing propositions that define optimal sequencing decisionsbased on no-show probabilities and procedure duration distribu-tion conditions. Proofs for each proposition can be found in theappendix.
Proposition 4.1. If p1op2 and z1ðωÞr cxz2ðωÞ, then the sequencef1;2g is optimal r cx denotes a convex ordering.
Proof. Let xn1 and xn2 be the optimal solutions for the sequencesf1;2g and f2;1g, respectively. Then,Z12ðxn1ÞrZ12ðxn2Þ ¼ ðEω½csððxn2�z1ðωÞÞþ þp1ðxn2�ðxn2�z1ðωÞÞþ ÞÞ�Þ
r ðEω½csððxn2�z2ðωÞÞþ þp2ðxn2�ðxn2�z2ðωÞÞþ ÞÞ�Þ ¼ Z21ðxn2Þ:The second inequality follows from the convex ordering, theconvexity of overtime, and the assumption that p1op2. □
Intuitively, this can be explained as sequencing the patient withgreater uncertainty at the end of the day where they are less likelyto disrupt the rest of the schedule. Next, we present the optimalallotment of time for the first patient, xn1, for the sequence f1;2gwhere p1op2 and ziðωÞ are i.i.d for i¼1,2, and xn1. x
n
1 is defined asthe following based on (5)
xn1 ¼ arg minx1
fEω½ð1�p1Þð1�p2Þðcwðz1ðωÞ�x1Þþ Þ
þð1�p1Þðcsðx1�z1ðωÞÞþ Þþðp1Þðcsðx1ÞÞ�g:Taking the derivative of (5) with respect to x1 and setting it equalto 0 yields
�ð1�p1Þð1�p2ÞcwPðz1ðωÞ4x1Þþð1�p1ÞcsPðz1ðωÞox1Þþðp1Þcs ¼ 0;
which is a convex function of x1. From which we can solve forPðz1ðωÞox1Þ,
Pðz1ðωÞox1Þ ¼cwð1�p1Þð1�p2Þ�csðp1Þ
cwð1�p1Þð1�p2Þþcsð1�p1Þ:
Thus, the expected cost in (5) is minimized when the allotted timefor the first patient in the sequence f1;2g is
xn1 ¼ inf x1Z0 : Fðx1ÞZcwð1�p1Þð1�p2Þ�csðp1Þ
cwð1�p1Þð1�p2Þþcsð1�p1Þ
� �: ð7Þ
The case for sequence f2;1g for xn2 can be derived similarly from(6). The next proposition relates the above optimal decisions in (7)to double booking, which we define as scheduling the simulta-neous arrival of two patients.
Proposition 4.2. If z1ðωÞ and z2ðωÞ are i.i.d., and p1op2, then it isoptimal to double book if ð1�p1Þð1�p2Þ=p1rcs=cw.
Proof. Double booking implies that xn1 ¼ 0 for f1;2g. SincePðz1ðωÞo0Þ ¼ 0 and Fðx1 ¼ 0Þ ¼ 0 we have the following from (7)
Fð0Þ ¼ 0Zcwð1�p1Þð1�p2Þ�csðp1Þ
cwð1�p1Þð1�p2Þþcsð1�p1Þ:
Since the denominator is always positive, we know
0Zcwð1�p1Þð1�p2Þ�csðp1Þand it must hold that
ð1�p1Þð1�p2Þp1
r cs
cw:
Thus, if ð1�p1Þð1�p2Þ=p1rcs=cw, ziðωÞ are i.i.d. and p1op2, thenit is optimal to double book. □
Proposition 4.2 provides a sufficient condition based on waitingand idling cost parameters, cw and cs, and no-show probabilities,p1 and p2, for double booking patients to be optimal. Intuitively, asp1 grows large and/or the ratio of server idling to waiting costbecomes large, double booking becomes optimal. This providestheoretical support for double booking, which is commonly donein practice.
5. Solution methods
The most computationally challenging part of our bookingdecision model in (1) is the two-stage stochastic mixed-integerprogram in (2a)–(2k). In this section we briefly summarize threealternative methods that are suited to the underlying structure ofthe problem. The first two methods are decomposition methodsbased on the classic L-shaped method suggested by [36]. Thethird uses another well known stochastic programming method,progressive hedging, suggested by [31], as a primal heuristic,to accelerate branch and bound to solve the extensive form of(2a)–(2k).
5.1. Model structural properties
For the solution methods we exploited properties of thestochastic mixed-integer program in (2a)–(2k). First, valid inequal-ities derived from the mean value problem have been used as alower bound in the L-shaped method to accelerate convergence oftwo-stage stochastic mixed-integer programs such as ours byBatun et al. [2]. From the multivariate version of Jensen's inequal-ity [5] it follows that Qðo; q; xÞZQ ðo; q; x; ξðωÞÞ where ξðωÞ repre-sents the mean value scenario. Jensen's inequality applies tofunctions that are convex in the random variables. Note that thewaiting time for patient i is wi0i ¼ ðAi0zi0 �xi0 Þþ þwi″i0 , which is thenmultiplied by Ai in (4.4a). The idling time before patient i issi0i ¼ ðxi0 �Ai0zi0 þwi″i0 Þ. Thus, waiting and idling are both convex inA and z. The overtime can be written as l¼ ð∑iAizi�dþ∑i∑i0sii
0Þþ ,and is thus convex in A and z. Thus, (4.4a) is a sum of convexfunctions, and is itself convex in A and z. We use the mean valueproblem inequalities as a lower bound to accelerate our proposedsolution methods by adding the following constraints:
θZ ∑nþ1
i ¼ 1∑n
i0 ¼ 1cwii0Ai0wii0 þ ∑
nþ1
i ¼ 1∑nþ1
i0 ¼ 1csii0sii0 þcll ð8aÞ
wii0 rM1oii0 8 ði; i0Þ ð8bÞ
sii0 rM2oii0 8 ði; i0Þ ð8cÞ
� ∑nþ1
i0 ¼ 1wi0iþ ∑
nþ1
i0 ¼ 1wii0 � ∑
nþ1
i0 ¼ 1sii0 ¼ Aizi�xi 8ði : ianþ1Þ ð8dÞ
B.P. Berg et al. / Computers & Operations Research 50 (2014) 24–3728

∑nþ1
i ¼ 1∑n
i0 ¼ 1sii0 � lþg ¼ d� ∑
nþ1
i ¼ 1Aizi ð8eÞ
wii0 ; sii0 ; l; gZ0 8ði; i0Þ: ð8fÞIn the above inequalities Ai and zi are the mean values for the
no-show indicators and procedure times respectively, wii0 ; sii0 ; l;and g are auxiliary decision variables for the mean value scenario,and oii0 and xi are the first stage decision variables previouslydefined.
The second property relates to the strength of the formulation.For each scenario, ω, an upper bound for wii0 can be defined as thesum of all the procedure durations. That is, the waiting timeassociated with each patient will be no greater than the totalprocedure time for all patients. An upper bound for idling time canbe defined as the upper bound for xi, where we define the upperbound for xi to be the length of the clinic day, d, since allscheduling is planned to be within the given scheduling horizon.Thus, to strengthen our formulation in Eqs. (4b) and (4c) for eachscenario, ω, we define M1 and M2 as the following:
M1ðωÞ ¼ ∑n
i ¼ 1ziðωÞ 8ω; ð9Þ
M2 ¼ d: ð10ÞNote that M1 now has argument ω because the upper bound isdependent on the particular scenario, ω.
The third property relates to symmetry in the patient sequen-cing decisions. When similar patients can be aggregated into aclass based on procedure duration distributions and no-showprobabilities, we use the following symmetry breaking constraintsto enforce an arbitrary sequence within a class:
qi;j� ∑n
k4 jqiþ1;kr0 8 j¼ 1;…;n and ði; iþ1ACÞ; ð11Þ
where C defines the set of patients in the class. Antisymmetryconstraints such as this have been shown to have a significantimpact on computation time [13,30].
5.2. Exact methods
The L-shaped method is a classic decomposition method fortwo-stage stochastic programs (see [36] for an early reference, and[6] for a general review) that takes advantage of an alternativeformulation of (2a)–(2k) using outer linearization. At each itera-tion, v, of the L-shaped method, a master problem is solved toobtain a feasible solution, ðov;qv; xv;θvÞ, where θv lower boundsthe recourse function, Qðo;q; xÞ. The first stage solution is passedto the second stage subproblems which are solved independentlyto obtain the dual solutions. Optimality cuts, which are lowerbounding hyperplanes of the recourse function, Qðo;q; xÞ, aregenerated from the second stage dual solutions and added to themaster problem. The algorithm proceeds until the optimal solutionis found or some predefined tolerance is satisfied.
In our model the subproblems are very easy to solve andfeasibility cuts, which induce feasibility in the master solution ateach iteration, are not required since every sequence and schedulegenerated by the master problem is feasible for the second stagesubproblems, i.e., the problem has complete recourse.
In addition to the classic L-shaped method, we implemented ahybrid multicut version of the algorithm. The original multicutL-shaped method [7] generates an optimality cut for everyscenario in the second stage. Our initial computational experiencerevealed that while more information is passed to the firststage problem through additional cuts, the size of the masterproblem MIP grows quickly, and the master problem becomes
computationally expensive to solve due to the large number ofadditional cuts. Instead, we aggregated cuts by ranking scenariosinto groups based on total procedure time. For example, in a twocut implementation, one cut is generated from scenarios with thelowest 50% of total procedure times, and the other is generatedfrom scenarios with the highest 50% of total procedure times.
In our third method, we solve the extensive form of (2a)–(4f)directly by branch and bound, using a primal heuristic to generatean initial feasible solution. Progressive hedging, a scenario-baseddecomposition method for multi-stage stochastic programs pro-posed by [31], is well suited as a primal heuristic. It is based on analternative formulation of the two-stage stochastic program inwhich the first stage decision variables are indexed according toscenarios. Thus, the first stage decisions depend on the observedoutcome of the random variables, and different decisions may bemade for each scenario in the first stage in anticipation of therandom outcome. In progressive hedging, the nonanticipativityconstraints are relaxed and scenario subproblems for each ω aresolved independently. Lagrangian multipliers are introduced toenforce nonanticipativity across all scenarios.
5.3. Heuristics
In addition to the exact methods discussed above, easy-to-implement heuristics motivated by the properties in Section 4were evaluated. The heuristics exploit the fact that fixing thesequence of patients allows the binary decision variables to befixed. The resulting stochastic linear program is very easy to solve.The proposed heuristics operate in the following way:
Algorithm 1. Heuristics for sequencing and scheduling pro-cedures.
input: Sorting Method: s¼ 1;2;3;4;5;6output: Sequence and arrival schedule for procedures
1 Sort patients i¼ 1;…;n using Sorting Method s2 Fix sequence resulting from Step1 for first stage binary decision
variables o and q3 Solve resulting fixed sequence stochastic linear program using
the L-shaped method
The Sorting Methods in Step 1 are based on two procedureparameters related to uncertainty: procedure duration standarddeviation ðsiÞ and no-show rate ðpiÞ for each procedure i. Sixsorting methods were evaluated and are defined in Table 1.
The sorting methods that use the product of a procedure'sstandard deviation and no-show rate capture both types ofuncertainty in a single parameter. While Sorting Methods 4–6have no intuitive motivation, these pessimistic Sorting Methods areincluded in order to evaluate the impact of the sequencingdecisions.
Table 1Six sorting methods were evaluated using theheuristic algorithm.
Sorting method Resulting sequence
1 Increasing si
2 Increasing pi3 Increasing si � pi4 Decreasing si
5 Decreasing pi6 Decreasing si � pi
B.P. Berg et al. / Computers & Operations Research 50 (2014) 24–37 29

6. Results
In this section we present results based on a series of numericalexperiments. First, we describe how parameters were estimatedfrom historical data for a particular OPC. Next, we present resultsto evaluate sensitivity of optimal decisions to model properties,the value of the stochastic solution, and an analysis of theeffectiveness of the heuristics in Section 5. Finally, we presentresults illustrating sensitivity of optimal booking decisions to costand revenue estimates for a particular OPC.
6.1. Parameter estimation
Data from the Division of Gastroenterology and Hepatology atMayo Clinic in Rochester, MN, were used for parameter estimationand numerical experimentation. The division is made up of over 70faculty providers, conducting procedures ranging from routine color-ectal cancer screenings to more complex cases where the patientrequires procedures for further diagnostic and therapeutic purposesprimarily related to colorectal cancer. Because there is a high varietyof procedures on a given day, any provider may perform multipletypes of procedures, each requiring different amounts of time andhaving different historical no-show rates. The heterogeneous dailypatient demand and operational structure of the practice lend itselfwell as a case study for our model formulation.
Procedure time analysis was performed using 6 months worthof procedure data from January, 2010 through June, 2010 with over10,000 observations covering three GI locations throughout MayoClinic. There were five basic procedures performed at these sites:Colonoscopy, EGD (Esophagogastroduodenoscopy), ERCP (Endo-scopic Retrograde Cholangiopancreatography), EUS (EndoscopicUltrasound) Colonoscopy, and EUS–EGD. Expert Fit 7.0 was usedto fit probability distributions for each procedure type. Visual andnumerical results confirmed very good fits across all procedure
types with Expert Fit providing scores above 90 on a 0–100 scale.Procedure descriptive statistics are presented in Table 2.
We assumed that the cost for patient waiting is the averagehourly wage in the United States, as this is common practice in thehealth services research literature [22]. We defined d as the expectedduration for the n patients. Overtime cost was defined through theratio cl=cw. We consider several choices of cl=cw and we includecl=cw ¼ 33 in our experiments as this represents an estimated ratioprovided by administrators. The parameter cs was set to 0 since thereis no direct cost of idling, and idle time for providers is generallyfilled with administrative, research, and dictation activities. Whilenot presented, we note experiments where csa0 proved to becomputationally easier to solve. Problem instances were generatedfor n¼5 and n¼10 based on the 4–11 procedures being allocated toeach procedure room in the OPC studied.
6.2. Numerical results
Implementation of the methods in Section 5 was done withIBM ILOG Optimization Programming Language using CPLEX 12.2.Experiments were run on a Dell Linux server with 2 Quad-CoreIntel Xeon E5420 2.5 GHz CPUs and 16GB shared RAM. To evaluatecomputational performance of the three methods we propose, weused test cases based on a single provider and procedure roomwhere 55% of procedures are colonoscopies and 45% are EGD's.This scenario is based on a typical day for the endoscopy suite westudied.
For the decomposition-based methods, when a tolerance of 1%was achieved, the algorithm was terminated. A maximum of15,000 CPU seconds was allowed for each instance and theoptimality gap is reported in cases where the problem did notsolve to optimality within the CPU allowance. For the branch andbound implementation, the progressive hedging algorithm wasterminated at 1000 CPU seconds and branch and bound wasallowed a maximum of 15,000 CPU seconds. The upper boundson M1 and M2 in (8) and (9), and symmetry breaking constraints in(10) discussed in Section 5.1 were implemented in these results.
The results presented in Table 3 are based on averages from 10problem instances with 1000 scenarios each. The optimality gap isdefined by the difference between the upper and lower bounds asa percentage of the lower bound. We observed that the solutiontimes and optimality gaps are much better, for each of themethods, for the instances where the overtime to waiting timecost ratio is high (these are likely to be the most realistic scenariosfor OPCs). Furthermore, while each of the three proposed methodsare computationally competitive for smaller instances, only thehybrid multicut method was able to solve the larger problems tothe specified tolerance.
Table 2Parameter were estimated based on historical data from the Division of Gastro-enterology and Hepatology at Mayo Clinic in 2010. The mean, variance, and thedistribution fit for each procedure type is presented along with the no-showprobabilities for each procedure type.
Procedure type Mean Variance Distribution fit No-showprobability
Colonoscopy 30.96 188.57 Weibull 0.18EGD 12.05 58.75 Weibull 0.14ERCP 38.63 598.25 Weibull 0.13EUS colonoscopy 28.38 210.66 Weibull 0.16EUS–EGD 29.59 249.99 Log-logistic 0.24
Table 3Computational results for the classic L-shaped method (L-shaped), hybrid multicut L-shaped method (Multicut), and the progressive hedging primal heuristic method (PH)are presented for instances varying in size and parameter estimates. The minimum, average, and maximum CPU times and average optimality gap, across 10 randomlygenerated instances, are presented for each method.
n cl=cw CPU time (sec) Average gap (%)
L-shaped Multicut PH
Min Avg Max Min Avg Max Min Avg Max L-shaped Multicut PH
5 1 244 315.6 370 114 327.9 429 268 327.1 428 o 1.0 o 1.0 0.010 268 342.7 386 201 331.7 595 285 399.9 630 o 1.0 o 1.0 0.033 228 270.9 324 246 282.7 325 236 326.9 433 o 1.0 o 1.0 0.0
10 1 a a 15k a a 15k a a 15k 83.1 7.2 186.210 a a 15k 9339 10,842.7 13,564 a a 15k 43.8 o 1.0 82.933 a a 15k 6756 7726.9 9786 a a 15k 76.6 o 1.0 32.8
a Some instances reached the limit of 15,000 CPU seconds.
B.P. Berg et al. / Computers & Operations Research 50 (2014) 24–3730

6.2.1. HeuristicsGiven the significant computational challenges posed by this
problem, the heuristic in Algorithm 1 was evaluated for each sortingmethod for n¼5 problem instances where procedure durations wereassumed to be log-normally distributed with a mean of 30 min. Thismean represents the expected duration of the procedures in Table 2and the log-normal distribution has been identified as an appropriatedistribution for procedure durations in similar OPCs [4]. Four testscenarios were generated based on the relationship between proce-dure duration standard deviation and no-show rate in order tomeasure the effects of each parameter on the sequence performance.Procedure duration standard deviation ranged from 6 to 30 min andno-show rates ranged from 5% to 45%. The choice of standarddeviation range represents a significant variety in procedure durationcoefficients of variation (20–100%). While no-show rates for endo-scopy suites have been reported between 13% and 24%, the range wasbroadened for the heuristic experiments in order to have managerialimplications for general outpatient clinic settings where higher no-show rates have been reported. The four test scenarios are detailed in
Table 4. We note that the stochastic linear programs in Step 3 ofAlgorithm 1 were solved to within 1% optimality in less than a minute.
The heuristic was evaluated for each sorting method in Table 1and each test scenario in Table 4 where the ratio cl=cw was set to 1,10, and 33. The results present the average optimality gap for eachscenario and sorting method resulting from the heuristic using 10random seed instances.
In Fig. 1, one graph is presented for each test scenario.In general, the optimality gaps resulting from the heuristicdecrease as overtime estimates increase, illustrating that thesequence becomes less important to minimizing costs as overtimecosts are more highly valued relative to patient waiting costs. Thiscan be seen most clearly in Scenario 3 where optimality gaps forSorting Methods 4–6 decrease from approximately 37% to 2%when overtime estimates increase. However, this trend is lessaccentuated for Sorting Methods 1–3 where the heuristic providessmall optimality gaps. This indicates that the sorting methodsmotivated by the propositions may be generalizable to largerinstances with more diverse patient classes.
Table 4Four test scenarios were used to evaluate the heuristic. Scenarios differ based on the relationship between procedure duration and attendance uncertainties.
Scenario Description Standard deviationfor procedure i¼ 1;…;5 (min)
No-show ratefor procedure i¼ 1;…;5 (%)
1 Constant standard deviation and increasing no-show rate 18, 18, 18, 18, 18 5, 15, 25, 35, 452 Increasing standard deviation and constant no-show rate 6, 12, 18, 24, 30 25, 25, 25, 25, 253 Increasing standard deviation and increasing no-show rate 6, 12, 18, 24, 30 5, 15, 25, 35, 454 Increasing standard deviation and decreasing no-show rate 6, 12, 18, 24, 30 45, 35, 25, 15, 5
1 10 33
Scenario 1
Opt
imal
ity G
ap (%
)
0
10
20
30
40
1 10 33
Scenario 3
cl cw
Opt
imal
ity G
ap (%
)
0
10
20
30
40
1 10 33
Scenario 2
cl cw
Opt
imal
ity G
ap (%
)
0
10
20
30
40
1 10 33
Scenario 4
cl cw
Opt
imal
ity G
ap (%
)
0
10
20
30
40
Sorting Method 1Sorting Method 2Sorting Method 3Sorting Method 4Sorting Method 5Sorting Method 6
cl cw
Fig. 1. The optimality gaps for the four scenarios and six sorting methods are compared for three values of cl=cw .
B.P. Berg et al. / Computers & Operations Research 50 (2014) 24–37 31
The results for Scenario 4 indicate that when procedure durationstandard deviation increases and no-show rates decrease, the sortingmethods are less differentiated due to the two uncertainties “cancel-ing” each other out in a given sequence. However, when procedureduration standard deviation and no-show rates exhibit a nondirectrelationship, sorting by procedure duration standard deviation maytake precedence since Sorting Methods 3 and 5 provided the highestoptimality gaps. In other words, not including procedure durationstandard deviation in the heuristic, and only focusing on no-showrates, resulted in higher optimality gaps.
6.3. Value of the stochastic solution
Table 5 presents the value of the stochastic solution (VSS). VSS isthe difference between the expected costs for using the solution ofthe mean value problem (EEV) and the optimal solution value,Qðon;qn; xnÞ. The VSS results were generated using the multicutmethod since this method tended to have the best solution at thetime of termination in the larger instances. We present the VSS intwo contexts. First is the VSS for the cost portion of our problem. Thisrepresents the traditional interpretation of VSS as it compares theoptimal solution value with that of the mean value problem. We alsopresent the VSS within the context of profit. The VSS for the profitrepresents the improvement in P(n) by using the optimal solutionvalue for C(n) compared to the mean value problem solution.
For the n¼5 instances in Table 5, the VSS for costs range from16.80% to 24.80%. The corresponding VSS for profits are lower,ranging from 0.45% to 14.12%, and are most significant for theinstances where overtime costs are significantly higher thanwaiting costs (14.12% improvements). For the n¼10 instances thatdid not terminate with an optimal solution, the best solution attermination is used. This represents a lower bound on the VSS. It isinteresting to note that for n¼10, and high ratios of cl=cw, the VSSis slightly lower indicating that the value of the stochastic programmay be lower for large problems in which the overtime cost ishigher than the patient waiting time cost. However, the VSS issignificantly higher for n¼10 and cl=cw ¼ 1. In general, Table 5shows that the VSS is high for this problem.
6.4. Sensitivity to no-show probabilities
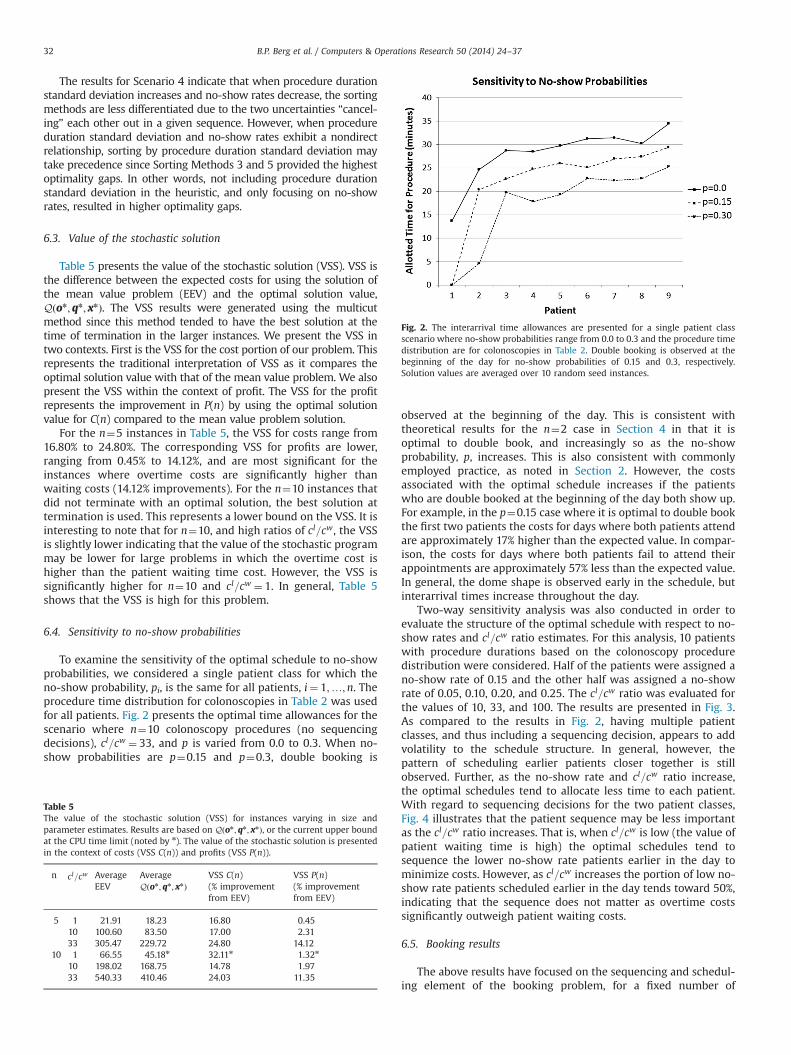
To examine the sensitivity of the optimal schedule to no-showprobabilities, we considered a single patient class for which theno-show probability, pi, is the same for all patients, i¼ 1;…;n. Theprocedure time distribution for colonoscopies in Table 2 was usedfor all patients. Fig. 2 presents the optimal time allowances for thescenario where n¼10 colonoscopy procedures (no sequencingdecisions), cl=cw ¼ 33, and p is varied from 0.0 to 0.3. When no-show probabilities are p¼0.15 and p¼0.3, double booking is
observed at the beginning of the day. This is consistent withtheoretical results for the n¼2 case in Section 4 in that it isoptimal to double book, and increasingly so as the no-showprobability, p, increases. This is also consistent with commonlyemployed practice, as noted in Section 2. However, the costsassociated with the optimal schedule increases if the patientswho are double booked at the beginning of the day both show up.For example, in the p¼0.15 case where it is optimal to double bookthe first two patients the costs for days where both patients attendare approximately 17% higher than the expected value. In compar-ison, the costs for days where both patients fail to attend theirappointments are approximately 57% less than the expected value.In general, the dome shape is observed early in the schedule, butinterarrival times increase throughout the day.
Two-way sensitivity analysis was also conducted in order toevaluate the structure of the optimal schedule with respect to no-show rates and cl=cw ratio estimates. For this analysis, 10 patientswith procedure durations based on the colonoscopy proceduredistribution were considered. Half of the patients were assigned ano-show rate of 0.15 and the other half was assigned a no-showrate of 0.05, 0.10, 0.20, and 0.25. The cl=cw ratio was evaluated forthe values of 10, 33, and 100. The results are presented in Fig. 3.As compared to the results in Fig. 2, having multiple patientclasses, and thus including a sequencing decision, appears to addvolatility to the schedule structure. In general, however, thepattern of scheduling earlier patients closer together is stillobserved. Further, as the no-show rate and cl=cw ratio increase,the optimal schedules tend to allocate less time to each patient.With regard to sequencing decisions for the two patient classes,Fig. 4 illustrates that the patient sequence may be less importantas the cl=cw ratio increases. That is, when cl=cw is low (the value ofpatient waiting time is high) the optimal schedules tend tosequence the lower no-show rate patients earlier in the day tominimize costs. However, as cl=cw increases the portion of low no-show rate patients scheduled earlier in the day tends toward 50%,indicating that the sequence does not matter as overtime costssignificantly outweigh patient waiting costs.
6.5. Booking results
The above results have focused on the sequencing and schedul-ing element of the booking problem, for a fixed number of
Table 5The value of the stochastic solution (VSS) for instances varying in size andparameter estimates. Results are based on Qðon ;qn; xnÞ, or the current upper boundat the CPU time limit (noted by n). The value of the stochastic solution is presentedin the context of costs (VSS C(n)) and profits (VSS P(n)).
n cl=cw AverageEEV
AverageQðon;qn; xnÞ
VSS C(n)(% improvementfrom EEV)
VSS P(n)(% improvementfrom EEV)
5 1 21.91 18.23 16.80 0.4510 100.60 83.50 17.00 2.3133 305.47 229.72 24.80 14.12
10 1 66.55 45.18n 32.11n 1.32n
10 198.02 168.75 14.78 1.9733 540.33 410.46 24.03 11.35
Fig. 2. The interarrival time allowances are presented for a single patient classscenario where no-show probabilities range from 0.0 to 0.3 and the procedure timedistribution are for colonoscopies in Table 2. Double booking is observed at thebeginning of the day for no-show probabilities of 0.15 and 0.3, respectively.Solution values are averaged over 10 random seed instances.
B.P. Berg et al. / Computers & Operations Research 50 (2014) 24–3732

patients. Next, we present results for optimal booking decisions.Recall that the booking decision problem is
maxn
fRðnÞ�CðnÞg:
To find the optimal n we enumerated over the range of feasiblevalues of n. Vargo et al. [38] assumed that 70% of endoscopy suitereimbursements are used to pay the fixed costs of running thesuite, leaving 30% ($201.45) of each colonoscopy performed as theremaining revenue based on CMS (Centers for Medicare & Med-icaid Services) reimbursement rates. Thus, after accounting forfixed costs, as a baseline we assume RðnÞ ¼ $201:45�∑n
i ¼ 1ð1�piÞ.We assume cs¼0 and cl=cw ¼ 33 as previously defined. Procedureduration distributions and no-show probabilities are the same asdefined in the computational experiments of the previous subsec-tions. In light of the fact that reimbursements vary across provi-ders, we assume a fixed cost estimate of 70% as a lower bound andcompare results for 80% and 90% in Fig. 5. We observe that theoptimal number of patients to book decreases as the fixed costsestimate increases. Further, Fig. 5 illustrates a non-smooth trendsurrounding the peaks of the curves. This is explained by the factthat each additional patient that is booked is not necessarily of thesame class as the previous additional patient. For example, whenan additional EGD is added to the booking schedule the resultingincrease in expected costs is less than if an additional colonoscopywere added due to the conoloscopy procedures having longerprocedure durations with higher variance. For each number ofbooked patients in Fig. 5, the case mix was held constant withrespect to the long-run demand case mix.
7. Case study: optimal overbooking for a gastroenterologypractice
A detailed discrete event simulation model of the GI AdvancedPractice at Mayo Clinic in Rochester, MN, was developed and usedto compare booking, sequencing, and scheduling decisions basedon our single server booking model and the actual sequences and
0
10
20
30
1 2 3 4 5 6 7 8 9 10
Patient
Tim
e A
llow
ance
(min
utes
)
OvertimeCost Ratio
10
33
100
5% No−show Rate
0
10
20
30
1 2 3 4 5 6 7 8 9 10
Patient
Tim
e A
llow
ance
(min
utes
)
OvertimeCost Ratio
10
33
100
20% No−show Rate
0
10
20
30
1 2 3 4 5 6 7 8 9 10
Patient
Tim
e A
llow
ance
(min
utes
)
OvertimeCost Ratio
10
33
100
10% No−show Rate
0
10
20
30
1 2 3 4 5 6 7 8 9 10
Patient
Tim
e A
llow
ance
(min
utes
)
OvertimeCost Ratio
10
33
100
25% No−show Rate
Fig. 3. The interarrival time allowances are presented for a two patient classes where no-show probabilities are 0.15 for one class and range from 0.05 to 0.25 for the otherclass, with 5 patients in each class. The procedure time distribution is based on colonoscopies in Table 2. Solutions are averaged over 10 random seed instances.
0.00
0.25
0.50
0.75
1.00
10 33 100
Cost Ratio
Por
tion
of L
ower
No−
Sho
w R
ate
Pat
ient
sS
ched
uled
Ear
ly
VariableNo−Show Rate
5
10
20
25
Schedule Sequence of Low No−Show Rate Patients
Fig. 4. The sequences are presented for a two patient classes where no-showprobabilities are 0.15 for one class and range from 0.05 to 0.25 for the other class,with 5 patients in each class. Being scheduled early is defined by being sequencedin the first half of the schedule.
B.P. Berg et al. / Computers & Operations Research 50 (2014) 24–37 33

schedules employed in practice. The simulation model was devel-oped using Arena 12.0 [23]. The patient flow process in the modelincludes registration, intake, procedure, and recovery. Resourcesinclude registration staff, intake beds, intake nurses, procedurerooms, endoscopists, endoscopes, procedure support staff, recov-ery beds, and recovery nurses. The suite opens at 7 A.M. andovertime was measured according to procedures ending past 12 P.M. or 4 P.M., depending on the procedure type.
Fig. 6 illustrates the overall process, which is similar to otherOPCs described by Berg et al. [4], Gul et al. [18], and Huschka et al.[21]. Intake consists of registering at the front desk, changing intoa procedure gown, and meeting with a nurse who collects patientinformation and explains the procedure. When the patient finishesintake, and a procedure room for their specific procedure isavailable, the patient is taken to the procedure room where theendoscopist joins them and the procedure begins. Following theprocedure the patient is taken to recovery where they will stayuntil they are ready to be discharged.
As in most procedure centers, procedures require specificresources. For example, an EUS–EGD requires use of ultrasoundimaging equipment only available in EUS procedure rooms.Furthermore, each patient is associated with a certain provider.Thus, the process can be approximated as several single servers,where the server is defined by the combination of procedure roomand provider. Shared resources exist, such as intake and recovery,but these are generally much less costly and typically not thebottleneck in the system. Therefore, the proposed booking,sequencing, and scheduling method are applied to each procedureroom separately. The appointment times generated for eachprocedure are then used in the simulation model as the times atwhich the corresponding patients arrive at registration.
The five procedures described in Section 6.1 are each allocatedto one of three types of procedure rooms shown in Fig. 6.Colonoscopies and EGD's are performed in the Complex procedureroom, EUS Colonoscopies and EUS–EGD's are performed in the EUSprocedure rooms, and ERCP's are performed in the ERCP procedureroom. Procedure room, endoscopist, and case mix information forthe suite are summarized in Table 6.
Test instances were generated based on historical appointmentschedules from five different days. Each historical appointmentschedule was simulated to compare (a) actual sequences andschedules used in practice, (b) the corresponding two-stagestochastic program solutions assuming the fixed number ofpatients booked in practice (referred to as the SP solution below),and (c) the optimal booking decision. The actual and SP solutionsboth assume a fixed number of patients according to the instance.The optimal booking decision refers to the optimal number of
Fig. 5. The sensitivity of the expected profit for booking n patients is compared forvarying fixed cost estimates. As the portion of revenue consumed by fixed costsincreases, the optimal number of patient to schedule decreases. 95% confidenceintervals are included.
Fig. 6. Each patient goes through the intake, procedure, and recovery processes in the endoscopy suite. Intake and recovery resources are shared between patients receivingdifferent procedures, but the procedure rooms and providers act as independent single servers.
Table 6Patients are assigned to a procedure room and provider according to the type ofprocedure they will be receiving. Each procedure type has a specified procedureroom and provider. The procedure case mix is based on historical data.
Procedure type Rooms Endoscopists Procedure case mix
ERCP 1 1 100% ERCPEUS 2 2 88% EUS–EGD
12% EUS ColonoscopyComplex 1 1 55% Colonoscopy
45% EGD
B.P. Berg et al. / Computers & Operations Research 50 (2014) 24–3734
patients scheduled, the optimal sequence, and the optimal timeallowances. The optimal number of patients to schedule wasdefined by enumerating the feasible solutions to (1) and usingthe n that resulted in the maximum profit. It is important toremember that in this enumeration process, a stochastic programis solved for the cost component of each n. The stochastic programassociated with each procedure roomwas solved to optimality. Forlarger problems, the CPU budget limit that was used in thecomputational experiments was eliminated. Each appointmentschedule was simulated for 1000 replications using historical datadescribed in Section 6.1 along with historical time stamp data forthe registration, intake, and recovery processes. Procedure roomturn around times were modeled with a triangular distribution of(10, 15, 20 min) based on a subjective estimate from the endoscopysuite director.
Expected patient waiting time and overtime with 95% half-widths are reported in Table 7. The comparison of the actual andSP results are both with respect to the number of patients actuallybooked for each instance. From Table 7, the SP solution resulted inhigher expected patient waiting time (1–10 min) and lowerexpected overtime (7–74 min).
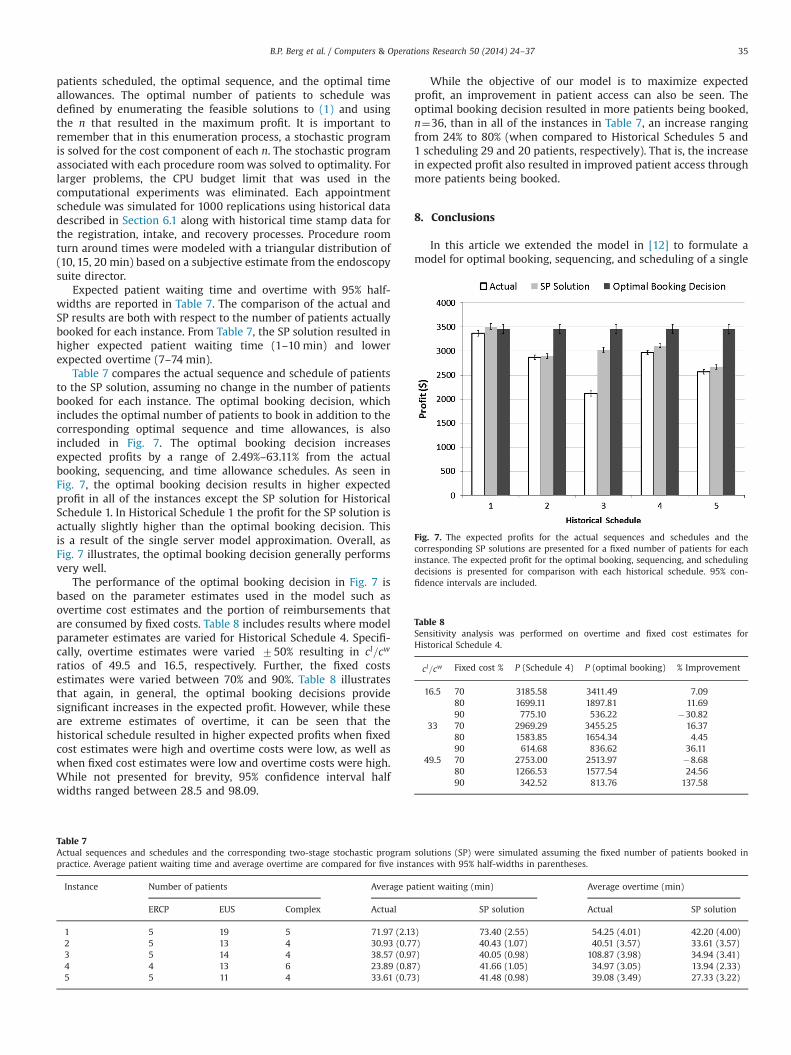
Table 7 compares the actual sequence and schedule of patientsto the SP solution, assuming no change in the number of patientsbooked for each instance. The optimal booking decision, whichincludes the optimal number of patients to book in addition to thecorresponding optimal sequence and time allowances, is alsoincluded in Fig. 7. The optimal booking decision increasesexpected profits by a range of 2.49%–63.11% from the actualbooking, sequencing, and time allowance schedules. As seen inFig. 7, the optimal booking decision results in higher expectedprofit in all of the instances except the SP solution for HistoricalSchedule 1. In Historical Schedule 1 the profit for the SP solution isactually slightly higher than the optimal booking decision. Thisis a result of the single server model approximation. Overall, asFig. 7 illustrates, the optimal booking decision generally performsvery well.
The performance of the optimal booking decision in Fig. 7 isbased on the parameter estimates used in the model such asovertime cost estimates and the portion of reimbursements thatare consumed by fixed costs. Table 8 includes results where modelparameter estimates are varied for Historical Schedule 4. Specifi-cally, overtime estimates were varied 750% resulting in cl=cw
ratios of 49.5 and 16.5, respectively. Further, the fixed costsestimates were varied between 70% and 90%. Table 8 illustratesthat again, in general, the optimal booking decisions providesignificant increases in the expected profit. However, while theseare extreme estimates of overtime, it can be seen that thehistorical schedule resulted in higher expected profits when fixedcost estimates were high and overtime costs were low, as well aswhen fixed cost estimates were low and overtime costs were high.While not presented for brevity, 95% confidence interval halfwidths ranged between 28.5 and 98.09.
While the objective of our model is to maximize expectedprofit, an improvement in patient access can also be seen. Theoptimal booking decision resulted in more patients being booked,n¼36, than in all of the instances in Table 7, an increase rangingfrom 24% to 80% (when compared to Historical Schedules 5 and1 scheduling 29 and 20 patients, respectively). That is, the increasein expected profit also resulted in improved patient access throughmore patients being booked.
8. Conclusions
In this article we extended the model in [12] to formulate amodel for optimal booking, sequencing, and scheduling of a single
Table 7Actual sequences and schedules and the corresponding two-stage stochastic program solutions (SP) were simulated assuming the fixed number of patients booked inpractice. Average patient waiting time and average overtime are compared for five instances with 95% half-widths in parentheses.
Instance Number of patients Average patient waiting (min) Average overtime (min)
ERCP EUS Complex Actual SP solution Actual SP solution
1 5 19 5 71.97 (2.13) 73.40 (2.55) 54.25 (4.01) 42.20 (4.00)2 5 13 4 30.93 (0.77) 40.43 (1.07) 40.51 (3.57) 33.61 (3.57)3 5 14 4 38.57 (0.97) 40.05 (0.98) 108.87 (3.98) 34.94 (3.41)4 4 13 6 23.89 (0.87) 41.66 (1.05) 34.97 (3.05) 13.94 (2.33)5 5 11 4 33.61 (0.73) 41.48 (0.98) 39.08 (3.49) 27.33 (3.22)
Fig. 7. The expected profits for the actual sequences and schedules and thecorresponding SP solutions are presented for a fixed number of patients for eachinstance. The expected profit for the optimal booking, sequencing, and schedulingdecisions is presented for comparison with each historical schedule. 95% con-fidence intervals are included.
Table 8Sensitivity analysis was performed on overtime and fixed cost estimates forHistorical Schedule 4.
cl=cw Fixed cost % P (Schedule 4) P (optimal booking) % Improvement
16.5 70 3185.58 3411.49 7.0980 1699.11 1897.81 11.6990 775.10 536.22 �30.82
33 70 2969.29 3455.25 16.3780 1583.85 1654.34 4.4590 614.68 836.62 36.11
49.5 70 2753.00 2513.97 �8.6880 1266.53 1577.54 24.5690 342.52 813.76 137.58
B.P. Berg et al. / Computers & Operations Research 50 (2014) 24–37 35
stochastic server. We evaluated three alternative solution methodsfor solving the underlying stochastic mixed-integer program. Weprovided analytic insights based on special cases including suffi-cient conditions for the optimal sequence and double booking inthe presence of attendance uncertainty. Computational experi-ments showed that realistic problem instances are very challen-ging to solve. However, the alternative methods presentedprovided tight optimality gaps for problems likely to be encoun-tered in practice. Heuristics motivated by theoretical results andthe computational challenges observed were evaluated and shownto perform well.
Our analysis revealed that optimal sequencing decisions arequite sensitive to both the procedure duration variance and no-show probability. Our theoretical results for special instances, andheuristic analysis, provide supporting evidence that it is optimal tosequence patients with higher procedure duration variance, andhigher no-show probability, later in the sequence during a givenday. For example, in the OPC that we studied, our resultsdemonstrate that is optimal to schedule the EGD and EUS–Colonoscopy procedures at the beginning of the day and schedulethe Colonoscopy and EUS–EGD procedures later. Our numericalresults for larger instances are also consistent with these findings,providing evidence that these findings may generalize to largerproblems. Further, our sensitivity analysis illustrated the impor-tance of solving the stochastic program as optimal sequencesvaried among different problem instances, particularly when theratio of overtime costs to patient waiting costs is low.
Our heuristic analysis illustrated that there are certain caseswhen the easy-to-implement heuristics should be used. Whenovertime costs are significantly greater than patient waiting timecosts, the heuristics resulted in solutions with very small optim-ality gaps. However, the optimality gaps are higher for theheuristic solutions when there is less of a difference betweenpatient waiting time costs and overtime costs, implying that exactsolution methods should be used in these cases. Further, theresults demonstrated that when there is a direct relationshipbetween procedure duration standard deviation and no-show rate,the heuristics provide near optimal solutions. For example, whenprocedures that have high duration standard deviation also havehigh no-show rates, this would be a case to use the heuristics. Onthe other hand, if there is not a clear relationship betweenprocedure duration standard deviation and no-show rate, thenusing exact solutions may be preferable.
Our findings indicate that as the probability of no-showsincreases, it becomes optimal to double book some patients.Double booking is common in practice and our results show thatit is also optimal in some cases where overtime or idling costs arehigh, or no-show probabilities are high, or both. Although the ideaof double booking was alluded to in the literature as early as 1966by [35] in his two-at-a-time policy, we are unaware of theoreticalinsights, such as ours, about the potential optimality of thispractice. In general, we observe the amount of double bookingincreases with no-show probability. The trend of double bookingat the beginning of the day was observed in the structure of theoptimal solutions to the scenarios analyzed. While this rule hasbeen heuristically demonstrated to perform well, we have pro-vided numerical results that show it is optimal in certain cases.Intuitively this means double booking is most appropriate whenthere is a high risk of low utilization resulting from a patient no-show, i.e., when a queue of waiting patients has yet to develop.
Our results show that the optimal number of patients to book issensitive to the fixed costs associated with a particular practice,and decrease as fixed cost estimates increase. Our case studyshows that there may be significant benefits to implementing ourmodel in a realistic multi-server OPC. Based on our experience inworking with many different types of OPCs at several institutions,
this research presents a model and results that can be general-izable to other outpatient procedure settings. The most significantmanagerial insights can be summarized as follows:
� While the benefits of overbooking depend on an OPC's coststructure, overbooking resulted in a 17% increase in profit in themost likely cost scenario, with an increase as high as 137% inexperiments.
� Sequencing patients with high no-show rates or high proce-dure duration variance later in the day results in lower costs ofwaiting, idling, and overtime.
� Double booking is optimal, and increasingly so as no-showprobabilities become high; and in the optimal schedules,double booking at the beginning of the day is observed.
� The optimal number of patients to book depends on fixed costestimates and decreases as fixed costs increase.
There are some limitations to our study that present opportu-nities for future research. First, we assumed that there is anunlimited supply of patient demand for each procedure type.Thus, in some OPCs, there may be additional constraints on thebooking decisions. However, case mix decisions are a result ofmany factors such as patient population demand and appointmentvolume at referring departments and clinics. Second, based on ournumerical experiments we found that the stochastic mixed integerprogram is extremely difficult to solve. Thus, an important direc-tion for future research is the study of new solution methods. It isa generic model that underlies many types of industrial servicesystems. We were able to solve instances up to n¼10 to optimality,which is suitable for most OPCs, which are the focus of this article.However, other types of service systems that pre-schedulepatients, such as lab services, that involve larger numbers ofcustomers, may benefit from additional computational advances.Finally, the model considered here focuses on the single daybooking, sequencing, and scheduling decisions. While incorporat-ing indirect waiting for patients is beyond the scope of thisimmediate work, it is an important component to integrate intofuture models. Similarly, extending this model and its results to adynamic appointment scheduling setting may extend the rele-vance to other service settings where static booking templates areless realistic.
References
[1] Bailey NTJ. A study of queues and appointment systems in hospital out-patientdepartments, with special reference to waiting-times. J R Stat Soc Ser BMethodol 1952;14(2):185–99.
[2] Batun S, Denton BT, Huschka TR, Schaefer AJ. Operating room pooling andparallel surgery processing under uncertainty. INF J Comput 2011;23(2):220.
[3] Begen MA, Queyranne M. Appointment scheduling with discrete randomdurations. Math Oper Res 2011;36(2):240–57.
[4] Berg B, Denton BT, Nelson H, Balasubramanian H, Rahman A, Bailey A, et al.A discrete event simulation model to evaluate operational performance of acolonoscopy suite. Med Decis Mak 2010;30(3):380–7.
[5] Berger JO. Statistical decision theory and Bayesian analysis. New York:Springer-Verlag; 1993.
[6] Birge JR, Louveaux F. Introduction to stochastic programming. New York:Springer; 1997.
[7] Birge JR, Louveaux FV. A multicut algorithm for two-stage stochastic linearprograms. Eur J Oper Res 1988;34(3):384–92.
[8] Bruni ME, Beraldi P, Conforti D. A stochastic programming approach foroperating theatre scheduling under uncertainty. IMA J Manag Math. AdvancedAccess published January 12, 2014. http://dx.doi.org/10.1093/imaman/dpt027.
[9] Cayirli T, Veral E. Outpatient scheduling in health care: a review of literature.Prod Oper Manag 2003;12(4):519–49.
[10] Cayirli T, Yang KK, Quek SA. A Universal Appointment Rule in the Presenceof No‐Shows and Walk‐Ins. Production and Operations Management 2012;21(4):682–97.
[11] Cullen KA, Hall MJ, Golosinskiy A. Ambulatory surgery in the United States,2006. National Health Statistics Reports no. 11; 2009.
B.P. Berg et al. / Computers & Operations Research 50 (2014) 24–3736

[12] Denton BT, Viapiano J, Vogl A. Optimization of surgery sequencing andscheduling decisions under uncertainty. Health Care Manag Sci 2007;10(1):13–24.
[13] Denton BT, Miller AJ, Balasubramanian HJ, Huschka TR. Optimal allocation ofsurgery blocks to operating rooms under uncertainty. Oper Res 2010;58(4-Part-1):802–16.
[14] Dexter F, Ledolter J. Bayesian prediction bounds and comparisons of operatingroom times even for procedures with few or no historic data. Anesthesiology2005;103(6):1259.
[15] Erdogan SA, Denton B. Dynamic appointment scheduling of a stochastic serverwith uncertain demand. INFORMS Journal on Computing 2013;25(1):116–32.
[16] Festinger DS, Lamb RJ, Marlowe DB, Kirby KC. From telephone to office: intakeattendance as a function of appointment delay. Addict Behav 2002;27(1):131–7.
[17] Geraghty MK, Johnson E. Revenue management saves national car rental.Interfaces 1997;27(1):107–27.
[18] Gul S, Denton BT, Fowler JW, Huschka T. Bi-criteria scheduling of surgicalservices for an outpatient procedure center. Prod Oper Manag 2011;20(3):406–17.
[19] Gupta D, Denton BT. Appointment scheduling in health care: challenges andopportunities. IIE Trans 2008;40(9):800–19.
[20] Hassin R, Mendel S. Scheduling arrivals to queues: a single-server model withno-shows. Manag Sci 2008;54(3):565–72.
[21] Huschka TR, Denton BT, Narr BJ, Thompson AC. Using simulation in theimplementation of an outpatient procedure center. In: Winter simulationconference; 2008. p. 1547–52.
[22] Jonas DE, Russell LB, Sandler RS, Chou J, Pignone M. Value of patient timeinvested in the colonoscopy screening process: time requirements for colono-scopy study. Med Decis Mak 2008;28(1):56–65.
[23] Kelton WD, Sadowski RP, Sturrock DT. Simulation with Arena. fourthedition. Boston: McGraw-Hill; 2007.
[24] Kim S, Giachetti RE. A stochastic mathematical appointment overbookingmodel for healthcare providers to improve profits. IEEE Trans Syst Man Cybern—Part A 2006;36(6):1211–9.
[25] Klassen KJ, Rohleder TR. Scheduling outpatient appointments in a dynamicenvironment. J Oper Manag 1996;14(19):83–101.
[26] LaGanga LR, Lawrence SR. Clinic overbooking to improve patient access andincrease provider productivity. Decis Sci 2007;38(2):251–76.
[27] Macharia WM, Leon G, Rowe BH, Stephenson BJ, Haynes RB. An overview ofinterventions to improve compliance with appointment keeping for medicalservices. J Am Med Assoc 1992;267(13):1813–7.
[28] Mancilla Camilo, H Storer Robert. Stochastic sequencing of surgeries for asingle surgeon operating in parallel operating rooms. IIE Trans Healthc SystEng 2013;3(2):127–38.
[29] Muthuraman K, Lawley M. A stochastic overbooking model for outpatientclinical scheduling with no-shows. IIE Trans 2008;40(9):820–37.
[30] Ostrowski J, Linderoth J, Rossi F, Smriglio S. Orbital branching. Math Program2011;126(1):147–78.
[31] Rockafellar RT, Wets RJ-B. Scenarios and policy aggregation in optimizationunder uncertainty. Math Oper Res 1991;16(1):119–47.
[32] Rohleder TR, Klassen KJ. Using client-variance information to improvedynamic appointment scheduling performance. Omega 2000;28(3):293–302.
[33] Rothstein M. Hotel overbooking as a Markovian sequential decision process.Decis Sci 1974;5(3):389–404 ISSN: 1540-5915.
[34] Rothstein M. OR and the airline overbooking problem. Oper Res 1985;33(2):237–248.
[35] Soriano A. Comparison of two scheduling systems. Oper Res 1966;14(3):388–397.
[36] Van Slyke RM, Wets R. L-shaped linear programs with applications to optimalcontrol and stochastic programming. SIAM J Appl Math 1969;17(4):638–63.
[37] Vanden Bosch PM, Dietz DC. Minimizing expected waiting in a medicalappointment system. IIE Trans 2000;32(9):841–8.
[38] Vargo JJ, Bramley T, Meyer K, Nightengale B. Practice efficiency and econom-ics: the case for rapid recovery sedation agents for colonoscopy in a screeningpopulation. J Clin Gastroenterol 2007;41(6):591–8.
[39] Weiss EN. Models for determining estimated start times and case orderings inhospital operating rooms. IIE Trans 1990;22(2):143–50.
[40] Zeng B, Turkcan A, Lin J, Lawley M. Clinic scheduling models with overbookingfor patients with heterogeneous no-show probabilities. Ann Oper Res2010;178(1):121–44.
B.P. Berg et al. / Computers & Operations Research 50 (2014) 24–37 37