computer simulations to predict drug performance to ... · computer simulations to predict drug...
TRANSCRIPT

Computer simulations to predict drug performance to establish
IVIVCRaimar Löbenberg
University of Alberta
Drug Development and Innovation Centre

Outline
• Fundamentals of the BCS• Introduction into Dissolution and
Compendial Methods• The Value of Dissolution –
discussion points• IVIVC overview• Dissolution as predictive tool• Conclusions

Drug Classifications
• MED CHEM– Molecular Architecture, Polarity
• PHARMACOLOGY– Therapeutic Class, Disease
• PHYSICS– Melting Point, Crystal Form

Formulation and PK• Biopharmaceutics has been defined as
the study of the influence of formulation factors on the therapeutic activity of a drug product.
• Pharmacokinetics is the study of thoserate processes involved in the absorption, distribution, metabolism and excretion of drugs.
Differences in BiopharmaceuticsDifferences in Pharmacokinetics
4

How things started…

Fundamental 1
Only what is dissolved can be absorbed

Fundamental 2
Only what is absorbed can be studied in vivo

Solubility directly influences the dissolution behavior of oral dosage forms in gastrointestinal tract
Biopharmaceutical Drug Classification System (BCS)
4/1/2013 8
Class Solubility PermeabilityI High High II Low High III High LowIV Low Low

Biopharmaceutics Classification System
=
S
Water
CV
DDo
Dose NumberA function of solubility of drug substance
D / Vwater >> CS ~ High Do D / Vwater << CS ~ Low Do
SolubilityIssues

Biopharmaceutics Classification SystemDissolution number
Solubilitymg/mL
( )
=
=
DISS
GI
GI
S
TTTC
rDDn
ρ2
3Diffusivity5x10-6 cm2/s
Density1.2 mg/cm3
Particle Radius25 mm
Residence time in GI180 min
Time required forcomplete dissolution

Particle Size and Bioavailability
0123456789
10
0 2 4 6 8
Fine Particle Size + Solubilizer
Fine Particle Size
Medium Particle Size
Croase Powder
<75≈180>250

Biopharmaceutics Classification SystemAbsorption number
( )ABS
GI
GI
eff
TTT
RPAn =
=
Effective permeability
Radius of GI
Residence time in GI
Time required forcomplete absorption

Correlation between Human Permeability and Fraction Dose Absorbed
From: Amidon G.L. et al. Pharm Res 1995 12: 413-20

Digoxin GriseofulvinDose 0.5 500 mgCs 0.024 0.015 mg/mlVsol 20.8 33,333 mlDo 0.08 133 Dn 0.52 0.32
Fraction Dose Absorbed
4/1/2013 14

Three Factors Impact / Limit Bioavailability
Dose Number limited
Dissolution Number limited
Absorption Number limited
Given
Modify
Formulation
Given
Biopharmaceutical Risk Management Tool4/1/2013 15

In vitro: Dissolution Test
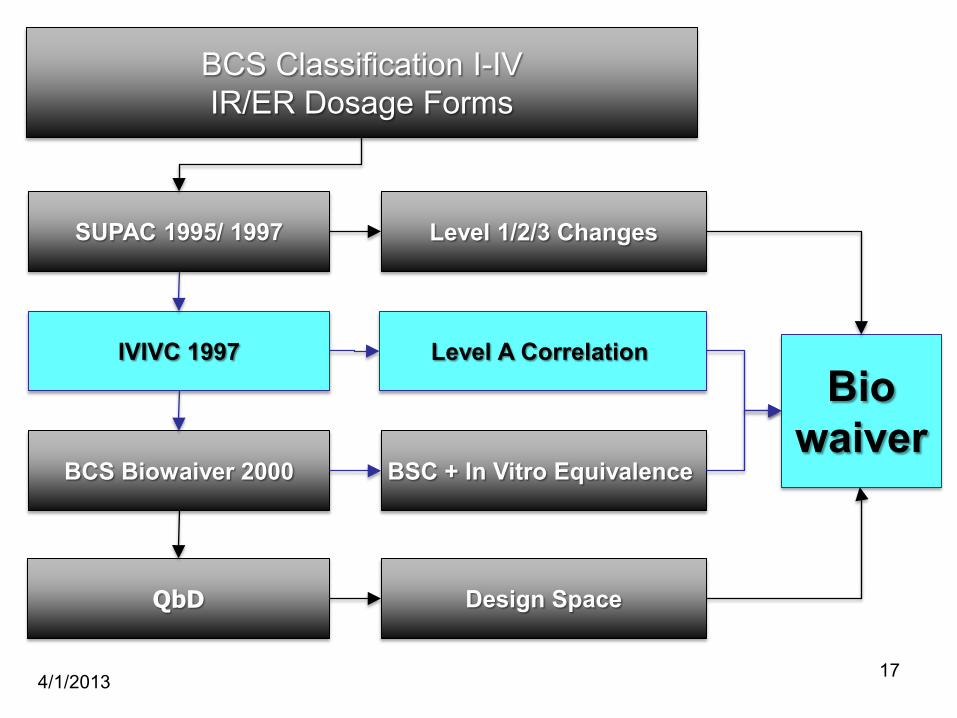
IVIVC 1997Bio
waiver
4/1/2013 17
BCS Classification I-IVIR/ER Dosage Forms
BCS Biowaiver 2000
QbD
SUPAC 1995/ 1997 Level 1/2/3 Changes
Level A Correlation
BSC + In Vitro Equivalence
Design Space
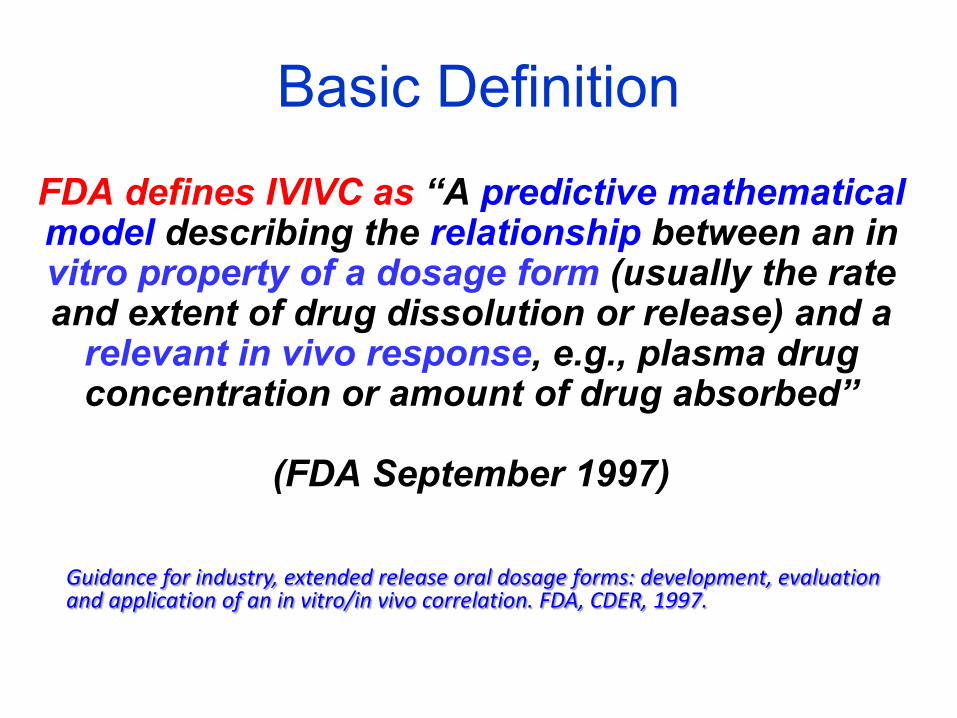
Basic Definition
FDA defines IVIVC as “A predictive mathematical model describing the relationship between an in vitro property of a dosage form (usually the rate and extent of drug dissolution or release) and a
relevant in vivo response, e.g., plasma drug concentration or amount of drug absorbed”
(FDA September 1997)
Guidance for industry, extended release oral dosage forms: development, evaluation and application of an in vitro/in vivo correlation. FDA, CDER, 1997.

Level A• A correlation of this type is generally linear and
represents a point-to-point relationship between in vitro dissolution and the in vivo input rate(e.g., the in vivo dissolution of the drug from the dosage form).
• In a linear correlation, the in vitro dissolution and in vivo input curves may be directly superimposable or may be made to be superimposable by the use of a scaling factor.
• Nonlinear correlations (uncommon) may also be appropriate
• Alternative approaches to developing a Level A IVIVC are possible
• United States Pharmacopoeia. • Guidance for industry, extended release oral dosage forms: development, evaluation and application of an in
vitro/in vivo correlation. FDA, CDER, 1997.

Level A• Whatever the method used to establish a Level A IVIVC,
the model should predict the entire in vivo time coursefrom the in vitro data. In this context, the model refers to the relationship between in vitro dissolution of an Extended Release dosage form and an in vivo responsesuch as plasma drug concentration or amount of drug absorbed.
Drug Development and Industrial Pharmacy, 26(3), 243–251 (2000)
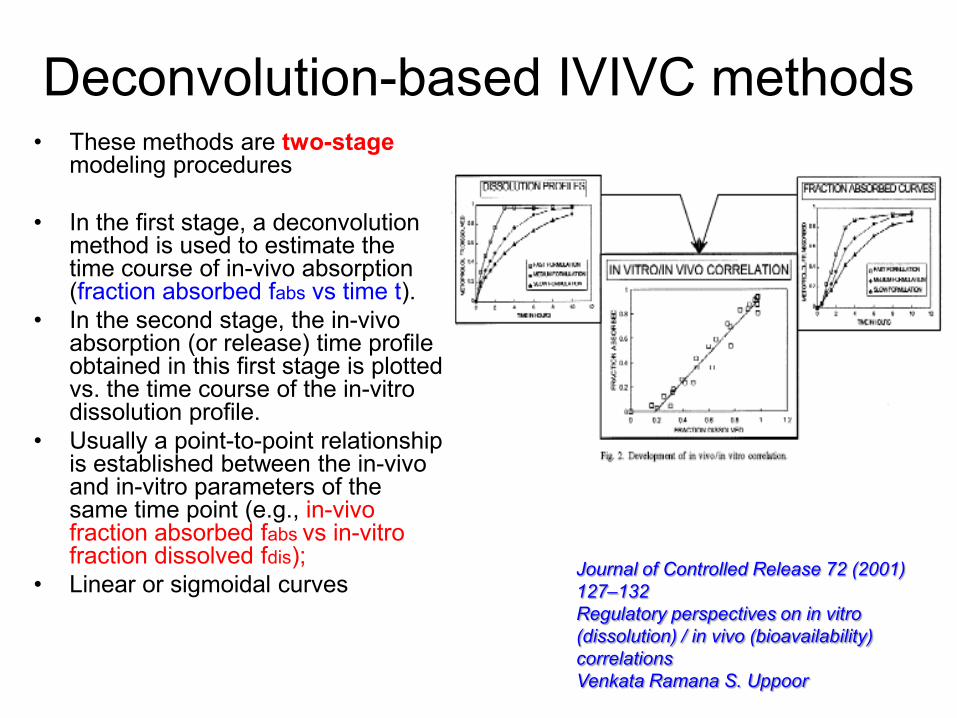
Deconvolution-based IVIVC methods
Journal of Controlled Release 72 (2001) 127–132Regulatory perspectives on in vitro (dissolution) / in vivo (bioavailability) correlationsVenkata Ramana S. Uppoor
• These methods are two-stage modeling procedures
• In the first stage, a deconvolution method is used to estimate the time course of in-vivo absorption (fraction absorbed fabs vs time t).
• In the second stage, the in-vivo absorption (or release) time profile obtained in this first stage is plotted vs. the time course of the in-vitro dissolution profile.
• Usually a point-to-point relationship is established between the in-vivo and in-vitro parameters of the same time point (e.g., in-vivo fraction absorbed fabs vs in-vitro fraction dissolved fdis);
• Linear or sigmoidal curves

Convolution-based IVIVC methods• Convolution-based IVIVC methods are
one-stage modeling approaches, and they directly relate the time course of the in-vivo measured plasma concentration to the time profile of the in-vitro dissolution.
• integral or differential equations
Gillespie 1997; Modi et al 2000; Veng-Pedersen et al 2000; Balan et al 2001; O’Hara et al 2001; Pitsiu et al 2001; Gomeni et al 2002

Computer simulations• In vitro data can be used as input function into
Gastro Plus™ to simulate the absorption profiles of the drugs
• Gastro Plus™ uses a mathematical model called Advanced Compartmental, Absorption and Transit (ACAT), model which is based on the principles of the BCS
• The 3 major data input tabs are:– Compound tab– Physiology tab– Pharmacokinetics tab

GastroPlus Software
• Physicochemical Data as Input
• Dissolution Data as Input
• Permeability

Log P vs. Log D

Example Glyburide
• sulfonylurea with hypoglycemic activity• pKa: 5.3• aqueous solubility: sparingly• log P: 4.79• USP 29: Glyburide• Euglucon N, Daonil, Glycolande
OCH3
Cl
O
NH
SO
O
HN
HN
O

Study Methods
• Powder characterization• Solubility study in different media and BDMs• Dissolution testing• In vitro cell culture tests permeability• Investigate how these in-vitro test methods can
be integrated to establish strong in-vitro/in-vivo correlations using biorelevant in vitro models.
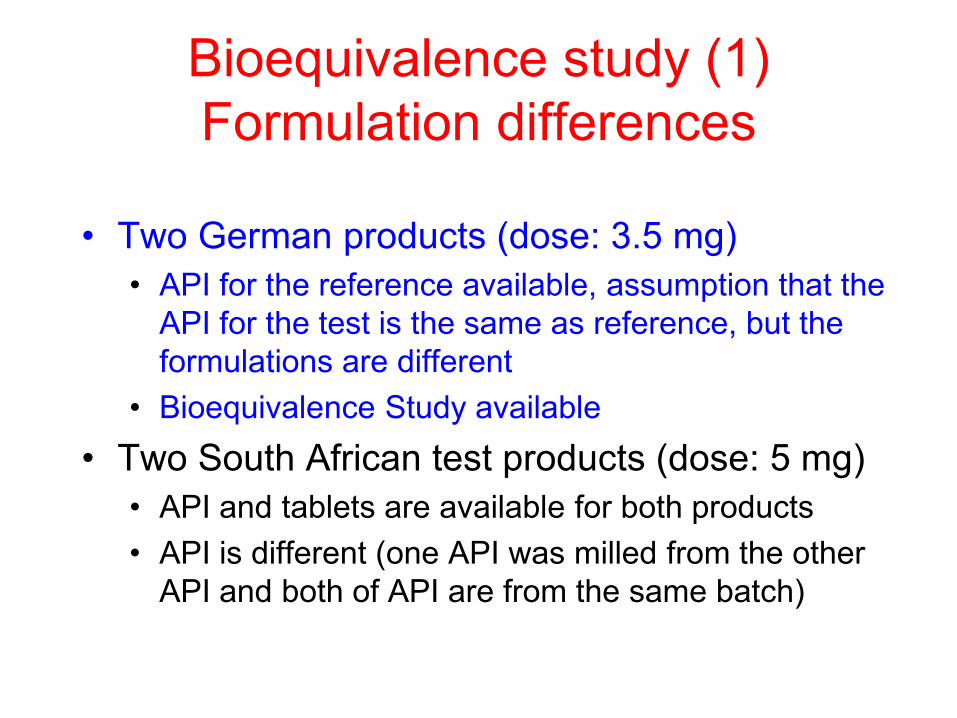
Bioequivalence study (1)Formulation differences
• Two German products (dose: 3.5 mg)• API for the reference available, assumption that the
API for the test is the same as reference, but the formulations are different
• Bioequivalence Study available • Two South African test products (dose: 5 mg)
• API and tablets are available for both products • API is different (one API was milled from the other
API and both of API are from the same batch)
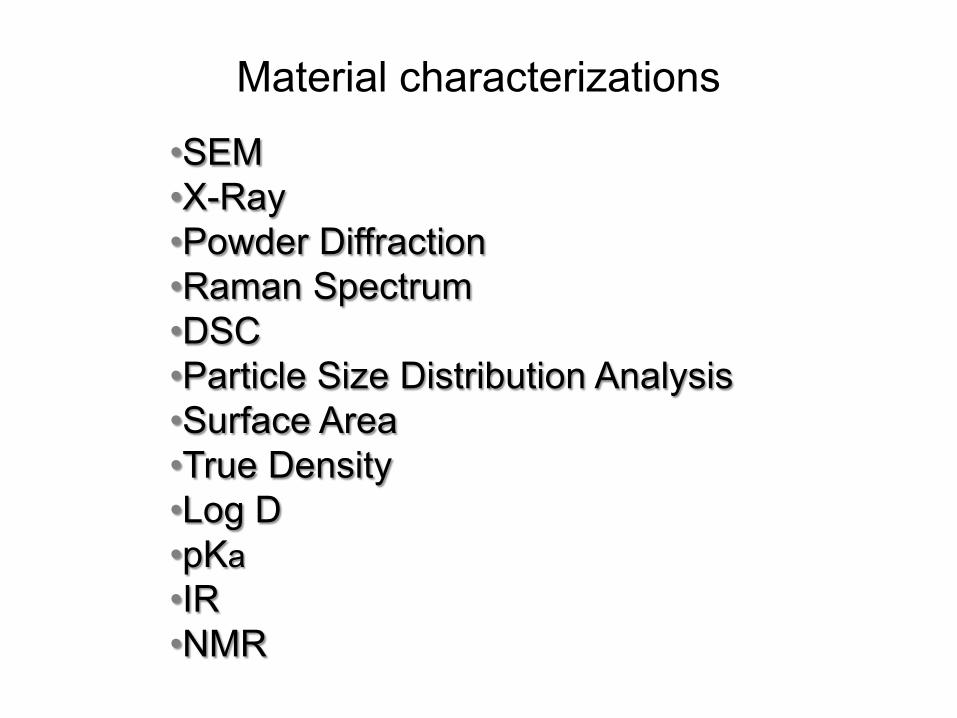
•SEM•X-Ray•Powder Diffraction•Raman Spectrum•DSC•Particle Size Distribution Analysis•Surface Area•True Density •Log D•pKa•IR•NMR
Material characterizations

Material Characterization Results
• No significant difference in crystal formsamong the glyburide powders were observed
• Significant difference in morphology, surface area and particle size were determined

SGF USP 24 SIF USP 24 (pH 6.8)pH 1.2 pH 6.8Pepsin 3.2 g Pankreatin 10.0 gHCl 37% 7.0 mL KH2PO4 6.8 gNaCl 2.0 g NaOH 0.62 gWater ad 1000 mL Water ad 1000 mL
FaSSIF FeSSIFpH 6.5 pH 5.0Na Taurocholate 1.65 g Na Taurocholate 8.25 gLecithine 0.59 g Lecithine 2.95 gNaOH 0.554 g HAc 1M 144 mL KH2PO4 3.9 g KCL 15.2 gKCL 7.7 g Water ad 1000 mLWater ad 1000 mL
Pharamcopeial media
Biorelevant media
Conventional and Biorelevant Dissolution Media

0
10
20
30
40
50
1.7 5 6 6.5 7 7.4
pH
Sol
ubili
ty (u
g/m
L)
Blank-FaSSIFSIFHQLQ
Solubility of Glyburide powder in different media(n=3)
Solubility Study
Low Quality (LQ) High Quality (HQ)
Na Taurocholate Crude 97% (Sigma)
Egg-Lecithin 60% (ICN) 99.1% (Lipoid E PC, Germany)

Observed vs. Simulated Physicochemical Input

4/1/2013 34
The study demonstrates that in silicomethods can assist the formulation scientist
to set meaningful API specifications. Computer simulations could shorten the
drug development process since appropriate bioawaivers, based on data from simulation studies, may be justified.

Drug Description
• pKa = 2.8 and 5.7 Basic and Acetic• logP = 7.01, highly lipophilic• >99% bound to plasma proteins• Oral bioavailability variable 58-70%
(Cheng, et al 1996)

Dose/Solubility RatioDose (mg)4 10
pHSolubility
(mg/mL) Dose/solubility ratioSGF (without
enzymes) 1.2 0.00018 27777.8 55555.6SGF-0.25% SLS 2.0 0.240 16.7 41.7
Acetate Buffer 4.1 0.002 2500.0 5000.0LQ-FeSSIF 5.0 0.030 133.3 333.3HQ-FeSSIF 5.0 0.015 266.7 666.7LQ-FaSSIF 6.5 0.020 200.0 500.0HQ-FaSSIF 6.5 0.205 19.5 48.8LQ-FaSSIF 7.5 3.370 1.2 3.0HQ-FaSSIF 7.5 4.690 0.9 2.1
According to BCS, this drug is a poorly soluble drugSSE Sum of Square Error; RMSE: Root Mean Square Error; MAE: Mean Absolute Error

Dissolution Profiles
0
20
40
60
80
100
0 40 80 120 160 200 240Time (min)
0.25% SLS-H2O FaSSIF-500 mL-100 RPM (n=3)
FaSSIF-900 mL-75 RPM (n=3) FaSSIF-500 mL-75 RPM (n=6)
USP-SIF pH 6.8 (n=3) USP-Phos. Buff pH 6.8 (n==3)
Blank FaSSIF (n=3) Flow Through Cell
% D
isso
lved
1. Fast and complete dissolution in 10 min H2O-0.25% SLS.2. Incomplete dissolution in biorelevant media (89, 77 and 69%) in FaSSIF
500-100 RPM, FaSSIF-900 & FaSSIF-500-75 RPM3. SIF and Phosphate buffer <10%, and insignificant in blank FaSSIF4. Insignificant difference between 500 and 900 mL at 75 RPM

Simulations Results
1. AUC from Flow through, FaSSIF-500 mL-100 RPM, FaSSIF-900 ml, 75 RPM and H2O-0.25% SLS are not significantly different from observed mean value (p>0.05)
2. Cmax from H2O-0.25% SLS is significantly different from observed mean value (p<0.05

Dynamic dissolution testing using the flow through cell seems to be a
powerful tool to establish in vitro/in vivo correlations for poorly soluble
drugs as input function into GastroPlus.

Example Weak Base:Etoricoxib
• pKa = 4.6• logP = 3.1• Oral bioavailability is
100% (Agrawal et al, 2003)

Solubility Study
0.60 0.22 0.28 0.16 0.14 0.14 0.16
13.16
0
2
4
6
8
10
12
14
16
SGF(1.2) AcetateBuffer(4.1)
BlankFeSSIF(5.0)
FeSSIF(5.0) BlankFaSSIF(6.5)
FaSSIF(6.5) SIF(6.8) PhosphateBuffer(6.8)
Media and pH
So
lub
ility
(mg
/mL
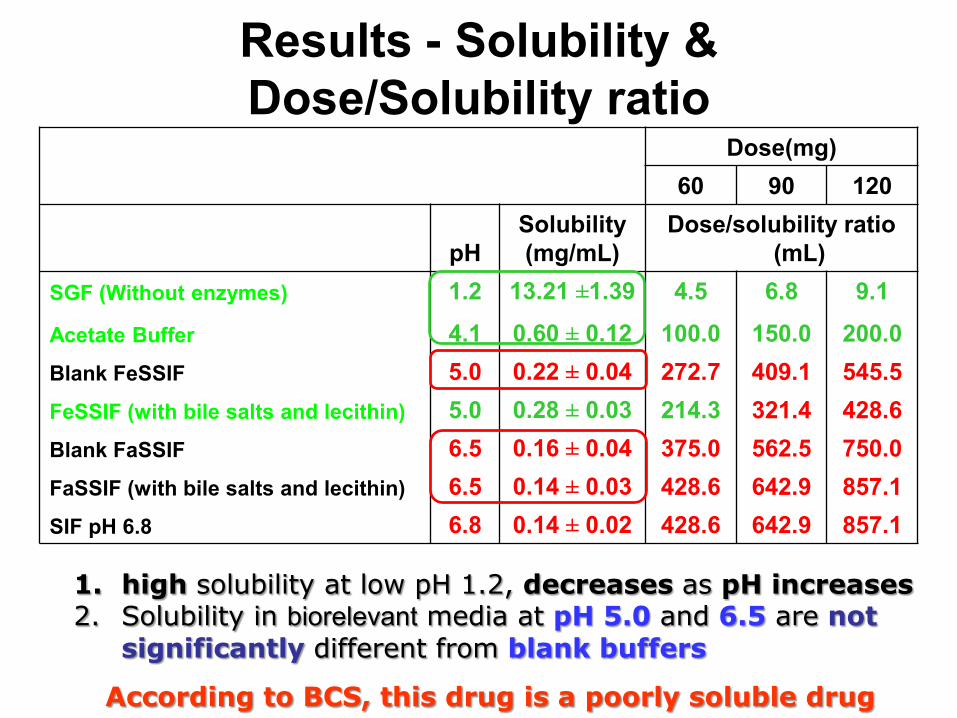
Results - Solubility & Dose/Solubility ratio
Dose(mg)60 90 120
pHSolubility(mg/mL)
Dose/solubility ratio (mL)
SGF (Without enzymes) 1.2 13.21 ±1.39 4.5 6.8 9.1
Acetate Buffer 4.1 0.60 ± 0.12 100.0 150.0 200.0Blank FeSSIF 5.0 0.22 ± 0.04 272.7 409.1 545.5FeSSIF (with bile salts and lecithin) 5.0 0.28 ± 0.03 214.3 321.4 428.6Blank FaSSIF 6.5 0.16 ± 0.04 375.0 562.5 750.0FaSSIF (with bile salts and lecithin) 6.5 0.14 ± 0.03 428.6 642.9 857.1SIF pH 6.8 6.8 0.14 ± 0.02 428.6 642.9 857.1
According to BCS, this drug is a poorly soluble drug
1. high solubility at low pH 1.2, decreases as pH increases2. Solubility in biorelevant media at pH 5.0 and 6.5 are not
significantly different from blank buffers

Flow-through protocol (Alberta Apparatus 4)
Designed to simulate passage of a drug through the GIT1-SGF-SLS(0.25%) for 15 min2-Biorelevant media pH 6.5 for 75 min3-Biorelevant media pH 7.5 for 60 min4-Biorelevant media, pH 5.0 for 30 min5-Entire fluid flow per sampling interval collected 6-A sample was taken and analyzed Test time 180 min

Summary: Dissolution Profiles
0
20
40
60
80
100
0 15 30 45 60 75 90
Flow through
FaSSIF-900 mL
USP-SIF-900 mL
FaSSIF - 500 mL
0.01 M HCL
Time (min)
% D
isso
lved
0.01 M HCl in the USP-2 100% in 5 minFlow through, 94%FaSSIF-900 mL, 91% -solubilizing effect of bile salts & lecithinSIF 84% - poor wettingFaSSIF-500 mL, 79% - non-sink conditions

Investigating possible in vivo precipitation using a transfer model
0.00
0.05
0.10
0.15
0.20
0.25
0 20 40 60 80 100 120
Theo. Conc-2.2 mL/min
Actual Conc 2.2 mL/min- FaSSIF
Actual-SIF-2.2 mL/min
Theoret-4.8 mL/min
Actual Conc-4.8 mL/min
1. The drug stays solubilized when added as a solution2. A concentration higher than predicted from equilibrium solubility is
attained, without precipitation for 2 h.
1. 120 mg of Drug A was dissolved in 120 mL of SGF, then pumped into 500 mLbiorelevant or SIF in a dissolution vessel.
2. Possible precipitation was monitored via conc-time measurement.
0.14 mg/mL

Simulations results
1. All AUC are not significantly different from observed (p>0.05)2. Cmax FaSSIF-500 mL and SIF are significantly different from observed
(p<0.05
0
0.2
0.4
0.6
0.8
1
1.2
0 20 40 60 80 100 120
T ime (h)
F low-through F aS S IF -900 mL
US P -S IF F aS S IF -500 mL
Observed 0.1 M HC L
Pla
sma
Co
nc.
(u
g/m
L)

IVIVC Statistics
Statistically: SSE Sum of Square Error; RMSE: Root Mean Square Error; MAE: Mean Absolute Error
• Solution model, Flow through cell, FaSSIF-900 mL and 0.01 M HCL are Similar.
• USP-SIF and FaSSIF 500 mL- poor correlation
Medium/Method r2 SSE RMSE MAE
As Solution 0.900 0.193 0.101 0.054
Flow through cells 0.900 0.195 0.101 0.054
FaSSIF-900mL 0.899 0.195 0.101 0.058
0.01 M HCL 0.898 0.197 0.102 0.054
USP-SIF 0.676 0.613 0.180 0.093
FaSSIF-500 mL 0.593 0.820 0.208 0.114

In vitro results combined with in silicosimulations using GastroPlus support
scientifically that a biowaiver for immediate release etoricoxib solid oral
dosage forms is justified.

Conclusions• BCS allows us to ask the right questions to find the
solutions in drug development and dissolution method development
• The BCS has changed the way we look at drugs and the drug development process
• IVIVC can be established using biorelevant Dissolution methods
• Software can assist to establish IVIVIC • The BCS has made dissolution testing more meaningful
4/1/2013 49

Acknowledgements
AACP Faculty of Pharmacy University of Alberta SimulationsPlus NSERC Merck Frosst
Prof. Dr. Amidon Prof. Kanfer Dr. Hai Wei Dr. DiMaso