computational fluid dynamics simulations of small...
TRANSCRIPT

TRANSACTIONS OF THE INSTITUTE OF FLUID-FLOW MACHINERY
No. 123, 2011, 71–84
MACIEJ KANIECKI1∗, ZBIGNIEW KRZEMIANOWSKI1 and MARZENA BANASZEK2
Computational fluid dynamics simulationsof small capacity Kaplan turbines
1 The Szewalski Institute of Fluid-Flow Machinery of the Polish Academyof Sciences, Hydraulic Machinery Department, Fiszera 14, 80-231Gdańsk, Poland
2 Gdansk University of Technology Faculty of Mechanical EngineeringNarutowicza 11/12 80-233 Gdańsk, Poland
AbstractIn the presented paper authors focused on numerical analysis of the flow through selected con-structions of Kaplan and semi-Kaplan machines. The paper contains three computation exam-ples; each of them concentrates on different aspects of computational fluid dynamics (CFD) uti-lization. The numerical tests of various turbulent models for Kaplan turbine CFD applications,numerical determination of the cam curve characteristic and numerical analysis of operatingparameters of the semi-Kaplan machine have been presented. The methodology of the imple-mented numerical computations and final results of calculations have been discussed in each ofthe presented study cases.
Keywords: Hydraulic Kaplan turbine; CFD simulations; Determination of operating parame-ters; Cam curve characteristic; Hill diagram
1 Introduction
In the recent decade computational fluid dynamics (CFD) technique achieved highlevel of reliability and occurred a practical tool for operating behaviour determina-tion of different types of fluid-flow machinery. With properly defined calculations
∗Corresponding author. E-mail address: [email protected]
72 M. Kaniecki, Z. Krzemianowski and M. Banaszek
domain (i.e. precise representation of geometry, fine grid constructing, appropri-ate computation model and correct definition of boundary conditions) the CFDsimulations seem to be very reasonable both with their qualitative and quantita-tive results. In respect to hydraulic turbines, the computational methods enablesupporting the design processes of the flow systems and determining the operatingconditions with large and small scale flow phenomena. The Institute of Fluid-FlowMachinery of the Polish Academy of Sciences has some experiences in performingCFD simulations of the flow through flow systems of hydraulic turbines.
In the presented paper authors focused on numerical analysis of the flowthrough selected constructions of Kaplan and semi-Kaplan machines. As it wasmentioned above, the paper contains three computation examples of differentaspects of CFD utilization. Started with the first example, authors compared nu-merical calculations with the test results of the model Kaplan turbine. The testswere carried out on the model test rig located at the Gdansk University of Tech-nology. For the optimal operating point, the numerical analysis was conductedfor a series of different turbulence models. Authors observed that the final re-sults of determination of global operating parameters were significantly sensitiveto the applied turbulence model. In the second example, the methodology of theKaplan cam curve determination by means of CFD has been presented with thegreat focus to the local phenomena of the flow and global operating parametersof the turbine. The last example is dedicated to calculations of the operatingparameters of the model semi-Kaplan turbine, which has been developed fromfirst principle in the Institute. Final results of the CFD simulations for newlydesigned semi-Kaplan turbine have been presented.
2 Numerical modelling of the flow through the modelKaplan turbine
2.1 Motivation and brief characteristic of the computational model
The primary aim of present investigation was the numerical analysis of an existingmodel Kaplan turbine with adjustable position of the blade system (Fig. 1). Theturbine under consideration is mounted on a test stand at the Fluid Mechanics andTurbomachinery Center of Gdansk University of Technology Faculty of Mechan-ical Engineering, and has been thoroughly experimentally investigated, resultingin the identification of optimum setting combination of the guide vanes and therunner blades. This experimentally determined efficiency-optimal work point hasbeen taken as the basis for numerical modeling. Computational fluid dynamicsis well established in the analysis of turbomachinery flows for over 20 years. Theliterature, however, enumerates computational results using commercial solvers

Computational fluid dynamics simulations. . . 73
Figure 1. Schematic view of the flow system of investigated model turbine.
with arbitrarily chosen turbulence models, typically selected on the basis of userexperience. It should be noted that there is no single, universally applicable tur-bulence model; its appropriate selection for a specific computational case rests onthe expert judgment. As the authors had at their disposal accurate and compre-hensive experimental results, it was decided to deliberately carry out computationemploying a broad range of turbulence models with variants. The following mod-els were employed [5]: one-dimensional Spallart-Almaras, two dimensional k-ε andk-ω models. For the k-ε model the analysis has been carried out for assorted vari-ants of the model, distinguished by various methods of boundary layer modeling(standard, nonequilibrium, enhanced) and by different viscosity models (algebraicor differential). Altogether twelve numerical variants were used, and the varyingresults were checked against the experimental standard. Numerical analysis wascarried out using the ANSYS/Fluent [7] commercial solver, a popular choice fornumerous technical applications. The fundamental geometrical and operatingparameters of the tested model turbine are presented in Tab. 1.
The computational mesh for the given geometry (Fig. 1) was prepared in twostages. At the first stage, the mesh for the rotor and for the stators was pre-pared using the Numeca AutoGrid [9] tool. After transferring the fragmentarymesh to Gambit [8], the mesh was completed by meshing the draft tube and theoffset inlet. The complete mesh consists of over 7 million elements. The meshconsists entirely of hexahedral elements, and was structured to achieve values ofthe nondimensionless wall distance (y+) in the range 1 to 3 [5]. The computationhas been carried out with the aid of the Fluent solver included in the ANSYS 12.1[7] package, with the additional assumption of stationary flow and using a secondorder discretization scheme. Carried out in double precision, the computation
74 M. Kaniecki, Z. Krzemianowski and M. Banaszek
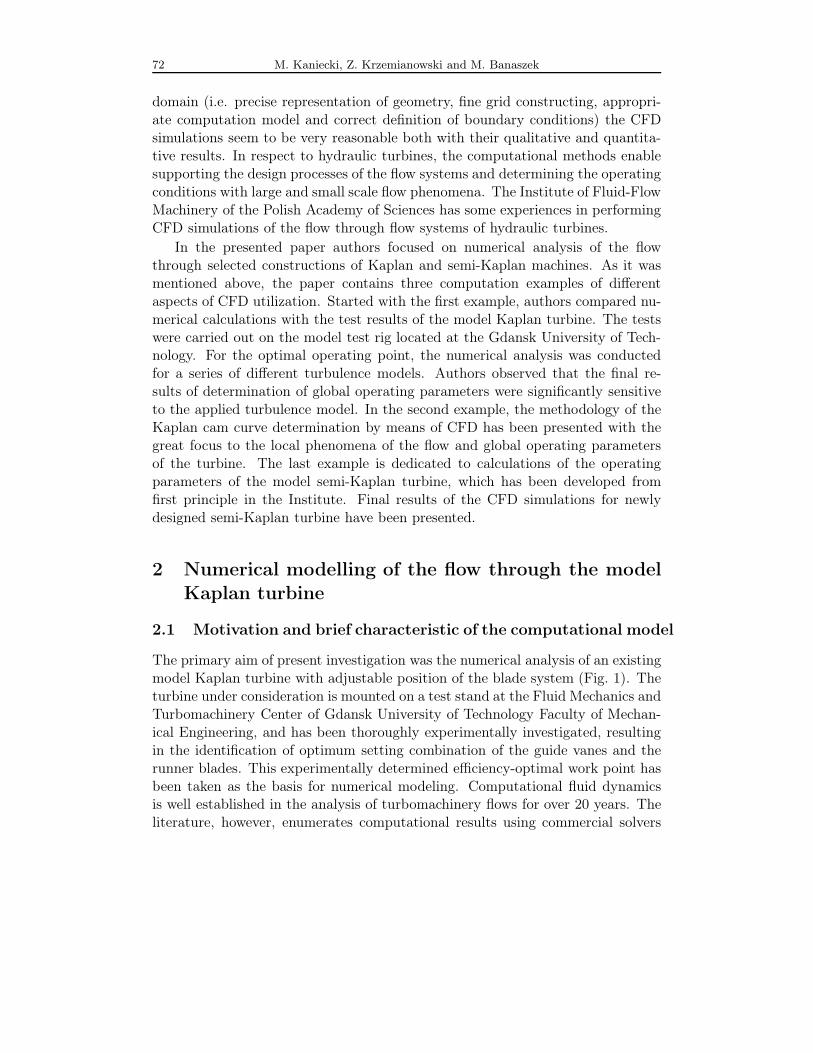
Table 1. Fundamental geometrical and operating parameters of the model turbine.
Nett head Hnet [m] 2.725Discharge Q [m3/s] 0.074
Rotational speed n [rpm] 650Power output P [kW] 1.7
Runner diameter D [m] 0.25Number of runner blades 6Number of guide vanes 12Number of stator vanes 6
required the order of 2×10⁴ iterations. As noted in the introduction, the compu-tations were carried out using several turbulence models for comparison. Threefundamental turbulence models were used: namely the one-dimensional Spallart-Almaras, two dimensional k-ε and two-dimensional k-ω model.
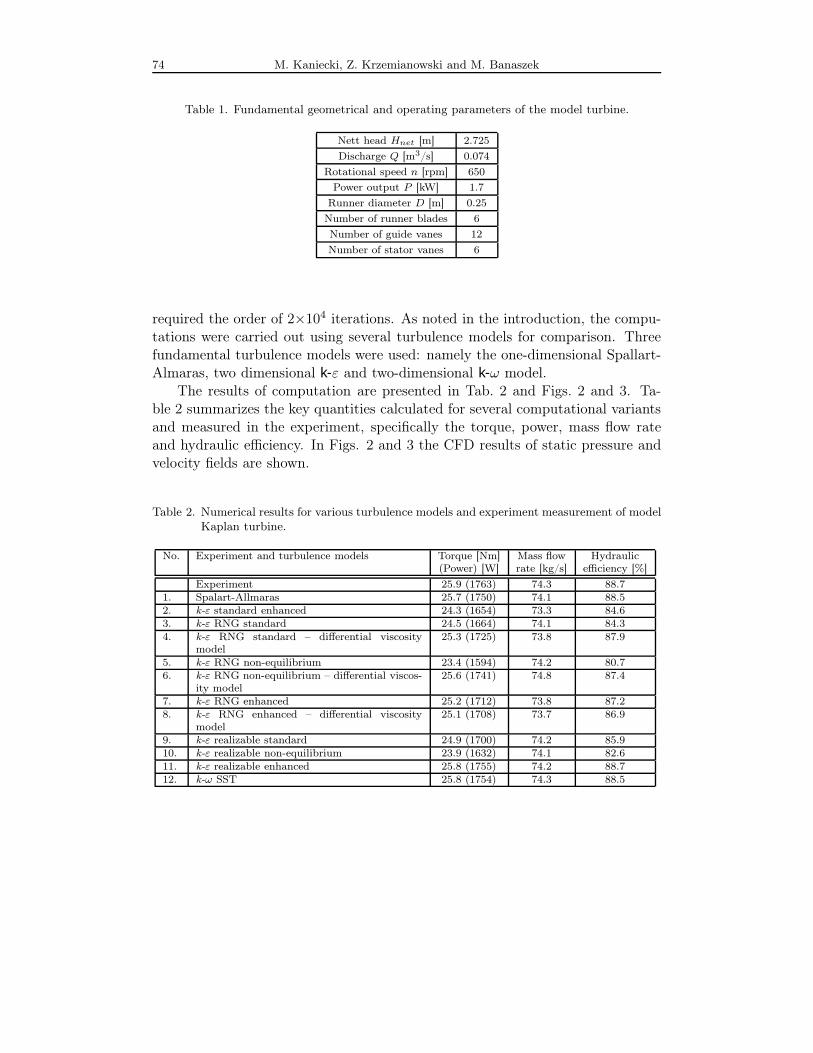
The results of computation are presented in Tab. 2 and Figs. 2 and 3. Ta-ble 2 summarizes the key quantities calculated for several computational variantsand measured in the experiment, specifically the torque, power, mass flow rateand hydraulic efficiency. In Figs. 2 and 3 the CFD results of static pressure andvelocity fields are shown.
Table 2. Numerical results for various turbulence models and experiment measurement of modelKaplan turbine.
No. Experiment and turbulence models Torque [Nm] Mass flow Hydraulic(Power) [W] rate [kg/s] efficiency [%]
Experiment 25.9 (1763) 74.3 88.71. Spalart-Allmaras 25.7 (1750) 74.1 88.52. k-ε standard enhanced 24.3 (1654) 73.3 84.63. k-ε RNG standard 24.5 (1664) 74.1 84.34. k-ε RNG standard – differential viscosity
model25.3 (1725) 73.8 87.9
5. k-ε RNG non-equilibrium 23.4 (1594) 74.2 80.76. k-ε RNG non-equilibrium – differential viscos-
ity model25.6 (1741) 74.8 87.4
7. k-ε RNG enhanced 25.2 (1712) 73.8 87.28. k-ε RNG enhanced – differential viscosity
model25.1 (1708) 73.7 86.9
9. k-ε realizable standard 24.9 (1700) 74.2 85.910. k-ε realizable non-equilibrium 23.9 (1632) 74.1 82.611. k-ε realizable enhanced 25.8 (1755) 74.2 88.712. k-ω SST 25.8 (1754) 74.3 88.5

Computational fluid dynamics simulations. . . 75
Figure 2. Distribution of the static pressure on the run-ner surfaces.
Figure 3. Distribution ofthe axial velocityin the turbineflow system.
2.2 Conclusions
The computation has brought to light significant and expected discrepancies be-tween the obtained values for flow efficiency yielded by the disparate methods ofturbulence modeling. The highest degree of consistency, and hence the closest toexperimental validation, has been returned by the k-ε realizable enhanced model(88.7%), closely followed by the results accomplished using the k-ω SST model(88.5%) and final being the Spalart-Allmaras model (88.5%), the experimentalreference value being 88.7%. The worst performer in this regard has been thek-ε RNG non-equilibrium model (80.7%). Analyzing the differences in individualquantities impacting efficiency leads to the conclusion that the largest disparity isdue to differences in computed and measured torque on the turbine shaft. All thecomputed variants yielded values of the torque significantly lower than the valueactually measured. The discrepancies between predicted and measured values ofmass flow rate resulted in a similar, but smaller effect.

76 M. Kaniecki, Z. Krzemianowski and M. Banaszek
3 Determination of the cam curve characteristic byCFD applications
3.1 Methodology of CFD cam curve determination
Crucial advantage of the double regulation Kaplan turbine is the ability of oper-ating with relatively high efficiency in the broad range of loading. To achieve ahigh efficiency Kaplan turbine performance the optimization research of relativeposition of the runner blades and guide vanes are necessary [2,4]. As the finalresult of the research the cam curve characteristic for the specific Kaplan turbineis determined. Practically the optimisation research should be carried out forevery new installation at the hydropower plant. Unfortunately the costs of suchactivities are really high, especially for small hydro installations. Due to limitedfinancial abilities, small hydro power companies and manufactures are interestedin cost reduction, which is realized among others by virtual calculations of the camcurve characteristics for low capacity hydraulic turbines. The concerned company,which decides to apply the CFD for optimisation process of the Kaplan turbineoperation, should be aware of the limited accuracy of such approach. The crucialdiscrepancies between CFD analyses and real test results can be generated bothby simplifications of real conditions and numerical errors of utilized model. TheSzewalski Institute of Fluid-Flow Machinery has some experience in such kindof CFD applications speciallyt developed for small hydropower companies. Thepresented example shows the application of CFD using the finite volume methodfor determination of the operating conditions and cam curve characteristics of lowhead bulb turbine. The main parameters and the draft of the flow system of thetested turbine are presented in Tab. 3 and Fig. 4.
Table 3. Main geometrical and operating parameters of tested turbine.
Nett head Hnet [m] 3.0
Discharge Q [m3/s] 3.54
Rotational speed n [rpm] 305
Power output P [kW] 93
Rotor diameter D [m] 1.09
Number of runner blades 3
Number of guide vanes 16
The methodology of the numerical cam curve determination is practicallysimilar to the real conditions research. For a constant value of rotational speedand the nett head the specific runner blade angle β1 is determined. For thecase of a single runner blade position considered were five to six guide vanes

Computational fluid dynamics simulations. . . 77
Figure 4. Draft of the flow system of the tested bulb turbine.
Figure 5. The envelope curve (–) and the propeller curves (�) for determined rotational speedn = 305 [rpm] of bulb turbine.
opening β2. At every relative positions of blade system of the turbine the CFDcalculations are carried out to determine operating parameters of the turbine. InFig. 5 the exemplary characteristics of the hydraulic efficiency via discharge factorQred (reduced for Hnet = 3 [m]) is presented. The characteristic was prepared fora given rotational speed of the runner and the net head. The successive operatingpoints are the results of the conducted CFD computations. The envelope throughthe best efficiency points at every propeller curve has been drawn. Basing on that

78 M. Kaniecki, Z. Krzemianowski and M. Banaszek
envelope curve the cam curve has been finally determined which is the relationbetween the runner blade angle and guide vanes angle for the best efficiency points(Fig. 6).
Figure 6. The cam curve characteristic for a given rotational speed of bulb turbine.
3.2 Computational model
The numerical calculation of liquid flow throughout the flow system of the pre-sented bulb turbine has been carried out using the Numeca/Fine [9] and ANSYS[7] commercial software. The main purpose of numerical calculations was to de-termine the operating parameters for a wide range of performance. Every singlecalculation process was realized to specify the relative position of turbine bladesystem. The calculated global values of operating parameters were marked on thespecified propeller curve. The entire geometry has been divided into three blocks— inlet pipe, blade system and the draft tube — connected with the interfaces.Finally, the structured grid was applied in the whole area of calculation domain.In the blade system block, the structure of the grid was the O-shape with thegradation of the elements thickness near the walls. The value of dimensionless y+
was approximately defined using the empirical formula (the calculated value of y+
was close to 2). The programme solves the governing integral equations for theconservation of mass and momentum for the steady state flow. The turbulenceflow has been taken into account by application of the turbulence k-ε realizableenhanced model. In Figs. 7 and 8 a few screen shots of the grid structure andobtained results have been presented.

Computational fluid dynamics simulations. . . 79
Figure 7. Grid structure on the chosen elements of the turbine flow system.
Figure 8. Distribution of the static pressure and streamlines for optimal operating pointW19K67, n = 305 rpm.
3.3 Conclusions
Basing on the CFD calculations the optimal positions of the Kaplan blades sys-tem can be obtained with relatively fine accuracy for a wide range of applications.As it was notified above the precise representation of the flow system geometryand properly constructed CFD model (fine grid with appropriate y+ value, ap-propriate turbulent model, second order discretization scheme with at least 104
iterations per process) have a significant effect on numerical results. For smallhydro applications the of CFD based determination of the cam curve is reasonableand economically profitable.
4 Calculations of the operating characteristic of themodel semi-Kaplan turbine
During the last thirty years the Szewalski Institute of Fluid-Flow Machineryconducted some experimental and theoretical activities on the development ofhydraulic turbines designed for small hydro power applications. Currently, thesemi-Kaplan low head model turbine has been realized under the granted govern-
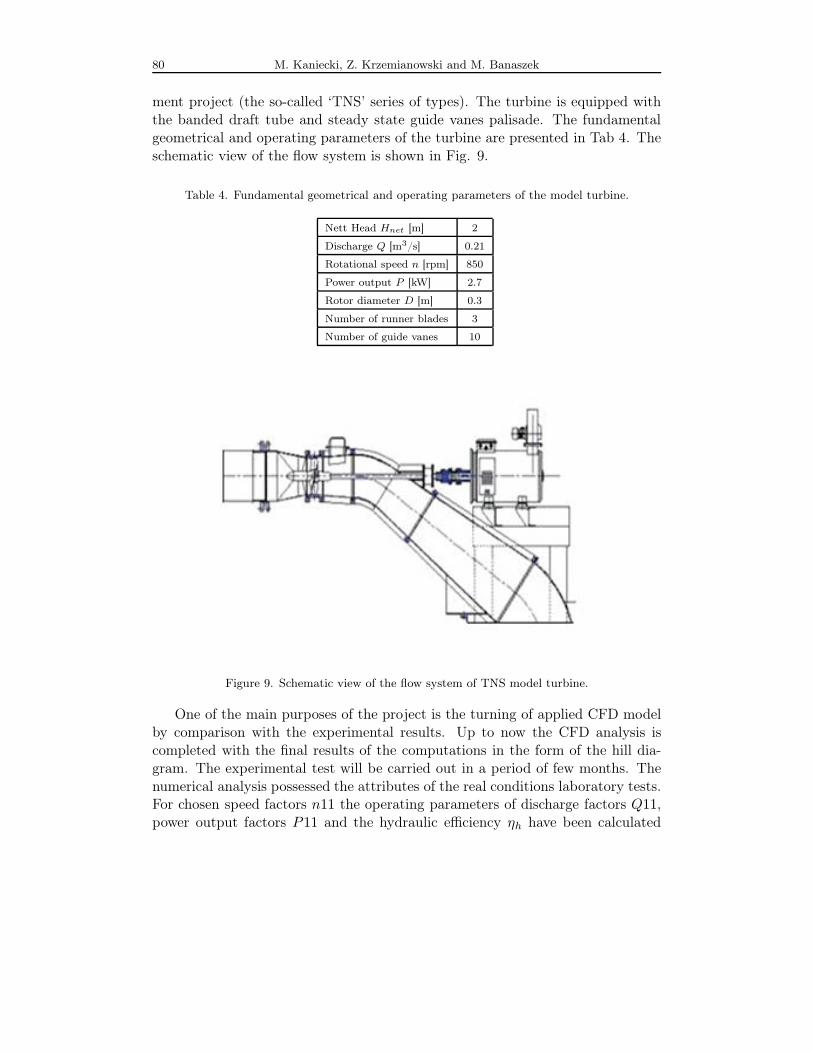
80 M. Kaniecki, Z. Krzemianowski and M. Banaszek
ment project (the so-called ‘TNS’ series of types). The turbine is equipped withthe banded draft tube and steady state guide vanes palisade. The fundamentalgeometrical and operating parameters of the turbine are presented in Tab 4. Theschematic view of the flow system is shown in Fig. 9.
Table 4. Fundamental geometrical and operating parameters of the model turbine.
Nett Head Hnet [m] 2
Discharge Q [m3/s] 0.21
Rotational speed n [rpm] 850
Power output P [kW] 2.7
Rotor diameter D [m] 0.3
Number of runner blades 3
Number of guide vanes 10
Figure 9. Schematic view of the flow system of TNS model turbine.
One of the main purposes of the project is the turning of applied CFD modelby comparison with the experimental results. Up to now the CFD analysis iscompleted with the final results of the computations in the form of the hill dia-gram. The experimental test will be carried out in a period of few months. Thenumerical analysis possessed the attributes of the real conditions laboratory tests.For chosen speed factors n11 the operating parameters of discharge factors Q11,power output factors P11 and the hydraulic efficiency ηh have been calculated

Computational fluid dynamics simulations. . . 81
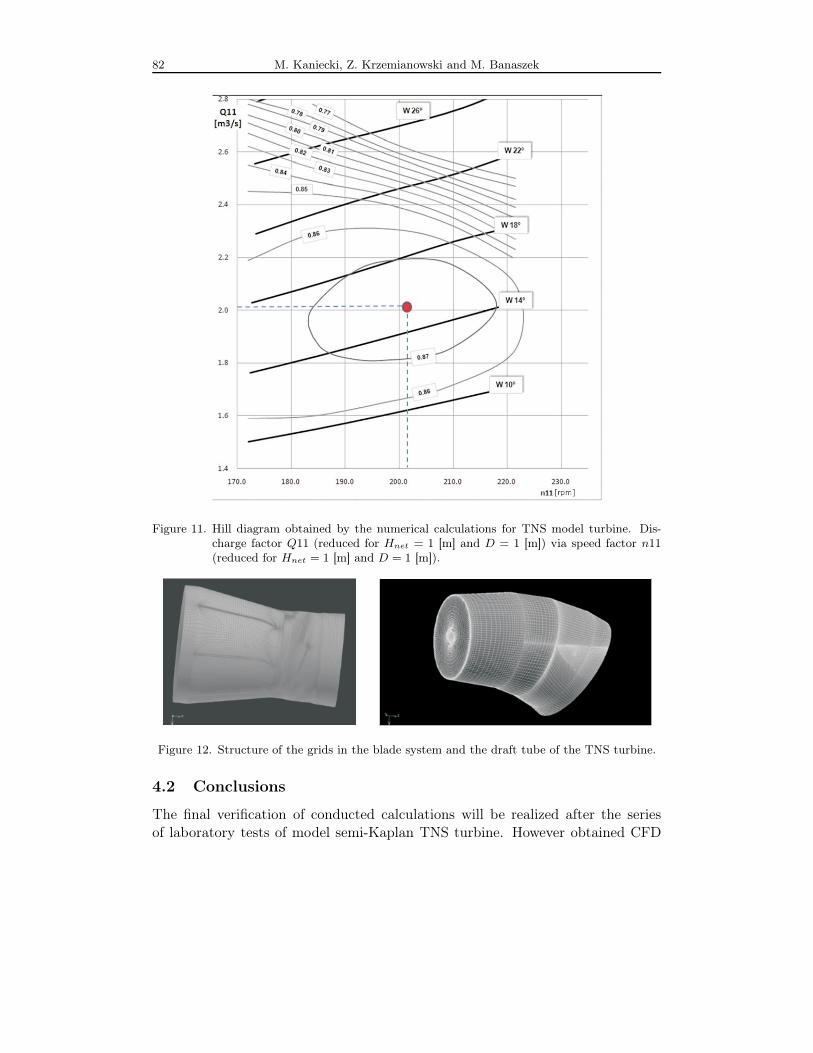
with a wide range of runner blade opening positions. The hydraulic efficiencycharacteristic via discharge factor has been determined for selected values of thespeed factor (Fig. 10) and finally, as a consequence of former steps, the hill di-agram has been drafted (Fig. 11). The following figures present single efficiencycharacteristic and the hill diagram of the model TNS turbine.
Figure 10. The single hydraulic efficiency characteristic via discharge factor obtained by thenumerical calculations for TNS model turbine..
4.1 Computational model
The grid preparation and numerical calculation of the TNS model turbine havebeen carried out, as above, using the Numeca/Fine [9] and the ANSYS [7] com-mercial software. Determinations of the fundamental operating conditions as wellas the investigations of the local phenomena of the flow were the crucial purposesof the TNS numerical researches. The calculations were realized for six runnerblade positions, which required generation of the same number of structural gridsdomains. The quality of the grids were satisfactory. In all cases between 1 to 3nodes were placed in the near-wall region y+ ≤ 3. As it was imposed for previousexamples, the applied model realized the steady state flow. The turbulence flowhas been taken into account by application the turbulent SST k-ω model. In thepictures (Figs. 12 and 13) the grid structure and obtained results of pressure fieldand the streamlines distributions have been presented.
82 M. Kaniecki, Z. Krzemianowski and M. Banaszek
Figure 11. Hill diagram obtained by the numerical calculations for TNS model turbine. Dis-charge factor Q11 (reduced for Hnet = 1 [m] and D = 1 [m]) via speed factor n11(reduced for Hnet = 1 [m] and D = 1 [m]).
Figure 12. Structure of the grids in the blade system and the draft tube of the TNS turbine.
4.2 Conclusions
The final verification of conducted calculations will be realized after the seriesof laboratory tests of model semi-Kaplan TNS turbine. However obtained CFD

Computational fluid dynamics simulations. . . 83
Figure 13. CFD results of static pressure and streamlines distributions in the TNS turbine flowsystem.
results seem to be qualitatively similar to the literature data [1,3] and authorsown experience. Obviously the quality of the CFD projection depends on theseveral aspects which were taken under the consideration in the previous studycases — the detailed representation of real geometry, fine grid with appropriatey+ value, appropriate turbulent model, second order discretization scheme withat least 104 iterates per process.
Acknowledgments Preparation of the paper has been funded from an the Sze-walski Institute of Fluid-Flow Machinery Pol. Ac. Sci. statutory activity.
Received 25 October 2011
References
[1] Anton I.: Hydraulic Turbine, Facla, Timisoara 1979.
[2] Gordon J.L.: Turbine selection for small low-head hydro developments. In:Proc. Waterpower XII, Buffalo 2003, USA.
[3] Gorla R., Khan A.: Turbomachinery — Design and Theory. Marcel DekkerInc., New York 2003.
[4] Nechleba M.: Hydraulic Turbines — Design and Equipment. Artia, Prague1957.
[5] Perić M., Ferziger J.M.: Computational Methods for Fluid Dynamics.Springer-Verlag, Berlin 1996.

84 M. Kaniecki, Z. Krzemianowski and M. Banaszek
[6] Kaniecki M., Krzemianowski Z., Banaszek M.: Determination of the operat-ing parameters for Kaplan turbines utilizing the CFD calculations. In: Proc.Int. Conf. Hydro 2011, Prague 17–19 Oct. 2011.
[7] ANSYS Fluent 12.1 Theory Guide. Ansys Inc. April 2009.
[8] Gambit Tutorial Guide. Fluent Inc. May 2000.
[9] Numeca. Numeca’s Flow Integrated Environment. User Manual — Fine Ver-sion 6, September 2006.