computational simulations of the nasa langley …
TRANSCRIPT

Statement A: Approved for public release; distribution is unlimited. *Aerospace Engineer, Structural and Thermal Systems Branch, Mail Stop 431 **Thermal Lead, Structural and Thermal Systems Branch, Mail Stop 431 ***Project Engineer, Structural Mechanics and Concepts Branch, MS 190 ****Aerospace Engineer, Structural Mechanics and Concepts Branch, Mail Stop 190 This material is declared a work of the U.S. Government and is not subject to copyright protection in the United States.
COMPUTATIONAL SIMULATIONS OF THE NASA LANGLEY HyMETS ARC-JET FACILITY
A. J. Brune*, W. E. Bruce, III**, D. E. Glass***, and S. C. Splinter****
NASA Langley Research Center
Hampton, VA 23681
ABSTRACT
The Hypersonic Materials Environmental Test System (HyMETS) arc-jet facility located at the NASA Langley Research Center in Hampton, Virginia, is primarily used for the research, development, and evaluation of high-temperature thermal protection systems for hypersonic vehicles and reentry systems. In order to improve testing capabilities and knowledge of the test article environment, an effort is underway to computationally simulate the flowfield using computational fluid dynamics (CFD). A detailed three-dimensional model of the arc-jet nozzle and free-jet portion of the flowfield has been developed and compared to calibration probe Pitot pressure and stagnation-point heat flux for three test conditions at low, medium, and high enthalpy. The CFD model takes into account uniform pressure and non-uniform enthalpy profiles at the nozzle inlet as well as catalytic recombination efficiency effects at the probe surface. Comparing the CFD results and test data indicates an effectively fully-catalytic copper surface on the heat flux probe of about 10% efficiency and a 2-3 kpa pressure drop from the arc heater bore, where the pressure is measured, to the plenum section, prior to the nozzle. With these assumptions, the CFD results are well within the uncertainty of the stagnation pressure and heat flux measurements. The conditions at the nozzle exit were also compared with radial and axial velocimetry. This simulation capability will be used to evaluate various three-dimensional models that are tested in the HyMETS facility. An end-to-end aerothermal and thermal simulation of HyMETS test articles will follow this work to provide a better understanding of the test environment, test results, and to aid in test planning. Additional flowfield diagnostic measurements will also be considered to improve the modeling capability.
INTRODUCTION
Thermal protection systems (TPS) are being developed and tested at NASA Langley Research Center in the HyMETS arc-jet facility for application on hypersonic vehicles and reentry systems. Ground testing of relevant materials is essential to develop, screen, and demonstrate their performance at flight-relevant conditions. Development of codes to model the TPS thermal response for various flight conditions, other than those within limited operating envelopes of ground facilities, is also supported by testing efforts.
The HyMETS facility was installed at NASA Langley Research Center in 1968 as a 100 kW segmented-constrictor-direct-current-electric-arc-heated wind tunnel. The facility was used primarily for emissivity, catalysis, and dynamic oxidation testing of metals and coatings for hypersonic vehicles from the 1970’s through the early 2000’s.1-3 Upgrades were made to the facility test conditions, which included increased capability to test specimens at higher surface temperatures and pressures.4 Since then, HyMETS has been used primarily for characterization of ceramic matrix composite materials, rigid and flexible TPS, high-temperature coatings, and for performing research and development on plasma flow diagnostics.
Of the limited number of facilities available to currently support TPS development and evaluation, arc-jet facilities can provide the most relevant aerothermal loads on material systems for durations sufficient to test over the total flight heat load. Challenges arise from these facilities, which include determination and verification of appropriate arc-jet conditions and test model

configurations at sufficiently approximate flight loads. A paper by Mazaheri5 introduced a methodology to estimate the flight-relevant heat flux and heat load and predict the relationship between the flight and arc-jet surface heat flux. The method uses a simplified approach to determine the arc-jet flow conditions consistent with the lumped pressure and bulk enthalpy arc-heater setting, eliminating the need to simulate the arc-jet nozzle. A representative freestream condition is estimated that satisfies the cold-wall heat flux and surface pressure measured by the calibration probe.
This paper presents an alternative method to the simplified method described above. The alternative method involves the direct simulation of the arc-jet facility, including the arc-jet nozzle and test chamber. The difference between the two methods is the process to obtain the relevant arc-jet conditions, just upstream of the test model or probe, using some form of CFD modeling. The technique presented in this work requires knowledge of the measured chamber pressure and bulk enthalpy consistent with the arc-jet heater current and flow rate setting. As will be shown in this paper, there is a degree of non-uniformity of the flow throughout the arc-jet nozzle and test chamber. The actual arc-jet flowfield profiles at the plenum, prior to the nozzle, are predicted to satisfy the surface heat flux and pressure measured by the calibration probe. The advantage of this approach is the direct simulation of the actual thermal nonequilibrium flow and its non-uniformity through the nozzle and test chamber to determine the appropriate arc-jet conditions upstream of the TPS sample. Once the CFD predictions that closely represent the measured calibration data are obtained, the flight-to-ground comparison and evaluation of specimens can be made using the flowfield profiles prior to the TPS sample. This final step is left as future work, which will be described following the conclusions of the paper.
This paper is organized to first present an overview of the HyMETS facility configuration and instrumentation. The next section presents the methodology that determines the actual plenum flowfield profiles consistent with the measured arc-jet heat flux and pressure. The following section validates the methodology by comparing computed and measured arc-jet data for a particular test condition. The last section applies the methodology to a range of arc-jet conditions at low, medium, and high enthalpy.
HyMETS ARC-JET FACILITY
The HyMETS facility, shown in Fig. 1 in its entirety, uses a segmented-constrictor-dc-electric-arc-heater as an arc heater generator with N2 and O2 injected as the test gas. The arc heater generator can be visualized in Figs. 2 and 3 and is mounted on the outside of the test chamber door. The generator consists of water-cooled components, which include a copper cathode with tungsten button emitter, electrically-isolated copper segment constrictors with a 0.5-in diameter bore, and a copper divergent-ring anode. Test gasses are injected tangentially into the bore of the arc heater generator at six discrete locations and can be custom mixed to desired atmospheric composition. The gasses are heated by a high-voltage electric arc that is maintained between the cathode and anode to create a high-temperature ionized plasma flow. The HyMETS facility has a viewport on the test chamber door to obtain video and pyrometer thermal data of the test specimen. A detailed description and overview of the HyMETS facility and performance envelopes for stagnation testing can be found in the literature.4,6
For stagnation testing, a water-cooled 2.5-in exit diameter conical nozzle, made of copper and attached to the arc heater generator system, is used to provide the appropriate combination of heat flux and model pressure. The plasma flow from the arc heater generator is accelerated through the nozzle and exhausted into a 2-ft by 3-ft long vacuum test chamber. The flow proceeds downstream of the test chamber into a collector cone, a 6-in diameter constant cross-section diffuser, and a coiled-copper tubing heat exchanger to decelerate and cool the flow. The test chamber is pumped to the desired conditions with a mechanical pumping system. Test models are positioned on the centerline of the flow just downstream of the nozzle exit. A TPS test specimen, a Pitot probe, and a slug calorimeter are injected into the flow during each run.

Statement A: Approved for public release; distribution is unlimited. *Aerospace Engineer, Structural and Thermal Systems Branch, Mail Stop 431 **Thermal Lead, Structural and Thermal Systems Branch, Mail Stop 431 ***Project Engineer, Structural Mechanics and Concepts Branch, MS 190 ****Aerospace Engineer, Structural Mechanics and Concepts Branch, Mail Stop 190 This material is declared a work of the U.S. Government and is not subject to copyright protection in the United States.
A flat-face Pitot probe and copper slug calorimeter7,8 in Fig. 4 and 5, respectively, are used to determine the flowfield stagnation heat flux and surface pressure during each run. The copper slug calorimeter is used to determine fully-catalytic cold-wall (FCCW) heat flux and consists of an un-cooled slug sensor element that is 0.5-in diameter by 0.5-in long with an un-cooled shroud that is 1.3-in diameter by 0.850-in long and a flow-face edge radius of 0.125 inches. The slug sensor element and shroud are fabricated out of oxygen-free high-conductivity (OFHC) copper. The slug sensor element has a 0.002-in wide “insulating” air gap between it and the shroud, and is held in place using six cone-tipped set-screws. The slug sensor element also has a Type-K thermocouple mounted on its back surface to measure temperature rise. The length, diameter, and mass of the slug sensor element are measured prior to testing. The copper slug calorimeter is inserted into a steady-state flow for 2-3 seconds so that it achieves a back-face temperature rise of several hundred degrees Fahrenheit, not to exceed a final temperature of 600°F. The FCCW heat flux is calculated from the density of the OFHC copper slug sensor element ρ, the temperature-dependent specific heat capacity of the element Cp(T), the length of the element l, and the slope of the temperature rise ΔT/Δt from the linear portion of the temperature response curve for the Type-K thermocouple using7:
t
TlTCq FCCW
PFCCW (1)
The uncertainty of the resulting method given by Eq. (1) is assumed to be ±10-15%.8
Figure 3. HYMETS facility test setup
Figure 2. HYMETS facility test setup schematic
Figure 1. HYMETS facility
Test Preparation and Facility Control Bay
Test Chamber and
Power Supply Bay
Diffuser, Instruments,
and Gas Cylinder Bay
Vacuum Pumps Bay

In addition to the surface pressure and heat flux, conditions in the arc heater are measured, including flow total pressure upstream of the arc heater bore, total mass flow rate, and the average bulk enthalpy at the nozzle exit. An energy balance is performed on the arc heater generator in HyMETS to calculate the bulk enthalpy. The energy input to the arc heater generator is determined by the product of voltage E and current I measurements. The energy removal from the arc heater generator is determined by the product of the cooling water flow rate CW, and the differential temperature measured across the inlet and outlet of the cooling water manifolds, ΔTCW. Finally, the energy that remains in the arc heater generator is divided by the total measured mass flow rate of the test gases, Mtotal. The bulk enthalpy is calculated using9
Total
CWP
bulkM
TCCWCCIEH
21 (2)
where the constants C1 and C2 convert the energy input and output, respectively, to the proper units.
ARC-JET PLENUM PROFILE ESTIMATION
In this section, a method to estimate the arc-jet plenum profile conditions consistent with the calibrated cold-wall heat flux and surface pressure is presented. An iterative approach using equilibrium theory at the plenum loosely coupled with nonequilibrium CFD through the nozzle and test chamber was developed to estimate the arc-jet plenum profile conditions, given the arc heater pressure, bulk enthalpy, and calibrated heat flux and surface pressure measured by the slug calorimeter and Pitot probe, respectively. The steps for the iterative process are schematically shown in Fig. 6.
In the iterative process, the measured arc heater pressure and the inferred enthalpy computed from the measured surface heat flux and pressure were used to estimate the initial plenum pressure and enthalpy profile. Equilibrium theory was used to estimate the initial plenum profile conditions for the nonequilibrium CFD, which was then used to compute the inferred enthalpy, the enthalpy profile at the nozzle exit, and the surface pressure. The enthalpy profile at the plenum was assumed to have a parabolic shape in mathematical form of Eq. (3):
Figure 4. Pitot tube
Figure 5. Copper slug calorimeter

Statement A: Approved for public release; distribution is unlimited. *Aerospace Engineer, Structural and Thermal Systems Branch, Mail Stop 431 **Thermal Lead, Structural and Thermal Systems Branch, Mail Stop 431 ***Project Engineer, Structural Mechanics and Concepts Branch, MS 190 ****Aerospace Engineer, Structural Mechanics and Concepts Branch, Mail Stop 190 This material is declared a work of the U.S. Government and is not subject to copyright protection in the United States.
2
210)( raraarH (3)
subject to,
guess
CLHH )0( (4)
00
rdr
dH (5)
plenum
A
HrH )( (6)
In Eq. (3), H(r) is the enthalpy profile defined at the plenum and varies with radius r from the nozzle centerline. The coefficients are determined by the conditions from Eq. (4)-(6), where the centerline enthalpy defines the leading coefficient a0, the maximum (peak) enthalpy at the centerline defines coefficient a1, and the bulk enthalpy at the plenum defines coefficient a2. (Note that the bulk enthalpy at the plenum Hplenum is different from the bulk enthalpy at the exit Hbulk; the bulk enthalpy at the plenum is the first term in Eq. (2) without nozzle heat losses.) Given the measured arc heater pressure P0 and H(r), the remaining thermodynamic state profiles (species mass fractions ci(r), temperature T(r), and density ρ(r)) can be determined assuming thermochemical equilibrium. The measured mass flow rate that corresponds to the arc-jet heater pressure and bulk enthalpy can be used to estimate the velocity profile at the plenum.
Figure 6. Iterative process for the arc-jet plenum profile condition estimation
The initial plenum profile conditions were then applied to the high-fidelity CFD simulations, which were computed with the LAURA-5 (Langley Aerothermodynamic Upwind Relaxation Algorithm) code10. In the CFD simulations, the arc-jet flowfield was modeled with 6-species air (N2, O2, NO, N, O, Ar) for low enthalpy flows and 11-species air (N2, O2, NO, N, O, Ar, N2
+, O2+, N+, O+, NO+, Ar+, e-) for the highest enthalpy condition. Thermal nonequilibrium was
modeled by including two energy equations for vibrational and translational modes in the simulations. The calibration probes (Pitot tube and slug calorimeter) were assumed as water-cooled at a constant wall temperature of 300 K. The transport and thermodynamic properties in the flowfield environment were computed from species collision integrals11-13 and curve fit data14, respectively. Further details on the flow solver and previous applications can be found in the literature.15-20
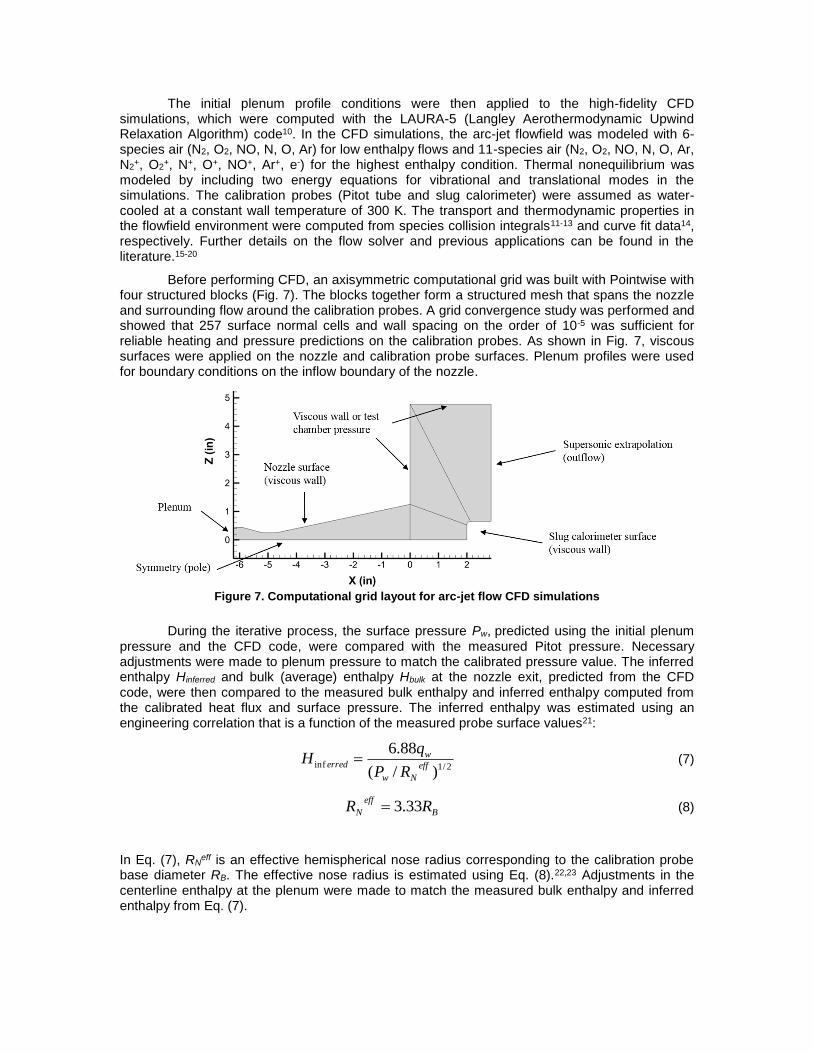
Before performing CFD, an axisymmetric computational grid was built with Pointwise with four structured blocks (Fig. 7). The blocks together form a structured mesh that spans the nozzle and surrounding flow around the calibration probes. A grid convergence study was performed and showed that 257 surface normal cells and wall spacing on the order of 10-5 was sufficient for reliable heating and pressure predictions on the calibration probes. As shown in Fig. 7, viscous surfaces were applied on the nozzle and calibration probe surfaces. Plenum profiles were used for boundary conditions on the inflow boundary of the nozzle.
During the iterative process, the surface pressure Pw, predicted using the initial plenum pressure and the CFD code, were compared with the measured Pitot pressure. Necessary adjustments were made to plenum pressure to match the calibrated pressure value. The inferred enthalpy Hinferred and bulk (average) enthalpy Hbulk at the nozzle exit, predicted from the CFD code, were then compared to the measured bulk enthalpy and inferred enthalpy computed from the calibrated heat flux and surface pressure. The inferred enthalpy was estimated using an engineering correlation that is a function of the measured probe surface values21:
2/1inf
)/(
88.6eff
Nw
werred
RP
qH (7)
B
eff
N RR 33.3 (8)
In Eq. (7), RNeff is an effective hemispherical nose radius corresponding to the calibration probe
base diameter RB. The effective nose radius is estimated using Eq. (8).22,23 Adjustments in the centerline enthalpy at the plenum were made to match the measured bulk enthalpy and inferred enthalpy from Eq. (7).
Figure 7. Computational grid layout for arc-jet flow CFD simulations

Statement A: Approved for public release; distribution is unlimited. *Aerospace Engineer, Structural and Thermal Systems Branch, Mail Stop 431 **Thermal Lead, Structural and Thermal Systems Branch, Mail Stop 431 ***Project Engineer, Structural Mechanics and Concepts Branch, MS 190 ****Aerospace Engineer, Structural Mechanics and Concepts Branch, Mail Stop 190 This material is declared a work of the U.S. Government and is not subject to copyright protection in the United States.
ARC-JET FLOWFIELD
In the previous section, the methodology to estimate the arc-jet plenum profiles prior to the conical nozzle was presented. An example of the plenum profiles is shown in Figs. 8a and 8b for an arc-jet bulk enthalpy and arc heater pressure of 6.5 MJ/kg and 109 kPa, respectively. These conditions correspond to the calibrated conditions tested on the 1.3-in calibration probe for a surface pressure and heat flux of about 5.1 kPa and 107 W/cm2, respectively. For this condition, the flow temperature peaks on the centerline at about 5000 K, which corresponds to mostly dissociated O2. A small amount of N2 dissociation is observed at this condition. The enthalpy at the plenum centerline was estimated to be 10.5 MJ/kg, which is higher than the estimated inferred enthalpy of 9.7 MJ/kg at the nozzle exit from Eq. (7). This difference can be explained by the heat losses through the water-cooled nozzle. (Note that the bulk enthalpy at the plenum is higher than the bulk enthalpy at the nozzle exit due to the energy balance in Eq. (2).) The plenum pressure was estimated to be 106 kPa to match the probe surface pressure, which is approximately 3.0 kPa drop from the arc heater pressure measured at the arc heater bore. This pressure drop was also seen for other test conditions considered in the next section.
Figure 9 shows an illustration of the computed 2.5-inch nozzle flowfield including the test chamber and the calibration probes. The flow expands in the nozzle to around Mach 5 at the exit with a computed inferred enthalpy of about 9.5 MJ/kg. Comparing the inferred enthalpy prediction from CFD to the estimated inferred enthalpy from Eq. (7), the plenum enthalpy profile is verified to correspond with the inferred enthalpy that matches the appropriate combination of calibrated heat flux and surface pressure. In the nozzle, the chemical composition freezes near the throat where the flow is dissociated and vibrationally excited. As expected, the computations predict that the flow is chemically and vibrationally frozen before it reaches the nozzle exit, which is shown in Fig. 9d. Coincidentally, the vibrational and translation temperatures in Fig. 9c deviate from equilibrium near the nozzle throat as well. Oxygen remains mostly dissociated within the entire flowfield, except in the boundary layer near the walls, while nitrogen remains in its molecular state.
(a) (b)
Figure 8. Plenum profiles prescribed to reproduce the 1.3-in calibration probe heat flux and surface pressure data. 2.5-in arc-jet nozzle flow: parabolic enthalpy profile, HCL=10.5 MJ/kg,
Pplenum= 106 kPa

Continuing at the nozzle exit, computed arc-jet flowfield information is compared with available arc-jet data from planar laser-induced fluorescence (PLIF) that was performed in HyMETS. Inman et. al.24 performed PLIF of naturally-occurring NO to obtain radial and axial velocity measurements at a test condition similar to the example in this section with a bulk enthalpy of 6.5 MJ/kg and arc heater pressure of 109 kpa. As referenced in the paper, the chamber pressure was reported to be 228 Pa. Therefore, comparisons were first made with the measured data at this chamber pressure by setting a prescribed pressure on the test chamber boundaries in Fig. 7.
Figure 10 compares the axial velocity flowfield downstream of the nozzle exit with a computed flowfield from LAURA on the top and the interpolated measurement profile from velocimetry data on the bottom. The computed and measured axial velocity profiles both show the flow propagating down the centerline with a nearly constant velocity and expanding away from the centerline. Figure 11 shows distributions of axial velocity at four different stream-wise locations labeled L1-L4. The position of lines L1-L4 are shown as white dashed lines in Fig. 10. Computed axial velocity profiles are compared to the measured velocity profiles at 15 and 228 Pa chamber pressures. The results show that the degree of expansion of the flow, downstream of the nozzle exit, depends on the chamber pressure. At the 228 Pa chamber pressure reported by Inman24, there is good agreement between the measured and computed velocity profiles. Within
(a) Mach number (b) Total Enthalpy
(c) Nozzle centerline temperature (d) Nozzle centerline gas composition
Figure 9. Computed 2.5-in arc-jet nozzle flowfield including the test chamber and 1.3-in
calibration probes: parabolic enthalpy profile, HCL=10.5 MJ/kg, Pplenum= 106 kPa

Statement A: Approved for public release; distribution is unlimited. *Aerospace Engineer, Structural and Thermal Systems Branch, Mail Stop 431 **Thermal Lead, Structural and Thermal Systems Branch, Mail Stop 431 ***Project Engineer, Structural Mechanics and Concepts Branch, MS 190 ****Aerospace Engineer, Structural Mechanics and Concepts Branch, Mail Stop 190 This material is declared a work of the U.S. Government and is not subject to copyright protection in the United States.
2 cm of the nozzle centerline, the axial velocity is nearly constant and does not appear to be impacted by the change in chamber pressure. The results in Fig. 12 also show no influence of the chamber pressure on the radial velocities within 2-3 cm of the centerline. Therefore, it is expected that the flow expansion will not impact the surface pressure and heat flux profiles of the calibration probes, because the probes with 0.65-in (1.65 cm) radius are well within 2 cm of the centerline. This can be verified by observing the computed surface profiles of the calibration probe in Fig. 13. The x axis shows the radial distance, Z, measured from the center to the edge of the calibration probe. The solid black line represents the calibration probe surface for reference to the surface pressure and heat flux profiles. In this figure, there are minor differences between the surface heat flux and pressure profiles at the 15 and 228 Pa chamber pressure. Therefore, a test model within 2 cm of the nozzle centerline is recommended for minimal unsteady effects from the free-jet expansion in the test chamber. Furthermore, CFD modeling does not require specification of a chamber pressure to obtain a reliable solution along the calibration probe surface.
Figure 10. LAURA-computed axial velocity flowfield (top) and mean axial velocity field interpolated from molecular-tagging velocimetry profiles (bottom): parabolic enthalpy profile,
HCL=10.5 MJ/kg, Pbox =15 Pa

Figure 11. Computed and measured profile distributions of axial velocity: parabolic enthalpy
profile, HCL=10.5 MJ/kg, Pbox = 15 and Pbox = 228 Pa
Figure 12. Computed and measured profile distributions of axial velocity: parabolic enthalpy profile, HCL=10.5 MJ/kg, Pplenum= 106 kpa, Pbox = 15 and Pbox = 228 Pa

Statement A: Approved for public release; distribution is unlimited. *Aerospace Engineer, Structural and Thermal Systems Branch, Mail Stop 431 **Thermal Lead, Structural and Thermal Systems Branch, Mail Stop 431 ***Project Engineer, Structural Mechanics and Concepts Branch, MS 190 ****Aerospace Engineer, Structural Mechanics and Concepts Branch, Mail Stop 190 This material is declared a work of the U.S. Government and is not subject to copyright protection in the United States.
ARC-JET CALIBRATION ENVIRONMENT
Simulations were performed for a range of arc heater test conditions at low, medium, and high enthalpy, shown in Table 1, to assess the calibrated arc-jet environments measured by calibration probes. The test conditions are labeled with arc heater current setting (in amps) and measured flow rate (in standard liter per minute) that correspond to the lumped arc heater pressure and bulk enthalpy. The inferred enthalpy is estimated using the correlation in Eq. (7) at the corresponding calibrated heat flux and surface pressure values. Although the calibration probes (Pitot and slug calorimeter) are made of copper and typically assumed to be more closely represented by the fully catalytic condition, surface catalysis effects were studied for each test condition from noncatalytic to fully catalytic conditions to determine the appropriate level of catalysis that best matches the measured calibration data. A fully catalytic surface has 100% efficiency in promoting atoms and ions species recombination on the surface. On the other hand, noncatalytic surface does not allow species recombination to take place on the surface.
Table 1. Summary of facility parameters, calibrated conditions, and estimated inferred enthalpy for considered test conditions with the 1.3-in calibration probe
Arc heater Bulk Stagnation Stagnation Inferred
Test pressure, enthalpy, heat flux, surface enthalpy,
Condition kpa MJ/kg W/cm2
pressure, kpa MJ/kg
100A/400SLPM 109 6.55 107 5.12 9.71
107A/105SLPM 26.8 15.6 170 1.91 25.8
320A/165SLPM 46.7 27.4 332 3.19 38.9
Figure 13. Computed heat flux and pressure profiles along the calibration probe surface at
multiple chamber pressures: parabolic enthalpy profile, HCL=10.5 MJ/kg, Pplenum= 106 kPa

Figure 14 shows predicted pressure and heat flux for the 1.3-in calibration probe at the different calibrated surface heat flux and pressure conditions. The profiles are shown along the calibration probe surface at radial distance, Z, from the center of the probe. The figures on the left
±5% error bars
±15% error bars
(a) 100A/400SLPM; pressure (b) 100A/400SLPM; heat flux
±5% error bars
±15% error bars
(c) 107A/105SLPM; pressure (d) 107A/105SLPM; heat flux
±5% error bars
±15% error bars
(e) 320A/165SLPM; pressure (f) 320A/165SLPM; heat flux
Figure 14. Computational results for arc-jet conditions tested on 1.3-in calibration probe

Statement A: Approved for public release; distribution is unlimited. *Aerospace Engineer, Structural and Thermal Systems Branch, Mail Stop 431 **Thermal Lead, Structural and Thermal Systems Branch, Mail Stop 431 ***Project Engineer, Structural Mechanics and Concepts Branch, MS 190 ****Aerospace Engineer, Structural Mechanics and Concepts Branch, Mail Stop 190 This material is declared a work of the U.S. Government and is not subject to copyright protection in the United States.
show the predicted pressure distributions after adjusting Pplenum to match the stagnation pressure to within 5% of the measured pressure from the Pitot probe. The CFD results predicted for the heat flux on the calibration probe surface are shown on the right for various catalysis levels. The predicted heat and pressure values at the stagnation point (or center) of the calibration probes are compared to the measured values and associated uncertainty, designated with error bars.
The plots on the left in Fig. 14 show that the catalysis has negligible impact on the shock location because pressure distributions are nearly identical. However, the variability in the results for the heat flux, shown on the right in Fig. 14, increases as the bulk enthalpy condition and calibrated stagnation heat flux increases. The TPS community, in general, categorizes the catalysis into three bands: “effectively” fully catalytic, moderately catalytic, and weakly catalytic.25 From Fig. 14(b), (d), and (f), the significant impact of the moderately catalytic band on the surface heat flux can be seen. Between recombination efficiencies of 1 and 10%, the moderately catalytic band thickens as the bulk enthalpy of the arc-jet flow increases. For example, the surface heat flux profile is less sensitive in the moderately catalytic band with approximately 25 W/cm2 change for the 6.5 MJ/kg case, while the catalytic effect was more significant for the 27.4 MJ/kg case with an increased moderately catalytic band of about 150 W/cm2. Comparing the measured calibrated heat flux to the predicted values, the test data indicates a fully catalytic surface. The predicted surface heat flux profile for 10% recombination efficiency agreed well within the measured heat flux uncertainty. In Table 2, a summary of the simulated results for the 10% surface catalytic condition is tabulated and compared with the measured heat flux and surface pressure.
Of the three cases, the 27.4 MJ/kg arc-jet condition is unique in which the stagnation temperature was high enough to trigger some level of ionization in the flow. Therefore, computed surface pressure and heat flux values were compared for 6- and 13-species gas, as shown in Figure 15. In this figure, the calibration probe heat flux and surface pressure profiles for 6-species and 13-species gas are represented with solid and dashed lines, respectively. The results show that the surface pressure and heat flux are impacted by the species presence in the flow near the stagnation point, within 0.3 inches of the calibration probe centerline. The difference in the results for the surface pressure and heat flux can be explained by how the presence of 6- and 13-species gas affects the shock near the centerline. At the stagnation point, significant dissociation occurs as the flow is stagnated at the highest possible temperature. For 13-species gas, an increased number of endothermic reactions are involved in the flow, which contribute to the reduction in post-shock temperature, and hence post-shock pressure. As a result of the post-shock stagnation temperature decrease, the enthalpy potential (or enthalpy difference between the boundary layer edge and calibration probe surface, H0e-Hw) is reduced. This affect can be seen for all surface catalytic conditions in Fig. 15(b). In this figure, the impact of surface catalysis on the heat flux, driven by wall enthalpy change in the enthalpy potential, can also be seen. Comparing the computational results for all arc-jet conditions in Fig. 14 and 15, the test data
Table 2. Computational results for the 1.3-in calibration probe at the 10% surface catalytic condition
Measured Predicted Measured Predicted
6.55 107 112 5.12 5.09
15.6 170 185 1.91 1.93
27.4 332 352 3.19 3.32
H bulk, MJ/kg
Stagnation
heat flux,
W/cm2
Stagnation
surface pressure,
kPa
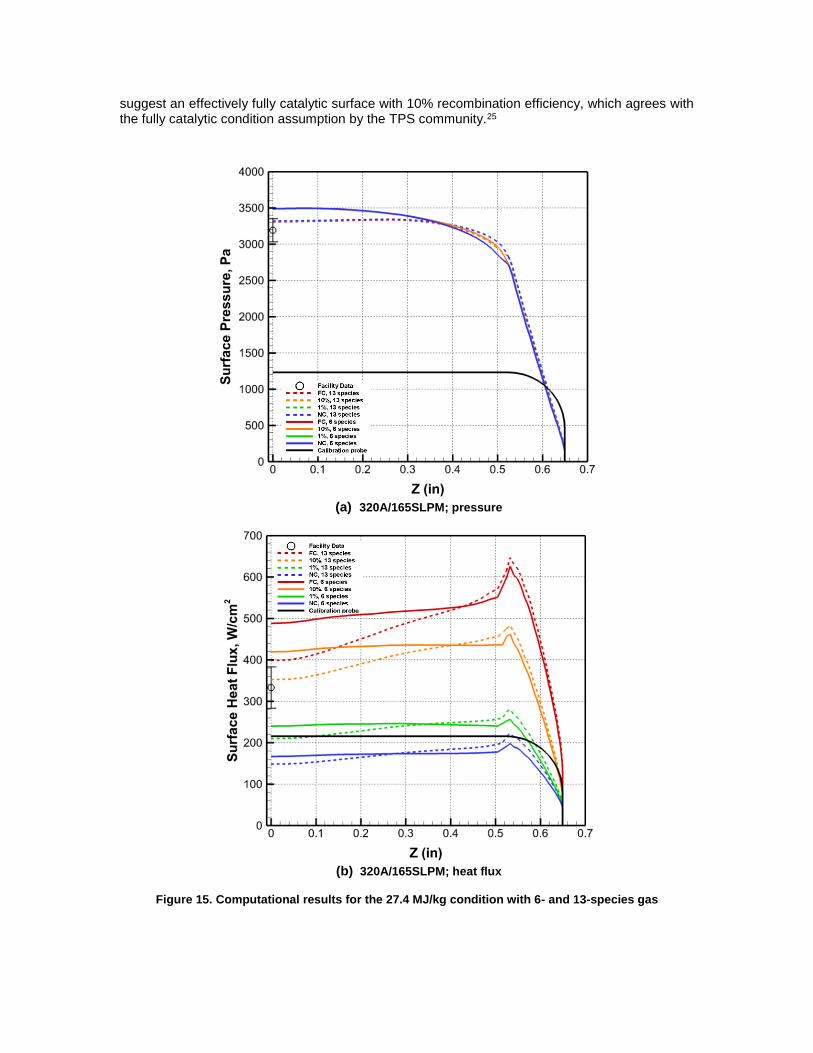
suggest an effectively fully catalytic surface with 10% recombination efficiency, which agrees with the fully catalytic condition assumption by the TPS community.25
(a) 320A/165SLPM; pressure
(b) 320A/165SLPM; heat flux
Figure 15. Computational results for the 27.4 MJ/kg condition with 6- and 13-species gas

Statement A: Approved for public release; distribution is unlimited. *Aerospace Engineer, Structural and Thermal Systems Branch, Mail Stop 431 **Thermal Lead, Structural and Thermal Systems Branch, Mail Stop 431 ***Project Engineer, Structural Mechanics and Concepts Branch, MS 190 ****Aerospace Engineer, Structural Mechanics and Concepts Branch, Mail Stop 190 This material is declared a work of the U.S. Government and is not subject to copyright protection in the United States.
SUMMARY AND CONCLUSIONS
A method to estimate the arc-jet condition representing the surface calibration probe values was presented. The method involves a three-dimensional model of the arc-jet nozzle and free-jet portion of the flowfield and accounts for actual flowfield profiles at the nozzle inlet and surface catalysis effects at the calibration probe surface. The flowfield profiles at the nozzle inlet were determined with an iterative approach to match bulk and inferred enthalpy at the nozzle exit and the surface pressure of the calibration probe. Catalytic effects were studied to determine the appropriate catalytic efficiency level that corresponds to the measured heat flux value. Comparing the CFD results and test data indicates an effectively fully catalytic copper surface on the heat flux probe of about 10% efficiency and a 2-3 kpa pressure drop from the arc heater bore, where the pressure is measured, to the plenum section, prior to the nozzle. With these assumptions, the CFD results are well within the uncertainty of the stagnation pressure and heat flux measurements. The predicted conditions at the nozzle exit were also compared and agreed with radial and axial velocimetry up to 3 cm from the nozzle centerline. Calibration probe sizes are well within this region from the centerline, and the chamber pressure has negligible impact on the predicted probe heat flux and pressure values.
FUTURE WORK
The simulation capability and methods presented in this work will be used to evaluate various three-dimensional models that are tested in the HyMETS facility. The evaluation of HyMETS test articles will require an end-to-end aerothermal and thermal simulation approach to provide understanding of the arc-jet test environment and test results. The aerothermal and thermal simulations can also aid in test planning of relevant arc-jet conditions similar to flight. Once the CFD predictions that closely represent the measured calibration data are obtained, the flight-to-ground comparison can be made using the flowfield profiles prior to the test specimens. Additional flowfield diagnostic measurements will also be considered, other than velocity profiles, at the nozzle exit, to improve and/or verify the modeling capability and assumptions.
ACKNOWLEDGMENTS
The present work was supported by the NASA Hypersonic Technologies Project. The authors would like to acknowledge the staff at the Hypersonic Materials Environmental Test System arc-jet facility for providing the calibration data for this paper. The authors would also like to thank Alireza Mazaheri, Paul Danehy, Paul Ferlemann, Wally Vaughn, and Vince Cuda of NASA Langley Research Center for their contribution in providing resources and constructive feedback for this work.
REFERENCES
1. Wiedemann, K., Clark, R., and Sankaran, S., Emittance, Catalysis, and Dynamic Oxidation of Ti-14AL-21Nb, NASA TP-2955, November 1989.
2. Glass, D., Oxidation and Emittance Studies of Coated Mo-Re, NASA CR-201753, October 1997.
3. Bird, R., Wallace, T., and Sankaran, S., Development of Protective Coatings for High-Temperature Metallic Materials, Journal of Spacecraft and Rockets, Vol. 41, No. 2, pp. 213-220, March-April 2004.
4. Splinter, S., Bey, K., and Gragg, J., Comparative Measurements of Earth and Martian Entry Environments in the NASA Langley HYMETS Facility, AIAA 2011-1014, 49th Aerospace Sciences Meeting, January 2011.

5. Mazaheri, A., Bruce, W., Mesick, N., and Sutton, K., Methodology for Flight-Relevant Arc-Jet Testing of Flexible Thermal Protection Systems, Journal of Spacecraft and Rockets, Vol. 51, No. 3, pp. 789-800, May-June 2014.
6. Calomino, A., Bruce, W., Gage, P., Horn, D., Mastaler, M., Rigali, D., Robey, J., Voss, L., Wahlberg, J., and Williams, C., Evaluation of the NASA Arc-Jet Capabilities to Support Mission Requirements, NASA SP-2010-577, May 2010.
7. ASTM Standard E 457, Standard Test Method for Measuring Heat-Transfer Rate Using a Thermal Capacitance (Slug) Calorimeter, Copyright ASTM International, 100 Barr Harbor Drive, PO Box C700, West Conshohocken, PA 19428-2959, United States.
8. Nawaz, A., and Santos, J., Assessing Calorimeter Evaluation Methods in Convective and Radiative Heat Flux Environment, AIAA 2010-4905, June 2010.
9. ASTM Standard E 341, Standard Practice for Measuring Plasma Arc Gas Enthalpy by Energy Balance, Copyright ASTM International, 100 Barr Harbor Drive, PO Box C700, West Conshohocken, PA 19428-2959, United States.
10. Mazaheri, M., Gnoffo, P., Johnston, C., and Kleb, B., LAURA 5 User Manual, NASA TM-217800-2013, 2013.
11. Gupta, R., Yos, J., Thompson, R., and Lee, K., A Review of Reaction Rates and Thermodynamic and Transport Properties for an 11-Species Air Model for Chemical and Thermal Nonequilibrium Calculations to 30,000 K, NASA RP-1232, 1990.
12. Wright, M., Recommended Collision Integrals for Transport Property Computations Part 1: Air Species, AIAA Journal, Vol. 43, No. 12, pp. 2558-2564, 2005.
13. Wright, M., Recommended Collision Integrals for Transport Property Computations Part 2: Mars and Venus Entries, AIAA Journal, Vol. 45, No. 1, pp. 281-288, 2005.
14. Gordon, S. and McBride, B., Computer Program for Calculation of Complex Equilibrium Compositions and Applications, NASA RP-1311, 1994.
15. Hash, D., Olejniczak, J., Wright, M., Prabhu, D., Pulsonetti, M., Hollis, B., Gnoffo, P., Barnhardt, M., Nompelis, I., and Candler, G., Fire II Calculations for Hypersonic Nonequilibrium Aerothermodynamics Code Verification: DPLR, LAURA, and US3D, AIAA 2007-0605, 45th AIAA Aerospace Sciences Meeting and Exhibit, January 2007.
16. Mazaheri, M., and Wood, W., Re-Entry Aeroheating Analysis of Tile-Repair Augers for the Shuttle Orbiter, AIAA 2007-4148, 39th AIAA Thermophysics Conference, June 2007.
17. Mazaheri, A., and Wood, W., Heating Augmentation for Short Hypersonic Protuberances, Journal of Spacecraft and Rockets, Vol. 46, No. 2, pp. 284-291, 2009.
18. Dyakonov, A., Schenenberger, M., Scallian, W., Van Norman, J., Novak, L., Tang, C., Aerodynamic Interference Due to MSL Reaction Control System, AIAA 2009-1030, 47th AIAA Aerospace Sciences Meeting, January 2009.
19. Johnston, C., Gnoffo, P., and Mazaheri, A., A Study of Ablation-Flowfield Coupling Relevant to the Orion Heatshield, AIAA 2009-4318, 41st AIAA Thermophysics Conference, June 2009.
20. Mazaheri, A., HEART Aerothermodynamic Analysis, NASA TM-2012-217568, 2012. 21. Smith, D. and Carver, D., Flow Calibration of Two Hypersonic Nozzles in the AEDC
Heat-H2 High-Enthalpy Arc-Heated Wind Tunnel, Calspan Corporation/AEDC Operations, Arnold Engineering Development Center, Arnold Air Force Base, Tennessee 37389.
22. Heister, N. and Clark, C., Feasibility of Standard Evaluation Procedures for Ablating Materials, NASA CR-379, February 1966.
23. Heister, N. and Clark, C., Comparative Evaluation of Ablating Materials in Arc Plasma Jets, NASA CR-1207, December 1968.
24. Inman, J., Bathel, B., Johansen, C., Danehy, P., Jones, S., Gragg, J., and Splinter, S., Nitric Oxide PLIF Measurements in the Hypersonic Materials Environmental Test System (HYMETS), AIAA 2011-10190, 49th AIAA Aerospace Sciences Meeting, 2011.
25. Nawaz, A., Driver, D., Terrazes-Salinas, I., and Sepka, S., Surface Catalysis and Oxidation on Stagnation Point Heat Flux Measurements in High Enthalpy Arc Jets, AIAA 2013-3138, Fluid Dynamics Conference, 2013.