computational modeling of temperature, flow, and
TRANSCRIPT

Computational Modeling of Temperature, Flow,and Crystallization of Mold Slag During Double HotThermocouple Technique Experiments
LEJUN ZHOU, WANLIN WANG, RUI LIU, and BRIAN G. THOMAS
A three-dimensional finite-difference model has been developed to study heat transfer, fluidflow, and isothermal crystallization of mold slag during double hot thermocouple technique(DHTT) experiments. During the preheating stage, temperature in the middle of the mold slagsample was found to be significantly [~350 K (~77 �C)] lower than near the two thermocouples.During the quenching stage, the mold slag temperature decreases with the cooled thermocouple.The temperature across the mold slag achieves a steady, nonlinear temperature profile duringthe holding stage; the insulating effect of the crystallizing layer in the middle of the slag samplecauses the high temperature region to become hotter, while the lower temperature mold slagbecomes cooler. Fluid flow is driven by Marangoni forces along the mold slag surface from thehotter region to the cooler region, and then recirculates back through the interior. Slag velocitiesreach 7 mm/s. Crystallization is predicted to start in the middle of the slag sample first and thengrows toward both thermocouples, which matches well with observations of the DHTTexperiment.
DOI: 10.1007/s11663-013-9864-2� The Minerals, Metals & Materials Society and ASM International 2013
I. INTRODUCTION
MOLD powder is widely used in modern continuouscasting of steel, where it melts to form a liquid flux layerabove the molten steel and infiltrates into the mold/shellchannel. Mold flux functions are (1) to protect the steelfrom oxidation, (2) to insulate the steel and avoidmeniscus freezing, (3) to absorb inclusions, (4) tolubricate the shell from sticking to the mold, and (5)to moderate the heat transfer in the mold. The crystal-lization of mold flux is regarded as one of the mostimportant properties of mold flux because it greatlyinfluences both heat transfer and lubrication.[1,2] There-fore, it is important to understand the crystallizationbehavior of mold slag.
It is difficult to observe slag behavior directly in themold due to the high temperature production environ-ment that makes visualization and measurement diffi-cult. Furthermore, the mold adds complicationsinvolving powder melting, mold oscillation, transientfluid flow, complicated chemical reactions with the steeland atmosphere, and other phenomena. Thus, several
different laboratory technologies have been developed tostudy the fundamental crystallization behavior of moldflux, including the double hot thermocouple technique(DHTT) and the single hot thermocouple technique(SHTT). The DHTT and SHTT were first developed byKashiwaya et al.[3,4] for in situ observation of mold fluxcrystallization and are favored by many other research-ers due to easy visualization as well as high heating andcooling rates.[5–10] However, only the temperature of themold slag adhering to the thermocouples can bemeasured, making important effects on crystallization,such as spatial variations in temperature and fluid flowinside the mold slag sample, difficult to quantify.Moreover, fluid flow in the small, lump-shaped DHTTsample is dominated by natural convection and surfaceeffects driven by Marangoni forces. This is very differentfrom the real process, where the mold slag is shaped inthe form of a large, thin sheet that is squeezed in the gapbetween an oscillating mold and a moving steel shell.Thus, it is problematic to apply the experimental resultsdirectly to the real casting process.Fortunately, computer modeling offers a powerful
tool to investigate these effects. Such models can be usedto develop more fundamental property data. After themodel simulation can accurately model the laboratoryDHTT experiment, the validated model with the fun-damental properties can be applied to simulate slagbehavior in the gap of the real commercial castingprocesses.This paper takes an initial step toward this goal by
developing a numerical model of heat transfer, fluid flow,and mold slag crystallization using the commercialcomputational fluid dynamics (CFD) package Fluent[11]
and applying it to match observations and measurements
LEJUN ZHOU, Graduate Student, is with the School ofMetallurgical Science and Engineering, Central South University,Changsha 410083, People’s Republic of China, and also VisitingScholar with the Department of Mechanical Science and Engineering,University of Illinois at Urbana-Champaign, 1206 W. Green Street,Urbana, IL 61801. WANLIN WANG, Professor, is with the School ofMetallurgical Science and Engineering, Central South University.Contact e-mail: [email protected] RUI LIU, Graduate Stu-dent, and BRIAN G. THOMAS, C.J. Gauthier Professor, are with theDepartment of Mechanical Science and Engineering, University ofIllinois at Urbana-Champaign.
Manuscript submitted December 3, 2012.Article published online May 11, 2013.
1264—VOLUME 44B, OCTOBER 2013 METALLURGICAL AND MATERIALS TRANSACTIONS B

of the DHTT experiment. The results provide betterunderstanding of the interaction among temperaturevariations in the slag sample, the movement of crystalsdriven by Marangoni flow and natural convection, andthe crystallization of mold slag.
II. SHTT AND DHTT EXPERIMENTS
In the SHTT experiment, pictured in Figures 1(a) and(b), a small (about 0.05 g) sample of mold flux powder ismounted in a thermocouple shaped into a half loop,heated to a desired preheat temperature, and held forseveral minutes. After the powder melts to form atransparent molten slag, the thermocouple is quenchedat a prescribed rate, to a constant holding temperature,while crystallization of the slag is visually observedthrough a microscope and recorded by a connectedCCD onto a DVD. The DHTT experiment, shown inFigures 1(a) and (c), uses two B-type thermocouples tosuspend the molten slag sample in order to provide acontrolled, time-dependent temperature gradient acrossthe sample by independent cooling of the two thermo-couples. The experiments were conducted in air, withresistance heating provided by DC current through thethermocouple wires, using a silicon-controlled rectifier(SCR) controller to maintain the prescribed temperaturehistories within ±275 K (±2 �C).
SHTT and DHTT experiments were performed on atypical slag used for continuous casting of low-carbonsteel, owing to the slow, easily observed crystallizationprocess for this composition. The composition of thepremelted mold flux is shown in Table I. The sampleswere prepared by melting a mixture of seven chemicallypure minerals in an induction furnace at 1773 K(1500 �C) for 5 minutes to homogenize its chemicalcomposition. The carbon found in commercial moldpowders to slow the melting rate is not added to thesamples here in order to simulate the composition of themelted flux found in the protected slag layer in the gapbetween the mold and shell of the real process. Next, theslag was poured onto a cool steel plate to quench andthen crushed and ground to make sample powders forthe DHTT and SHTT experiments. Further details onthese experiments applied to slags for low- and medium-carbon steel can be found elsewhere.[12]
As shown in Figure 1(c), the slag sample in the DHTTis mounted between two thermocouples (CH-1 andCH-2) and subjected to a temperature gradient historychosen to roughly approximate the thermal conditionsexpected in the continuous casting mold.[7,12]
The recorded (and simulated) temperature histories ofthe DHTT experiment are shown in Figure 2. Simula-tion time starts near the end of preheating (t = 0 sec-ond) and was found by simply subtracting 267 secondsfrom the ‘‘unadjusted’’ time measured from the start ofthe experiment, as shown in Figure 2. Only simulationtime is used for the rest of the paper. The simulation ofthis experiment was divided into three stages: stage 1preheating (from 0 to 10 seconds), stage 2 quenching(from 10 to 35 seconds), and stage 3 holding (from 35 to
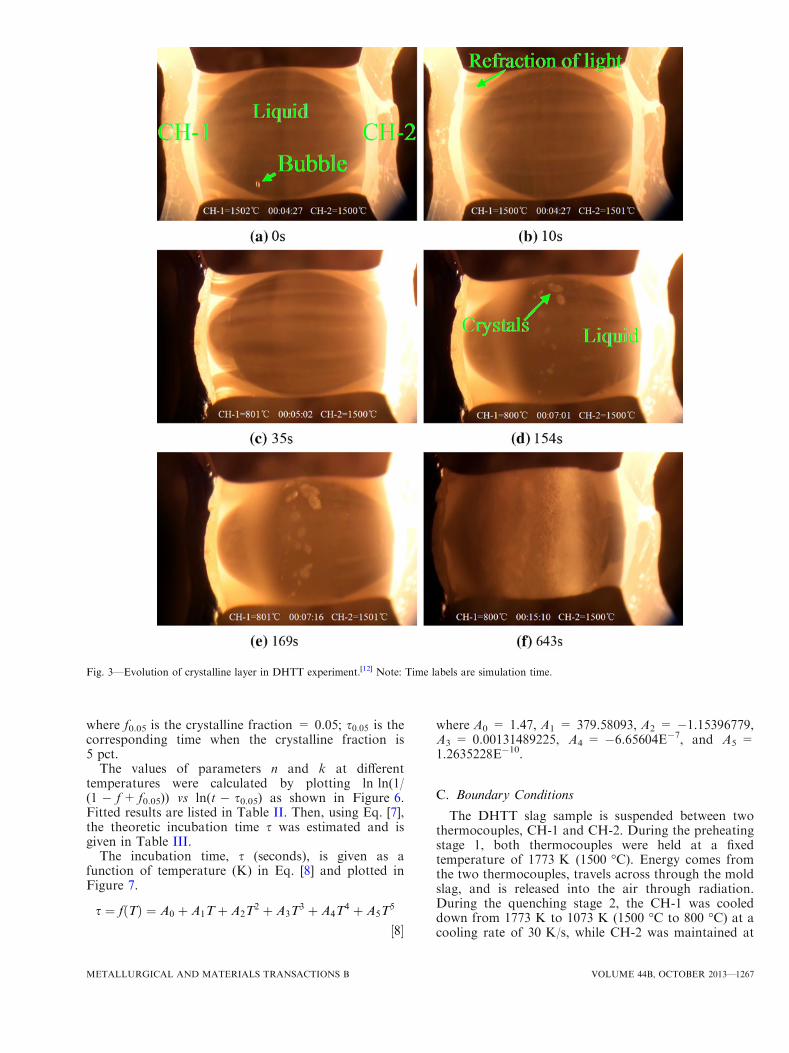
643 seconds), according to different thermal boundaryconditions.Typical pictures of the DHTT experiment showing
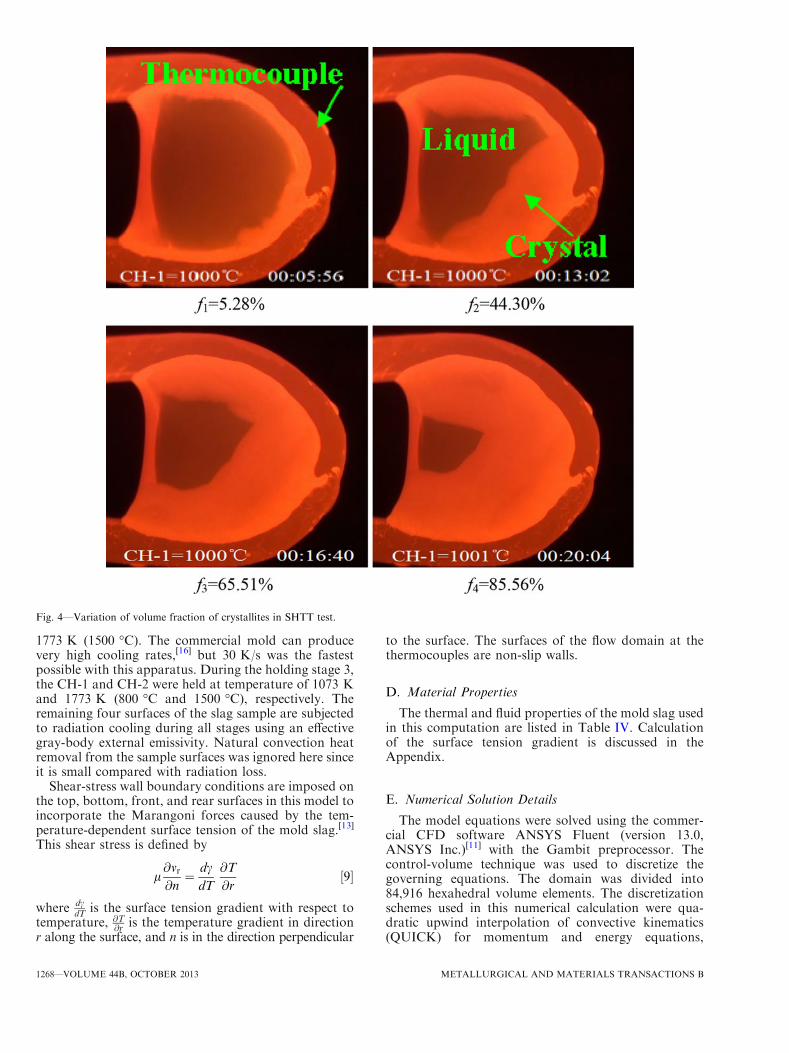
evolution of the crystalline layer are given in Figure 3.The crystalline layer first appears in the middle of themold slag at 154 seconds (53 seconds after quenching)and grows toward both thermocouples. In addition,fluid flow can be observed in the original videorecordings of both SHTT and DHTT experiments, asthe molten mold slag is seen to transport some smallcrystals from the central region of the liquid slag sampletoward the hot thermocouple. These observations areexplained by the numerical model of the crystallizationprocess, which is presented in the next section.Photographs of the SHTT experiment, Figure 4, track
the growth of crystallized area fraction. Note that theregion at the far left is discolored due to refraction, so itsarea is not counted. Time–temperature–transformation(TTT) diagrams were constructed from the recordedtemperature and time and fraction transformed.
III. MODEL DESCRIPTION
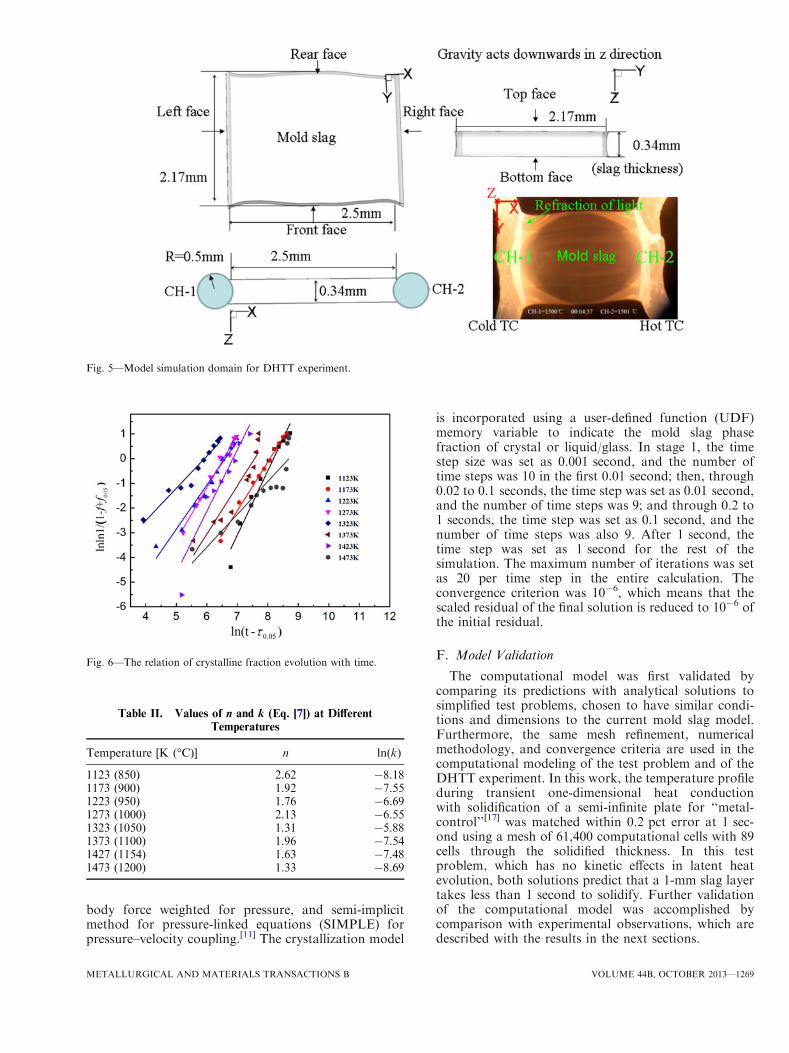
A model of heat transfer, fluid flow, and crystalliza-tion of the DHTT experiment has been developed forthe geometry shown in Figure 5. The three-dimensional
Fig. 1—Schematic of the SHTT and DHTT experiments.[3]
METALLURGICAL AND MATERIALS TRANSACTIONS B VOLUME 44B, OCTOBER 2013—1265

simulation domain of the 0.05-g mold slag sample isbased on the measured shape of the actual slag samplefrom photographs, with angles shown in Figure A2(Appendix). These angles are based on the sagging shapeof the sample which is governed by the combined forcesof surface tension and gravity, as presented in theAppendix. This domain does not include the thermo-couples, which act as fixed-temperature, non-slip bound-aries.
A. Governing Equations
The transient conservation equations of mass,momentum, and energy[13] are solved in three dimen-sions for velocity and temperature distribution in themold slag. The mass conservation or ‘‘continuity’’equation is given by
r � ð v!Þ ¼ 0 ½1�
where v is the fluid velocity vector.The equation for momentum conservation of an
incompressible Newtonian fluid is given as follows,including the buoyancy body force to include theinfluence of natural convection.
q0
@ v!
@tþ v!r v
! !
¼ �rpþ lrr v! þ qg ½2�
where p is the static pressure, l is viscosity, and g isthe gravitational acceleration. Gravity acts in the Zdirection, as shown in Figure 5, and the standardBoussinesq approximation is applied, which accuratelyincorporates the effect of temperature-dependent density
q on buoyancy-driven flow in incompressible fluids forsmall density changes[11]:
q ¼ q0ð1� bDTÞ ½3�
where q0 is the density at a reference temperature(298 K) and b is the thermal expansion coefficient of themold slag (K�1).The energy conservation equation, including the
effects of transient conduction, advection, diffusion,and heat sources, is
qCp@T
@tþ qCp v
!rT ¼ r keffrTð Þ þ Sh ½4�
where keff is the effective conductivity (including con-duction and radiation). The energy source term Sh wasadded to consider the latent heat of mold slag crystal-lization in those cells where phase transition (crystalli-zation) occurs.
Sh ¼ qdHCLH
dt¼ q
dHCLH
df
df
dt½5�
where HCLH is the latent heat of crystallization of themold slag and f is the crystallized phase fraction.
B. Isothermal Crystallization Model
A model of isothermal crystallization was developedfor the mold slag by defining and tracking the crystal-lized phase fraction f of the mold slag. The function isbased on the temperature-dependent incubation timeobtained from single hot thermocouple experiments.[12]
At times shorter than the incubation time, f = 0,indicating that the slag is totally liquid; otherwise,f = 1, indicating that the slag has started to crystallize.The theoretical incubation time, s (seconds), can be
found by evaluation of the Johnson–Mehl–Avrami(JMA) model,[14,15] fitted to the SHTT data.
f ¼ 1� expf�½kðt� sÞ�ng ½6�
where f is the volume fraction of crystals, t is crystal-lization time (seconds), k is the effective crystallizationrate constant including nucleation and growth (s�1), andn is the dimensionless Avrami exponent that is associ-ated with the nucleation and growth mechanism.Due to the video resolution limitations, it is impos-
sible to observe initiation of the first crystals in theSHTT experiment, which defines the theoretic incuba-tion time. Instead, evaluating Eq. [6] at 5 pct crystallinefraction and rearranging gives
ln ln1
1� f0:05
� �¼ n ln kþ n lnðs0:05 � sÞ ½7�
Table I. Mineral Percentage of the Premelted Mold Fluxes[12]
CaO SiO2 Al2O3 MgO CaF2 Na2O Li2O
Mass percentage 25.1 41.5 7.1 2.0 12.1 9.2 0.5Mole fraction 0.28 0.43 0.04 0.03 0.10 0.09 0.01
Fig. 2—Temperature history of DHTT experiment.
1266—VOLUME 44B, OCTOBER 2013 METALLURGICAL AND MATERIALS TRANSACTIONS B
where f0.05 is the crystalline fraction = 0.05; s0:05 is thecorresponding time when the crystalline fraction is5 pct.
The values of parameters n and k at differenttemperatures were calculated by plotting ln ln(1/(1 � f+ f0.05)) vs ln(t � s0.05) as shown in Figure 6.Fitted results are listed in Table II. Then, using Eq. [7],the theoretic incubation time s was estimated and isgiven in Table III.
The incubation time, s (seconds), is given as afunction of temperature (K) in Eq. [8] and plotted inFigure 7.
s ¼ fðTÞ ¼ A0 þ A1Tþ A2T2 þ A3T
3 þ A4T4 þ A5T
5
½8�
where A0 = 1.47, A1 = 379.58093, A2 = �1.15396779,A3 = 0.00131489225, A4 = �6.65604E�7, and A5 =1.2635228E�10.
C. Boundary Conditions
The DHTT slag sample is suspended between twothermocouples, CH-1 and CH-2. During the preheatingstage 1, both thermocouples were held at a fixedtemperature of 1773 K (1500 �C). Energy comes fromthe two thermocouples, travels across through the moldslag, and is released into the air through radiation.During the quenching stage 2, the CH-1 was cooleddown from 1773 K to 1073 K (1500 �C to 800 �C) at acooling rate of 30 K/s, while CH-2 was maintained at
Fig. 3—Evolution of crystalline layer in DHTT experiment.[12] Note: Time labels are simulation time.
METALLURGICAL AND MATERIALS TRANSACTIONS B VOLUME 44B, OCTOBER 2013—1267
1773 K (1500 �C). The commercial mold can producevery high cooling rates,[16] but 30 K/s was the fastestpossible with this apparatus. During the holding stage 3,the CH-1 and CH-2 were held at temperature of 1073 Kand 1773 K (800 �C and 1500 �C), respectively. Theremaining four surfaces of the slag sample are subjectedto radiation cooling during all stages using an effectivegray-body external emissivity. Natural convection heatremoval from the sample surfaces was ignored here sinceit is small compared with radiation loss.
Shear-stress wall boundary conditions are imposed onthe top, bottom, front, and rear surfaces in this model toincorporate the Marangoni forces caused by the tem-perature-dependent surface tension of the mold slag.[13]
This shear stress is defined by
l@vr@n¼ dc
dT
@T
@r½9�
where dcdT is the surface tension gradient with respect to
temperature, @T@r is the temperature gradient in directionr along the surface, and n is in the direction perpendicular
to the surface. The surfaces of the flow domain at thethermocouples are non-slip walls.
D. Material Properties
The thermal and fluid properties of the mold slag usedin this computation are listed in Table IV. Calculationof the surface tension gradient is discussed in theAppendix.
E. Numerical Solution Details
The model equations were solved using the commer-cial CFD software ANSYS Fluent (version 13.0,ANSYS Inc.)[11] with the Gambit preprocessor. Thecontrol-volume technique was used to discretize thegoverning equations. The domain was divided into84,916 hexahedral volume elements. The discretizationschemes used in this numerical calculation were qua-dratic upwind interpolation of convective kinematics(QUICK) for momentum and energy equations,
Fig. 4—Variation of volume fraction of crystallites in SHTT test.
1268—VOLUME 44B, OCTOBER 2013 METALLURGICAL AND MATERIALS TRANSACTIONS B
body force weighted for pressure, and semi-implicitmethod for pressure-linked equations (SIMPLE) forpressure–velocity coupling.[11] The crystallization model
is incorporated using a user-defined function (UDF)memory variable to indicate the mold slag phasefraction of crystal or liquid/glass. In stage 1, the timestep size was set as 0.001 second, and the number oftime steps was 10 in the first 0.01 second; then, through0.02 to 0.1 seconds, the time step was set as 0.01 second,and the number of time steps was 9; and through 0.2 to1 seconds, the time step was set as 0.1 second, and thenumber of time steps was also 9. After 1 second, thetime step was set as 1 second for the rest of thesimulation. The maximum number of iterations was setas 20 per time step in the entire calculation. Theconvergence criterion was 10�6, which means that thescaled residual of the final solution is reduced to 10�6 ofthe initial residual.
F. Model Validation
The computational model was first validated bycomparing its predictions with analytical solutions tosimplified test problems, chosen to have similar condi-tions and dimensions to the current mold slag model.Furthermore, the same mesh refinement, numericalmethodology, and convergence criteria are used in thecomputational modeling of the test problem and of theDHTT experiment. In this work, the temperature profileduring transient one-dimensional heat conductionwith solidification of a semi-infinite plate for ‘‘metal-control’’[17] was matched within 0.2 pct error at 1 sec-ond using a mesh of 61,400 computational cells with 89cells through the solidified thickness. In this testproblem, which has no kinetic effects in latent heatevolution, both solutions predict that a 1-mm slag layertakes less than 1 second to solidify. Further validationof the computational model was accomplished bycomparison with experimental observations, which aredescribed with the results in the next sections.
Fig. 5—Model simulation domain for DHTT experiment.
Fig. 6—The relation of crystalline fraction evolution with time.
Table II. Values of n and k (Eq. [7]) at Different
Temperatures
Temperature [K (�C)] n ln(k)
1123 (850) 2.62 �8.181173 (900) 1.92 �7.551223 (950) 1.76 �6.691273 (1000) 2.13 �6.551323 (1050) 1.31 �5.881373 (1100) 1.96 �7.541427 (1154) 1.63 �7.481473 (1200) 1.33 �8.69
METALLURGICAL AND MATERIALS TRANSACTIONS B VOLUME 44B, OCTOBER 2013—1269

IV. TEMPERATURE AND FLOW: RESULTSAND DISCUSSION
The numerical model predictions of the DHTTexperiment are presented for the preheating stage andthen for quenching and holding stages.
A. Preheating Stage 1: Temperature
During the preheating stage 1, the temperature ofboth thermocouples was kept constant at 1773 K(1500 �C) from 0 to 10 seconds. Figure 8 shows thesteady-state temperature distribution at 10 seconds, atthe end of stage 1. The red surface temperature contoursnear the thermocouples represent the higher tempera-ture region, while the blue central region is at a lowertemperature. The middle of the mold slag is slightlycooler due to the heat lost via radiation from the samplesurfaces. This matches the snapshot of the DHTTexperiment in the lower right frame, where the mold slagmiddle region is darker, indicating a lower temperature.
Temperature profiles at different times are shown inFigure 9(a), taken along the central line through thedomain in the X direction, as indicated in Figure 9(b).The lowest temperature is 1407.2 K at the sample center.The mold slag middle cooled down very fast, reachingsteady state within 0.1 second. The high cooling rate isdue to the very thin (0.34 mm) mold slag layer in theDHTT sample. This fast response rate insures that theslag temperature distribution remains constant duringthe rest of stage 1 and during stage 3.The non-uniform temperature distribution, with
350 K (77 �C) variations, is very noteworthy. This resultmeans that the slag samples in the DHTT and SHTTtest experience significant temperature gradients andcannot be assumed to have isothermal behavior. During‘‘isothermal’’ crystallization experiments, the mold slagmay crystallize first near the sample center, at the lowertemperature there, in spite of the lack of the thermo-couple as a nucleation site. The correct extraction ofTTT curves from these experiments is complicated bythis non-isothermal behavior. Thus, models such as thatof the current work are needed to help with this analysis.
B. Preheating Stage 1: Fluid Flow
The non-uniform temperature distribution duringpreheating induces fluid flow via two mechanisms.Marangoni flow is generated by the difference of surfacetension along the slag sample surface and naturalconvection inside the mold slag results from the tem-perature differences in the bulk. Figure 10 shows theresulting velocity vector distribution at 10 seconds instage 1. Figures 10(b), (c), and (d) show views in theX1 � X2, Y1 � Y2, and Z1 � Z2 sections, respectively,as indicated in the 3-D view in Figure 10(a). The arrowson the velocity vectors indicate the direction of flow.Flow along the sample surfaces is driven from the hotterregion near both thermocouples toward the coolerregion in the middle (Figure 10(a)), and then flowrecirculates back through the interior from the coolerregion to the hotter region of the mold slag, as shown inFigure 10(b). This flow is driven mainly by Marangoniforces, as the cooler, high surface tension middle pullsfluid along the surface from the hotter, low surfacetension thermocouple region. Return flow through theinterior is driven by mass conservation. Natural con-vection is relatively unimportant because there is verylittle asymmetric flow associated with the Z (gravity)direction. Velocity magnitude increases toward thehigher temperature regions near both thermocouplesdue to the lower viscosity caused by the higher temper-atures there.Figure 11 shows detailed velocity magnitude profiles
along the X axis direction at the top face, center plane,and bottom faces (Figure 9(b)) at 10 seconds. Thecurves are ‘‘M’’ shaped. Velocity is zero at the non-slip
Table III. Theoretic Incubation Times (Eq. [8]) at Different Temperatures
Temperature [K (�C)] 1123 (850) 1173 (900) 1223 (950) 1273 (1000) 1323 (1050) 1373 (1100) 1427 (1154) 1473 (1200)Incubation time (s) 246 155 105 172 190 233 310 442
Table IV. Thermal and Fluid Properties of Mold Slag
Specific Heat, Cp (J/kg/K) 1100+0.063T (K)�3.5 9 10�7/T2[27]
Latent heat of crystallization,HCLH (J/kg)
6.1 9 105[27]
Effective thermal conductivity,keff (W/m/K)
Liquid: 3[20,28]
Crystalline: 1.7Emissivity, r 0.8[28–30]
Viscosity, l (kg/m/s) �8.194+11989.17/T[31]
Density, q (kg/m3) 3021 � 0.33T[25,32,33]
Thermal expansioncoefficient, b (K�1)
1.1 9 10�4[25,32,33]
Surface tension gradient,dc=dT (N/m/K)
�0.00012[26,34]
Fig. 7—The relation of incubation time with temperature.
1270—VOLUME 44B, OCTOBER 2013 METALLURGICAL AND MATERIALS TRANSACTIONS B

interfaces with the thermocouples, and at the center, dueto symmetry. Velocity along the top and bottom faces isthe same, indicating symmetry of temperature and fluidflow in the central plane. The maximum velocity reaches7 mm/s along the surface near the thermocouples. Thiscorresponds to a Reynold’s number vLq=l (based onL = sample thickness) of 0.054, so the laminar flowassumption is appropriate. Velocity along the surface ishigher than the interior region, including the centerplane.
The variation of the centerline velocity profile withtime is shown in Figure 12. The highest velocity of4 mm/s develops after only 0.5 second. As timeincreases from 0 second (uniform temperature), thetemperature in the middle of the interior drops quickly,generating temperature gradients which enhance thebuoyancy and Marangoni effects, and so the velocityincreases.
This fluid flow may break up central crystallineaggregation and transport crystals into higher temper-ature regions. The movement of crystals toward thethermocouples has been observed both by Cramb[7]
as shown in Figure 13(a) and in the present work(Figure 13(b)). Inferring the flow direction at differentdepths from observation of the moving crystals isdifficult in a transparent medium. Most crystals formin the cool central region of the sample and are observedto move toward the hot thermocouple(s). The flowmodel results suggest that this movement is occurringthrough the sample interior. It seems that the returnflow taking place in the thin surface layer is difficult toobserve, although the strong velocity gradients can beinferred from the observed breakup of large crystallineaggregations as they move.
C. Quenching Stage 2
During the quenching stage 2, from 11 to 35 seconds,the CH-1 thermocouple cools from 1773 K to 1073 K(1500 �C to 800 �C) at a cooling rate of 30 K/s, whilethe hot thermocouple CH-2 is held at 1773 K (1500 �C).During the holding stage 3, after 36 seconds, thetemperatures are kept constant. The temperature distri-bution at the end of quenching, 35 seconds, is shown inFigures 14(a) through (c). Temperature is observed toincrease from left to right, which is consistent with theincreasing brightness toward the right, seen in the realexperiment snapshot in Figure 14(d).Figure 15 quantifies the temperature profile along the
central X-direction line (Figure 9(b)) with time duringquenching stage 2. The temperature near the left (CH-1)naturally drops much faster than near the right (CH-2).After 35 seconds, the temperature profile remains con-stant. This temperature distribution thus defines theisothermal crystallization temperature during stage 3.The time variation of temperature and cooling rates at
different distances away from CH-1 in the mold slag isshown in Figures 16 and 17, respectively. The startingtemperatures at 10 seconds vary according to Figure 15.Thus, temperatures drop at different rates with thequenching of CH-1 over the next 25 seconds. Subse-quently, temperatures become constant almost immedi-ately due to the small thickness of the mold slag sample,as discussed previously.Figure 17 shows that the mold slag next to CH-1 has
the highest cooling rate of 30 K/s. The cooling ratedecreases with distance away from CH-1. A similardistribution is expected across the mold slag layers in theinterfacial gap between the mold and the solidifying steel
Fig. 8—Temperature contours at time of 10 s in stage 1.
METALLURGICAL AND MATERIALS TRANSACTIONS B VOLUME 44B, OCTOBER 2013—1271

shell of a continuous caster, where the slag near thewater-cooled mold wall has the highest cooling rate,while near the shell, it has the lowest.
The time–temperature histories determine whether themolten slag transforms into a glassy phase or crystals.Figure 18 shows the isothermal TTT diagram for themold slag of this work. The critical cooling rate is
5.24 K/s (1773 K ð1500 �C) to 1223 K ð950 �CÞ
105 seconds). When the local
cooling rate is less than this critical cooling rate, crystalscan form, with size and morphology depending on thecooling history. Otherwise, the supercooled liquid maysimply form glass. In this work, most of the slag isinitially glassy, owing to the cooling rates exceeding thiscritical value in most of the sample.
The initial glassy layer may later transform tocrystals, or ‘‘devitrify,’’ if subsequently the temperatureis maintained hot enough for a time period long enoughto exceed the isothermal incubation time. This eventu-ally led to complete crystallization in the current sample.This behavior is also commonly experienced by slag nearthe mold wall in the steel continuous caster.[18] Highlocal contact resistance between the mold wall and slagcombined with very slow movement of the solid portion
of the solid slag explains why the mold slag layer next tothe mold wall is usually crystalline.[16,19]
The stable flow pattern in Figure 10 generally slowsduring quenching. The evolution of the velocity profileacross the mold slag sample length with time during thisstage is given in Figure 19. The decrease in temperaturenear CH-1 causes significant increase in viscosity, whichdecreases velocity in the cold half of the sample. Velocityin the hot region near CH-2 increases slightly during thistime period.
D. Holding Stage 3
During the isothermal holding stage (after 35 sec-onds), crystallization occurs in the mold slag sample,starting in the center region. While the temperaturehistory controls the evolution of the crystalline layer, thecrystalline layer in turn affects the temperature distri-bution. Figure 20 shows the nonlinear temperaturedistribution along the central line in X axis at 35 and470 seconds during holding. The higher temperatureregion near CH-2 gets slightly hotter during holding. Atthe same time, the lower temperature region close toCH-2 gets slightly cooler. This temperature variation,that reaches maximum 40 K (�233 �C), is included inFigure 20 and can be explained by the change of phaseof the mold slag. The effective thermal conductivity ofthe mold slag decreases when it crystallizes due to theformation of internal defects, such as pores, and theinhibition of radiative heat transfer, caused by thescattering from crystal defects and grain boundaries asfound in previous studies.[20–22] Thus, the crystallizedslag provides an insulating layer which reduces the heatflux transferring from the higher temperature region tothe lower temperature region. The evolution of latentheat during crystallization further increases this effect.Although the effect is observed here to be relativelysmall, perhaps owing to the simplified treatment ofradiation through the slag in the present model, thecontrol of the mold slag crystallization is considered tobe an effective method to control heat transfer andimprove slab surface and interior quality in continuouscasting.[21,23]
The fluid flow distribution during the holding stage 3is shown in Figure 21, for the same four views asFigure 10. The flow behavior is similar in the hightemperature region, but is suppressed in the half of thesample nearest the quenched CH-1. Molten slag isdriven along the surface from the hotter region nearCH-2 toward the cooler region and then returns back tothe hotter region through the interior.
V. CRYSTALLIZATION MODEL PREDICTIONS
The model predictions of the evolving crystalline layerare shown in Figure 22(a), along with correspondingphotos of DHTT experiments at similar times inFigure 22(b). In the first two frames of both thepredictions and measurements, there are no crystalsprecipitated. A crystalline layer appears in the middle ofthe mold slag in the third frame. The positions of the
Fig. 9—Temperature distribution along the central line at differenttimes in stage 1.
1272—VOLUME 44B, OCTOBER 2013 METALLURGICAL AND MATERIALS TRANSACTIONS B

crystal layer in the third and fourth frames match wellwith the crystal precipitation observed in the experi-ment. However, small deviations arise with increasingtime. The predicted growth of the crystalline layer isslower than the observations at later time (frames).
A likely explanation for this deviation is the differencebetween the idealized and actual SHTT and DHTT
experiments. Applying the JMA model of incubationbased on the SHTT data to the DHTT experimentassumes simple isothermal crystallization in both exper-iments and with no fluid flow. Actually, this work showsthat non-uniform temperature gradients are significantand that fluid flow transports crystals after they form. Arelated complication is the associated differences in
Fig. 10—Fluid flow at time of 10 s in stage 1.
Fig. 11—Velocity magnitude at 10 s along centerline at top face,center plane, and bottom face. Fig. 12—Velocity magnitude along central line at central plane.
METALLURGICAL AND MATERIALS TRANSACTIONS B VOLUME 44B, OCTOBER 2013—1273

heterogeneous nucleation between the two experiments.In the SHTT experiment, crystals often nucleate heter-ogeneously on the thermocouple wire and only some-times initiate homogeneously in the middle of the moldslag. In the DHTT experiment, crystals always appearfirst in the middle of the slag sample, and the fluid flowtends to break and transport them, thus avoiding theneed for homogenous nucleation. Therefore, the moldslag crystallizes faster in the DHTT experiment thanexpected. Future models should incorporate these effectsto enable more accurate predictions.
Another error source is the difficulty of interpretingthe discolored area fractions in the photographs ascrystallized volume fractions. Also, the much longertime of the SHTT experiment likely allowed the com-position of the slag in this experiment to change due tothe volatilization of fluorides, etc., which could slow thecrystallization. Finally, humidity differences could havecaused different rates of hydrogen pickup, which isknown to greatly accelerate crystallization.[24] Consid-ering these issues, the current model prediction of theonset of crystallization and trend of crystalline layer
Fig. 13—Crystals separate and move with flow in liquid mold slag.
Fig. 14—Temperature contours at 35 s when TC-1 has cooled to 1073 K (800 �C).
1274—VOLUME 44B, OCTOBER 2013 METALLURGICAL AND MATERIALS TRANSACTIONS B
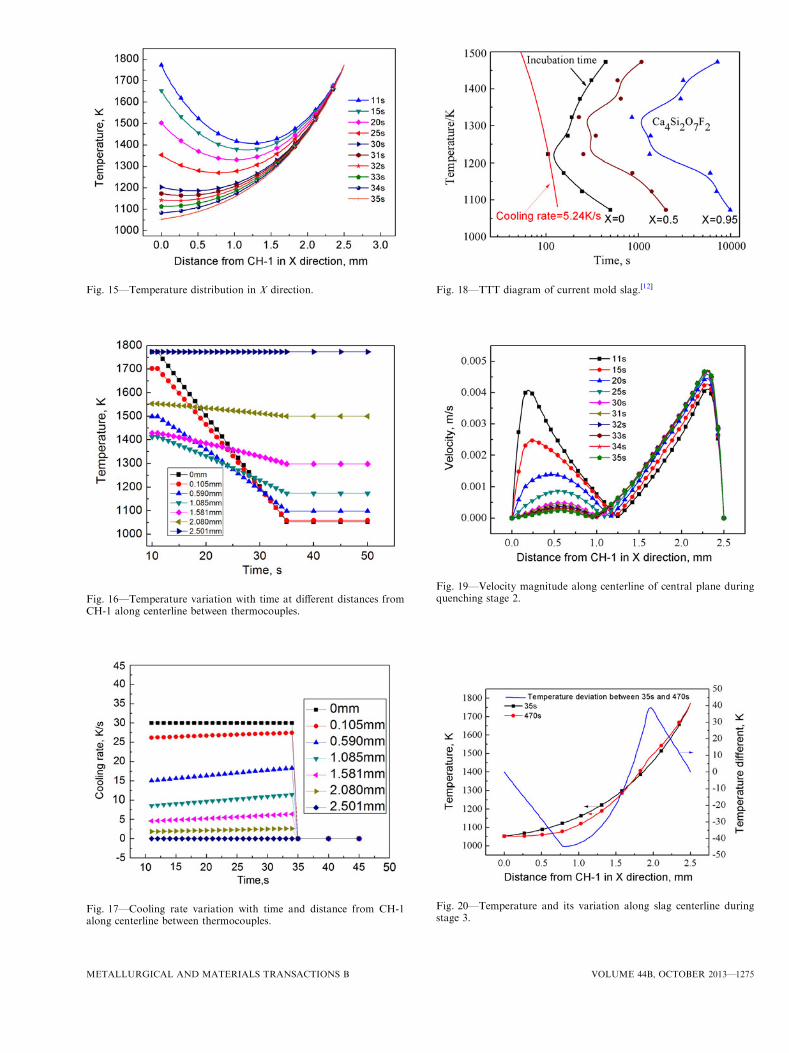
Fig. 15—Temperature distribution in X direction.
Fig. 16—Temperature variation with time at different distances fromCH-1 along centerline between thermocouples.
Fig. 17—Cooling rate variation with time and distance from CH-1along centerline between thermocouples.
Fig. 18—TTT diagram of current mold slag.[12]
Fig. 19—Velocity magnitude along centerline of central plane duringquenching stage 2.
Fig. 20—Temperature and its variation along slag centerline duringstage 3.
METALLURGICAL AND MATERIALS TRANSACTIONS B VOLUME 44B, OCTOBER 2013—1275
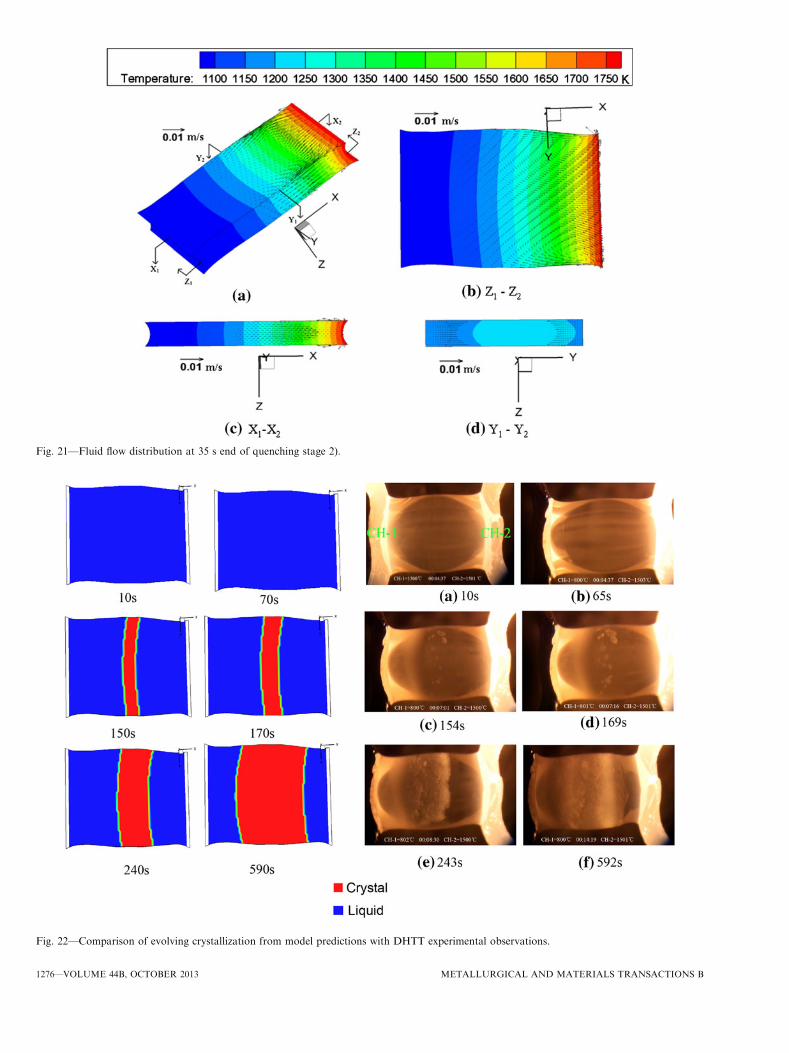
Fig. 21—Fluid flow distribution at 35 s end of quenching stage 2).
Fig. 22—Comparison of evolving crystallization from model predictions with DHTT experimental observations.
1276—VOLUME 44B, OCTOBER 2013 METALLURGICAL AND MATERIALS TRANSACTIONS B
growth agrees reasonably well with the DHTT experi-ment measurements.
VI. CONCLUSIONS AND FUTURE WORK
A three-dimensional numerical model has been devel-oped to simulate the process of mold slag crystallizationin the DHTT experiment. This model includes heattransfer, fluid flow, and isothermal crystallization basedon a JMA model of measurements in the correspondingSHTT experiment. The model predictions match wellwith many observations of the experiments. The simu-lation results identify the importance of non-uniformtemperature distribution in these experiments and fluidflow and crystal transport due to Marangoni forces and
natural convection. Specific conclusions are summarizedas follows:
(1) During the preheating stage 1, although both ther-mocouples were kept at the same temperature, andthe small sample has a very fast (<0.1 second)thermal response, the temperature distribution inthe mold slag was non-uniform; temperature in themiddle of the mold slag drops significantly, to~350 K (~77 �C) lower than both thermocouples.This non-isothermal behavior complicates the cor-rect extraction of TTT curves from the experimentalmeasurements.
(2) During the quenching stage 2, the curved tempera-ture profile decreases with the cooling thermocou-ple. The cooling rate is the greatest at the coldthermocouple (like mold wall) and decreases to zeroat the hot thermocouple (like steel shell).
(3) During the holding stage 3, crystallization of thecentral layer introduces a higher thermal resistancein the middle of the mold flux, which slightly lowersheat flux across the sample, creates nonlinear tem-perature gradients, and makes the hotter half hotterand the cooler half cooler.
(4) Fluid flows from the hotter region to the coolerregion along the surface of the mold slag sample andthen recirculates back from the cooler region to thehotter region through the interior, driven byMarangoni flow and natural convection. Slagvelocities reach 7 mm/s. This explains the observedmovement of crystalline aggregations in molten slagin the small lump-shaped DHTT sample, which isdominated by surface effects. This behavior in theexperiment differs from the commercial continuouscasting process, where the slag is a thin sheet andfluid flow is driven mainly by other forces such asmold oscillation and shell withdrawal.
(5) The crystallization model correctly predicts the timeof onset of crystal formation in the middle of themold slag sample and growth of the crystallizedlayer toward both thermocouples.
Considering that thermal fluid flow affects the crys-tallization of the mold slag and crystallization in turnaffects fluid flow, conduction, and radiation, these
Table AI. Temperature Dependence of Surface Tensions
of Pure Components[24]
Oxide
Temperature (K)Dependence ofSurface Tension
(mN/m)
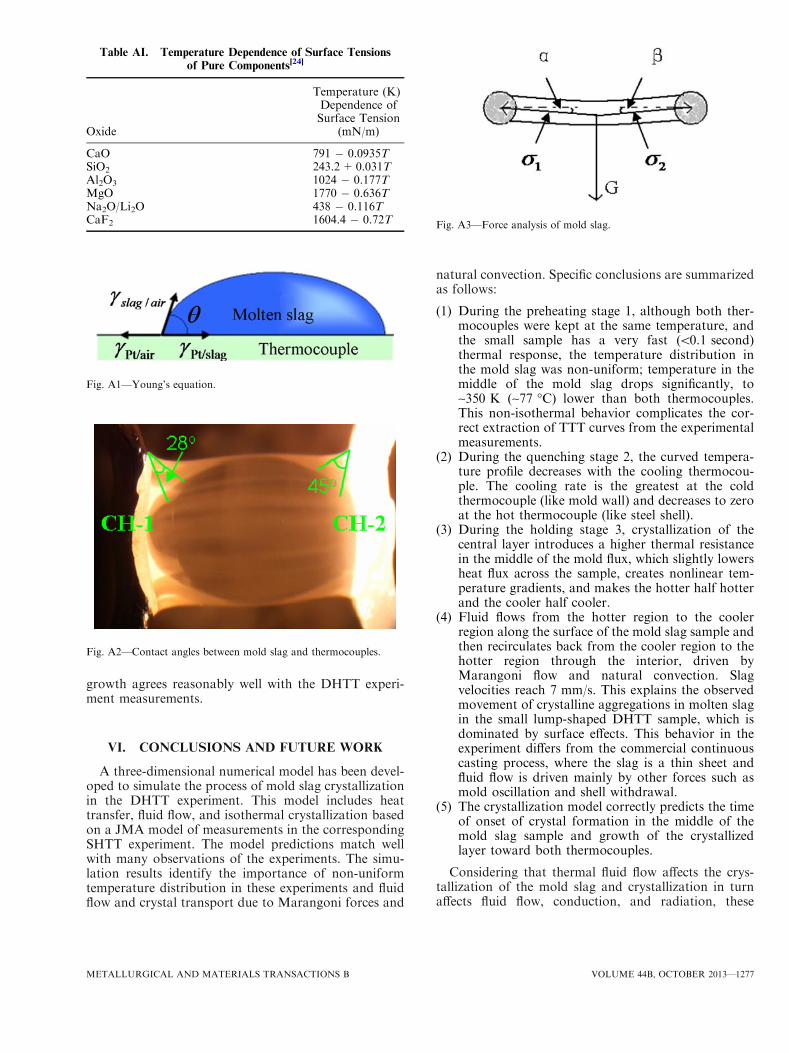
CaO 791 � 0.0935TSiO2 243.2+0.031TAl2O3 1024 � 0.177TMgO 1770 � 0.636TNa2O/Li2O 438 � 0.116TCaF2 1604.4 � 0.72T
Fig. A1—Young’s equation.
Fig. A2—Contact angles between mold slag and thermocouples.
Fig. A3—Force analysis of mold slag.
METALLURGICAL AND MATERIALS TRANSACTIONS B VOLUME 44B, OCTOBER 2013—1277

coupled interactions should be incorporated in futuremodels to enable more accurate predictions.
ACKNOWLEDGMENTS
The authors wish to thank the National ScienceFoundation of China (51274244), China ScholarshipCouncil, and the Continuous Casting Consortium atthe University of Illinois at Urbana-Champaign forsupport of this project.
APPENDIX: SURFACE TENSION FORCEBALANCE TO FIND SAMPLE SHAPE
Most of the geometry profile of the mold slag in theDHTT experiment can be determined from the topview snapshot from the recorded video, as shown inFigure 3(a). However, the possible deformation (sag-ging) of the mold slag sample due to gravity cannot beobserved directly. This deformation is instead calculatedby a force balance.
The surface tension of the mold slag was estimatedusing a partial molar approach[25]:
cslag=air ¼X
xici ¼ 624:36� 0:12T ½A1�
where cslag=air is the surface tension of the mold slag, Xi ismole fraction of each pure mineral component in theflux from Table I, and ci is the temperature-dependentsurface tension of each molten mineral, given inTable AI.[24] From Eq. [A1], the surface tension gradientcan be calculated as �0.00012 N/m/K.
The surface tension of the type B thermocouple in airwas taken to be that of Pt as follows[26]:
cPt=air ¼ 1746� 0:307 ½T� 2043 K ð1770 �CÞ� ½A2�
Hence, according to Young’s Eq. [A3],
cPt=slag ¼ cPt=air � cslag=air cos h ½A3�
where cPt=slag is interface tension between the thermo-couple and molten slag and h is contact angle betweenthe thermocouple and molten slag.
Those contact angles were measured directly from theexperimental video screenshot as shown in Figure A2.
Left thermocouple (CH-1): contact angle atT1 = 1073 K (800 �C) is h1 ¼ 28 deg:Right thermocouple (CH-2): contact angle atT2 = 1773 K (1500 �C) is h2 ¼ 45 deg:
Therefore, adding the temperature T1 = 1073 K(800 �C) and T2 = 1773 K (1500 �C) into Eq. [A3],the mold slag surface tensions at CH-1 and CH-2 arec1Pt=slag ¼ 1606:14 mN/m and c2Pt=slag ¼ 1537:73 mN/m ,respectively.
To find the geometry of the mold slag after deformingdue to gravity, the angles a and b, which are thedeviation angles from the horizon line as shown in
Figure A3, are obtained by the force balance pictured inFigure A3.The gravity force G is calculated as follows:
G ¼ mg ¼ qVg ¼ 4:61� 10�5 N ½A4�
where m is mass, g is gravity acceleration 9.8 m/s2, q isdensity (2550 kg/m3 was chosen here), and V is volumeof the mold slag sample 2:5� 2:17� 0:34 mm3:The interfacial adhesive forces between the mold slag
and thermocouples are
r1 ¼ c1Pt=slag � L1 ½A5�
r2 ¼ c2Pt=slag � L2 ½A6�
where L1 and L2 are the contact lines between the slagand thermocouples and L1 = L2 = 2.17+0.34+0.34+2.17 = 5.02 mm.Hence, r1 ¼ 8:06� 10�3 N, r2 ¼ 7:72� 10�3 N:From Figure A3, the force balance equations are
r1 � cos a ¼ r2 � cos b ½A7�
r1 � sin aþ r2 � sin b ¼ G ½A8�
So, a ffi b ¼ 0:17 deg:Therefore, with small angles a and b, the deformation
(sagging) of the mold slag sample due to gravity is alsovery small and could be ignored in this study. The finalgeometry is shown in Figure 5.
REFERENCES1. K.C. Mills, A.B. Fox, Z. Li, and R.P. Thackray: Ironmaking
Steelmaking, 2005, vol. 32 (1), pp. 26–34.2. Y. Meng, B.G. Thomas, A.A. Polycarpou, H. Henein, and
A. Prasad: MS & T 2004 Conference Proceeding, New Orlean, LA,AIST, Warrendale, PA, 2004, pp. 57–67.
3. Y. Kashiwaya, C.E. Cicutti, A.W. Cramb, and K. Ishii: ISIJ Int.,1998, vol. 38 (4), pp. 348–56.
4. Y. Kashiwaya, C.E. Ciutti, and A.W. Cramb: ISIJ Int., 1998,vol. 38 (4), pp. 357–65.
5. H. Nakada and K. Nagata: ISIJ Int., 2006, vol. 46 (3), pp. 441–49.6. J.W. Cho and S.Y. Kim: J. Korean Inst. Met. Mater., 2004, vol. 42
(3), pp. 302–03.7. A.W. Cramb: Report: American Iron and Steel Institute, Technol-
ogy Roadmap Program, Pittsburgh, PA, 2003.8. G. Wen, H. Liu, and P. Tang: J. Iron. Steel Res. Int., 2008, vol. 15
(4), pp. 32–37.9. J.L. Klug, R. Hagemann, N.C. Heck, A.C.F. Vilela, and H.P.
Heller: Technol. Metal. Mater. Miner. Sao Paulo, 2012, vol. 9 (1),pp. 30–36.
10. N. Kolbl, I. Marschall, and H. Harmuth: J. Mater. Sci., 2011,vol. 46 (19), pp. 6248–54.
11. ANSYS, Inc.: ANSYS FLUENT 13.0 Getting Started Guide,Published, 2010.
12. L. Zhou, W. Wang, D. Huang, J. Wei, and J. Li: Metall. Mater.Trans. B, 2012, vol. 43B, pp. 925–36.
13. ANSYS, Inc.: ANSYS FLUENT 13.0 Theory Guide, Published inthe U.S.A., 2010.
14. N.X. Sun, X.D. Liu, and K. Lu: Scripta Mater., 1996, vol. 34,pp. 1201–07.
15. L. Zhou, W. Wang, F. Ma, J. Li, J. Wei, H. MatsuuraF. Tsuhihashi: Metall. Mater. Trans. B, 2012, vol. 43B, pp. 354–62.
1278—VOLUME 44B, OCTOBER 2013 METALLURGICAL AND MATERIALS TRANSACTIONS B

16. Y. Meng and B.G. Thomas: Metall. Mater. Trans. B, 2003,vol. 34B, pp. 707–25.
17. J.A. Dantzig and C.L. Tucker: Modeling in Materials Processing,Cambridge University Press, New York, 2001.
18. Y. Meng and B.G. Thomas: ISIJ Int., 2006, vol. 45 (5), pp. 660–69.
19. K.C. Mills, A.B. Fox, R.P. Thackray, and Z. Li: VII InternationalConference on Molten Slags Fluxes and Salts, The South AfricanInstitute of Mining and Metallurgy, Cape Town, 2004, pp. 713–22.
20. K. Gu, W. Wang, L. Zhou, F. Ma, and D. Huang: Metall. Mater.Trans. B, 2012, vol. 43B, pp. 943–55.
21. W. Wang and A.W. Cramb: ISIJ Int., 2005, vol. 45 (12), pp. 1864–70.
22. R.J. O’Malley and J. Neal: International Conference on NewDevelopments in Metallurgical Process Technology, Dusseldorf,Germany, 1999, pp. 188–95.
23. H. Nakada, M. Susa, Y. Seko, M. Hayashi, and K. Nagata: ISIJInt., 2008, vol. 48 (4), pp. 446–53.
24. C. Orrling and A.W. Cramb: Metall. Mater. Trans. B, 2000,vol. 31B, pp. 403–06.
25. K. Mills: Short Course as Part of Southern African Pyrometal-lurgy, 2011, pp. 1–49.
26. K.C. Mills and Y.C. Su: Int. Mater. Rev., 2006, vol. 50 (6),pp. 329–51.
27. D. Ye and J. Hu: Handbook of Thermodynamic Data for InorganicMaterials, Metallurgical Industry Press, Beijing, 2002.
28. R.M. McDavid and B.G. Thomas: Metall. Mater. Trans. B, 1996,vol. 27B, pp. 672–85.
29. V.N. Neelakantan, S. Sridhar, K.C. Mills, and D. Sichen: Scand.J. Metall., 2002, vol. 31 (3), pp. 191–200.
30. Y. Meng and B.G. Thomas: Metall. Mater. Trans. B, 2003,vol. 34B, pp. 685–705.
31. K.C. Mills and S. Sridhar: Ironmaking Steelmaking, 1999, vol. 26(4), pp. 262–68.
32. S.A. Nelson and I.S.E. Carmichael: Contributions Mineral. Petrol.,1979, vol. 71, pp. 117–24.
33. C. Robelin and P. Chartrand: Metall. Mater. Trans. B, 2007,vol. 38B, pp. 881–92.
34. M. Hanao, T. Tanaka, M. Kawamoto, and K. Takatani: ISIJ Int.,2007, vol. 47 (7), pp. 935–39.
METALLURGICAL AND MATERIALS TRANSACTIONS B VOLUME 44B, OCTOBER 2013—1279