computational modeling of high-frequency oscillations at
TRANSCRIPT

Computational modeling of high-frequency oscillations
at the onset of neocortical partial seizures: from ’altered
structure’ to ’dysfunction’.
Behnam Molaee-Ardekani, Pascal Benquet, Fabrice Bartolomei, Fabrice
Wendling
To cite this version:
Behnam Molaee-Ardekani, Pascal Benquet, Fabrice Bartolomei, Fabrice Wendling. Compu-tational modeling of high-frequency oscillations at the onset of neocortical partial seizures:from ’altered structure’ to ’dysfunction’.. NeuroImage, Elsevier, 2010, 52 (3), pp.1109-22.<10.1016/j.neuroimage.2009.12.049>. <inserm-00443065>
HAL Id: inserm-00443065
http://www.hal.inserm.fr/inserm-00443065
Submitted on 4 Jan 2010
HAL is a multi-disciplinary open accessarchive for the deposit and dissemination of sci-entific research documents, whether they are pub-lished or not. The documents may come fromteaching and research institutions in France orabroad, or from public or private research centers.
L’archive ouverte pluridisciplinaire HAL, estdestinee au depot et a la diffusion de documentsscientifiques de niveau recherche, publies ou non,emanant des etablissements d’enseignement et derecherche francais ou etrangers, des laboratoirespublics ou prives.
brought to you by COREView metadata, citation and similar papers at core.ac.uk
provided by HAL-Rennes 1


Computational modeling of high-frequency oscillations at the onset of neocortical partial seizures:
from ‘altered structure’ to ‘dysfunction’
Behnam Molaee-Ardekani1,2, Pascal Benquet 3, Fabrice Bartolomei 4,5,6, Fabrice Wendling 1,2,*
1 INSERM, U642, Rennes, F-35000, France
2 Université de Rennes 1, LTSI, F-35000, France
3 Université de Rennes 1, UMR CNRS 6026, F-35000, France
4 INSERM, U751, Marseille, F-13000, France
5 AP-HM, Hôpital de la Timone, Service de Neurophysiologie Clinique, Marseille, F-13000, France
6 Aix Marseille Université, Faculté de Médecine, Marseille, F-13000, France
First author: [email protected]
* Corresponding author: [email protected]
Submitted to Neuroimage – Revised Version Special issue on ‘Computational models of the brain: From structure to function’
December 2009

2
Abstract: In this paper, a neural mass model is proposed to analyze some mechanisms un-
derlying the generation of fast oscillations (80 Hz and beyond) at the onset of seizures. This
model includes one sub-population of pyramidal cells and one sub-population of interneurons
targeting the perisomatic region of pyramidal cells where fast GABAergic currents are medi-
ated. We identified some conditions for which the model can reproduce the features of high-
frequency, chirp-like (from ~100 Hz to ~70 Hz) signatures observed in real depth-EEG sig-
nals recorded in epileptic patients at seizure onset (“fast onset activity”). These conditions in-
cluded appropriate alterations in i) the strengths of GABAergic and glutamatergic connec-
tions, and ii) the amplitude of average EPSPs/IPSPs. Results revealed that a subtle balance
between excitatory and inhibitory feedbacks is required in the model for reproducing a ‘realis-
tic’ fast activity, i.e., showing a reduction of frequency with a simultaneous increase in ampli-
tude, as actually observed in epileptogenic cerebral cortex. Results also demonstrated that the
number of scenarios (variation, in time, of model parameters) leading to chirp-like signatures
was rather limited. First, to produce high-frequency output signals, the model should operate
in a “resonance” region, at the frontier between a stable and an unstable region. Second both
EPSP and IPSP amplitudes should decrease with time in order to obey the fre-
quency/amplitude constraint. These scenarios obtained through a mathematical analysis of the
model show how some alteration in the structure of neural networks can lead to dysfunction.
They also provide insights into potentially-important mechanisms for high-frequency epilep-
tic activity generation.
Keywords: Neural mass model, fast onset activity, focal seizures, partial epilepsy, fast inhibi-
tory interneurons, high-gamma, chirp.

3
1. Introduction
Focal seizures recorded in patients with partial epilepsy are often characterized by the oc-
currence, at their onset, of a typical electrophysiological pattern marked by the appearance of
sustained (several seconds) high-frequency oscillations (60-100 Hz). This pattern, also re-
ferred to as “rapid discharge” (Bancaud et al., 1970; Talairach et al., 1992), has long been ob-
served in stereoelectroencephalographic (SEEG) signals recorded with intracerebral elec-
trodes (depth-EEG) during pre-surgical evaluation of drug-resistant partial epilepsies (Allen et
al., 1992; Fisher et al., 1992; Traub et al., 2001; Wendling et al., 2003). During the past dec-
ade, the fast activity observed at seizure onset has received increased attention. Indeed, most
epilepsy units are now equipped with recording systems allowing for high-frequency sam-
pling of EEG, ECoG (electrocorticography) or SEEG signals (up to 1 kHz in clinical routine).
Therefore, since the first recordings performed in the 90s (Allen et al., 1992; Fisher et al.,
1992), a number of reports have shown the potential relevance of high-frequency oscillations
in the study of the epileptogenic zone (Traub, 2003) and in the subsequent definition of the
surgical therapy aimed at suppressing seizures or at significantly reducing their frequency. In-
deed, in the study of (Alarcon et al., 1995), as the authors analyzed the power spectrum of
ictal intracranial EEG signals, they could relate the surgical outcome with the resection of
brain sites where localized high-frequency activity was generated. Results showed that the
removal of such sites could be associated to favorable prognosis. In (Lee et al., 2000), neocor-
tical seizure-onset patterns recorded with intracranial electrodes were analyzed in 53 patients
candidate to resective epilepsy surgery. Among the observed electrophysiological patterns,
extratemporal and regional onset were more commonly associated with low voltage fast activ-
ity (in the gamma range) and were more often characterized by favorable outcome. Later, spa-

4
tio-temporal correlations in human intracerebral EEG signals measured during rapid dis-
charges were studied using a cross-correlation analysis in the classical frequency sub-bands of
the EEG (Wendling et al., 2003). Results revealed a “de-correlation” phenomenon that can be
interpreted as a functional decoupling of distant brain sites at seizure onset followed by an
abnormally high re-coupling when the seizure develops. More recently, in order to objectively
identify epileptogenic brain structures, a quantity called the “epileptogenicity index” and
computed from intracerebral recordings was proposed and evaluated in 17 patients with tem-
poral lobe epilepsy (Bartolomei et al., 2008). It is noteworthy that the energy associated to
high frequencies during the rapid discharge at the onset of seizures is one of the main contrib-
uting features in this index.
Consequently, in humans, data about the relationship between fast activity and epilepto-
genic nature of the brain tissue that generates this activity has accumulated. However, so far,
the mechanisms underlying the generation of fast oscillations at the onset of seizures remain
elusive. In mesio-temporal epilepsies, although observed discharges are of lower frequency
than those observed in the neocortex, results from computational studies (Wendling et al.,
2002; Wendling et al., 2005) demonstrated that the transition from interictal to ictal activity
can be explained by time-varying synaptic interactions between pyramidal cells and interneu-
rons with slow and fast GABAA kinetics. In addition, the appearance of the rapid discharge at
seizure onset is explained by an abrupt drop of dendritic inhibition and a crucial role of in-
terneurons targeting the perisomatic region of pyramidal cells. Interestingly, in line with these
findings from computational modeling, a recent experimental study performed in the isolated
brain preparation showed that in the superficial neurons of the entorhinal cortex, the fast onset
activity is correlated with rhythmic inhibitory-post synaptic potential IPSPs (Gnatkovsky et
al., 2008). Authors concluded that in their acute model of ictogenesis, inhibitory networks
have a prominent role in the transition to seizure activity. In human focal neocortical epilep-

5
sies, only few studies have addressed the potential mechanisms. Using detailed network simu-
lations, it has been hypothesized that gap junctions could play a role in very fast EEG oscilla-
tions (Traub, 2003; Traub et al., 2001).
In this paper, we report a study of electrophysiological patterns showing high frequency os-
cillations (70 Hz and beyond) using a physiologically-plausible neural mass model of the
cerebral cortex. We show that this model can reproduce chirp-like spectrographic signatures
(Schiff et al., 2000) actually observed in human data quite accurately. In addition, results
demonstrated that the number of scenarios (variation, in time, of model parameters) leading to
these signatures is rather limited. These scenarios obtained through a mathematical analysis of
the model provide insights into potentially-important mechanisms for high-frequency epilep-
tic activity generation and show how the alteration of the structure of neural networks leads to
their dysfunction.
2. Methods and material
2.1. The model
2.1.1. Level of modeling
In order to simulate signals generated in the cerebral cortex, we designed a physiologically-
plausible computational model the level of which is that of the neuronal assembly (“neural
mass”). This means that our model considers the average activity of interconnected sub-
populations of principal neurons and interneurons without explicit representation of mecha-
nisms lying at the level of single cells, conversely to detailed models. Although macroscopic,
these models rely on neurophysiological data and have two essential features. First, their pa-

6
rameters relate to excitatory and inhibitory processes taking place in the considered neuronal
tissue. Second, the temporal dynamics of their output (analogous to a local field activity) can
be directly compared to those reflected in real signals recorded with electrodes located in the
cerebral cortex. Indeed, it can be assumed that field potentials reflect overall dynamics rising
from interconnected populations of principal neurons and interneurons.
This type of approach was first described theoretically by Wilson and Cowan (Wilson HR,
1973). Nunez (Nunez, 1974), Freeman (Freeman, 1978) and Lopes Da Silva (Lopes da Silva
et al., 1974; Lopes da Silva et al., 1976) were the first to use it for interpretation of
electrophysiological data. During the past decade, an increasing number of studies made use
of this class of models in various neurophysiological or clinical studies. Jansen et al. (Jansen
BH, 1995; Jansen BH, 1993) proposed a lumped-parameter model of the visual cortex to
study the generation of evoked potentials. In the context of epilepsy, Wendling et al. showed
their relevance for interpretation of interdependence measures (Wendling et al., 2001; Wend-
ling et al., 2000) and then elaborated a model describing the hippocampus activity in TLE
(Wendling et al., 2002; Wendling et al., 2005). Suffczynski et al. (Suffczynski et al., 2004)
investigated the mechanisms of transition between normal EEG activity and epileptiform
paroxysmal activity using a computational macroscopic model of thalamocortical circuits.
Robinson et al. used this type of modeling approach to study epileptic seizures and different
normal EEG rhythms such as slow-wave sleep, alpha and low-gamma waves (Breakspear et
al., 2006; Rennie et al., 2000; Robinson et al., 2002; Robinson et al., 2003). Steyn-Ross et al.
(Steyn-Ross et al., 2004), Bojak and Liley (Bojak and Liley, 2005) and Molaee-Ardekani et
al. (Molaee-Ardekani et al., 2007) included some different underlying mechanisms of EEG
signals (synaptic and ionic mechanisms) during general anesthesia in similar mean-field mod-
els, and simulated EEG signals in different depths of anesthesia. The readers may also refer to
7
(Deco et al., 2008) for a recent review on models of brain dynamics, including neural mass
and mean field descriptions.
In this study, the macroscopic modeling approach we followed required a description of
both the different sub-populations of cells present in the cerebral cortex and the synaptic in-
teractions among these sub-populations. Therefore, in order to design the model, we started
from neurophysiological data about neuronal organization and connectivity of the cerebral
cortex. The main features were obtained from the literature, synthetically reviewed in appen-
dix A.
2.1.2. Formal description of the model
2.1.2.1. Model structure and equations
As illustrated in figure 1, the model accounts for the main salient features we found about
the cyto-architecture of the cerebral cortex, and includes the following sub-populations: i) py-
ramidal cells ( ), ii) soma- and proximal- dendrite-targeting cells (P I : basket cells and chan-
delier cells mediating GABAA,fast currents), and iii) dendrite-targeting cells ( I ′ : neurogliaform
cells mediating GABAA,slow and GABAB currents). Therefore, the contribution of bitufted,
double bouquet, stellate cells and martinotti cells to the network activity is not represented in
the model.
According to the neural mass modeling approach, a pulse-to-wave function transforms the
average pre-synaptic pulse density of afferent action potentials (input) into an average postsy-
naptic membrane potential (output) whereas a wave-to-pulse function relates the average
postsynaptic potential to an average pulse density of potentials fired by the neurons, at the
level of each sub-population (Jirsa and Haken, 1996).

8
The pulse-to-wave function is represented by a 2nd order linear transfer function impulse re-
sponse where W and are amplitude and rate constant of the average receptor-
mediated postsynaptic potential, respectively, denoted as
wth t Wtwe−=( ) w
A a, in the excitatory case (AMPA)
and as (GABAA,slow), G (GABAA,fast) and (GABAB) in the inhibitory case. B b, g, D d,
The wave-to-pulse function for given sub-population X is modeled by a static nonlinear
function of sigmoid shape 1 X X vX X
rS v Q e θ −= + ( )max( ) ( ) to represent saturation and threshold ef-
fects taking place at the soma (see the legend of table 1 for parameter values).
Besides synaptic transmission, interactions between neuronal sub-populations are also
characterized in the model by connectivity constants ( ) which
account for the average number of synaptic contacts or “connection strength” between con-
sidered sub-populations. In addition, the non specific influence from neighboring or distant
populations is represented by a Gaussian input noise corresponding to an excitatory input
PP PI IP IIC C C C, , , , PI I P I I I IC C C C′ ′ ′ ′ ′, , ,
0p t p N σ= +( ) ( , ) ( 90p = , ) that globally describes the average density of afferent action
potentials.
30σ =
Model equations are derived from the set of pulse-to-wave transfer functions of impulse re-
sponse , as presented above. Each introduces a 2nd order ordinary differential equation of
the form:
h t( )
2
222 Xtt
w w t WwQ tϕ∂ ∂∂∂
+ + =( ) ( ) ( ) where and XQ t( ) tϕ( ) are the respective input (afferent
pulse density) and output (average postsynaptic membrane potential) signals. The set of sec-
ond order stochastic nonlinear ordinary differential equations obtained for all synaptic interac-
tions present in the model was numerically solved using a fixed step ( ) forth-order
Runge-Kutta method.
1t mΔ = s
Finally, regarding the model output, summated postsynaptic potentials on pyramidal cells
can be interpreted as a field potential. The corresponding simulated signal will be considered

9
as the main model output. Other possible model outputs can be the postsynaptic activity or the
firing rate at the level of each sub-population.
2.1.2.2. Time constants of glutamatergic and GABAergic PSPs
In addition to connectivity parameters, time constants (i.e. 1/ with w = a, b, d, and g) are
crucial parameters as they define cut-off frequencies of functions that can be seen as im-
pulse responses of low-pass filters. Therefore, it is essential that these parameters are adjusted
in a “physiological” range.
w
( )h t
It is noteworthy that, in the proposed model, the time constant used in a given func-
tion (either excitatory or inhibitory) determine both the rise time (trise) and the decay time (tde-
cay) of its impulse response mimicking the PSP (as h is a second order transfer function). In
general, trise is defined as the time going from zero to the time corresponding to the maximum
value of the PSP (PSPmax). tdecay is defined as the time required for the PSP to reach the value
PSPmax/exp(1). In our model where , it can be shown that the time constant 1/w
is equal to trise and that tdecay = 3.146 / w indicating that the decay of the modeled PSP is about
three times longer than its rise.
( )h t
wth t W w t e−=( ) . . .
Regarding EPSPs, it is known that excitatory synaptic transmission is primarily mediated
by ionotrophic glutamate receptors: AMPA, NMDA and kainite. As reported in (Kidd and
Isaac, 1999), fastest components of the EPSPs are mediated by AMPA receptors. Many stud-
ies have reported accurate measurements of EPSP features. For instance, AMPA-mediated
EPSPs in neocortical pyramidal neurons are shown in (Nettleton and Spain, 2000). Typically,
trise is equal to 4.5 to 7.5 ms and tdecay is about 20 ms for a total duration of about 40 ms (re-
turn to baseline). According to these values, we adjusted the value of at about 5.5 ms. a/1
Regarding IPSPs, we found less studies as these potentials are technically more difficult to
measure than EPSPs. In general, IPSCs are easier to evaluate. Nevertheless, regarding

10
GABAA,fast and GABAA,slow synapses, the work performed by Pearce and colleagues (Czeiger
and White, 1993; Pearce, 1993) allowed us to adjust the corresponding time constants (1/g
and 1/b, respectively). In particular, the paper by (Hardie and Pearce, 2006) shows the fea-
tures of both the IPSCs and the IPSPs corresponding to fast and slow inhibition mediated at
the level of GABAA receptors. The study reported in (Thomson et al., 1996) also provides
some temporal properties (rise time 10-90% = 2.71 ± 0.6 ms, width at half amplitude =
14.72 ± 3.83 ms) of averaged IPSPs triggered by fast spiking interneurons and recorded in
neocortical pyramidal cells. Based on these studies, we determined that time constants
and could be adjusted in the two intervals [30, 70] ms and [3, 8] ms, respectively. Finally,
GABAB-mediated IPSPs are much longer than GABAA-mediated IPSPs. In the study reported
in (Deisz, 1999) performed in neocortical neurons of the rat in vitro, the time-course of the
isolated IPSPB was measured under various conditions (including control). These data indi-
cate that the value of can vary from 200 to 400 ms.
b/1
g/1
d/1
The values of time constants of glutamatergic and GABAergic PSPs we used in the model
are summarized in table 1, along with the corresponding rise and decay times, as defined
above.
2.2. Mathematical analysis of the fast inhibitory loop in the model
In this study, we focus on a reduced model that corresponds to the loop between pyramidal
cells and basket cells. A prior general investigation (not reported) showed that the fast activity
is generated in this loop and that type I ′ interneurons (neurogliaform, GABAA,slow and
GABAB synaptic interactions) do not contribute to high frequency oscillations. Figure 2 illus-
trates the structure of the reduced model that is investigated. Such a model structure is, more
or less, consistent with previously published models (Rennie et al., 2000), but with a major

11
difference that the inhibitory synaptic interactions are established by GABAA,fast rather than
GABAA,slow.
In the following, we first summarize the differential equations of the reduced model and
describe the method we used to obtain the equilibrium points of this model. Then, we give the
formula of the eigenspectrum of the output signal for stable state. A special attention is paid
to the resonance characteristics of the model as they determine the presence of a high-
frequency component in the output signal.
2.2.1. Differential equations of the model and the equilibrium solution
In the reduced model, the connections among pyramidal cells and type-I interneurons allow
us to establish the following four linked equations:
2
222 Ptt
a a t AaQ tϕ∂ ∂∂∂
+ + =( ) ( ) ( )P (1)
2
222 Itt Ig g t GgQϕ∂ ∂
∂∂+ + =( ) ( ) t( )
)f
)I
(2)
(3) (P P IP PP IPQ t S C t C t tpϕ ϕ= − +( ) ( ) ( ) ( )
(I PI PI IIQ t S C t C tϕ ϕ= −( ) ( ) ( ) (4)
where is the strength of connection between sub-population XYC X and Y . is the pulse
density of sub-population
XQ t( )
X and X tϕ ( ) is its average membrane potential. is the sigmoid
wave-to-pulse function.
XS
A , are EPSP and IPSP amplitudes, and a , G g are EPSP and IPSP
rate constants. Finally, is the response of the h-function (i.e. “filtered noise”) to the ex-
citatory input driving noise
f tp ( )
tp( ) , which is expressed by the following differential equation:
2
222 ftt
a a t Aa tp p∂ ∂∂∂
+ + =( ) ( ) ( ) (5)
The output signal of the model is obtained by summation of postsynaptic membrane po-
tentials on pyramidal sub-population as follows:
tv( )

12
P IPP IPt C t C t tpv fϕ ϕ= − +( ) ( ) ( ) ( ) (6)
To calculate equilibrium solution of the model all and the variance of the input noise
were set to zero in equations
/ t∂ ∂
(1)-(5). This yields the following equations:
( ) , whereP P PP P IP I f fQ S C C A ap p pϕ ϕ= − + = (7)
( ) II I PI P II I
gQ S C C
Gϕϕ ϕ= − = (8)
The bar symbol in the above equations indicates that model variables are not time-
dependent anymore. If Pϕ is treated as an independent variable, by the use of equation (7), Iϕ
can be estimated as a function of Pϕ as written below (the hat symbol indicates the estima-
tion):
1 1PI P
P PP PP f IP
AQC
ap
rθϕ ϕ
ϕ⎛ ⎞⎜= − + − + +⎜⎝ ⎠
maxln( ) /ˆ C⎟
⎟ (9)
On the other hand, in a similar way, Pϕ can be estimated from equation (8) as a function of
the estimated Iϕ (i.e. ˆIϕ in the above equation) as follows:
1 1IP
I III II PI
GQC C
grθϕ
ϕ⎛ ⎞⎜= − − +⎜⎝ ⎠
maxln( ) /ˆ
ˆ ϕ ⎟⎟
ˆ (10)
The equilibrium solution of the Pϕ variable is a Pϕ value that minimizes ˆP Pϕ ϕ− . This
equilibrium value, denoted by Pϕ• , and its corresponding Iϕ• value were found numerically us-
ing the so-called ‘fzero’ function in MATLAB®.
2.2.2. Stability, eigenspectrum and resonance features
For small deviations from a stable equilibrium state a nonlinear dynamical system can be
well approximated by the corresponding linear system derived by linearizing the system about

13
that equilibrium state. Then it is straightforward to take the Fourier transform of the transfer
function of the linearized model to obtain the eigenspectrum as follows: VP ω( )
2
V Ta
aAP VL
σω ωω
=( ) ( )( )
(11)
where,
( )1 1 2
2 1 1 21
PP g PP II IP PIT
a g II a PP g PP II IP PI
Aa C L c Ggc c C C C CV
L L Ggc C L Aac C L AaGgc c C C C C
ωω
ω ω ω ω
+ −= +
+ − − −
( ) ( )( )
( ) ( ) ( ) ( ) ( ) (12)
2aL i aω ω= +( ) ( ) 2
gL i gω ω= +( ) ( ), and , are steepness values of sigmoid functions relat-
ing to pyramidal and interneuron sub-populations, respectively, at their equilibrium states.
These values are expressed as follows:
1c 2c
( )
( )( )1 21
PP P IP I f
P P
P
P P
P x C C p
Q xc
x
r r
rϕ ϕ
θ
θ • •= − +
−=
− +
max exp ( )
exp ( ) (13)
( )
( )( )2 21
PI P II I
I I
I
I I
I x C C
Q xc
x
r r
rϕ ϕ
θ
θ • •= −
−=
− +
max exp ( )
exp ( ) (14)
Roots of the denominator of equation (12) determine the stability mode of the model. If the
maximum real part of these roots is a positive value the model is unstable.
An important step in the theoretical analysis is the quantification of the characteristics of
the resonance frequency of the model when free parameters vary. To proceed, the resonance
frequency of is first calculated approximately by obtaining the roots of 4th order poly-
nomial in the denominator of equation
VP ω( )
(12). We used Descartes' cubic resolvent method to ob-
tain the roots analytically. The eigenspectrum may exhibit a resonance frequency if there are
two conjugate complex roots in the solution. The resonance frequency is approximately equal
to the imaginary parts of the complex solutions with the highest real value. This real value de-
14
termines the strength of the resonant frequency. Strongest resonance frequencies correspond
to closest roots to the imaginary line.
To characterize the shape of the eigenspectrum around the resonance frequency, we fitted
the normalized eigenspectrum, that usually appears with only one pair of strong conjugate
complex roots, with a function that combines a Lorentzian resonance at Rf f= of quality
with a power law decay
q
Bf − , i.e.,
2 221 4 1
N
V N NR
K CP fq f f f C
π = ++ − +
( )( / )
(15)
We set 1K = and we fitted parameters in a reasonable limited range ( , and
) by ‘lsqcurvefit’ function in MATLAB®. After fitting the parameters, bandwidth
of the output signal was expressed as
50q < 2 50C ∈ [ , ]
0 25 3N ∈ [ . , ]
2Rf q/( ) . The resonance frequency, total energy of the
output signal and the bandwidth were the three parameters that we used in this study to char-
acterize the output signal. For real signals and for signals simulated by running the model, we
expressed the energy as square of data samples averaged over a 1 s sliding window.
2.3. Real depth-EEG signals
The real depth-EEG signal analyzed here and shown in figure 3 was recorded in a patient
undergoing pre-surgical evaluation of drug-resistant partial epilepsy (Bartolomei et al., 2002).
In this patient, a focal cortical dysplasia was located in the left parietal region. Depth-EEG re-
cordings were performed using intracerebral multiple lead electrodes (10 to 15 leads, length: 2
mm, diameter: 0.8 mm, 1.5 mm apart) placed intracranially according to Talairach's stereotac-
tic method (Bancaud and Talairach, 1973). The intracerebral electrode that recorded the ana-
lyzed depth-EEG signal was positioned in the vicinity of the lesional brain site located in the
inferior parietal lobule. This intracerebral EEG signal was selected because it contained a

15
chirp-like signature (figure 3, white arrow) considered as representative of the type of fast ac-
tivity encountered at the onset of neocortical seizures. This signal was sampled at 512 Hz
were recorded on a DeltamedTM system. No digital filter was used except a hardware analog
high-pass filter (cut-off frequency equal to 0.16 Hz) used to remove very slow variations that
sometimes contaminate the baseline.
3. Results
Results are organized into four main sections. The first section describes the features of
chirp-like signatures observed in real depth-EEG signals at seizure onset. Then, we report the
results about the model investigation, according to the type of parameters under study (con-
nectivity parameters and amplitudes of EPSPs and IPSPs). The last section provides an exam-
ple of simulated fast onset activity based on a scenario obtained from the knowledge acquired
about the model behavior as a function of parameters.
3.1. Frequency, energy and bandwidth of chirp-like signatures observed in
real depth-EEG signals at seizure onset
A magnified view on the transition from pre-ictal activity to seizure onset activity is pro-
vided in figure 4 which shows the raw (unfiltered) depth-EEG signal (figure 4-a) along with
the signal filtered the in frequency band of interest (60-150 Hz, figure 4-b). As depicted in the
time-frequency (T-F) representation given in figure 4-c, it can be observed that the fast onset
activity has very specific features. First, this activity occupies a relatively narrow band of the
T-F plane indicating that it stays quasi-sinusoidal over 7 to 8 seconds. Second, the dominant
frequency gradually decreases from about 100-110 Hz down to 60-70 Hz (chirp-like). Third,
as shown by figure 4-d, the signal energy gradually increases as the frequency decreases. Al-

16
though some variability can be observed from patient to patient, it is noteworthy that the fea-
tures described hereabove are quite representative of the signatures encountered at the onset
of neocortical seizures.
3.2. Resonance characteristics and strength of excitatory/inhibitory
connections
As detailed in section 2.2.2, according to stability and resonance behaviors of the model,
we classified the functioning modes of the model into three main regions: unstable, stable and
resonance regions. In the unstable region, there exists at least one root that takes a positive
real value. In the resonance region, a resonance frequency is observed on the eigenspectrum
of the output signal. In the stable region, the eigenspectrum is a monotonically-decreasing
function of the frequency.
In this section, we report the results about the effects of the strength of connections (i.e.,
) among pyramidal and soma-projecting interneuron sub-populations on the
stability and on the functioning modes of the model. In the first part ( 3.2.1) of this section, the
strength of glutamatergic ( ) and GABAergic ( ) connections is studied sepa-
rately. In the second part ( 3.2.2), we provide the results about the variation of the four connec-
tivity parameters all together.
PP PI IP IIC C C C, , ,
PP PIC C, IP IIC C,
3.2.1. Distinct influence of excitatory and inhibitory connections
As a general observation, we noticed that the ratio between and plays an impor-
tant role and determines, at least in part, the stability status of the model. Indeed, as shown in
figure 5, the increase of this ratio changes the behavior of the model from stable state (dark
grey area) into resonant state (color-coded area) or unstable state (light grey area).
PIC PPC

17
Figure 5-a, 5-b and 5-c illustrate the effects of the strength of glutamatergic connections
(i.e., ) on the functioning modes of the model when the strength of GABAergic con-
nections is kept constant (here, and ). More particularly, they provide the
evolution of some features (5-a: resonance frequency, 5-b: total energy and 5-c: bandwidth) of
the model output signal in the ( ) plan. For more clarity, we give some descriptions
about the contents of figure 5-a in figure 5-g.
PP PIC C,
280IPC = 400IIC =
PP PIC C,
Inside the resonance region, the increase of or the decrease of (see violet arrows
in figure 5-g) increased the resonance frequency and the associated energy (towards darker
red color). Conversely, it reduced the bandwidth of the output signal (towards blue color).
PIC PPC
As shown by equation (12), the two parameters and in excitatory connections
multiply by parameter
PPC PIC
A which represents the amplitude of average EPSPs on pyramidal cells
and on interneurons. Therefore, figure 5 not only indicates the effect of and on reso-
nance characteristics of the model, but also can be used to study the effect of the amplitude of
average EPSPs on the resonance behavior of the model at a given and value.
PIC PPC
PIC PPC
To do so, the features of the output signal (frequency, energy and bandwidth) can be exam-
ined along a straight line which connects a given desired and value to the origin of
and axes. Along this line the ratio remains unchanged (“iso- ra-
tio”) while the absolute values of the two parameters vary. This variation can be interpreted as
the effect of the EPSP amplitude on the model output at a given and parameters.
Some examples of these lines with different ratios have been illustrated in figure 5-
g. It can be inferred from these lines that the EPSP amplitude may increase the resonance fre-
quency as well as the signal energy.
PIC PPC
PIC PPC PI PPC C/ PI PPC C/
PIC PPC
PI PPC C/
Figure 5-d, 5-e and 5-f illustrate the effects of the strength of GABAergic connections (i.e.,
IP IIC C, ) on resonance behavior of the model for fixed strengths of glutamatergic connections

18
(here, and ). Some descriptions about the contents of figure 5-d are given
in figure 5-h. As in the previous case (i.e., the ratio), it could be noticed that the
240PPC = 450PIC =
PI PPC C/
IP IIC C/ ratio was an effective parameter that also determined, in part, the stability of the
model and subsequently the output signal. When this ratio increased, the system moved from
stable to unstable state, possibly through resonance state.
While an increase in IIC decreased the resonance frequency, an increase in IPC increased
the resonance frequency (see violet arrows in figure 5-h). Similarly, these parameters showed
opposite influences on resonance energy and resonance bandwidth. Straight lines (“iso-
IP IIC C/ ratio” depicted in figure 5-h) indicated that the resonance frequency, energy and
bandwidth did not change much with the amplitude of average IPSPs. These straight lines
also indicated that a minimum value of the IPSP amplitude is required for the resonance re-
gion to be formed between the stable and unstable region.
Indeed, results revealed some necessary conditions for which high-frequency oscillations in
the high-gamma band range are generated in the model. As indicated in figure 5-d and 5-h,
first we found that an interconnection (with a minimum value of strength) among basket cells
(i.e., IIC ) was necessary for generation of gamma activity. Second, results showed that the
connection from basket to pyramidal cells (i.e., IPC ) should also be active and should also
have a certain strength for the high-frequency activity to be distributed over the entire py-
ramidal-basket network.
3.2.2. Joint influence of excitatory and inhibitory connections
The previous section provided the results about the model behavior when the strengths of
inhibitory and excitatory connections varied separately. This section reports the results about
the joint influence of connectivity parameters ( ) taken together. PP PI IP IIC C C C, , ,

19
Results are summarized in figure 6 which provides a series of four 3D plots in which the
resonance frequency is shown as a function of for four PP PI IIC C C, , IPC values.
First, regarding the influence of IIC , results showed that the resonance regions in the 2D
planes (i.e., planes) expand and rotate anticlockwise when PP PIC C, IIC increases. This rota-
tion causes the resonance frequency to reduce with IIC at a given pair of and values.
Nevertheless, this reduction with
PPC PIC
IIC does not necessarily mean that, in the model, the lower-
ing of IIC values necessarily leads to the appearance of the maximum reachable resonance
frequency. Indeed, for a fixed IPC value, the reduction of IIC may lead to a reduction of the
resonance region or even to its disappearance. In other words, since the parameter space for
fixed IPC value is 3-dimensional, the expansion and rotation of the resonance region implies
that if IIC increases, one may still find another pair of and values for which the
resonance frequency is as high - or even higher - than before.
PPC PIC
Results also showed that a saturation of the maximum reachable frequency when in-
creases. This effect can be seen in figure 6-a showing that the dark red region (maximum
reachable frequency) depends on the value of . This result indicates that i) a certain degree
of interconnection within interneurons is necessary in order to generate high-frequency oscil-
lations but ii) augmenting too much the strength of such connections may have an opposite ef-
fect, i.e., reducing the frequency. As discussed in section 4, this result shows that a subtle bal-
ance between gains of the feedback loops present in the model seems to be necessary to get
the maximum resonance frequency.
IIC
IIC
Second, regarding the influence of IPC , results revealed that this parameter had opposite ef-
fects on resonance characteristics, compared to IIC . Its increase rotates the 2D resonance re-
gions clockwise, leading to an increase of the resonance frequency at a given and PP PIC C,
IIC . Interestingly, its decrease (to some extent) results in an unchanged value of the resonance

20
frequency if the strength of excitatory connections and connections decrease and in-
crease, respectively. In the other hand, increase of
PPC PIC
IPC shrinks the resonance region, and may
even prevent it to appear.
3.3. Influence of the amplitude of EPSPs and IPSPs
In section 3.2, we described results obtained from the variation of connectivity parameters
(interpreted in neural mass models as “average numbers of synaptic contacts” or “connection
strengths”). In this section, we study the influence of two other important parameters in the
model: average EPSP and IPSP amplitudes (parameters and ). A G
These parameters were found to impact the resonance characteristics of the model, as illus-
trated in figure 7-a to 7-c which provide the features of the output signal (frequency, energy
and bandwidth) as functions of parameters A and . Figure 7-a depicted that the most strik-
ing effect was obtained for variation of
G
A (AMPA-related PSPs) whereas parameter G
(GABAA,fast–related PSPs) did not change the frequency of oscillations. Results showed that
the decrease of A from a high value to a lower one led to the decrease the resonance fre-
quency. However, as already noticed, the sole modification of parameters controlling gluta-
matergic synaptic transmission (either via the connection strength or via the EPSP amplitude)
is not sufficient for accurately reproducing fast onset activities. Indeed, as observed in real
data (figure 4), the decrease in frequency should be accompanied with an increase of signal
energy. In addition, this nonstationarity should occur at “constant bandwidth” of the signal.
This constraint was quite strong and considerably limited the number of scenarios leading
to accurate reproduction of observed signals. In particular, we found that the amplitude of
both GABAergic and Glutamatergic PSPs ( A and ) should be simultaneously modified in
the model in order to reproduce a fast onset activity with aforementioned characteristics.
G

21
Inspection of figure 7-a to 7-c revealed that “correct” scenarios should correspond to a class
of pathways in the ( A , G ) plane denoted by the semitransparent white arrow between the two
semitransparent circles reported on the figure and characterized by the joint decrease of A and
. Indeed, it could be observed that the first circle was located in high EPSP amplitude / high
IPSP amplitude area of the (
G
A , G ) plane while the second one was located in low EPSP am-
plitude / low IPSP amplitude.
It could also be noticed that these pathways were, more or less, aligned with the edge be-
tween resonance and unstable regions, with a slight trend to enter the unstable region in order
to gradually increase the energy of the output signal. Consequently, results show that a bal-
ance establishes between inhibitory and excitatory mechanisms and avoids an abrupt transi-
tion from the resonance region to unstable region to occur. Finally, modifying the A and G
parameters along pathways at the vicinity of the edge between resonance and unstable regions
also guaranties that i) the frequency of the output signal is high, ii) its bandwidth stays nar-
row, and iii) its energy gradually increases.
3.4. Simulation of a “realistic” fast onset activity
From the theoretical results described in the previous section, the simulation of a fast onset
that fulfills the frequency/energy/bandwidth constraints is straightforward. This simulated ac-
tivity can be obtained from a scenario according to which parameters A and gradually di-
minish as a function of time over a time interval of a few seconds. As shown in figure 8, we
could verify that the progressive decrease of average EPSP and IPSP amplitudes led in the
model to required features on the output signal (decreasing frequency, increasing energy and
narrow bandwidth). In addition, an interesting feature of the model is to predict the output
(firing rate) of the sub-population of pyramidal cells during the fast onset activity. Results
showed that mean firing rate of these neurons increased with time, as illustrated in figure 8-d.
G

22
4. Discussion
A salient feature of the epileptogenic brain tissue is its capacity to generate sustained high-
frequency oscillations (Bartolomei et al., 2008; Fisher et al., 1992; Schiff et al., 2000; Traub,
2003; Wendling et al., 2003), conversely to the normal brain tissue. Therefore, finding the
underlying mechanisms leading to this pathological activity is a critical issue in epileptology
as it could lead to novel diagnostic and therapeutic procedures. Various types of modifications
in the structure of brain circuits may lead to generation of this fast onset activity, occurring at
the level of synaptic (Gnatkovsky et al., 2008) or non-synaptic couplings (Traub et al., 2001).
In this paper we determined some necessary conditions for which high-frequency oscillations
(high-gamma band) are generated in a physiologically-plausible neural mass model of the
cerebral cortex. These conditions relate a) to the model structure (sub-populations specifically
involved), b) to the role of feedback loops and connection strengths, and c) to the amplitude
of excitatory/inhibitory PSPs. Main findings (a-c) are discussed hereafter. They are followed
by some comments about the limitations of the model (d).
a) “Minimal” model structure for generating high-frequency oscillations
The proposed population model includes three sub-populations (pyramidal cells and two
types of interneurons) interconnected via glutamatergic (AMPA currents) or GABAergic
(GABA currents with slow and fast kinetics) synapses. It could be used to reproduce both
pathological and normal (background EEG) activity, similarly to those presented in
(Wendling et al., 2002; Wendling et al., 2005). In this model, it was found that the active par-
ticipation of the sub-population of interneurons mediating slow inhibition (type : neuroglia-
form cells) prevents the generation of sustained high-frequency oscillations (gamma band and
beyond) as observed at the beginning of actual cortical seizures. Therefore, we assumed that
the fast activity is produced in a “reduced model” that just includes two subpopulations: main
cells (excitatory pyramidal neurons) and interneurons mediating fast inhibition only (type I :
I'

23
basket/chandelier cells). This assumption is in accordance with experimental studies indicat-
ing that i) bicuculline acts primarily as a blocker of GABAA,slow receptors (Kapur et al., 1997),
ii) bicuculline perfusion leads to the appearance of fast onset activity (Uva et al., 2005), and
iii) such fast activity was correlated with fast IPSPs in superficial pyramidal neurons
(Gnatkovsky et al., 2008). Interestingly, it was also shown that inhibitory processes are not
uniformly altered in an experimental model of focal epilepsy (Cossart et al., 2001). More spe-
cifically, GABAergic inhibition was found to be increased at the level of somata (where it is
faster) but reduced in the dendrites (where it is slower) of pyramidal neurons.
b) Role of feedback loops and influence of connection strengths
Tsai et al. (Tsai et al., 2008) recently reported results about the influence of two feedback
configurations (positive-plus-negative and negative-only) in various nonlinear oscillators, in-
cluding theoretical systems like Van der Pol’s and biological systems like those implied in
circadian rhythms. They showed that a tunable frequency with near-constant amplitude can be
more easily obtained in systems with both positive and negative feedback. In systems charac-
terized by negative feedback only, they demonstrated that only a limited set of parameters
lead to oscillatory behavior and that adjustment of the frequency is much more difficult to ob-
tain.
In the schematic diagram of the minimal model shown in figure 2-b, it can be easily veri-
fied the activity of pyramidal cells is determined by i) two positive feedback loops (
and , where → denotes a positive interaction and where denotes a negative
interaction) and ii) one negative feedback loop ( ). It can also be verified that the
model structure can be changed from a positive-plus-negative feedback version (when
and
P P→
P I I P→
P I P→
PPC
IIC are both different from zero) into a negative feedback-only version (when
and ).
0PPC =
0IIC =

24
Interestingly, we think that the results we obtained in these two versions of the reduced
model (figure 2-b) are in line with Tsai’s. Indeed, as depicted in figures 5-a and 5-d, for the
“positive-plus-negative feedback” design (for instance, in figure 5-a and
in figure 5-d), the resonance region is broad and the frequency can be tuned in a rela-
tively wide range while still preserving a near-constant amplitude. Conversely, in the “nega-
tive-only feedback” design (see the planes obtained for and for low
200PPC =
500IIC =
0PPC = IIC values in fig-
ure 6), the resonance region becomes very narrow. In this case, tuning the frequency over a
wide range of values is also harder to achieve.
Moreover, results showed that mutual inhibition was necessary for generating high-
frequency oscillations. Indeed, a high degree of connections within interneurons (i.e. IIC is
even higher than within principal cells) was required to obtain significant energy in the
gamma band. This finding is in line with previous experimental studies suggesting a possible
substrate for fast activity is the presence of reciprocal interactions between inhibitory and ex-
citatory networks, with a central role played by the synchronous activation of networks of in-
terconnected interneurons (Gnatkovsky et al., 2008). See also (Bartos et al., 2007) for review.
It is also in line with computational studies using detailed cellular models (Traub et al.,
1996) which showed that a gamma oscillation can arise in networks of interneurons where
some mutual GABAA-mediated synaptic inhibition and some source of excitatory input are
present. However, in our model, both the mutual inhibition and the feedback from inhibitory
to excitatory sub-population are necessary for appearance of gamma rhythm.
Indeed, a subtle adjustment of gains in positive and negative feedback loops was necessary
for generation of high-frequency oscillations. Results showed that either a very weak or a
very strong connection within fast-interneurons may disrupt the balance between positive and
negative feedback loops. More formally, the IIC value must lie in a certain range such that
2 IIGgc C and 1 PIAac C gain values are, more or less, in the same order of magnitude. In addi-
25
tion, it was required that outgoing GABAergic projections from interneuron sub-population to
interneuron and pyramidal sub-populations must also be set to proper values. Indeed, results
showed that the IP IIC C/ ratio was also a crucial parameter for leading the model to the reso-
nance region and thus, for getting high-frequency oscillations.
The above description is valid for both interneuron and pyramidal sub-populations. By du-
ality, this means that 1 PPAac C and 2 IPGgc C should have the same order of magnitude for the
model to generate a high-frequency output signal. In addition, results showed the ra-
tio was also a crucial parameter that can take the model to the resonance region.
PI PPC C/
It is noteworthy that this resonance region is located at the border between stable and un-
stable regions. Interestingly, “normal” (i.e., non ictal) ongoing brain activity is classically as-
sociated with “stable” dynamics whereas “ictal” activity is associated with “unstable” dynam-
ics (Lopes da Silva et al., 2003). Therefore, it can be speculated that the fast onset activity
occurs when involved brain systems move from stability towards instability during the transi-
tion to seizure.
It should also be emphasized that the connection strength parameter is interpreted, in the
model, as an average number of synaptic contacts. One salient property of epileptic chirp-like
signatures is that they generally last for 5 to 10 seconds (Schiff et al., 2000; Timofeev and
Steriade, 2004). However, from the physiology viewpoint, the dramatic decrease of frequency
observed during this time interval can hardly be explained by a change in the number of syn-
aptic contacts. This argument led us to explore the influence of PSP amplitudes ( A and G )
that are also parameters involved in the gains of positive and negative loops ( 2 IIGg , c C
1 PIAac C , 1 PPAac C and 2 IPGgc C ), as described in the next paragraph.
c) Influence of EPSP/IPSP average amplitudes
We studied the conditions, on EPSP and fast IPSP amplitudes ( A and G ), for reproducing
actual features of fast onset activities. Our study revealed that the number of scenarios leading
26
to accurate reproduction of observed features was rather limited. Results showed that A and
should both decrease in such a manner that the balance between abovementioned positive
and negative feedbacks was maintained (i.e., keeping the model between stable and unstable
regions). However, as described in section 3.3, in order to increase the energy of the chirp
signal, pathways should have a slight deflection from the resonance region toward the unsta-
ble region. Therefore, the model shows that, as time is going on and as frequency decreases,
both the excitatory and inhibitory synaptic processes seem to gradually weaken. Regarding
the decrease of the average amplitude of IPSPs, our simulation results might corroborate some
experimental findings showing that GABAA receptors in epileptic tissue exhibit a relatively
fast rundown (Palma et al., 2002; Palma et al., 2007). This rundown is precisely defined has
the gradual decrease of GABAergic responses upon repetitive stimulation of GABAA recep-
tors probably caused by phosphorylation mechanisms (Palma et al., 2004; Palma et al., 2005).
Ultimately, the system moves towards instability. In the complete model shown in figure 1-a,
this bifurcation comes with a transition between the fast onset activity and a slower high-
amplitude, low-frequency activity (i.e., rhythmic spikes and bursts), often referred to as
“clonic activity”. However, we did not study this phenomenon in depth, as it is beyond the
scope of this paper.
G
d) Limitations of this study
It should be mentioned that the “reduced model” structure on which we focused in this
study corresponds to a pathological brain circuitry occurring transiently at a precise time be-
tween pre-ictal and ictal activity. The blockade of GABAA,slow inhibition (B = 0) is a necessary
condition to get the reduced model (figure 2) from the whole model (figure 1). The blockade
of GABAA receptors is known to be a classical experimental procedure to induce epileptic ac-
tivity. The reduction of fast IPSP amplitude during the fast onset activity have been recently
justified experimentally based on combined intracellular/extracellular recordings in the guinea

27
pig isolated brain preparation (Gnatkovsky et al., 2008). However, we could not find an ex-
perimental analysis showing the reduction of the frequency of fast onset activity requires also
reduction of EPSP amplitude.
Another issue in the proposed model is related to the number of excitatory and inhibitory
synaptic contacts among sub-populations. In general, considering the high number of pyrami-
dal cells in the cortex and the vast expansion of their dendritic trees, should take a higher
value than the value of
PPC
IIC or I IC ′ ′ . Usually, for slow GABAergic synapses, the ra-
tio is set to a value around 4 to 5 (Bojak and Liley, 2005; Molaee-Ardekani et al., 2007; Ren-
nie et al., 2000). Considering that basket cells establish a lot of interconnections with other
basket cells, the ratio for fast GABAergic synapses may decrease a little bit (the ex-
act value is unknown). Nevertheless, in the reduced model, we found out that basically,
parameter should be less than
PP I IC C ′ ′/
PP IIC C/
PPC
IIC parameter in order to generate fast onset activity. This dis-
crepancy may be explained by two factors, at least. First, studied electrophysiological signals
were recorded from an abnormal cortex (dysplasia). Therefore, alterations at the level of con-
nectivity are likely to occur depending on the underlying pathology. In order to clarify this
point, a detailed analysis of chirp-like signatures with respect to histo-pathological findings is
desirable although always difficult to carry out on human resections. Second, according to in-
tracellular recordings, it was shown that pyramidal cells are almost silent during fast onset ac-
tivity (Gnatkovsky et al., 2008; Penttonen et al., 1998). At the beginning of this activity, in-
terneurons mediate fast IPSPs on pyramidal cells that are more likely in a hyperpolarized
state. Then, the gradual decrease of IPSP amplitudes leads to a depolarization of pyramidal
cells. In terms of neural mass modeling, this phenomenon should be equivalent to a gradual
increase in the mean firing rate of pyramidal sub-population. This is precisely what we ob-
served in the proposed model (figure 8-d).
28
It could also be hypothesized that only a fraction of pyramidal cells is silent during fast on-
set activity and thus, that the number of “active” connections is less than the number of “ac-
tual” connections. In such a case, fast interneurons may receive their excitatory signals from
the remaining pyramidal cells (those that are not silent) during fast onset activity or even from
excitatory GABAergic depolarizing potentials (Fujiwara-Tsukamoto et al., 2004). As a result,
in this pathological case, the indicated excitatory sub-population in the studied reduced model
may account for the sole fraction of “active” principal pyramidal cells. This provides an ar-
gument for reduced value although it cannot be explicitly shown since cells are not ex-
plicitly represented at this level of modeling. This can be seen as a limitation since it is still
difficult to closely relate the effect of parameter changes in this type of models with underly-
ing pathophysiological changes occurring neural networks at cellular or sub-cellular level.
PPC
To end with, we would like to mention that our model does not account for “non synaptic”
couplings between cells although these were shown to have a potentially-important role in the
generation of high-frequency oscillations (Traub, 2003; Traub et al., 2001). With appropri-
ately adjusted synaptic time constants (i.e., chosen within a “physiological” range), we no-
ticed that neural mass models can generate quite high-frequency output signals, as also re-
ported in (Rennie et al., 2000). This specific point needs to be clarified in a further study. In
particular, it would be useful to establish some relationships between “macroscopic” (popula-
tion) parameters governing fast dynamics of neural masses and “microscopic” components
represented in detailed models, as gap junctions.

29
APPENDIX A: Literature review about the cellular organization of cerebral cortex
Neocortical neurons are arranged in layers (layers I–VI) that connect to either cortical or
sub-cortical regions. As an approximation, a neocortical column of about 0.3 mm in diameter
contains roughly 7,500 neurons. Most neocortical neurons (70–80%) are excitatory pyramidal
neurons which have relatively stereotyped anatomical, physiological and molecular proper-
ties. The remaining 20–30% of neocortical neurons are interneurons, mostly inhibitory, which
have diverse morphological, physiological, molecular and synaptic characteristics, as recently
described in (Markram et al., 2004).
A.1. Connections from and onto pyramidal cells
A.1.1. Pyramidal cells to pyramidal cells connections
Pyramidal cells constitute the largest broad class of neurons in cortex (60–90% depending
on region and layer). They permit most of the cortico-cortical and extra-cortical projections,
as well as a substantial proportion of the local excitatory connections within neocortical cir-
cuits (DeFelipe and Farinas, 1992). Neocortical pyramidal cells are extensively intercon-
nected (Czeiger and White, 1993; Elhanany and White, 1990; Johnson and Burkhalter, 1996;
Keller and Asanuma, 1993; Kisvarday et al., 1986; Kisvarday and Eysel, 1992; Somogyi et
al., 1998). Numerically, therefore, connections between pyramidal cells, including close
neighbors, cells in different layers and cells in different regions, are a dominant feature of the
cortical circuit (Thomson and Deuchars, 1997).
A.1.2. Pyramidal cells to interneurons connections

30
To date, a universally-accepted taxonomy of cortical interneurons does not exist (Buzsaki
et al., 2004). GABAergic interneurons are crucial for normal brain function (Wang et al.,
1999). They represent around 20% of the total number of neurons in the neocortex and re-
ceive excitatory input from pyramidal cells mainly on AMPA receptors. As reported in
(Bartos et al., 2007), unitary excitatory postsynaptic potentials (EPSPs) have a rapid time
course. It has also been estimated that the density of AMPA receptors on interneurons is four
times higher than at neighboring synapses on principal neurons (Bartos et al., 2007).
A.1.3. Interneurons to pyramidal cells
A.1.3.1. Basket and chandelier cells to pyramidal cells
GABAergic synapses cover almost the entire membrane surface of pyramidal neurons
(Freund and Katona, 2007). In (Pearce, 1993), it has been shown that monosynaptic GABAA
fast-mediated IPSCs can be recorded in pyramidal neurons. GABAA,fast current enters at or
near the cell body and decays rapidly (3-8 ms). These rapidly decaying IPSCs mediated by
somatic and proximal dendritic synapses are likely arising from basket and chandelier cells
(Bacci et al., 2003; Freund and Buzsaki, 1996). It is noteworthy that the axon initial segments
receive synaptic inputs selectively the axo-axonic chandelier cells (Somogyi, 1977). About
50% of all inhibitory interneurons are basket cells. It is now commonly admitted that basket
cells mostly target the somata and proximal dendrites of pyramidal neurons and interneurons.
Recent reports (Bartos et al., 2007) showed that inhibitory synapses between basket cells
could synchronize action potential activity within the basket cell network. Conversely inhibi-
tory synapses between basket cells and principal neurons could distribute this synchronized
activity to the principal neuron population. In addition, many studies have emphasized the
role of basket cells in the generation of fast oscillations observed in local field potentials. In

31
particular, gamma activity is associated with alternating current sources and sinks in the
perisomatic region. This finding is consistent with the involvement of basket cells which pre-
cisely innervate this sub-cellular domain (Bartos et al., 2007).
A.1.3.2. Neuroglialform cells to pyramidal cells
Neuroglialform cells (NGFCs) generate slow GABAA postsynaptic responses on pyramidal
cells in the neocortex, as reported in (Simon et al., 2005). Other studies have also shown
GABAB-mediated inhibition in postsynaptic pyramidal cells after a single action potential in
NGFCs in the neocortex (Tamas et al., 2003). GABAB receptors are often located perisynapti-
cally, and their activation after NGFC activation suggests spillover from the synapse after a
single action potential (Krook-Magnuson and Huntsman, 2007).
A.2. Connections among interneurons
A.2.1. Basket cells to basket cells
Connections from basket to basket cells have been identified in many studies. The time
course of the GABA-mediated inhibitory postsynaptic currents (IPSCs) in neocortical fast-
spiking interneurons (BC-BC) was observed to be faster than the kinetics of IPSCs in princi-
pal neurons of the same circuit (Bartos et al., 2002; Galarreta and Hestrin, 2002). These
IPSCs were shown to rise almost instantaneously and decay with a time constant of ~2-3 ms
at near-physiological temperature (Bartos et al., 2007).
A.2.2. Neurogliaform cells to basket cells

32
Neurogliaform cells establish electrical synapses not only with each other but also with
other interneuron types in the neocortex (Price et al., 2005; Simon et al., 2005; Zsiros and
Maccaferri, 2005). Most interneurons trigger fast inhibitory postsynaptic potentials (IPSPs) in
their postsynaptic target cells mediated by GABAA receptors (Buhl et al., 1994; Gupta et al.,
2000; Tamas et al., 2003). By contrast, neurogliaform cells are the only known type of in-
terneuron capable of eliciting slow, long-lasting IPSPs through a combined activation of
GABAA and GABAB receptors (Tamas et al., 2003). To date, this effect of neurogliaform
cells has been demonstrated only on postsynaptic pyramidal cells (Tamas et al., 2003).
A.2.3. Neurogliaform cells to neurogliaform cells
This type of connection is described in (Simon et al., 2005) where slow IPSPs combined
with homologous and heterologous electrical coupling are reported in human tissue. In the rat,
single action potentials in neurogliaform cells where shown to elicit GABAA,slow receptor-
mediated and GABAB receptor-mediated component in responses of neurogliaform interneu-
rons (Simon et al., 2005). These cells are also highly electrically coupled in the neocortex
(Juhasz et al., 2009).
Acknowledgement
The authors would like to thank the two anonymous reviewers for helpful comments on an
earlier version of the manuscript.
33
References
Alarcon G, Binnie CD, Elwes RD, Polkey CE. 1995. Power spectrum and intracranial EEG patterns at seizure onset in partial epilepsy. Elec-
troencephalogr Clin Neurophysiol 94(5):326-37.
Allen PJ, Fish DR, Smith SJ. 1992. Very high-frequency rhythmic activity during SEEG suppression in frontal lobe epilepsy. Electroen-
cephalogr Clin Neurophysiol 82(2):155-9.
Bacci A, Rudolph U, Huguenard JR, Prince DA. 2003. Major differences in inhibitory synaptic transmission onto two neocortical interneu-
ron subclasses. J Neurosci 23(29):9664-74.
Bancaud J, Angelergues R, Bernouilli C, Bonis A, Bordas-Ferrer M, Bresson M, Buser P, Covello L, Morel P, Szikla G and others. 1970.
Functional stereotaxic exploration (SEEG) of epilepsy. Electroencephalogr Clin Neurophysiol 28(1):85-6.
Bancaud J, Talairach J. 1973. [Methodology of stereo EEG exploration and surgical intervention in epilepsy]. Rev Otoneuroophtalmol
45(4):315-28.
Bartolomei F, Chauvel P, Wendling F. 2008. Epileptogenicity of brain structures in human temporal lobe epilepsy: a quantified study from
intracerebral EEG. Brain 131(Pt 7):1818-30.
Bartolomei F, Guye M, Gavaret M, Regis J, Wendling F, Raybaud C, Chauvel P. 2002. [The presurgical evaluation of epilepsies]. Rev Neu-
rol (Paris) 158(5 Pt 2):4S55-64.
Bartos M, Vida I, Frotscher M, Meyer A, Monyer H, Geiger JR, Jonas P. 2002. Fast synaptic inhibition promotes synchronized gamma oscil-
lations in hippocampal interneuron networks. Proc Natl Acad Sci U S A 99(20):13222-7.
Bartos M, Vida I, Jonas P. 2007. Synaptic mechanisms of synchronized gamma oscillations in inhibitory interneuron networks. Nat Rev
Neurosci 8(1):45-56.
Bojak I, Liley DT. 2005. Modeling the effects of anesthesia on the electroencephalogram. Phys Rev E Stat Nonlin Soft Matter Phys 71(4 Pt
1):041902.
Breakspear M, Roberts JA, Terry JR, Rodrigues S, Mahant N, Robinson PA. 2006. A unifying explanation of primary generalized seizures
through nonlinear brain modeling and bifurcation analysis. Cereb Cortex 16(9):1296-313.
Buhl EH, Halasy K, Somogyi P. 1994. Diverse sources of hippocampal unitary inhibitory postsynaptic potentials and the number of synaptic
release sites. Nature 368(6474):823-8.
Buzsaki G, Geisler C, Henze DA, Wang XJ. 2004. Interneuron Diversity series: Circuit complexity and axon wiring economy of cortical in-
terneurons. Trends Neurosci 27(4):186-93.
Cossart R, Dinocourt C, Hirsch JC, Merchan-Perez A, De Felipe J, Ben-Ari Y, Esclapez M, Bernard C. 2001. Dendritic but not somatic
GABAergic inhibition is decreased in experimental epilepsy. Nat Neurosci 4(1):52-62.
Czeiger D, White EL. 1993. Synapses of extrinsic and intrinsic origin made by callosal projection neurons in mouse visual cortex. J Comp
Neurol 330(4):502-13.
Deco G, Jirsa VK, Robinson PA, Breakspear M, Friston K. 2008. The dynamic brain: from spiking neurons to neural masses and cortical
fields. PLoS Comput Biol 4(8):e1000092.
DeFelipe J, Farinas I. 1992. The pyramidal neuron of the cerebral cortex: morphological and chemical characteristics of the synaptic inputs.
Prog Neurobiol 39(6):563-607.
Deisz RA. 1999. The GABA(B) receptor antagonist CGP 55845A reduces presynaptic GABA(B) actions in neocortical neurons of the rat in
vitro. Neuroscience 93(4):1241-9.

34
Elhanany E, White EL. 1990. Intrinsic circuitry: synapses involving the local axon collaterals of corticocortical projection neurons in the
mouse primary somatosensory cortex. J Comp Neurol 291(1):43-54.
Fisher RS, Webber WR, Lesser RP, Arroyo S, Uematsu S. 1992. High-frequency EEG activity at the start of seizures. J Clin Neurophysiol
9(3):441-8.
Freeman WJ. 1978. Models of the dynamics of neural populations. Electroencephalogr Clin Neurophysiol Suppl(34):9-18.
Freund TF, Buzsaki G. 1996. Interneurons of the hippocampus. Hippocampus 6(4):347-470.
Freund TF, Katona I. 2007. Perisomatic inhibition. Neuron 56(1):33-42.
Fujiwara-Tsukamoto Y, Isomura Y, Kaneda K, Takada M. 2004. Synaptic interactions between pyramidal cells and interneurone subtypes
during seizure-like activity in the rat hippocampus. J Physiol 557(Pt 3):961-79.
Galarreta M, Hestrin S. 2002. Electrical and chemical synapses among parvalbumin fast-spiking GABAergic interneurons in adult mouse
neocortex. Proc Natl Acad Sci U S A 99(19):12438-43.
Gnatkovsky V, Librizzi L, Trombin F, de Curtis M. 2008. Fast activity at seizure onset is mediated by inhibitory circuits in the entorhinal
cortex in vitro. Ann Neurol 64(6):674-86.
Gupta A, Wang Y, Markram H. 2000. Organizing principles for a diversity of GABAergic interneurons and synapses in the neocortex. Sci-
ence 287(5451):273-8.
Hardie JB, Pearce RA. 2006. Active and passive membrane properties and intrinsic kinetics shape synaptic inhibition in hippocampal CA1
pyramidal neurons. J Neurosci 26(33):8559-69.
Jansen BH RV. 1995. Electroencephalogram and visual evoked potential generation in a mathematical model of coupled cortical columns.
Biol Cybern. 73(4):357-366.
Jansen BH ZG, Brandt ME. 1993. A neurophysiologically-based mathematical model of flash visual evoked potentials. Biol Cybern.
68(3):275-283.
Jirsa VK, Haken H. 1996. Field Theory of Electromagnetic Brain Activity. Phys Rev Lett 77(5):960-963.
Johnson RR, Burkhalter A. 1996. Microcircuitry of forward and feedback connections within rat visual cortex. J Comp Neurol 368(3):383-
98.
Juhasz C, Asano E, Shah A, Chugani DC, Batista CE, Muzik O, Sood S, Chugani HT. 2009. Focal decreases of cortical GABAA receptor
binding remote from the primary seizure focus: what do they indicate? Epilepsia 50(2):240-50.
Kapur A, Pearce RA, Lytton WW, Haberly LB. 1997. GABAA-mediated IPSCs in piriform cortex have fast and slow components with dif-
ferent properties and locations on pyramidal cells. J Neurophysiol 78(5):2531-45.
Keller A, Asanuma H. 1993. Synaptic relationships involving local axon collaterals of pyramidal neurons in the cat motor cortex. J Comp
Neurol 336(2):229-42.
Kidd FL, Isaac JT. 1999. Developmental and activity-dependent regulation of kainate receptors at thalamocortical synapses. Nature
400(6744):569-73.
Kisvarday ZF, Adams CB, Smith AD. 1986. Synaptic connections of axo-axonic (chandelier) cells in human epileptic temporal cortex. Neu-
roscience 19(4):1179-86.
Kisvarday ZF, Eysel UT. 1992. Cellular organization of reciprocal patchy networks in layer III of cat visual cortex (area 17). Neuroscience
46(2):275-86.
Krook-Magnuson E, Huntsman MM. 2007. The transience of interneuron circuit diversity just "sped" up. Proc Natl Acad Sci U S A
104(43):16723-4.

35
Lee SA, Spencer DD, Spencer SS. 2000. Intracranial EEG seizure-onset patterns in neocortical epilepsy. Epilepsia 41(3):297-307.
Lopes da Silva F, Blanes W, Kalitzin SN, Parra J, Suffczynski P, Velis DN. 2003. Epilepsies as dynamical diseases of brain systems: basic
models of the transition between normal and epileptic activity. Epilepsia 44 Suppl 12:72-83.
Lopes da Silva FH, Hoeks A, Smits H, Zetterberg LH. 1974. Model of brain rhythmic activity. The alpha-rhythm of the thalamus. Kyber-
netik 15(1):27-37.
Lopes da Silva FH, van Rotterdam A, Barts P, van Heusden E, Burr W. 1976. Models of neuronal populations: the basic mechanisms of
rhythmicity. Prog Brain Res 45:281-308.
Markram H, Toledo-Rodriguez M, Wang Y, Gupta A, Silberberg G, Wu C. 2004. Interneurons of the neocortical inhibitory system. Nat Rev
Neurosci 5(10):793-807.
Molaee-Ardekani B, Senhadji L, Shamsollahi MB, Vosoughi-Vahdat B, Wodey E. 2007. Brain activity modeling in general anesthesia: en-
hancing local mean-field models using a slow adaptive firing rate. Phys Rev E Stat Nonlin Soft Matter Phys 76(4 Pt 1):041911.
Nettleton JS, Spain WJ. 2000. Linear to supralinear summation of AMPA-mediated EPSPs in neocortical pyramidal neurons. J Neurophysiol
83(6):3310-22.
Nunez PL. 1974. The brain wave function: a model for the EEG. Math. Biosci. 21:279-297.
Palma E, Esposito V, Mileo AM, Di Gennaro G, Quarato P, Giangaspero F, Scoppetta C, Onorati P, Trettel F, Miledi R and others. 2002.
Expression of human epileptic temporal lobe neurotransmitter receptors in Xenopus oocytes: An innovative approach to study
epilepsy. Proc Natl Acad Sci U S A 99(23):15078-83.
Palma E, Ragozzino DA, Di Angelantonio S, Spinelli G, Trettel F, Martinez-Torres A, Torchia G, Arcella A, Di Gennaro G, Quarato PP and
others. 2004. Phosphatase inhibitors remove the run-down of gamma-aminobutyric acid type A receptors in the human epileptic
brain. Proc Natl Acad Sci U S A 101(27):10183-8.
Palma E, Roseti C, Maiolino F, Fucile S, Martinello K, Mazzuferi M, Aronica E, Manfredi M, Esposito V, Cantore G and others. 2007.
GABA(A)-current rundown of temporal lobe epilepsy is associated with repetitive activation of GABA(A) "phasic" receptors.
Proc Natl Acad Sci U S A 104(52):20944-8.
Palma E, Torchia G, Limatola C, Trettel F, Arcella A, Cantore G, Di Gennaro G, Manfredi M, Esposito V, Quarato PP and others. 2005.
BDNF modulates GABAA receptors microtransplanted from the human epileptic brain to Xenopus oocytes. Proc Natl Acad Sci U
S A 102(5):1667-72.
Pearce RA. 1993. Physiological evidence for two distinct GABAA responses in rat hippocampus. Neuron 10(2):189-200.
Penttonen M, Kamondi A, Acsady L, Buzsaki G. 1998. Gamma frequency oscillation in the hippocampus of the rat: intracellular analysis in
vivo. Eur J Neurosci 10(2):718-28.
Price CJ, Cauli B, Kovacs ER, Kulik A, Lambolez B, Shigemoto R, Capogna M. 2005. Neurogliaform neurons form a novel inhibitory net-
work in the hippocampal CA1 area. J Neurosci 25(29):6775-86.
Rennie CJ, Wright JJ, Robinson PA. 2000. Mechanisms of cortical electrical activity and emergence of gamma rhythm. J Theor Biol
205(1):17-35.
Robinson PA, Rennie CJ, Rowe DL. 2002. Dynamics of large-scale brain activity in normal arousal states and epileptic seizures. Phys Rev E
Stat Nonlin Soft Matter Phys 65(4 Pt 1):041924.
Robinson PA, Rennie CJ, Rowe DL, O'Connor SC, Wright JJ, Gordon E, Whitehouse RW. 2003. Neurophysical modeling of brain dynam-
ics. Neuropsychopharmacology 28 Suppl 1:S74-9.

36
Schiff SJ, Colella D, Jacyna GM, Hughes E, Creekmore JW, Marshall A, Bozek-Kuzmicki M, Benke G, Gaillard WD, Conry J and others.
2000. Brain chirps: spectrographic signatures of epileptic seizures. Clin Neurophysiol 111(6):953-8.
Simon A, Olah S, Molnar G, Szabadics J, Tamas G. 2005. Gap-junctional coupling between neurogliaform cells and various interneuron
types in the neocortex. J Neurosci 25(27):6278-85.
Somogyi P. 1977. A specific 'axo-axonal' interneuron in the visual cortex of the rat. Brain Res 136(2):345-50.
Somogyi P, Tamas G, Lujan R, Buhl EH. 1998. Salient features of synaptic organisation in the cerebral cortex. Brain Res Brain Res Rev
26(2-3):113-35.
Steyn-Ross ML, Steyn-Ross DA, Sleigh JW. 2004. Modelling general anaesthesia as a first-order phase transition in the cortex. Prog Bio-
phys Mol Biol 85(2-3):369-85.
Suffczynski P, Kalitzin S, Lopes Da Silva FH. 2004. Dynamics of non-convulsive epileptic phenomena modeled by a bistable neuronal net-
work. Neuroscience 126(2):467-84.
Talairach J, Bancaud J, Bonis A, Szikla G, Trottier S, Vignal JP, Chauvel P, Munari C, Chodkievicz JP. 1992. Surgical therapy for frontal
epilepsies. Adv Neurol 57:707-32.
Tamas G, Lorincz A, Simon A, Szabadics J. 2003. Identified sources and targets of slow inhibition in the neocortex. Science
299(5614):1902-5.
Thomson AM, Deuchars J. 1997. Synaptic interactions in neocortical local circuits: dual intracellular recordings in vitro. Cereb Cortex
7(6):510-22.
Thomson AM, West DC, Hahn J, Deuchars J. 1996. Single axon IPSPs elicited in pyramidal cells by three classes of interneurones in slices
of rat neocortex. J Physiol 496 ( Pt 1):81-102.
Timofeev I, Steriade M. 2004. Neocortical seizures: initiation, development and cessation. Neuroscience 123(2):299-336.
Traub RD. 2003. Fast Oscillations and Epilepsy. Epilepsy Curr 3(3):77-79.
Traub RD, Whittington MA, Buhl EH, LeBeau FE, Bibbig A, Boyd S, Cross H, Baldeweg T. 2001. A possible role for gap junctions in gen-
eration of very fast EEG oscillations preceding the onset of, and perhaps initiating, seizures. Epilepsia 42(2):153-70.
Traub RD, Whittington MA, Colling SB, Buzsaki G, Jefferys JG. 1996. Analysis of gamma rhythms in the rat hippocampus in vitro and in
vivo. J Physiol 493 ( Pt 2):471-84.
Tsai TY, Choi YS, Ma W, Pomerening JR, Tang C, Ferrell JE, Jr. 2008. Robust, tunable biological oscillations from interlinked positive and
negative feedback loops. Science 321(5885):126-9.
Uva L, Librizzi L, Wendling F, de Curtis M. 2005. Propagation dynamics of epileptiform activity acutely induced by bicuculline in the hip-
pocampal-parahippocampal region of the isolated Guinea pig brain. Epilepsia 46(12):1914-25.
Wang Y, Gupta A, Markram H. 1999. Anatomical and functional differentiation of glutamatergic synaptic innervation in the neocortex. J
Physiol Paris 93(4):305-17.
Wendling F, Bartolomei F, Bellanger JJ, Bourien J, Chauvel P. 2003. Epileptic fast intracerebral EEG activity: evidence for spatial decorrela-
tion at seizure onset. Brain 126(Pt 6):1449-59.
Wendling F, Bartolomei F, Bellanger JJ, Chauvel P. 2002. Epileptic fast activity can be explained by a model of impaired GABAergic den-
dritic inhibition. Eur J Neurosci 15(9):1499-508.
Wendling F, Bartolomei F, Bellanger JJ, Chauvel P. 2001. Interpretation of interdependencies in epileptic signals using a macroscopic
physiological model of the EEG. Clin Neurophysiol 112(7):1201-18.

37
Wendling F, Bellanger JJ, Bartolomei F, Chauvel P. 2000. Relevance of nonlinear lumped-parameter models in the analysis of depth-EEG
epileptic signals. Biol Cybern 83(4):367-78.
Wendling F, Hernandez A, Bellanger JJ, Chauvel P, Bartolomei F. 2005. Interictal to ictal transition in human temporal lobe epilepsy: in-
sights from a computational model of intracerebral EEG. J Clin Neurophysiol 22(5):343-56.
Wilson HR CJ. 1973. A mathematical theory of the functional dynamics of cortical and thalamic nervous tissue. Kybernetik 13:55-80.
Zsiros V, Maccaferri G. 2005. Electrical coupling between interneurons with different excitable properties in the stratum lacunosum-
moleculare of the juvenile CA1 rat hippocampus. J Neurosci 25(38):8686-95.

38
Average amplitude (mV)
Time constant
Average PSP Background
activity Fast
activity Parameter Min; Max (ms)
Value in the model
(s)
trise; tdecay (ms)
Excitatory (AMPA) A = 5 A = 18 1/a 4.5; 7.5 1/180 5.5; 17.3
Inhibitory (GABAA,slow) B = 50 B = 0 1/b 30; 70 1/33 30; 95
Inhibitory (GABAA,fast)
G = 20 G = 30 1/g 3; 8 1/220 4.5; 14.3
Inhibitory (GABAB) D = 3 D = 0 1/d 200; 400 1/3.3 303; 953
Table 1: Order of magnitude for the values of the amplitudes A, B, G and D and rate constants a, b, g and d used
in the h(t) functions of the model describing the average post-synaptic potentials at the input of the different sub-
populations of neurons represented in the model. Corresponding time constant values are also provided along
with rise and decay times (see text for definition). Besides, free parameters of the sigmoid functions were set as
follows: , , and (P: pyramidal cell sub-
population, I, I’: interneuron subpopulations).
15P I IQ Q s−= =, 'max max 10 56P I Ir r mV −= =, ' . 1P mVθ = 6I I mVθ =, '

39
Pyramidal cells
Interneurons(Type I: Bas., Chand.)
Interneurons(Type I’ : NGFCs)
(soma)
GABAA,slow GABAB
(dendrites)
GABAA,slow
CPP
CPI
CIP
CII CI’I’
CI’PCPI’
CI’I
Input noise p(t)
ExcitatoryInhibitory
0 100Frequency (Hz)
20 Hz
Nor
mal
ized
PS
D
a)
b) c)
1 sec
GABAA,fast
AMPA
AMPA
AMPA AMPA
GABAA,fast
GABAA,fast
Figure 1: (a) Structure of the computational model proposed to simulate the activity of the cerebral cortex. The
model accounts for 3 sub-populations of neurons: i) pyramidal cells, ii) soma- and proximal-dendrite-targeting
cells (type I: basket cells and chandelier cells mediating GABAA,fast currents), and iii) dendrite-targeting cells
(type I´: neurogliaform cells mediating GABAA,slow and GABAB currents). Collateral excitations among pyrami-
dal cells and excitatory input on interneurons are represented, in the model, by AMPA-receptor mediated cur-
rents. (b) A typical signal produced by this model and representing a background EEG activity. Parameters val-
ues listed in table 1 (background activity) were used for obtaining this signal. (c) Normalized power spectrum
density of the illustrated EEG signal.

40
c)
1 sec
d)
1 sec
d) e)
0 200100
10 HzN
orm
aliz
edPS
D
Frequency (Hz)
e)
0 200100
10 HzN
orm
aliz
edPS
D
Frequency (Hz)
SP(v)
he(t)
p(t) +-
Model output
EPSP
IPSP
CPP
+-
hi (t)
CPI
CII
he(t)
hi (t)
SI(v)
CIP
Pyramidal cells
Interneurons (Type I)
EPSP
IPSP
QI
QP
ϕP
ϕI
ϕP
ϕI
+pf (t)he(t) SP(v)
he(t)
p(t) +-
Model output
EPSPEPSP
IPSPIPSP
CPP
+-
hi (t)
CPI
CII
he(t)
hi (t)
SI(v)
CIP
Pyramidal cells
Interneurons (Type I)
EPSPEPSP
IPSPIPSP
QI
QP
ϕP
ϕI
ϕP
ϕI
+pf (t)he(t)Pyramidal cells
Interneurons(Type I: Bas., Chand.)
CPP
CPI CIP
CII
AMPA
a)
Excitatory
Inhibitory
AMPA
AMPA
(soma)
GABAA,fast
GABAA,fast
p(t)
Pyramidal cells
Interneurons(Type I: Bas., Chand.)
CPP
CPI CIP
CII
AMPAAMPA
a)
Excitatory
Inhibitory
AMPAAMPA
AMPAAMPA
(soma)
GABAA,fast
GABAA,fast
p(t)
b)
P
I-
+
+-
b)
P
I-
+
+-
Figure 2: (a) Structure of the reduced model responsible for the fast onset activity. The model accounts for two
sub-populations of neurons: i) pyramidal cells mediating AMPA currents, and ii) basket cells and chandelier
cells mediating GABAA,fast currents. (b) Simplified diagram of the model showing positive (excitatory) and nega-
tive (inhibitory) interactions among sub-populations and feedback loops (c) Detailed schematic diagram of the
model including wave-to-pulse functions, pulse-to-wave functions and strengths of connections. (d) A high-
frequency oscillatory activity produced by the model. Parameters values listed in table 1 (fast activity) were used
to obtain this activity. (e) Normalized power spectrum density of the fast oscillatory activity.

41
Dep
th-E
EG
(hum
anne
ocor
tex)
Time (s)
2 s
Freq
uenc
y(H
z)
250 µVSeizure onset
0
maxb)
a)
Figure 3: (a) A depth-EEG signal recorded in a patient undergoing pre-surgical evaluation of drug-resistant par-
tial neocortical epilepsy. This signal was recorded from neocortex in the inferior parietal lobule. (b) Time-
frequency representation (spectrogram) showing the evolution, in time, of the spectral content of the signal dur-
ing transition from pre-ictal to ictal activity. The seizure onset is characterized by the appearance of high-
frequency oscillations taking the form of chip-like signature (white arrow). This type of signature is often en-
countered at the onset of neocortical seizures.
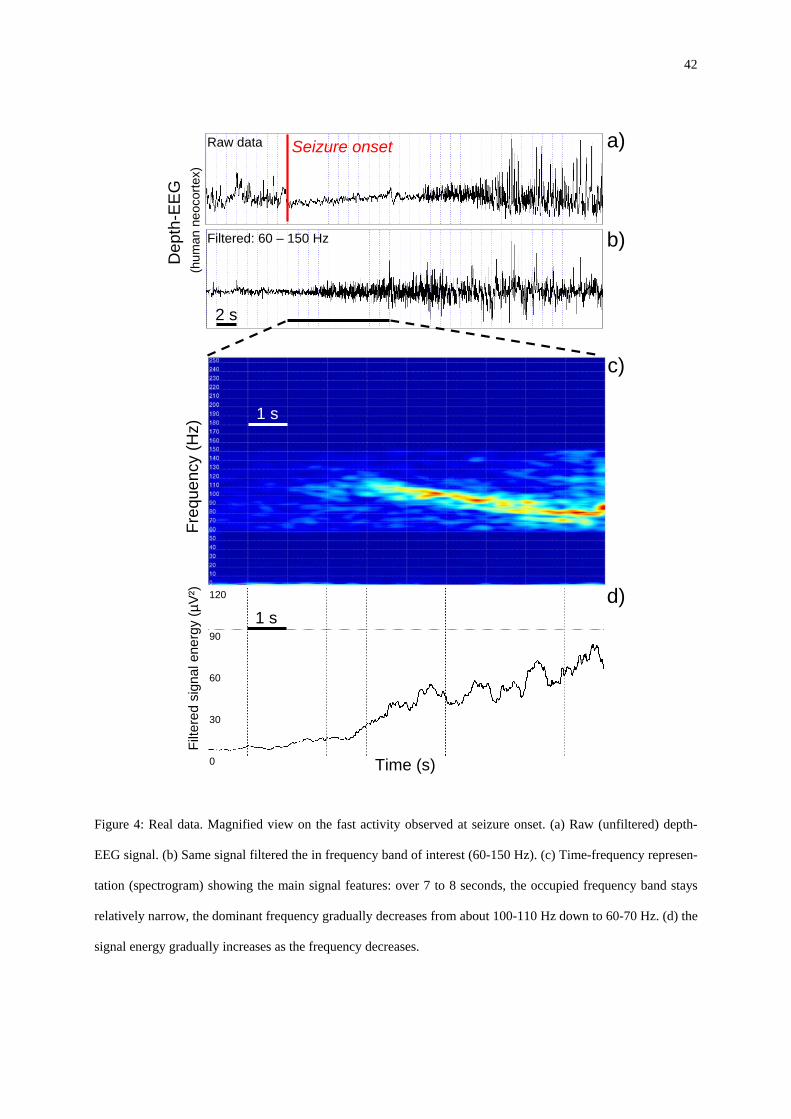
42
a)
b)
c)
d)
Filte
red
sign
al e
nerg
y(µ
V²)
Seizure onset
1 s
Dep
th-E
EG
(hum
anne
ocor
tex)
Freq
uenc
y(H
z)
Raw data
Filtered: 60 – 150 Hz
2 s
120
90
60
30
0
1 s
Time (s)
Figure 4: Real data. Magnified view on the fast activity observed at seizure onset. (a) Raw (unfiltered) depth-
EEG signal. (b) Same signal filtered the in frequency band of interest (60-150 Hz). (c) Time-frequency represen-
tation (spectrogram) showing the main signal features: over 7 to 8 seconds, the occupied frequency band stays
relatively narrow, the dominant frequency gradually decreases from about 100-110 Hz down to 60-70 Hz. (d) the
signal energy gradually increases as the frequency decreases.

43
a) b) c)
d) e) f)
CPI /CPP = 4CPI /CPP
= 8/5
Stableregion
Unstableregion
Direction ofEPSP Amplitude
reduction
Iso-CPI /CPPlines
Direction ofIPSP Amplitude
reduction
CIP /CII = 1
Stableregion
Unstableregion
Freq↑
Freq↑
Iso-CIP / CIIlines
g) h)
Freq↑
Freq↑
CPP CII
CPI
CIP
Figure 5: (a-c) Effects of the strength of glutamatergic connections (i.e., ) on a) resonance frequency,
b) total energy and c) bandwidth of the output signal when the strength of GABAergic connections is kept con-
stant (here
PP PIC C,
IP IIC C, equal to 280 and 400, respectively). (d-f) Effects of the strength of GABAergic connections
(i.e., IP IIC C, ) on resonance behavior of the model for fixed strength of glutamatergic connections (here,
). (g) Superposition of iso- lines on the resonance frequency map relating to
glutamatergic connections. The effect of EPSP amplitude for a given ratio can be studied along an
iso-line corresponding to the given ratio. Black arrow shows the direction of EPSP amplitude reduc-
tion. In addition, the influence of absolute values of glutamatergic connections on the increase of resonance fre-
quency is shown by violet arrows. (h) The same as (g) but for GABAergic connections and IPSP amplitude.
240 450PP PIC C= =, PI PPC C/
PI PPC C/
PI PPC C/
Dark and light grey regions indicate stable and unstable regions, respectively. Color coded region is the reso-
nance region.

44
d)
b)
c)
a)
Figure 6: Joint influence of glutamatergic and GABAergic connections (i.e., parameters) on
the resonance frequency of the output signal. Each 3D plot corresponds to a set of parameters at a
fixed
PP PI IP IIC C C C, , ,
PP PI IIC C C, ,
IPC value indicated on the top of each figure. As before, stable and unstable regions are shown by dark
and light grey, respectively. Resonance regions in the 2D planes (i.e. planes) expand and rotate anti-
clockwise when
PP PIC C−
IIC increases. This movement decreases the resonance frequency as a function of IIC . When
too much pronounced, the decrease or increase in IIC value leads to disappearance of the resonance region or
limits the maximum reachable resonance frequency, respectively. IPC has opposite effects on resonance charac-
teristics of the output signal, compared to IIC .

45
G
A
Energy (dB)
10 20 30 40
5
10
15
20
25
30
-25
-20
-15
-10
-5
0
G
A
Bandwidth
10 20 30 40
5
10
15
20
25
30
0
5
10
15
20
25
GA
Frequency
10 20 30 40
5
10
15
20
25
30
40
60
80
100
a)
b)
c)
Figure 7: Effect of EPSPs and IPSPs amplitudes (i.e. A, G) on a) frequency, b) energy and c) bandwidth of out-
put signal in the model. The dark (resp. light) grey region corresponds to the stable (resp. unstable) region. The
color-coded map corresponding to the resonance frequency (a) show alignment with respect to the G axis direc-
tion indicating that resonance frequency is more sensitive to A than G. Color-coded maps corresponding to en-
ergy (b) and bandwidth (c) show a fan-beam pattern aligned with the border between resonance and unstable re-
gions. These patterns of resonance frequency, energy and bandwidth reveal that correct scenarios to reproduce
fast onset activities should correspond to a class of pathways denoted by the arrow between the two semitrans-
parent circles. Pathways should have a slight trend to enter the unstable region in order to increase the energy of
the signal. In this figure, are set to 240, 450, 280 and 400, respectively. PP PI IP IIC C C C, , ,

46
1 s
Freq
uenc
y(H
z)
Time (s)
Sign
al e
nerg
y(%
ratio
)
a)
b)
c)
Sim
ulat
edE
EG
d)
100
66
33
Ava
rage
firin
gra
te
0.5 s 2.5 mV
0.5 Hz
Figure 8: Simulated fast onset activity. (a) A 6 s time course of the simulated signal in the model reproducing the
features of the actual fast onset activity shown in figure 4. The scenario to generate this activity decreases G and
A parameters from 38 to 14.5 and from 30 to 14.2, respectively. The pathway always remains in the vicinity of
resonance-unstable edge. (b) Time-frequency representation of the signal which indicates a chirp starting at
about 110 Hz and ending at about 70 Hz. As quantified in (c), the energy of signal increases when the frequency
decreases. (d) The model predicts that the firing rate on the pyramidal sub-population increases during the chirp.
Simulated activity was obtained for CII = 400, CIP = 280, CPI = 450 and CPP = 240. Other parameters are pro-
vided in table 1.