computational modeling of airflow in raised-floor data centers
TRANSCRIPT

Computational Modeling of Airflow in Raised-Floor Data Centers
Suhas V. PatankarProfessor of Mechanical Eng, University of Minnesota
andPresident, Innovative Research, Inc.

A Raised-Floor Data Center

Background
◆ Raised-floor data centers are commonly used to house computer and telecom equipment.
◆ They offer flexibility of layout since cooling air is available practically anywhere in the room.
◆ However, does the air DISTRIBUTE in a uniform or desired manner?
◆ With increasing heat loads and higher density of equipment, providing adequate supply of cooling air to critical equipment presents a significant challenge.

A Prediction Model for Airflow
◆ A computational model based on the physics of the flow can be used to predict the distribution of airflow through the perforated tiles.
◆ The use of the model would provide insight and guidance for proper design and reconfiguration of data centers, thus reducing costly trial-and-error attempts.
◆ Our objective is to provide an efficient model and a fast and easy tool for routine use by all personnel involved in the design, operation, and upgrading of data centers.

CFD Analysis: An Example
CFD Analysis of a Design Modification
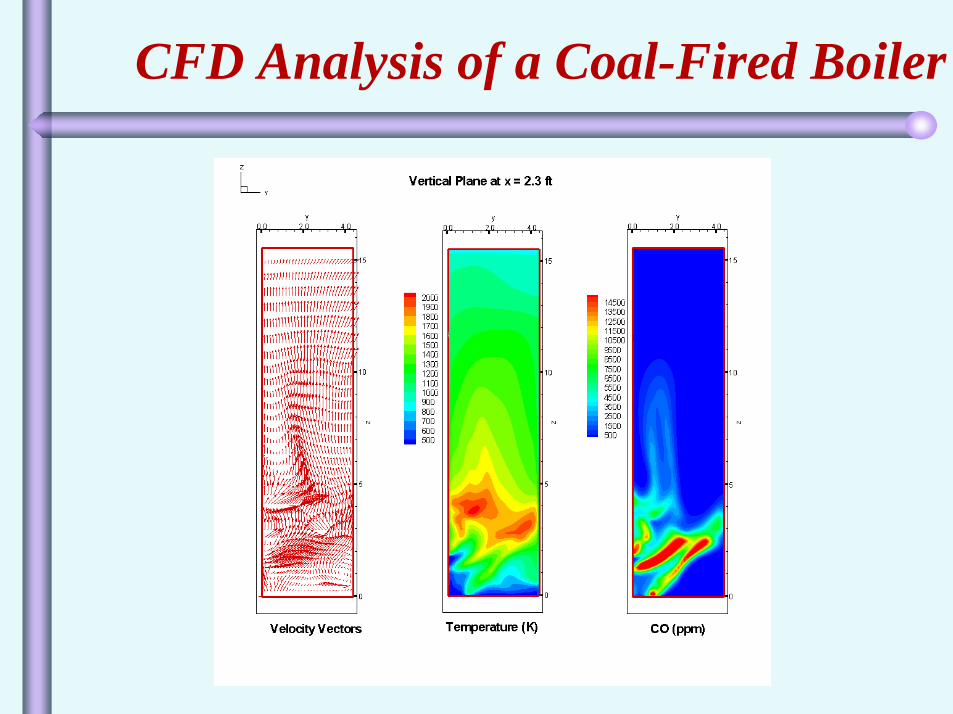
CFD Analysis of a Coal-Fired Boiler

Regatta A/C UnitsCommand Center
CFD Model of the Oakridge Data Center
Work by Dr. Roger Schmidt, IBM Corporation

ColdAisle
Predicted Temperature Distribution

Inlet to Pwr = 41C
Inlet to Pwr = 34C
Comparison of 6.6 kW and 10 kW Units

Required Airflow Delivered
2 kW
400 CFM, 55 F
74 F
To CRAC Unit
400 CFM, 55 F
2 kW
74 F
74 F

Correct Total Flow, Mismatched Distribution
200 CFM
To CRAC Unit
200 CFM, 55 F 600 CFM, 55 F
2 kW1 kW
1 kW
200 CFM
400 CFM
74 F
79 F
93 F
74 F
74 F
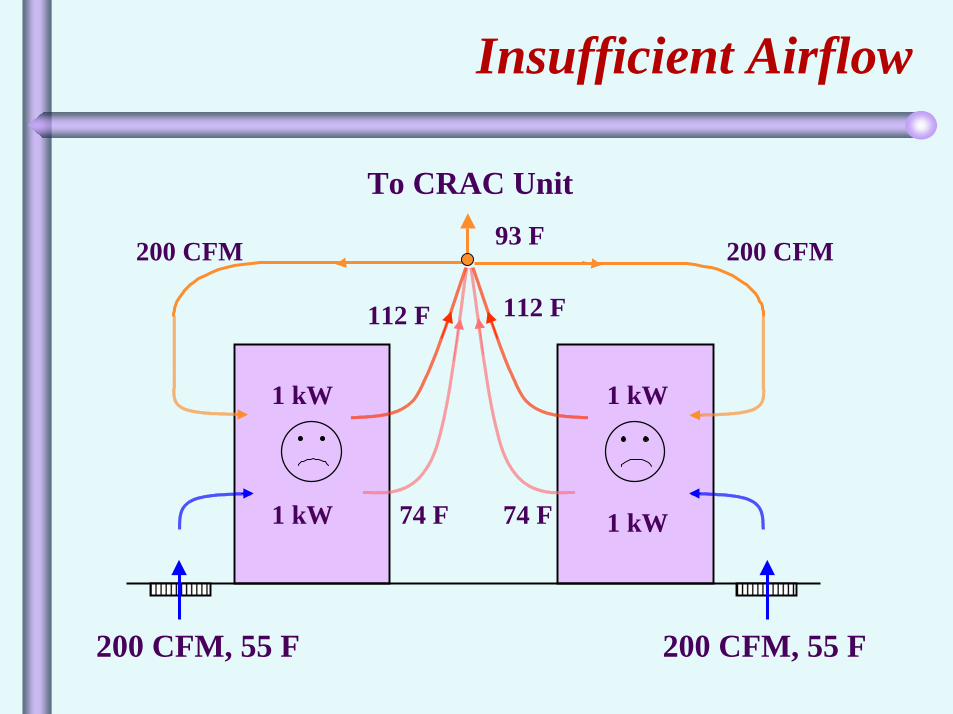
Insufficient Airflow
To CRAC Unit
200 CFM, 55 F 200 CFM, 55 F
1 kW
1 kW
1 kW
1 kW
200 CFM 200 CFM
74 F 74 F
112 F112 F
93 F

Equal Airflow, Unequal Demands
To CRAC Unit
400 CFM, 55 F 400 CFM, 55 F
2 kW
1 kW 1 kW
200 CFM 200 CFM
200 CFM
74 F
74 F74 F
93 F
79 F

◆ If the required cold airflow is delivered at the foot of each computer, proper cooling of the equipment is assured.
◆ If the needed cooling flow cannot be supplied at the perf tiles, the cooling of the computer equipment will be compromised.
◆ A good data-center design provides:
! The correct amount of total airflow! The desired DISTRIBUTION of airflow
delivered to specific locations
An Important Conclusion

◆ It is is the fluid mechanics of the space belowthe raised floor that determines the distribution of the cold airflow through the perforated tiles.
◆ Thus, modeling of the flow in the under-floor space offers significant value for a modest effort.! The computation is limited to the small
space below the raised floor.! The outcome is the valuable information
giving the flow rate at each perforated tile.
Focusing on the Under-Floor Space

Applications of the Airflow Model
◆ Initial Design. Ensure that the proposed layout gives desired airflow for the immediate and anticipated needs.
◆ Failure Scenarios. Predict the behavior with failed CRAC units, redundancy, stand-by units, etc.
◆ Energy Savings. Are all CRAC units used to maximum benefit? Is the data center fully occupied?
◆ Changes in Layout. Data centers are evolving systems. Equipment is frequently moved around, new computers are installed, and new CRAC units are commissioned. Before any actual change is implemented, model the airflow to simulate the behavior of the new layouts.
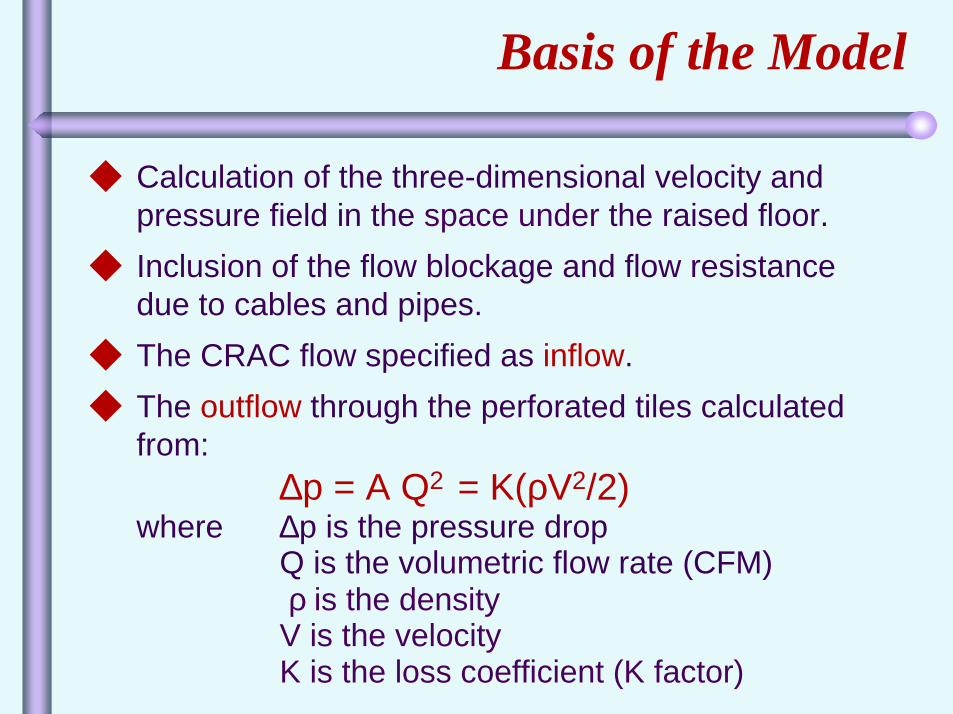
◆ Calculation of the three-dimensional velocity and pressure field in the space under the raised floor.
◆ Inclusion of the flow blockage and flow resistance due to cables and pipes.
◆ The CRAC flow specified as inflow.◆ The outflow through the perforated tiles calculated
from:∆p = A Q2 = K(ρV2/2)
where ∆p is the pressure dropQ is the volumetric flow rate (CFM)ρ is the density
V is the velocityK is the loss coefficient (K factor)
Basis of the Model

Data Center Floor Plan - Test Area
30'
26'
L
L
Current Flow Test Area
66'
20'
CRAC Units
Work by Dr. Roger Schmidt, IBM Corporation
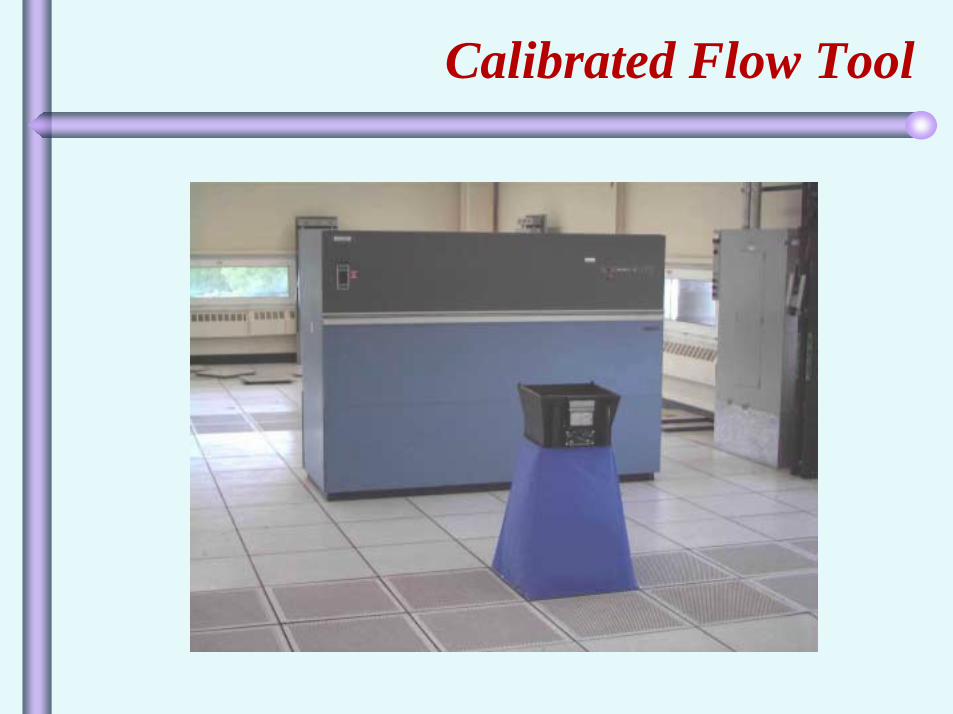
Calibrated Flow Tool

The Cause of Flow Maldistribution
CRAC

Results of the Model

Comparison With Measurements

Comparison With Measurements

Comparison With Measurements

Comparison With Measurements

Flow Maldistribution Revisited
CRAC

Effect of Raised-Floor Height
(30% open tiles)
Raised-Floor Height

Effect of Tile Open Area
(12-inch plenum height)Raised-Floor Height: 12 inches

Variable Tile Open Area Considered
CRAC

Use of Variable Tile Open Area

Standard Layout

Standard Layout: Velocity and Pressure

Standard Layout: Flow Rates

Standard Layout: Reconsidered

A New Idea: CRACs in Hot Aisles
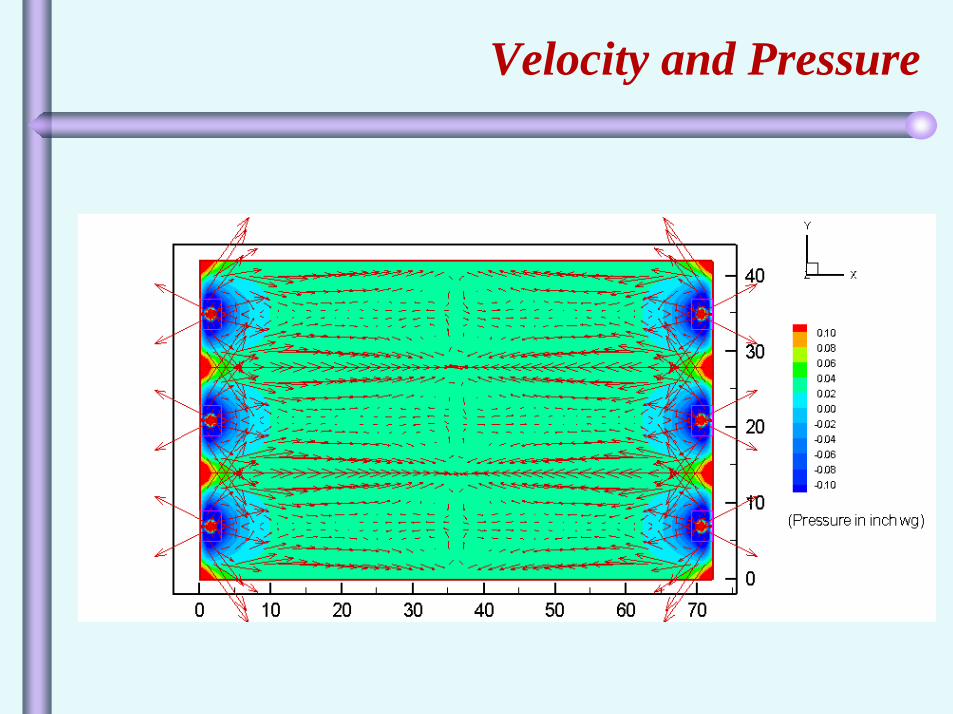
Velocity and Pressure

Uniform Flow With CRACs in Hot Aisles

Oakridge Data Center: Layout
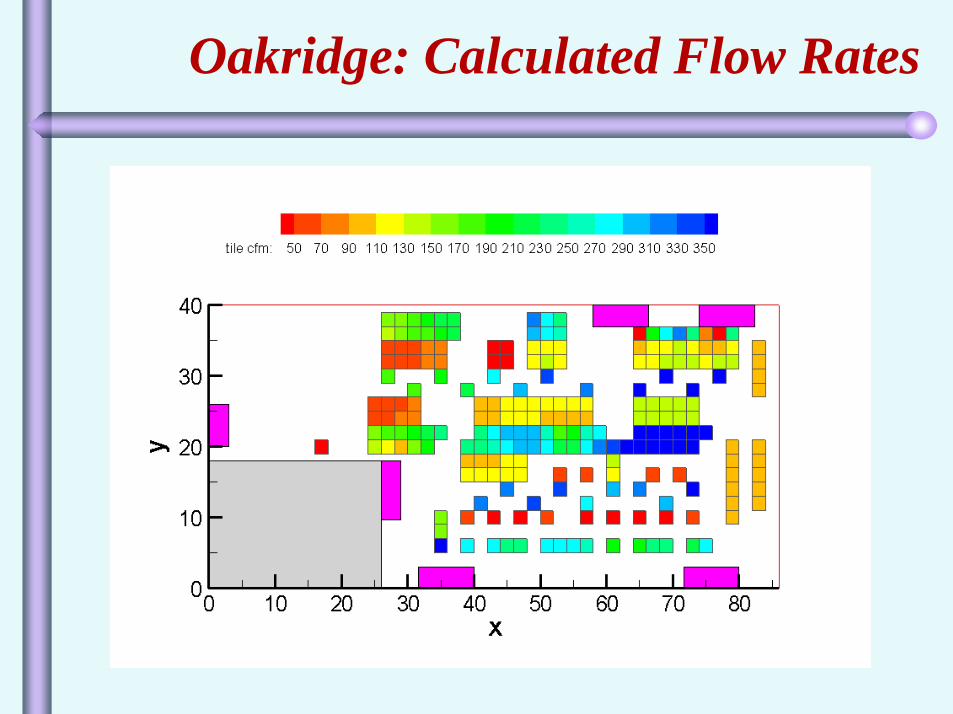
Oakridge: Calculated Flow Rates

Oakridge: Velocity and Pressure

Oakridge: Comparison With Measurements
Column 1
0
50
100
150
200
250
300
350
400
450
1 2 3 4 5 6 7 8 9 10 11 12 13 14 15 16 17 18 19 20 21 22 23 24 25 26 27 28 29 30 31 32
Measurements Predictions

Column 5
0
50
100
150
200
250
300
350
400
450
1 2 3 4 5 6 7 8 9 10 11 12 13 14 15 16 17 18 19 20 21 22 23 24 25 26 27 28 29 30 31 32 33
Measurements Predictions
Oakridge: Comparison With Measurements
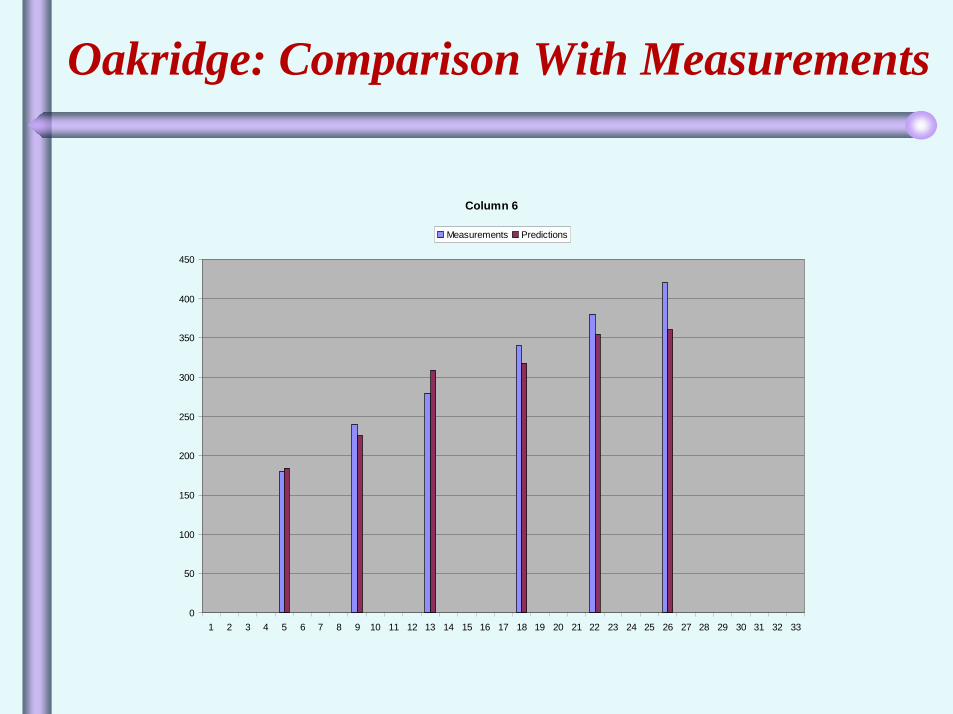
Column 6
0
50
100
150
200
250
300
350
400
450
1 2 3 4 5 6 7 8 9 10 11 12 13 14 15 16 17 18 19 20 21 22 23 24 25 26 27 28 29 30 31 32 33
Measurements Predictions
Oakridge: Comparison With Measurements

Column 10
0
50
100
150
200
250
300
350
400
450
1 2 3 4 5 6 7 8 9 10 11 12 13 14 15 16 17 18 19 20 21 22 23 24 25 26 27 28 29 30 31 32 33
Measurements Predictions
Oakridge: Comparison With Measurements

Column 17
0
50
100
150
200
250
300
350
400
450
500
1 2 3 4 5 6 7 8 9 10 11 12 13 14 15 16 17 18 19 20 21 22 23 24 25 26 27 28 29 30 31 32 33
Measurements Predictions
Oakridge: Comparison With Measurements

• On October 29, 2001, Innovative Researchperformed, in cooperation with EDG (Engineering Design Group, a GE Digital Energy Company), extensive measurements in a brand new data center in Washington, DC.
• The data center was designed by EDG using new design concepts guided by the flow prediction model.
• The data center is about 10,000 sq.ft. in area, with 11 CRACs and over 200 perf tiles.
Washington-DC Data Center

Washington-DC: Calculated Flow Rates

Washington-DC: Velocity and Pressure

Washington-DC: Comparison With Measurements
Tile Row 1
0
100
200
300
400
500
1 2 3 4 5 6 7 8 9 10 11 12 13 14 15 16 17
Tile Number
Flow
Rat
e (C
FM)
MeasuredCalculated

Washington-DC: Comparison With Measurements
Tile Row 2
0
100
200
300
400
500
1 2 3 4 5 6 7 8 9 10 11 12 13 14 15 16
Tile Number
Flow
Rat
e (C
FM)
MeasuredCalculated

Washington-DC: Comparison With Measurements
Tile Row 3
0
100
200
300
400
500
1 2 3 4 5 6 7 8 9 10 11 12 13 14 15 16
Tile Number
Flow
Rat
e (C
FM)
MeasuredCalculated

Washington-DC: Comparison With Measurements
Tile Row 4
0
100
200
300
400
500
1 2 3 4 5 6 7 8 9 10 11 12 13 14 15 16
Tile Number
Flow
Rat
e (C
FM)
MeasuredCalculated
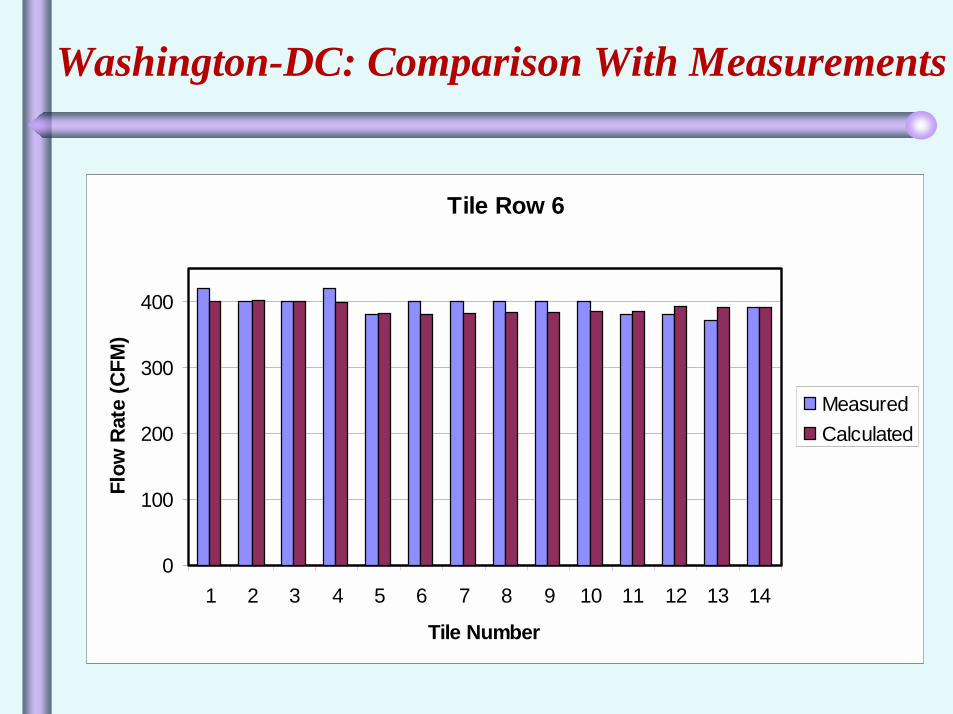
Washington-DC: Comparison With Measurements
Tile Row 6
0
100
200
300
400
1 2 3 4 5 6 7 8 9 10 11 12 13 14
Tile Number
Flow
Rat
e (C
FM)
MeasuredCalculated
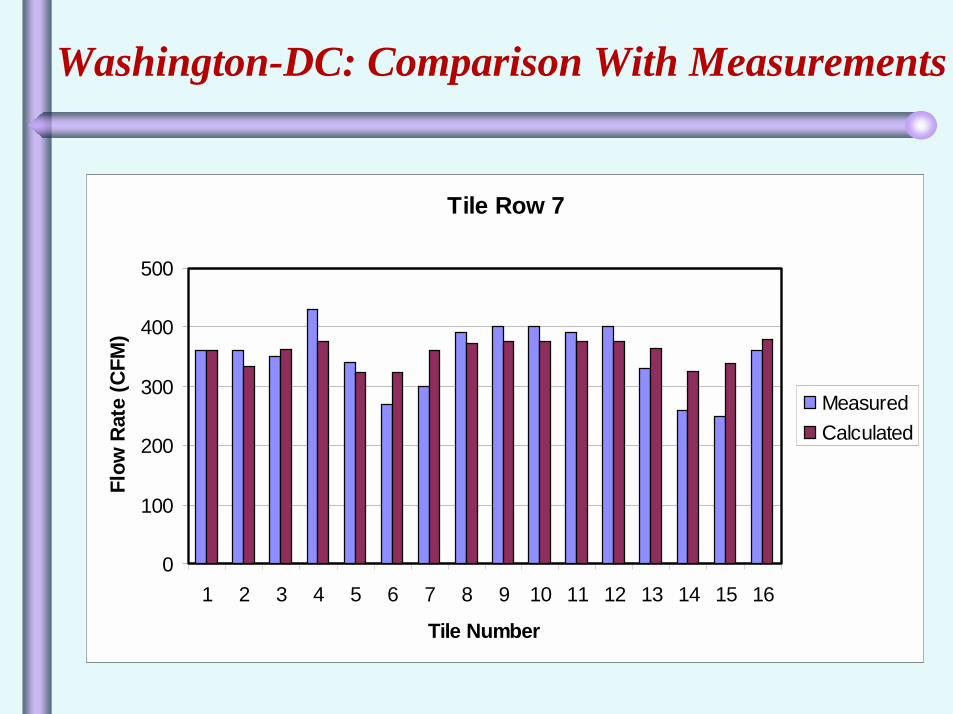
Washington-DC: Comparison With Measurements
Tile Row 7
0
100
200
300
400
500
1 2 3 4 5 6 7 8 9 10 11 12 13 14 15 16
Tile Number
Flow
Rat
e (C
FM)
MeasuredCalculated

Washington-DC: Comparison With Measurements
Tile Row 8
0
100
200
300
400
1 2 3 4 5 6 7 8 9 10 11 12 13 14 15 16
Tile Number
Flow
Rat
e (C
FM)
MeasuredCalculated

Washington-DC: Comparison With Measurements
Tile Row 9
0
100
200
300
400
1 2 3 4 5 6 7 8 9 10 11 12 13 14 15 16
Tile Number
Flow
Rat
e (C
FM)
MeasuredCalculated

Washington-DC: Comparison With Measurements
Tile Row 12
0
100
200
300
400
500
1 2 3 4 5 6 7 8 9 10 11 12 13 14 15 16
Tile Number
Flow
Rat
e (C
FM)
MeasuredCalculated

Washington-DC: Comparison With Measurements
Tile Row 13
0
100
200
300
400
500
1 2 3 4 5 6 7 8 9 10 11 12 13 14 15 16
Tile Number
Flow
Rat
e (C
FM)
MeasuredCalculated
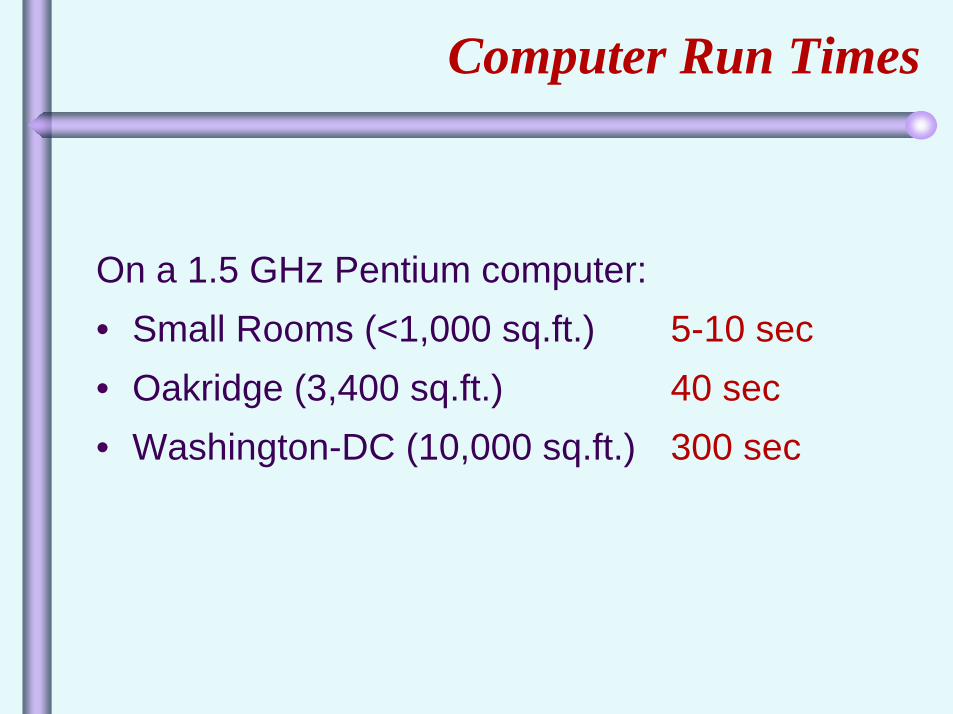
On a 1.5 GHz Pentium computer:• Small Rooms (<1,000 sq.ft.) 5-10 sec• Oakridge (3,400 sq.ft.) 40 sec• Washington-DC (10,000 sq.ft.) 300 sec
Computer Run Times

◆ A computational model has been developed for the prediction of airflow through perforated tiles in a raised-floor data center.
◆ The model predictions have been validated using flow measurements in lab-scale and real-life data centers.
◆ The model can be used to predict the effect of: tile perforations, raised-floor height, placement of CRACs, under-floor blockages, different layouts, failure scenarios, and so on.
◆ The use of the model can lead to data centers that are optimal, efficient, and reliable, and thus provide savings in capital and operating costs.
Closing Remarks