comprehensive study to reduce pedestrian crashes in florida · comprehensive study to reduce...
TRANSCRIPT

Final Report
Contract No. BDK80 977-32
Comprehensive Study to Reduce Pedestrian Crashes in Florida
Prepared for:
Research Center
Florida Department of Transportation
605 Suwannee Street, M.S. 30
Tallahassee, FL 32399-0450
Prepared by:
Priyanka Alluri, Ph.D., P.E., Research Associate
Kirolos Haleem, Ph.D., P.E., Research Associate
Albert Gan, Ph.D., Professor
Mohammad Lavasani, M.S., Graduate Research Assistant
Dibakar Saha, M.S., Graduate Research Assistant
Lehman Center for Transportation Research
Florida International University
10555 West Flagler Street, EC 3680
Miami, FL 33174
Phone: (305) 348-3116
Fax: (305) 348-2802
E-mail: [email protected]
December 2013
(Revised January 2015)

ii
DISCLAIMER
The opinions, findings, and conclusions expressed in this publication are those of the authors and
not necessarily those of the State of Florida Department of Transportation.

iii
METRIC CONVERSION CHART
SYMBOL WHEN YOU KNOW MULTIPLY BY TO FIND SYMBOL
LENGTH
in inches 25.4 millimeters mm
ft feet 0.305 meters m
yd yards 0.914 meters m
mi miles 1.61 kilometers km
mm millimeters 0.039 inches in
m meters 3.28 feet ft
m meters 1.09 yards yd
km kilometers 0.621 miles mi
SYMBOL WHEN YOU KNOW MULTIPLY BY TO FIND SYMBOL
AREA
in2 square inches 645.2 square millimeters mm2
ft2 square feet 0.093 square meters m2
yd2 square yard 0.836 square meters m2
ac acres 0.405 hectares ha
mi2 square miles 2.59 square kilometers km2
mm2 square millimeters 0.0016 square inches in2
m2 square meters 10.764 square feet ft2
m2 square meters 1.195 square yards yd2
ha hectares 2.47 acres ac
km2 square kilometers 0.386 square miles mi2
SYMBOL WHEN YOU KNOW MULTIPLY BY TO FIND SYMBOL
VOLUME
fl oz fluid ounces 29.57 milliliters mL
gal gallons 3.785 liters L
ft3 cubic feet 0.028 cubic meters m3
yd3 cubic yards 0.765 cubic meters m3
mL milliliters 0.034 fluid ounces fl oz
L liters 0.264 gallons gal
m3 cubic meters 35.314 cubic feet ft3
m3 cubic meters 1.307 cubic yards yd3
NOTE: volumes greater than 1,000 L shall be shown in m3
iv
Technical Report Documentation Page 1. Report No.
2. Government Accession No.
3. Recipient′s Catalog No.
4. Title and Subtitle
Comprehensive Study to Reduce Pedestrian Crashes in Florida
5. Report Date
December 2013
(Revised January 2015) 6. Performing Organization Code
7. Author(s)
Priyanka Alluri, Kirolos Haleem, Albert Gan, Mohammad Lavasani, and
Dibakar Saha
8. Performing Organization Report No.
9. Performing Organization Name and Address
Lehman Center for Transportation Research
Florida International University
10555 West Flagler Street, EC 3680, Miami, FL 33174
10. Work Unit No. (TRAIS)
11. Contract or Grant No.
BDK80 977-32
12. Sponsoring Agency Name and Address
Research Center
State of Florida Department of Transportation
605 Suwannee Street, M.S. 30, Tallahassee, Florida 32399-0450
13. Type of Report and Period Covered
Final Report
June 2012 – December 2013 14. Sponsoring Agency Code
99700-3596-119 15. Supplementary Notes
Mr. Joseph Santos, P.E., of the State Safety Office at the Florida Department of Transportation served as the Project
Manager for this project.
16. Abstract
Pedestrian crashes are a major traffic safety concern in Florida. This project aims to improve pedestrian safety on
Florida’s state roads by identifying crash patterns and contributing factors at both the statewide and site-specific
level and proposing potential countermeasures to reduce pedestrian crashes. The specific project objectives include:
(1) perform a comprehensive review of existing pedestrian safety studies; (2) identify statewide pedestrian crash
patterns and causes; (3) identify factors contributing to pedestrian injury severity; and (4) identify and analyze
pedestrian high crash locations at both signalized and non-signalized locations for crash causes and propose the
potential countermeasures for these crash causes.
A total of 6,434 pedestrian crashes that occurred on state roads during 2008-2010 were identified and analyzed.
Police reports for these crashes were carefully reviewed to obtain additional crash details, including those from
police descriptions and illustrative sketches. In addition, additional roadway information not available from the state
roadway inventory such as types of crosswalks were visually identified. Both of these efforts were performed using
two in-house web-based systems developed to facilitate police report review and data collection.
At the statewide level, crash patterns as they relate to pedestrian, vehicle, traffic control, roadway, and environmental
characteristics were analyzed. As pedestrian crashes are typically severe, a mixed logit model was developed to
identify factors contributing to pedestrian injury severity at signalized and non-signalized locations. At the site-
specific level, pedestrian high crash locations were identified by identifying clusters of pedestrian crashes at both
signalized and non-signalized locations. Both district-wide and statewide pedestrian high crash locations were
identified. The statewide locations were further analyzed to identify location-specific crash causes and
countermeasures.
17. Key Word
Pedestrian safety, crash patterns and causes, injury severity, high crash
locations, crash countermeasures.
18. Distribution Statement
19. Security Classif. (of this report)
Unclassified 20. Security Classif. (of this page)
Unclassified 21. No. of Pages
143 22. Price
Form DOT F 1700.7 (8-72) Reproduction of completed page authorized
v
ACKNOWLEDGEMENTS
This research was funded by the Research Center of the Florida Department of Transportation
(FDOT) under the direction of Mr. Darryll Dockstader. We are particularly grateful to our
Project Manager, Mr. Joseph Santos, P.E., of the FDOT State Safety Office for his guidance and
support throughout the project.
We would like to thank the following graduate research assistants at the FIU Lehman Center for
Transportation Research (LCTR) for their assistance in data preparation: Ms. Somaye Fakharian,
Ms. Homa Fartash, Ms. Maria Guevara, Mr. Hussam Hadi, Ms. Katrina Meneses, Ms. Stephanie
Miranda, Ms. Anita Pourji, and Mr. Eazaz Sadeghvaziri.
We would like to extend a special thanks to Dr. Kaiyu Liu of LCTR for customizing the Visual
Roadway Inventory Collection System (VRICS) for data collection, and Mr. Haifeng Wang, also
of LCTR, for developing an application to review police reports. We would also like to thank Dr.
Wanyang Wu, also of LCTR, for assisting in spatial analysis.
Last but certainly not the least, a special thanks is due to Ms. Vicki Morrison of the FDOT
Research Center for her editing of this report.

vi
EXECUTIVE SUMMARY
Pedestrian crashes are a major safety concern in Florida. About one in every five traffic-related
fatalities in the state is a pedestrian. The goal of this project is to conduct a comprehensive study
to improve pedestrian safety on state roads in Florida. The specific project objectives include:
1. Reviewing and summarizing existing pedestrian safety studies, including methods of
analysis, and findings on pedestrian crash causes, crash contributing factors, and potential
countermeasures.
2. Identifying statewide pedestrian crash patterns and causes.
3. Identifying factors contributing to pedestrian injury severity.
4. Identifying and analyzing pedestrian high crash locations at both signalized and non-
signalized locations for crash causes and potential countermeasures.
For this study, a total of 6,434 pedestrian crashes that occurred on state roads during 2008-2010
were identified. A major effort of this project involved detailed review of police reports for these
crashes to obtain additional crash details, including those from police descriptions and
illustrative sketches, which are not available from crash summary records. In addition, additional
roadway information not available from the state roadway inventory such as types of crosswalks
were visually identified. Both of these efforts were performed using two in-house web-based
systems developed to facilitate police report review and data collection.
Literature Review
There has been significant effort in analyzing pedestrian crashes and identifying pedestrian risk
factors. Existing methods for identifying pedestrian hot spots are broadly classified into three
categories: density, clustering, and exposure estimation. In the density method, simple and
Kernel methods are the two commonly used crash density calculation methods. Among these two
methods, the Kernel method is regarded as a better approach since it generates a well fitted
smooth curve. The second method relies on the clustering technique and has been successfully
applied in safety analysis to identify groups of crashes. The third method of hot spot
identification is exposure estimation. This includes statistical regression models, sketch plan and
network models, micro-simulation models, and computer vision techniques.
Several pedestrian countermeasures have been proposed in the literature to improve pedestrian
safety. These include but are not limited to, converting intersections to roundabouts, installing
raised medians and refuge islands, adding on-street parking, installing pedestrian signals,
modifying signal phasing, installing pedestrian countdown signals, improving lighting at
intersections, and illuminating crosswalks. The majority of these countermeasures were found to
have been effective in reducing pedestrian crashes and fatalities.
Statewide Crash Patterns and Causes
Statewide crash patterns and causes were identified based on the 6,434 pedestrian crashes in the
three-year analysis period. The crashes resulted in a total of 663 pedestrian fatalities (i.e.,
10.3%). Overall, there were 124.7 total crashes and 13 fatal crashes per million population

vii
annually. Of the different age groups, the young pedestrian group (16-25 years) experienced the
highest number of pedestrian crashes per million population and also the highest pedestrian crash
rate per million walk trips per year. Older people were found to experience a slightly higher
number of fatal crashes per million walk trips per year. Although a majority of crashes occurred
during daytime, they resulted in a lower proportion of fatalities. At 5% significance level, the
proportion of fatal crashes that occurred during nighttime were significantly greater compared to
the proportion of fatal crashes in the daytime.
Overall, pedestrians were found to be at fault in over 53.0% of the crashes and drivers were at
fault in 28.2% of the crashes. Irrespective of who was at fault, failing to yield right-of-way and
disregarding traffic control devices were the two major contributing causes for pedestrian
crashes. Moreover, crashes where pedestrian was at fault were found to be more severe
compared to the crashes where the driver was at fault, and this difference was found to be
statistically significant.
A majority of the crashes occurred primarily on urban principal arterials. Although the majority
of pedestrian crashes occurred in urban areas and especially in metropolitan areas, fatal crashes
were disproportionately high in rural areas. Moreover, the proportion of fatal crashes decreased
with urbanization. Crashes along the locations with higher speed limits resulted in a greater
proportion of fatal crashes. At a 5% significance level, there was no significant difference in the
proportion of fatal crashes at signalized intersections across the following crosswalk types:
standard, continental, ladder, and solid with special surface. Furthermore, crash data did not
indicate that continental and ladder types had a better safety performance than standard
crosswalks at signalized intersections during nighttime.
Statewide Crash Severity Contributing Causes
Mixed logit models were developed to identify significant geometric, traffic, road user,
environmental, and vehicle factors contributing to pedestrian injury severity at signalized and
non-signalized locations. At both signalized and non-signalized locations, the following ten
variables were chosen to be included in the model: percentage of trucks, natural logarithm of
average annual daily traffic (AADT), crosswalk type, lighting condition, pedestrian age, speed
limit, hour of crash, at-fault road user, vehicle type, and weather condition.
The results from the mixed logit models showed that:
Crashes where pedestrians were at fault were more likely to result in severe injuries
compared to the crashes where drivers were at fault or both pedestrians and drivers were
at fault at both signalized and non-signalized locations.
Crashes involving at-fault pedestrians resulted in a greater probability of severe injuries
at non-signalized locations compared to signalized locations.
Very young pedestrians were associated with lower probability of severe injuries at both
signalized and non-signalized locations.
Very old pedestrians were associated with higher probability of severe injuries at both
signalized and non-signalized locations.

viii
Very old pedestrians have a greater severity risk at signalized locations compared to non-
signalized locations.
At signalized locations, rainy weather was associated with a slight increase in the
probability of severe injuries compared to other weather conditions.
Dark conditions, with and without street light, were associated with an increase in the
probability of severe injuries at both signalized and non-signalized locations.
At non-signalized locations, vans were found to be associated with an increase in the
probability of severe injuries compared to other vehicle types.
Increasing the speed limit at signalized and non-signalized locations was associated with
higher severe injury probability.
The increase in speed limit at non-signalized locations posed greater pedestrian severity
risk compared to signalized locations.
At non-signalized locations, pedestrians crossing the roadway were associated with
higher probability of severe injuries compared to pedestrians walking along the roadway.
At signalized locations, increasing the AADT and the percentage of trucks significantly
increased the probability of severe pedestrian injuries.
At signalized locations, the probability of severe pedestrian injuries was higher during the
night and dawn off-peak periods.
Pedestrian Crash Causes and Countermeasures at Signalized Locations
Urban signalized intersections with observed pedestrian crash frequency greater than three
standard deviations from the average crash frequency were identified and analyzed. A total of 21
signalized intersections with ≥ 6 pedestrian crashes during 2008-2010 were included in the
analysis. Police reports of all the crashes that occurred at these high crash intersections were
reviewed and the crash contributing factors related to each of the following six types of crashes
were analyzed:
1. Crashes that involved right-turning vehicles.
2. Crashes that involved left-turning vehicles.
3. Crashes that occurred in the vicinity of bus stops.
4. Crashes that involved pedestrians who were not crossing at designated crossing locations.
5. Crashes that occurred in left-turning lanes and right-most lanes.
6. Crashes that involved pedestrians in a crosswalk and through traffic.
Pedestrian crashes involving turning traffic at signalized intersections could be prevented by
eliminating the potential vehicle-pedestrian conflicts. At locations with high pedestrian volumes,
prohibiting right turns on red could be an easy strategy to minimize pedestrian conflicts
involving right-turning vehicles. Additionally, providing a leading pedestrian interval (LPI) that
gives pedestrians a head start while crossing the intersection could improve pedestrian safety.
Pedestrian crashes involving left-turning vehicles could be reduced by providing either a
protected left-turn phase or an exclusive protected pedestrian signal.
Several pedestrian crashes occurred when the pedestrian walked in front of the bus onto the
approaching traffic. These types of pedestrian crashes could be prevented by improving roadway
lighting and providing curb extensions in the vicinity of bus stops. Furthermore, relocating near-

ix
side bus stops to the far-side of the intersection could eliminate sight-distance restrictions,
improving pedestrian safety.
At locations where pedestrians are expected to cross multi-lane roads with high travel speeds and
heavy traffic, the following countermeasures could be effective in reducing pedestrian crash
frequency and severity:
ensure curb ramps are provided to make crossing easier for all pedestrians,
install lighting along the corridor,
require pedestrians to cross the roadway at designated crossing locations such as
crosswalks, and
install traffic calming measures, such as providing speed bumps, lane narrowing, etc.
Agency-wide education campaigns on the laws pertaining to pedestrians and the safety benefits
of using pedestrian facilities such as crosswalks, sidewalks, and pedestrian refuge islands could
improve pedestrian safety. Furthermore, extensive driver education campaigns that focus on
driver compliance with pedestrian right-of-way laws and stricter enforcement could prevent the
crashes that were due to driver error.
Pedestrian Crash Causes and Countermeasures at Non-signalized Locations
ArcGIS 10.0 was used to identify the non-signalized locations with more than one pedestrian
crash. The top high crash non-signalized locations were identified based on critical pedestrian
crash frequency (i.e., greater than three standard deviations from the average crash frequency). A
total of 14 non-signalized locations with ≥ 5 crashes during 2008-2010 were included in the
analysis. Police reports of the 115 crashes that occurred at these 14 locations were reviewed in
detail to identify pedestrian crash causes and potential countermeasures. Several of the
pedestrian crash types identified at signalized intersections were also found at non-signalized
locations. Particularly, the following types of crashes were observed at both signalized and non-
signalized locations:
1. Crashes that occurred in the vicinity of bus stops.
2. Crashes that involved pedestrians who were not crossing at designated crossing locations.
3. Crashes that occurred in left-turning lanes and right-most lanes.
4. Crashes that involved pedestrians in a crosswalk and through traffic.
In addition to the above identified crash types, the following two types of crashes were identified
at non-signalized locations: crashes that occurred at undivided roadways, and crashes that
involved pedestrians walking along a roadway. Crash contributing factors related to these two
types of crashes were analyzed.
Undivided roadway segments were found to experience a greater number of pedestrian crashes
compared to the locations with raised medians. Raised medians act as pedestrian refuge areas,
providing an opportunity for pedestrians to pause while crossing multiple lanes of traffic.
Therefore, constructing raised medians is recommended on multi-lane corridors with high traffic.
In addition to the construction of raised medians, agency-wide pedestrian education campaigns

x
focusing on the safety benefits of raised medians is recommended to discourage pedestrians from
crossing multiple travel lanes without stopping and waiting for sufficient gaps to cross.
Sidewalks not only encourage walking but also significantly improve pedestrian safety. At
locations with no sidewalks, pedestrians are forced to walk along the edge of the roadway,
increasing the potential for pedestrian crashes. If feasible, it is recommended to provide
sidewalks, or at a minimum paved shoulder, on both sides of the road.

xi
TABLE OF CONTENTS
DISCLAIMER .............................................................................................................................................. ii
METRIC CONVERSION CHART ............................................................................................................. iii
TECHNICAL REPORT DOCUMENTATION PAGE ............................................................................... iv
ACKNOWLEDGEMENTS .......................................................................................................................... v
EXECUTIVE SUMMARY ......................................................................................................................... vi
LIST OF FIGURES ................................................................................................................................... xiii
LIST OF TABLES ...................................................................................................................................... xv
LIST OF ACRONYMS/ABBREVIATIONS ............................................................................................ xvi
CHAPTER 1 INTRODUCTION ................................................................................................................ 1 1.1 Background .......................................................................................................................................... 1 1.2 Project Goal and Objectives ................................................................................................................ 2 1.3 Report Organization ............................................................................................................................. 2
CHAPTER 2 LITERATURE REVIEW ..................................................................................................... 3 2.1 Risk Factors Affecting Pedestrian Crashes .......................................................................................... 3
2.1.1 Pedestrian Crash Frequency Risk Factors ................................................................................. 3 2.1.2 Pedestrian Crash Severity Risk Factors .................................................................................... 6
2.2 Pedestrian Exposure............................................................................................................................. 7 2.2.1 Statistical Regression Models ................................................................................................... 9 2.2.2 Sketch Plan Models ................................................................................................................. 11 2.2.3 Network Models ...................................................................................................................... 11 2.2.4 Micro-simulation and Computer Vision Techniques .............................................................. 11
2.3 Pedestrian Conflict and Behavior Analyses ....................................................................................... 12 2.4 Pedestrian Hot Spot Identification Methods ...................................................................................... 13
2.4.1 Density Methods ..................................................................................................................... 14 2.4.2 Clustering Methods ................................................................................................................. 17
2.5 Evaluation of Pedestrian Countermeasures ....................................................................................... 19 2.5.1 Examples of Pedestrian Countermeasures .............................................................................. 19 2.5.2 Relevant Studies ...................................................................................................................... 30
2.6 Pedestrian Safety Programs ............................................................................................................... 33 2.7 Summary ............................................................................................................................................ 35
CHAPTER 3 DATA PREPARATION ....................................................................................................... 37 3.1 Pedestrian Crash Data ........................................................................................................................ 37 3.2 Intersection Data ................................................................................................................................ 41 3.3 Summary ............................................................................................................................................ 42
CHAPTER 4 STATEWIDE CRASH PATTERNS AND CAUSES ........................................................ 43 4.1 Crash Characteristics ......................................................................................................................... 43
4.1.1 Crash Severity ......................................................................................................................... 43 4.1.2 Population and Number of Walk Trips ................................................................................... 44

xii
4.1.3 Lighting ................................................................................................................................... 45 4.1.4 At-fault Road User .................................................................................................................. 46
4.2 Roadway Characteristics ................................................................................................................... 47 4.2.1 Functional Classification ......................................................................................................... 47 4.2.2 Area Type ................................................................................................................................ 47 4.2.3 Crash Location ........................................................................................................................ 49 4.2.4 Crosswalk Type ....................................................................................................................... 50
4.3 Statewide Pedestrian Crash Concentrations ...................................................................................... 52 4.4 Summary ............................................................................................................................................ 54
CHAPTER 5 STATEWIDE CRASH SEVERITY CONTRIBUTING FACTORS ................................. 56 5.1 Data Preparation ................................................................................................................................ 56 5.2 Methodology ...................................................................................................................................... 59
5.2.1 Random Forest Technique ...................................................................................................... 59 5.2.2 Mixed Logit Model ................................................................................................................. 60
5.3 Random Forest Technique Results .................................................................................................... 61 5.4 Mixed Logit Model Results ............................................................................................................... 63
5.4.1 Signalized Locations Model .................................................................................................... 63 5.4.2 Non-signalized Locations Model ............................................................................................ 66
5.5 Summary ............................................................................................................................................ 68
CHAPTER 6 SIGNALIZED LOCATIONS ............................................................................................. 70 6.1 District-wide Pedestrian High Crash Signalized Intersections .......................................................... 70 6.2 Statewide Pedestrian High Crash Signalized Intersections ............................................................... 72
6.2.1 Location Identification ............................................................................................................ 73 6.2.2 Condition-collision Diagrams ................................................................................................. 74 6.2.3 Crash Contributing Factors and Potential Countermeasures ................................................... 85
6.3 Summary ............................................................................................................................................ 94
CHAPTER 7 NON-SIGNALIZED LOCATIONS ................................................................................... 96 7.1 District-wide Pedestrian High Crash Non-signalized Locations ....................................................... 96 7.2 Statewide Pedestrian High Crash Non-signalized Locations ............................................................. 98
7.2.1 Location Identification ............................................................................................................ 98 7.2.2 Condition-collision Diagrams ................................................................................................. 99 7.2.3 Crash Contributing Factors and Potential Countermeasures ................................................. 107
7.3 Summary .......................................................................................................................................... 109
CHAPTER 8 SUMMARY AND CONCLUSIONS ............................................................................... 111 8.1 Literature Review ............................................................................................................................ 111 8.2 Statewide Crash Patterns and Causes .............................................................................................. 111 8.3 Statewide Crash Severity Contributing Causes ............................................................................... 112 8.4 Pedestrian Crash Causes and Countermeasures at Signalized Locations ........................................ 113 8.5 Pedestrian Crash Causes and Countermeasures at Non-signalized Locations ................................. 114
REFERENCES ......................................................................................................................................... 116
xiii
LIST OF FIGURES
Figure 2-1: Simple Density Method............................................................................................................ 14 Figure 2-2: Kernel Density Estimation Method .......................................................................................... 15 Figure 2-3: Kernel Probability Density Curve Smoothing ......................................................................... 16 Figure 2-4: Curb Ramps .............................................................................................................................. 20 Figure 2-5: Crosswalk Marking Types ....................................................................................................... 20 Figure 2-6: Crosswalk with Ladder Pattern ................................................................................................ 21 Figure 2-7: Intersection with Tight Turning Radii ...................................................................................... 22 Figure 2-8: Curb Extension ......................................................................................................................... 23 Figure 2-9: Pedestrian Refuge Island .......................................................................................................... 23 Figure 2-10: Roundabout ............................................................................................................................ 24 Figure 2-11: Right-turn Slip Lane ............................................................................................................... 24 Figure 2-12: Speed Hump ........................................................................................................................... 25 Figure 2-13: Raised Pedestrian Crossing .................................................................................................... 25 Figure 2-14: Traffic Diverter ...................................................................................................................... 26 Figure 2-15: High Intensity Activated Crosswalk (HAWK) ...................................................................... 27 Figure 2-16: Enhanced Signal Diagram ...................................................................................................... 27 Figure 2-17: Countdown Signal .................................................................................................................. 27 Figure 2-18: Standard and Blank out Signs ................................................................................................ 28 Figure 2-19: Flashing Pedestrian Crossing Lights ...................................................................................... 29 Figure 2-20: Pedestrian Signal with Animated Eye .................................................................................... 29 Figure 2-21: Signalized Intersection with Advanced Stop Lines ................................................................ 30 Figure 3-1: Description in Police Report (Crash ID: 105745350) .............................................................. 38 Figure 3-2: Description in Police Report (Crash ID: 90438654) ................................................................ 39 Figure 3-3: A Web-based Tool Customized to Review Police Reports ...................................................... 40 Figure 3-4: A Web-based VRICS Tool Customized to Collect Intersection Data ...................................... 41 Figure 4-1: Pedestrian Crash Statistics by Area Type and Population ....................................................... 49 Figure 4-2: Spatial Distribution of Pedestrian Crashes ............................................................................... 53 Figure 4-3: Pedestrian Crash Density ......................................................................................................... 54 Figure 5-1: Variable Importance Ranking Using Random Forest .............................................................. 62 Figure 5-2: Plot of Out-of-Bag Error Against Number of Trees ................................................................ 63 Figure 6-1: E Oakland Park Blvd and N Andrews Ave .............................................................................. 75 Figure 6-2: Silver Star Rd and N Pine Hills Rd .......................................................................................... 75 Figure 6-3: SR 7 and NW 50th St ............................................................................................................... 76 Figure 6-4: W Waters Ave and N Florida Ave ........................................................................................... 76 Figure 6-5: Silver Star Rd and N Hiawassee Rd ......................................................................................... 77 Figure 6-6: E Fowler Ave and N 15th St .................................................................................................... 77 Figure 6-7: NW 95th St and NW 7th Ave .................................................................................................. 78 Figure 6-8: S Dixie Hwy and Caribbean Blvd ............................................................................................ 78 Figure 6-9: NW 27th St and NW 183rd St .................................................................................................. 79 Figure 6-10: W Sunrise Blvd and NW 7th Ave .......................................................................................... 79 Figure 6-11: W Oakland Park Blvd and SR 7 ............................................................................................. 80 Figure 6-12: NE 167th St and NE 6th Ave ................................................................................................. 80 Figure 6-13: NE 36th St and Biscayne Blvd ............................................................................................... 81 Figure 6-14: NW 7th Ave and NW 54th St ................................................................................................ 81 Figure 6-15: NW 79th St and NW 7th Ave ................................................................................................ 82 Figure 6-16: N Semoral Blvd and Old Cheney Hwy .................................................................................. 82 Figure 6-17: E Oakland Park Blvd and NE 6th Ave ................................................................................... 83 Figure 6-18: 10th Ave N and S Congress Ave ............................................................................................ 83 Figure 6-19: Collins Ave and 174th St ....................................................................................................... 84

xiv
Figure 6-20: W Broward Blvd and NW 31st Ave....................................................................................... 84 Figure 6-21: US 192 and N John Young Pkwy .......................................................................................... 85 Figure 6-22: Pedestrian Crash Involving Right-turning Vehicle ................................................................ 86 Figure 6-23: Ring-Barrier Diagram with a Leading Pedestrian Interval .................................................... 86 Figure 6-24: An Illustrative Example of Leading Pedestrian Interval ........................................................ 87 Figure 6-25: Intersection Conflict Areas of Left-turning Traffic ................................................................ 87 Figure 6-26: Pedestrian Crash Involving Left-turning Vehicle .................................................................. 88 Figure 6-27: Crash That Involved Pedestrian Walking In front of a Bus ................................................... 89 Figure 6-28: Crash Where Pedestrian Was Not Using a Crosswalk Although a Crosswalk Is in the
Vicinity ............................................................................................................................. 90 Figure 6-29: Pedestrian Crash That Occurred in the Right-most Lane ....................................................... 91 Figure 6-30: Pedestrian Crash That Occurred in the Left-most Lane ......................................................... 91 Figure 6-31: Pedestrian Crash Where Median Was Not Used as a Refuge Area ....................................... 92 Figure 6-32: Potential Conflict between Pedestrian in a Crosswalk and Through Traffic ......................... 93 Figure 6-33: Pedestrian Hit by Oncoming Traffic in Adjacent Lane .......................................................... 93 Figure 7-1: NE 6th Ave near NE 149th St in Miami ................................................................................ 100 Figure 7-2: SW 12th Ave near SW 3rd St in Miami ................................................................................. 100 Figure 7-3: SW 8th St near SW 36th Ct in Miami .................................................................................... 101 Figure 7-4: Gulf Blvd near 106th Ave in Treasure Island ....................................................................... 101 Figure 7-5: SW 107th Ave South of SW 88th St in Miami ...................................................................... 102 Figure 7-6: 4th St N near 6th Ave N in St Petersburg .............................................................................. 102 Figure 7-7: Collins Ave near 15th St in Miami Beach.............................................................................. 103 Figure 7-8: US 441 and 41st Street in Orlando ......................................................................................... 103 Figure 7-9: Griffin Rd near SW 33rd Ave in Ft Lauderdale ..................................................................... 104 Figure 7-10: Seminole Blvd near 98th Ave in Seminole ......................................................................... 104 Figure 7-11: NW 79th St near NW 9th Ave in Miami .............................................................................. 105 Figure 7-12: 4th St N near 74th Ave N in St Petersburg ......................................................................... 105 Figure 7-13: Blind Pass Rd near 77th Ave in St Pete Beach .................................................................... 106 Figure 7-14: Gulf Bch Hwy near Colbert Ave in Pensacola ..................................................................... 106 Figure 7-15: Pedestrian Crash at a TWLTL .............................................................................................. 108 Figure 7-16: An Example of a Crash Where a Pedestrian was Struck While in Crosswalk at a
Location with TWLTL .................................................................................................... 108 Figure 7-17: Pedestrian Crash That Occurred While Pedestrian was Walking Along the Roadway ....... 109

xv
LIST OF TABLES
Table 2-1: Exposure Based on Number of Pedestrians ................................................................................. 8 Table 2-2: Exposure Based on Number of Trips .......................................................................................... 8 Table 2-3: Exposure Based on Distance Traveled ........................................................................................ 8 Table 2-4: Exposure Based on Population .................................................................................................... 9 Table 2-5: Exposure Based on Time Spent Walking .................................................................................... 9 Table 2-6: Common Pedestrian Countermeasures and Corresponding CMFs ........................................... 31 Table 4-1: Annual Pedestrian Crash Statistics by Severity ......................................................................... 43 Table 4-2: Statistics by Age, Population, and Crash Severity .................................................................... 44 Table 4-3: Statistics by Age, Number of Walk Trips, and Crash Severity ................................................. 45 Table 4-4: Statistics by Lighting Condition ................................................................................................ 46 Table 4-5: Statistics by At-fault Road User ................................................................................................ 46 Table 4-6: Statistics by Contributing Cause ............................................................................................... 47 Table 4-7: Statistics by Functional Class .................................................................................................... 48 Table 4-8: Statistics by Speed Limit ........................................................................................................... 48 Table 4-9: Statistics by Area Type .............................................................................................................. 48 Table 4-10: Statistics by Crash Location .................................................................................................... 49 Table 4-11: Statistics by Crosswalk Type ................................................................................................... 50 Table 4-12: Significance Tests for Pedestrian Crashes that Occurred at Different Crosswalks ................. 51 Table 4-13: Statistics by Crosswalk Type and Lighting Condition ............................................................ 51 Table 5-1: Summary Statistics of Explored Variables at Signalized Locations ......................................... 57 Table 5-2: Summary Statistics of Explored Variables at Non-Signalized Locations ................................. 58 Table 5-3: Correlation Matrix of Explored Variables at Signalized Locations .......................................... 59 Table 5-4: Correlation Matrix of Explored Variables at Non-Signalized Locations .................................. 59 Table 5-5: Mixed Logit Model Estimates at Signalized Locations ............................................................. 64 Table 5-6: Mixed Logit Model Estimates at Non-signalized Locations ..................................................... 67 Table 6-1: Pedestrian High Crash Signalized Intersections in District 1 .................................................... 70 Table 6-2: Pedestrian High Crash Signalized Intersections in District 2 .................................................... 70 Table 6-3: Pedestrian High Crash Signalized Intersections in District 3 .................................................... 71 Table 6-4: Pedestrian High Crash Signalized Intersections in District 4 .................................................... 71 Table 6-5: Pedestrian High Crash Signalized Intersections in District 5 .................................................... 71 Table 6-6: Pedestrian High Crash Signalized Intersections in District 6 .................................................... 72 Table 6-7: Pedestrian High Crash Signalized Intersections in District 7 .................................................... 72 Table 6-8: Statewide Pedestrian High Crash Urban Signalized Intersections ............................................ 74 Table 7-1: Pedestrian High Crash Non-signalized Locations in Each District ........................................... 96 Table 7-2: Statewide Pedestrian High Crash Non-signalized Locations .................................................... 99

xvi
LIST OF ACRONYMS/ABBREVIATIONS
AADT Average Annual Daily Traffic
ADA Americans with Disabilities Act
AIC Akaike Information Criterion
B/C Benefit-to-Cost Ratio
BIC Bayesian Information Criterion
CAR Crash Analysis Reporting
CMF Crash Modification Factor
CRF Crash Reduction Factor
DUI Driving Under Influence
EPDO Equivalent Property Damage Only
FDOT Florida Department of Transportation
FHWA Federal Highway Administration
GEE Generalized Estimating Equation
GIS Geographic Information System
HAWK High Intensity Activated Crosswalk
HSIP Highway Safety Improvement Program
IID Independently and Identically Distributed
ITS Intelligent Transportation Systems
KDE Kernel Density Estimation
LC Latent Class
LED Light Emitting Diode
LPI Leading Pedestrian Interval
MUTCD Manual on Uniform Traffic Control Devices
NB Negative Binomial
NCHRP National Cooperative Highway Research Program
NHTS National Household Travel Survey
NHTSA National Highway Traffic Safety Administration
NLMIXED Nonlinear Mixed
NPV Net Present Value
OOB Out-of-Bag
PA Pedestrian Actuated
PDI Pedestrian Danger Index
PELICAN Pedestrian Light Controlled
PRI Pedestrian Risk Index
PUFFIN Pedestrian User-Friendly Intelligent
RCI Roadway Characteristic Inventory
ROW Right-of-way
RTM Regression-To-the-Mean
RTOR Right-Turn on Red
RV Recreational Vehicle
SafeTrec Safe Transportation Education and Research Center
SSAM Surrogate Safety Assessment Model
T4A Transportation for America
TDTC Time Difference to Collision

xvii
TTC Time-to-Collision
TWLTL Two-Way Left-Turn Lanes
U.S. United States
UZA Urbanized Areas
VRICS Visual Roadway Inventory Collection System
VISSIM Verkehr In Städten - SIMulationsmodell

1
CHAPTER 1
INTRODUCTION
1.1 Background
Pedestrian safety is of particular concern to Florida as one in every five traffic-related fatalities
in the state is a pedestrian. A recent study by Transportation for America (T4A) (2011) has
ranked Florida as the most dangerous state in the country for pedestrians. The same study also
ranked 52 large metropolitan areas with over 1 million population. In this ranking, the top four
unfortunate spots went to Orlando/Kissimmee, Tampa/St. Petersburg/Clearwater, Jacksonville,
and Miami/Fort Lauderdale/Pompano. These rankings were given based on the Pedestrian
Danger Index (PDI), which computes the rate of pedestrian deaths relative to the amount of
walk-to-work trips in an area. Although the index favors metro areas that tend to have a higher
percentage of walk-to-work trips, the simple fact remains that Florida has the highest pedestrian
fatalities per capita based on the 2009 statistics of 2.51 pedestrian fatalities per 100,000
population.
Analyzing pedestrian crashes is a different challenge compared to analyzing vehicle crashes
because of the following reasons: pedestrian crashes are relatively rare and often very severe;
pedestrian exposure is a function of both pedestrian and vehicle volumes and their combined
effect is difficult to quantify; and pedestrian volumes are usually unavailable and are too costly
to collect especially for area-wide studies and on a regular basis. Unlike counting vehicles, which
can be automatically recorded when vehicles run over pneumatic road tubes, counting
pedestrians in the field remains largely the task of human observers.
For area-wide studies, some surrogate measures have been used to estimate the level of
pedestrian activities. A good example is the amount of walk-to-work trips used in the above T4A
study. However, such data are usually collected with very low sample sizes, and thus the data
could only be reported for very large areas such as United States Census urbanized areas
(UZAs), as is the case with the walk-to-work trips used in the T4A study. In general, surrogate
data for estimating pedestrian activities are typically unavailable at the local level for site-
specific studies, such as at an intersection or along a corridor.
Like any other site-specific safety studies, a pedestrian safety study starts with identifying
pedestrian high crash locations. As signalized intersections involve many features uniquely
affecting pedestrian safety, including design of signal timing, presence and type of crosswalks, a
concentration of bus stops with passenger transfer activities, etc., they are typically analyzed
separately from non-signalized locations. However, in both cases the locations are usually
identified based on pedestrian crash frequencies rather than crash rates for three reasons. First, as
pointed out above, pedestrian exposure depends on both pedestrian and vehicle volumes, and
pedestrian volumes are very difficult and expensive to collect especially continuously or
regularly. Second, surrogate data for estimating pedestrian volumes are not available or are not
sufficiently accurate at the local level. Third, pedestrian crashes are relatively rare, thus subject
to fluctuations from the random nature of crash occurrences. In other words, similar to using
crash rates on low-volume roads, the random occurrence of a single crash could raise the crash
rate at a location high enough to place it on the high crash list.

2
1.2 Project Goal and Objectives
The goal of this project is to conduct a comprehensive study to improve pedestrian safety on
state roads in Florida. The specific project objectives include:
1. Reviewing and summarizing existing pedestrian safety studies, including methods of
analysis, and findings on pedestrian crash causes, crash contributing factors, and potential
countermeasures.
2. Identifying statewide pedestrian crash patterns and causes.
3. Identifying factors contributing to pedestrian injury severity.
4. Identifying and analyzing pedestrian high crash locations at both signalized and non-
signalized locations for crash causes and potential countermeasures.
The scope of this project is comprehensive as it involves multiple years of pedestrian crashes
statewide and with detailed review of all police reports to obtain additional details, including
those from police descriptions and illustrative sketches, which are not available from crash
summary records.
1.3 Report Organization
The rest of the report is organized as follows. Chapter 2 provides an extensive review of existing
literature on pedestrian safety, including risk factors affecting frequency and severity of
pedestrian crashes, pedestrian exposure measures, pedestrian-vehicle conflict analysis
techniques, pedestrian hot spot identification methods, pedestrian crash countermeasures and
their evaluation, and pedestrian safety programs.
Chapter 3 summarizes the effort undertaken to review police reports and collect data on existing
pedestrian facilities at signalized intersections. Chapter 4 focuses on identifying the overall
statewide pedestrian crash patterns and causes. Particularly, general trends by crash and roadway
characteristics are discussed. The Chapter also includes a discussion on the statewide pedestrian
high crash concentrations.
As pedestrian crashes typically result in injuries, Chapter 5 aims to identify significant factors
contributing to pedestrian crash injury severity. Chapters 6 and 7 focus on the identification and
analysis of pedestrian high crash signalized and non-signalized locations, respectively. Finally,
Chapter 8 provides a summary of this project effort and the relevant findings and conclusions.

3
CHAPTER 2
LITERATURE REVIEW
This chapter provides a comprehensive review of literature on pedestrian safety. The specific
areas covered include risk factors affecting frequency and severity of pedestrian crashes,
pedestrian exposure measures, use of surrogate crash measures and conflict analysis to evaluate
pedestrian safety and crossing behaviors, methods to identify pedestrian high crash locations,
evaluation of pedestrian crash countermeasures, and pedestrian safety programs.
2.1 Risk Factors Affecting Pedestrian Crashes
2.1.1 Pedestrian Crash Frequency Risk Factors
There have been numerous studies that aimed to identify significant factors affecting frequency
and severity of pedestrian crashes. This section highlights studies that investigated pedestrian
crash frequency risk factors. Noland and Quddus (2004) used cross-sectional time series data for
11 regions in Great Britain over a period of 20 years. Using the negative binomial (NB) model,
the authors found that alcohol involvement was positively associated with increased pedestrian
crashes. Ukkusuri et al. (2011) identified the significant socio-demographic and environmental
characteristics affecting pedestrian crash frequency at different census tracts or geographic
regions in New York City. They found a significant positive correlation between pedestrian crash
frequency in the vicinity of African-American or Hispanic neighborhoods, and across areas with
a greater proportion of median-age and uneducated populations. They also found that areas with
a greater number of schools and commercial land uses were more prone to pedestrian crashes.
These findings were consistent to those from Kim and Ortega (1999), LaScala et al. (2000), and
Azam et al. (2012). For example, Azam et al. (2012) observed that increased pedestrian activities
in dense road networks increased pedestrian exposure and resulted in more pedestrian crashes.
Findings similar to those of Ukkusuri et al. (2011) were also observed by Kravetz and Noland
(2012) who examined the relationship between pedestrian crashes and low-income communities
in three counties in northern New Jersey (in the New York metropolitan area). The authors used
the NB regression model and found that low median income and high Black and Latino
populations were associated with high pedestrian crashes. Another study on the New York
metropolitan area was conducted by Ukkusuri et al. (2012) who used five-year crash data and
identified contributing factors of pedestrian crashes. They found that regions with a greater
fraction of residential land had significantly lower likelihood of pedestrian crashes, which
concurs with the study by Kim and Yamashita (2002). The authors also showed that the
likelihood of pedestrian crashes increased with the increase in road width. Similarly, Garder
(2004) also concluded that wider roads could increase pedestrian crash frequency.
Prato et al. (2012) identified pedestrian crash patterns to design preventive measures. The
authors employed neural networks approach to analyze pedestrian fatal crashes during the four-
year period between 2003 and 2006 in Israel. They observed five notable pedestrian crash
patterns: (a) elderly pedestrians crossing on crosswalks mostly far from intersections in
metropolitan areas; (b) pedestrians crossing from hidden places and colliding with two-wheel
vehicles in urban areas; (c) male pedestrians crossing at night and hit by four-wheel vehicles in

4
rural areas; (d) young male pedestrians crossing at night in both urban and rural areas; and (e)
children and teenagers crossing in small rural communities. The observed crash patterns pointed
to the importance of designing education and information campaigns for road users, and
allocating resources for infrastructural interventions.
Fernandes et al. (2012) analyzed pedestrian crashes at 1,875 signalized intersections in Canada to
identify potential geometric and environmental factors affecting pedestrian safety. Various NB
models were fitted to the data with and it was found that vehicular traffic was the main
contributing factor affecting pedestrian crash frequency. They also found that through vehicular
movements at intersections had a greater effect on crash rates than left- and right-turn
movements. In addition, geometric variables that were found significant included number of
exclusive left-turn lanes, number of commercial entrances and exits, and total crossing distance.
Higher number of exclusive left-turn lanes was found to decrease pedestrian crashes, whereas
longer crossing distances and more commercial entrances and exits were found to increase
pedestrian crashes. Another study by Qi and Li (2012) found that right-turn-on-red (RTOR)
maneuvers did not lead to increased pedestrian crash frequency.
While comparing the analysis of pedestrian crashes in China and the U.S., Zhou et al. (2013)
found that the crash data statistics in both countries followed the same declining trends, and the
total number of traffic fatalities in the U.S. was about one half of that in China. A consistent
finding was that drivers accounted for the largest fatality proportion in both countries.
Furthermore, males were involved in more pedestrian fatalities than females in both countries.
On the other hand, some discrepancies existed. For example, the second largest death group in
traffic crashes was vehicle passengers in the U.S.; however, in China, pedestrians rank the
second. In addition, in China, middle-aged individuals between 36-45 years were the most risky
group in pedestrian crashes, while in the U.S., young people aging 16-24 were the most
vulnerable. The authors proposed some countermeasures and strategies to improve pedestrian
safety in both countries, e.g., installing pedestrian overpasses/underpasses and refuge islands,
and promoting educational and enforcement campaigns.
While analyzing pedestrian traffic fatalities in Seattle, Washington, between 1990 and 1995,
Harruff et al. (1998) found that that the average age of pedestrians involved in traffic fatalities
was 49 years. This finding was also observed by Al-Shammari et al. (2009). Furthermore,
Campbell et al. (2004) concluded that male pedestrian fatalities outnumbered female fatalities in
every age group, which was consistent with other studies, including Lee and Abdel-Aty (2005),
Al-Shammari et al. (2009), and Zhou et al. (2013).
The studies conducted by Lee and Abdel-Aty (2005) and Jang et al. (2013) are two examples of
research that analyzed both frequency and severity of pedestrian crashes. Lee and Abdel-Aty
(2005) analyzed the frequency and injury severity of vehicle-pedestrian crashes at intersections
in Florida using four years of data from 1999 to 2002. They found that middle-age male drivers
and pedestrians were more involved in pedestrian crashes than the other age and gender groups;
and passenger cars were more likely to be involved in pedestrian crashes than trucks, vans, and
buses. In addition, more crashes occurred on undivided roads with a greater number of lanes than
divided roads with fewer lanes. Some of the significant factors affecting crash injury severity

5
have included pedestrian age, weather and lighting conditions, and vehicle size. For example,
pedestrian injury involving a large vehicle was more severe than those involving a passenger car.
Jang et al. (2013) used six years of pedestrian crashes from 2002 to 2007 in the City of San
Francisco to identify risk factors on the frequency and injury severity of pedestrian-involved
crashes. They used an ordered probit model and found that pedestrian characteristics that
increased pedestrian injury severity were alcohol involvement, cell phone use, and age – either
below 15 years of age or above 65 years. Environmental characteristics that were associated with
high pedestrian severity included nighttime, weekends, and rainy weather. The influence of
alcohol was found to be the primary crash factor associated with the most severe injuries. They
also found that larger vehicles such as pickups, trucks, and buses were associated with more
pedestrian severe injury compared to passenger cars.
Several studies had investigated pedestrian crashes along rarely studied locations, e.g., campus
areas (Schneider et al., 2013), parking lots (Charness et al., 2012), and highway-rail crossings
(Khattak and Luo, 2011). Schneider et al. (2013) analyzed pedestrian crashes at 22 intersections
on the boundary of the University of California, Berkeley campus during typical spring and fall
semester weekdays. The authors measured pedestrian exposure by extrapolating pedestrian
counts using data from three automated counter locations. They found that pedestrian crash risk
was highest at intersections with the lowest pedestrian volumes. In addition, pedestrian crash risk
in the evening (6 p.m. to midnight) was found to be three times higher than that in the daytime
(10 a.m. to 4 p.m.).
Charness et al. (2012) investigated pedestrian safety at parking lots based on pedestrian age. The
authors concluded that pedestrians in all age groups (i.e., young, middle, and old) used
crosswalks more frequently in parking lots. However, no significant variation was detected in
using crosswalks across age groups. More walk distractions were observed among younger
pedestrians than the elder pedestrians. Additionally, no significant differences were observed in
the attention patterns such as head turns and eye fixation while walking in crosswalks across
pedestrians in different age groups.
Khattak and Luo (2011) investigated pedestrian violations at dual-quadrant gated highway-rail
grade crossings in Fremont, Nebraska using video surveillance equipment. Examples of the
violations studied included: passing under descending gates, passing around fully lowered gates,
passing under ascending gates, and passing around fully lowered gates between successive trains.
They found that children of around eight years of age or younger were involved in 25% more
gate-related violations than older crossing individuals. Additionally, violations were shown to
increase with the presence of more individuals at the crossing during train crossing events.
Luoma and Peltola (2013) examined the safety impact of walking direction on pedestrian crash
frequencies along rural two-lane roads with no pavement or pedestrian lanes in Finland.
Reported crashes between 2006 and 2010 were included in the analysis. They observed that
when pedestrians were facing traffic, there was a 77% reduction in fatal and injury pedestrian
crashes as compared to pedestrians walking in the direction of traffic.

6
Another study by Abdel-Aty et al. (2007) focused on the safety of school-aged pedestrians in
Orange County, Florida. They used five years of crash data and found that middle and high
school children were more involved in pedestrian crashes, especially on high-speed multi-lane
roadways. Significant predictors of pedestrian crashes included driver's age and gender, alcohol
use, pedestrian's age, number of lanes, median type, and speed limit.
2.1.2 Pedestrian Crash Severity Risk Factors
Studies that focused on investigating risk factors affecting pedestrian crash severity have
included Oh et al. (2005), Tarko and Azam (2011), Sarkar et al. (2011), Mohamed et al. (2013),
Nasar and Troyer (2013), and Khattak (2013). Oh et al. (2005) identified the significant factors
affecting the probability of pedestrian fatalities in Korea using a logistic regression model. They
found that the collision speed was the most significant contributing factor. The increase in
collision speed was associated with an increase in the pedestrian fatality likelihood. Furthermore,
they found that children had a higher probability of fatality in a pedestrian crash.
Tarko and Azam (2011) linked both police and hospital crash injury data to identify significant
injury risk predictors by applying the bi-variate probit model. The authors found that male and
older pedestrians were more exposed to severe injuries compared to other groups. Rural and
high-speed urban roadways were found to be more dangerous for pedestrians, especially while
crossing these roads. The most dangerous identified pedestrian behavior was crossing a road
between intersections (i.e., at midblock locations). In addition, the size and weight of the vehicle
involved in a pedestrian crash were significant predictors of pedestrian injury level.
Sarkar et al. (2011) developed binary logistic regression models to identify pedestrian fatality
risk factors along Bangladesh’s roadways using crash data from 1998 to 2006. The authors found
an increased likelihood of a fatality risk among elderly pedestrians (individuals older than 55
years of age) and young pedestrians (individuals younger than 15 years of age). A higher risk of
fatality was observed for pedestrians who crossed the road compared to those who walked along
the road. Pedestrian crashes with trucks, buses, and tractors had a higher fatality risk compared to
cars. Furthermore, pedestrian crashes occurring during the rainy season had a higher probability
of fatality compared to other seasons, and pedestrian crashes occurring at locations with no
traffic control or stop control had a higher fatality risk than those occurring at locations with
traffic signals.
Mohamed et al. (2013) used two pedestrian injury severity datasets from New York City (2002-
2006) and Montreal, Canada (2003-2006), and applied the ordered probit and multinomial logit
models for analyzing severity of pedestrian crashes. Both models are common approaches for
severity investigation and the main difference is that the ordered probit model accounts for the
ordered nature of injury levels, while the multinomial logit model ignores this ordinal nature.
Several common variables, such as presence of heavy vehicles, absence of lighting, and
prevalence of mixed land use, were found to increase the probability of fatal pedestrian crashes
in both cities.
Nasar and Troyer (2013) hypothesized that pedestrians could experience reduced awareness,
distraction, and unsafe behavior when talking or texting on their mobile phones. Using data from

7
the U.S. Consumer Product Safety Commission on injuries in hospital emergency rooms from
2004 through 2010, they found that mobile-phone related injuries among pedestrians increased
relative to total pedestrian injuries. Moreover, pedestrian injuries related to mobile phone use
were higher for males and for people under 31 years of age. Similarly, Byington and Schwebel
(2013) concluded that pedestrian behavior was considered riskier while simultaneously using
mobile internet and crossing the street than when crossing the street with no distraction.
Using crashes from 2007 to 2010, Khattak (2013) employed an ordered probit modeling scheme
to identify significant factors affecting pedestrian injury severity along national highway-rail
grade crossings. The model showed that more severe injuries were associated with higher train
speeds and the injury severity was higher for female pedestrians compared to male pedestrians.
Pedestrian severities were found to be higher on commercial land use areas compared to
residential areas. Pedestrian severities were also found to be higher in clear weather. In addition,
lower pedestrian severities were found at highway-rail crossings with greater number of crossing
highway lanes and standard flashing light signals.
2.2 Pedestrian Exposure
Because pedestrian exposure data (e.g., pedestrian volumes) are not readily available and is
expensive to collect, researchers often rely on surrogate measures to estimate pedestrian
exposure (Kennedy, 2008), such as population or population density (Chu, 2003), number of
lanes crossed (Keall, 1995), time spent walking (Chu, 2003), number of pedestrian trips
(SafeTrec, 2010), and aggregate distance traveled by all pedestrians in a specific area of interest
(SafeTrec, 2010).
Since different measures of exposure have to be used depending on the purpose of the study, the
Safe Transportation Education and Research Center (SafeTrec, 2010) summarized the issues
related to the most common exposure measures. Tables 2-1 through 2-5 discuss exposure
measures based on number of pedestrians, number of trips, distance traveled, population, and
time spent walking, respectively.
Although there are different types of exposure measures, they have been criticized since they do
not account for the actual amount of walking people do (Qin and Ivan, 2001). To address this
concern, researchers have developed statistical regression models; implemented sketch plan,
network, and micro-simulation models; or applied computer vision techniques to estimate
pedestrian exposure or pedestrian volumes.

8
Table 2-1: Exposure Based on Number of Pedestrians (SafeTrec, 2010)
Appropriate
Uses
Estimating pedestrian volume and risk in a specific location
Assessing changes in pedestrian volume or characteristics due to countermeasure
implementation at that site
How Data Is
Gathered Manual or automated counts of pedestrians
Pros Counts are simpler to collect than other measures such as time or distance walked
Automated methods for counting number of pedestrians are improving
Cons
Does not differentiate pedestrians by walking speed, age, or other factors that may
influence individual risk
Does not account for the amount of time spent walking or the distance walked
Not easily adapted to assess exposure over wide areas (for example, a city)
Common
Measures
Average number of pedestrians per day, sometimes called average annual number of
pedestrians
Number of pedestrians per time period, e.g., hour
Table 2-2: Exposure Based on Number of Trips (SafeTrec, 2010)
Appropriate
Uses
Assessing pedestrian behavior in large areas, such as cities, states, or countries
Examining changes in pedestrian behavior over time
Making comparisons between jurisdictions
Assessing common characteristics of walking trips, such as purpose, route, etc.
How Data Is
Gathered Data is gathered through use of surveys, such as the National Household Travel Survey
Pros
Appropriate for use in large areas
Best metric to assess relationship of walking with trip purpose
Trips can be assessed as a function of person, household and location attributes
Cons
As with most surveys, a large number of respondents are needed to adequately represent the
underlying population
Unlikely to provide information at the level of detail needed to assess risk at specific
locations
Pedestrian trips are often underreported in surveys
Common
Measures
Average number of walking trips made by members of a population per day, week or year
Proportion of walking trips taken for particular purposes, such as commuting or shopping
Table 2-3: Exposure Based on Distance Traveled (SafeTrec, 2010)
Appropriate
Uses
Estimating exposure at the micro or macro level
Estimating whether risk increases in a linear manner with distance traveled
Assessing how crossing distance affects risk
How Data Is
Gathered
For individual level exposure, through surveys such as the National Household Travel
Survey
For aggregate level exposure, measurement of the length of the area of interest, combined
with a manual or automatic count of the number of pedestrians
Pros
Can be used to measure exposure at the micro and macro levels
More detailed than pedestrian volumes or population data
Can be used to compare risk between different travel modes
Common measure of vehicle exposure
Cons
Does not take into account the speed of travel and thus cannot be reliably used to compare
risk between different modes (e.g. walking and driving)
Assumes risk is equal over the distance walked
Must typically assume that each pedestrian walks the same distance in a crossing or along a
sidewalk
Common
Measures
Average miles walked, per person, per day
Total aggregate distance of pedestrian travel across an intersection

9
Table 2-4: Exposure Based on Population (SafeTrec, 2010)
Appropriate
Uses
Used as an alternative to exposure data when cost constraints make collecting exposure data
impractical
Used to compare jurisdictions over time because population data is available for many
geographies and time periods
How Data Is
Gathered
Population data for most cities is available on an annual basis through the American
Community Survey
Pros
Easy and low-cost to obtain; available for most geographies and time periods
Adjusts for differences in the underlying resident population of an area – for example,
sparsely populated suburbs versus densely populated inner-city areas
Provides a crude adjustment for amount of vehicle traffic on the streets, since areas where
more people live also tend to be areas where more people drive
May be the only way to represent exposure if direct measurements cannot be taken
Cons
Does not accurately represent pedestrian exposure
Does not account for the number of people who walk in the area
Does not provide information about amount of time or distance that members of the
population were exposed to traffic
Common
Measures
Number of people in a given area: neighborhood, city, county, state, or country
Number of people in a particular demographic group: by age, sex, race, immigrant status or
socioeconomic status
Table 2-5: Exposure Based on Time Spent Walking (SafeTrec, 2010)
Appropriate
Uses
Estimating total pedestrian time exposure for specific locations
Comparing risks between different modes of travel (e.g. walking vs. riding in a car)
Estimating whether risk increases in a linear manner with walking time
Comparing risk between intersections with different crossing distances and between
individuals with different walking speeds
How Data Is
Gathered
The number of persons passing through an area multiplied by the time traveled
Time spent on walking activities reported on surveys
Pros
Accounts for different walking speeds
Allows for accurate comparison between different modes of travel
Can be used to measure exposure at the micro and macro levels
More detailed than pedestrian volumes or population data
Cons
Time based measures assume risk is equal over the entire distance of a crossing. Only a small
portion of time spent walking on roadways represents real exposure to vehicle traffic. This
portion would include time spent crossing roads, walking on the road surface, or possibly
walking along the roadside where there are no curved sidewalks
Time spent on walking can be overestimated in surveys, because people perceive that they
spend more time walking than they actually do
Walking may also be under-reported in surveys, because people may forget walk trips or may
purposely choosing not to report. Both of these reasons are related to the fact that walking
trips are relatively short. These very short trips may not register in the memory of
respondents or the respondents may think that these short trips are unimportant
Common
Measures
Average time walked, per person, per day or year
Total aggregate travel time of pedestrian travel across an intersection
2.2.1 Statistical Regression Models
A number of studies have applied statistical regression models to model and predict pedestrian
exposure, such as pedestrian volumes. Hess et al. (1999), Qin and Ivan (2001), and McMahon et
al. (2002) agreed that the presence of sidewalks is the most significant factor affecting pedestrian
activities. Apart from statistical models, some studies have made use of probability distribution

10
functions, e.g., Espino et al. (2003). The authors used a Poisson probability distribution function
to determine pedestrian hot spots in Florida. The authors provided a framework for identifying
pedestrian hot spots on the state highway system as part of the Highway Safety Improvement
Program (HSIP). The authors defined the Poisson probability function of a pedestrian crash
frequency for every 1-mile segment as follows:
P(y)=λy
y!e-λ (2-1)
where 𝜆 is the average number of pedestrian crashes per mile and y is the number of pedestrian
crashes.
Hess et al. (1999) estimated the relation between pedestrian volumes and site design elements
such as block size, block length, and presence of sidewalks while controlling for population
density, income, and land use. The study found that pedestrian volumes at urban sites with
smaller blocks and extensive sidewalks were significantly different from the volumes at
suburban sites with larger blocks and limited sidewalk facilities. Furthermore, on average, urban
sites experienced approximately three times more pedestrian volumes compared to suburban
sites. In addition, it was found that block size, length of sidewalk, and routes traveled largely
impacted pedestrians’ willingness to walk. The authors found that population density, income
levels, and land use were not significantly correlated with the observed pedestrian volumes,
which is similar to the findings of Qin and Ivan (2001).
Qin and Ivan (2001) developed linear regression models to predict weekly pedestrian volumes in
rural areas in Connecticut. The authors investigated factors such as population density, presence
of sidewalks, number of pedestrian crossing lanes, area type, traffic control type, and household
income. The linear model took the following functional form:
V = Pα × e(β0+βsXS+βDXD+βAXA+βRXR+ϵ) where,
V = dependent variable or weekly pedestrian volumes,
P = population density in the sidewalk area,
XS = site characteristics (e.g., presence of sidewalk or crosswalk, traffic control type),
XD = demographic characteristics (e.g., median household income),
XA = area type characteristics (e.g., downtown area, residential area),
XR = roadway characteristics (e.g., number of lanes),
α = regression coefficient of population density,
β0 = intercept coefficient,
βS,D,A,R = regression coefficients to be estimated, and
ε = error term.
The authors found that area type, presence of sidewalks, and number of lanes were the only
significant variables in predicting pedestrian exposure. Moreover, McMahon et al. (2002)
investigated the relationship between pedestrian exposure (in terms of crashes involving
pedestrians walking along the roadway) and several demographic and roadway factors. Presence
of sidewalk was among the most significant predictors of crashes involving pedestrians walking

11
along the roadway. Furthermore, the study identified different levels of exposure for pedestrians
walking along the road and pedestrians crossing the road.
A study by Raford and Ragland (2006) developed a space regression model using the
Geographic Information Systems (GIS) tool to estimate pedestrian volumes in urban areas in
Boston, Massachusetts. The explored variables included land use type, walking distance from
each study area to the closest transit station, walking distance from each study area to the closest
rail station, and walking distance from each study area to tourist attractions. It was found that the
model was accurate enough to predict pedestrian volumes after including walking distances to
transit stops and major tourist attractions. The model provided guidance for planners to predict
future pedestrian volumes in the study areas.
2.2.2 Sketch Plan Models
Sketch plan models are often used at a regional level to estimate pedestrian volume. Zupan and
Pushkarev (1971) developed sketch models based on observed counts and commercial land use
space to estimate the sidewalk levels. Schwartz et al. (1999) developed planning guidelines to
estimate pedestrian volume based on key indicators such as square footage of office space,
parking capacity, vehicular traffic movements, and movement levels in similar environments.
Similarly, Raford and Ragland (2006) estimated pedestrian volume by applying the sketch plan
model to large regional urban environments. However, the accuracy of this model is questionable
because of the little data collection needed. Also, the developed sketch model is unable to assign
pedestrian volumes to specific streets or intersections since those types of analyses rely on
detailed data collection that these sketch models lack (Raford and Ragland, 2006).
2.2.3 Network Models
Network-type models have the capability to estimate pedestrian volumes for street segments and
intersections on larger areas such as an entire city or neighborhood. These models work by
assuming the amount of walking trips in a study area and various route choice algorithms to
generate and distribute trips (Senevarante and Morall, 1986). In the City of Toronto, Canada,
Ness et al. (1969) created an origin-destination matrix of traffic zones, and then assigned trip
distributions using a gravity based model. Other approaches such as space syntax to measure
route directness based on a graph “nearness” algorithm was used in combination with pedestrian
counts to obtain calibration factors to convert the relative values into actual hourly pedestrian
volume estimates (Teklenburg et al., 1993; Raford and Ragland, 2006). Using the same
approach, Hillier et al. (1993) and Penn et al. (1998) estimated an R2 value of 0.77 in central
London. According to Raford and Ragland (2006), Europe and the United Kingdom have been
using this approach in large-scale projects and suggest that it offers relatively accurate numbers
and a more economical way of network calibration.
2.2.4 Micro-simulation and Computer Vision Techniques
Another approach for estimating pedestrian exposure is to use micro-simulation tools and
computer vision techniques. However, compared to statistical models, this approach is not
extensively used by researchers. This is mainly due to the micro-simulation approach’s
12
complexity, significant data requirements, and relatively limited geographic coverage area
(Raford and Ragland, 2006). A relevant study that applied micro-simulation to estimate
pedestrian volumes is Helbing et al. (2001). The authors microscopically simulated pedestrian
streams and interpreted pedestrians’ patterns of motion as a self-organizing phenomenon that
arose from nonlinear interactions among pedestrians. The authors further found that pedestrians’
self-organization flow pattern could significantly change the capacity of pedestrian facilities.
Li et al. (2012) investigated the use of computer vision techniques for automated collection of
pedestrian exposure data, e.g., measurement of pedestrian counts, tracking, and walking speeds.
The authors applied an efficient pedestrian tracking algorithm which combined different sources
of information effectively. The applications were demonstrated with a real-world data set from
Vancouver, Canada that included 1,135 pedestrian tracks. Manual counts were performed to
validate the results of the automated data collection. It was found that a 5% average error in
counting was gained, which was acceptable for the scope of the study. Pedestrian gender and age
were found to significantly influence the pedestrian mean walking speed. In addition, there was a
strong agreement between the manual and automated walking speed values.
There have been studies that investigated pedestrian crossing behavior to detect abnormal
behavior, such as the studies by Hu et al. (2012) and Kourtellis et al. (2013). For example, Hu et
al. (2012) used a video tracking method to automatically detect abnormal pedestrian crossing
behavior. Based on object trajectories data extracted by video tracking, pedestrian motion
patterns were observed. The proposed approach was implemented and tested at real-world
crosswalks. The authors deduced two main causes for abnormal pedestrian crossing behavior.
The first cause was that pedestrians mostly ignored regular crossing behavior and wanted to
reach the destination using the shortest way. The second cause was that pedestrians had to cross
the street using an abnormal path to avoid potential crash risks with motor-vehicles. Some
countermeasures were proposed as a result of the investigation, e.g., installing pedestrian
crossing signals.
In another pedestrian behavior study, Kourtellis et al. (2013) developed a risk score to assess
pedestrian crossing behavior at select sites in Hillsborough and Miami-Dade Counties in Florida.
They surveyed pedestrians and bicyclists about their interactions with motorists. The locations
where the surveys were conducted were selected based on site characteristics including
pedestrian features, crash history, and land use. They observed that 12% of sites in Miami-Dade
County and 15% of sites in Hillsborough County exhibited marginally safer behavior. For both
counties, the driver risk score was lower than the pedestrian risk score, which implied that
drivers riskier and more dangerous towards pedestrians. Other results were that 44% of drivers
did not yield to a crossing pedestrian while on a crosswalk. In addition, 58% of bicyclists knew
that they had to ride with traffic; however, 52% were observed riding against traffic.
2.3 Pedestrian Conflict and Behavior Analyses
There have been studies that applied the pedestrian-vehicular conflict analysis as an alternative
to historical crash data analysis. Examples of such studies include Qi and Yuan (2012), Zhang et
al. (2012), Pratt et al. (2013), and Zaki et al. (2013). Qi and Yuan (2012) investigated the impacts
of intersections with permissive left-turn signal control on pedestrian safety using traffic

13
engineers’ survey, field traffic-conflict analysis, and historical crash data analysis. Using eight
study intersections in Texas, it was found that pedestrian volume, opposing through-vehicle
volume, left-turn vehicle volume, and intersection width in the opposing direction were
significant risk factors affecting the safety of pedestrians. In addition, three-legged intersections
were found more dangerous than four-legged intersections under the operation of a permissive
left-turn signal. The authors found high correlation between the data on collected historical
crashes and observed traffic conflicts, which showed that conducting traffic conflict studies
could be an effective approach for safety analysis.
A recent study similar to Qi and Yuan (2012) was conducted by Pratt et al. (2013). The authors
studied conflicts between pedestrians and left-turning vehicles at 20 signalized intersections in
Texas. Conflict frequency models were developed using the nonlinear mixed (NLMIXED)
regression procedure. The models showed that conflict frequency increased with increasing
pedestrian volume and left-turning vehicle volume. On the contrary, conflict frequency
decreased with the provision of a protected left-turn phase. Furthermore, the models showed that
conflict rates were higher for illegal pedestrians than for legal pedestrians.
The use of image processing technique in analyzing pedestrian-vehicular conflicts can be found
in Zhang et al. (2012) and Zaki et al. (2013). For example, using video data, Zhang et al. (2012)
applied the time difference to collision (TDTC) measure to identify and classify pedestrian
behavior. According to the authors, the pedestrian-vehicular TDTC was defined as the time
difference for a pedestrian and a vehicle to travel to the potential conflict point given their speeds
were kept constant. The potential conflict point was defined as the intersection of the predicted
trajectories of pedestrian and vehicle. The results showed that the closer a TDTC was to zero, the
more dangerous a pedestrian-vehicular conflict could be. Moreover, negative TDTC values were
considered more dangerous than positive TDTC values. The authors concluded that the TDTC
parameter was useful in indicating pedestrian-vehicle conflicts, where in approximately 80% of
the cases, pedestrian-vehicular conflicts could be correctly specified.
Similarly, Zaki et al. (2013) investigated pedestrian-vehicular conflicts at a major signalized
intersection in Downtown Vancouver, Canada, using computer vision. The authors extracted
conflict and violation indicators from video sequences in a fully automated way. They applied
the time-to-collision (TTC) conflict indicator as a measure of the severity of the detected
conflicts. They defined TTC as the extrapolated time for the collision to occur. TTC was
continually calculated between conflicting road-users until a final set of values was estimated for
each conflict. The minimum TTC was used to indicate the maximum severity of the conflict. The
authors observed that the majority of conflicts occurred between right-turning or left-turning
vehicles and crossing pedestrians.
2.4 Pedestrian Hot Spot Identification Methods
Identification of pedestrian hot spots is a different challenge compared to identifying vehicle hot
spots. This is mainly because, unlike vehicular volume, pedestrian counts are usually not
available for the calculation of pedestrian exposure. Therefore, the methods used to identify hot
spots for vehicle crashes cannot be directly applied to identify pedestrian hot spots. The existing

14
methods for identifying pedestrian hot spots can be divided into the following three general
categories:
1. density methods,
2. clustering methods, and
3. exposure estimation methods (as discussed in Section 2.2).
2.4.1 Density Methods
The density methods attempt to identify high concentrations of pedestrian crashes. The degree of
concentration is measured based on density, calculated as pedestrian crash frequency per unit
area (e.g., square miles) or unit length (e.g., mile). Two common density methods are the simple
density method and the Kernel Density Estimation (KDE) method.
Simple Density Method
As documented in Pulugurtha et al. (2007), in the simple density method, the entire study region
is first divided into a predetermined number of cells. As shown in Figure 2-1, a circular search
area is drawn around each cell. The individual cell density values are then calculated as the ratio
of total number of crashes that fall within the search area to the extent of the search area. In this
approach, the extent of the search area (i.e., its radius) affects the resulting density map, where
larger radius results in a smoother density surface.
Figure 2-1: Simple Density Method (Pulugurtha et al., 2007)
Kernel Density Estimation Method
The Kernel Density Estimation (KDE) method uses a statistically sophisticated procedure to
estimate crash density (Pulugurtha et al., 2007). Similar to the simple method, the entire study
region is also divided into a predetermined number of cells. However, contrary to the simple
method, a circular search area is drawn around each crash rather than each cell, as shown in
Figure 2-2. A Kernel density function is then applied to each crash to calculate the Kernel values.
Kernel density function is a non-parametric weighting function to estimate random variables’
density function. It is a non-negative real value that satisfies the following two conditions:
∫ K(u)du=1, where u is a random variable∞
-∞.
K(-u)=K(u) for all u values.

15
Figure 2-2: Kernel Density Estimation Method (Pulugurtha et al., 2007)
There are many types of Kernel functions and they include uniform, triangular, bi-weight, tri-
weight, tri-cube, Gaussian, and cosine functions. For example, the functional form of a Gaussian
Kernel function is:
K(u)=1
√2πe
-u2
2
To calculate the Kernel density estimator fh(X), let (X1, X2, …, XN) be an iid (independent and
identically distributed) sample drawn from an unknown density function or distribution, f. The
Kernel density estimator is defined as follows:
fh(X)=1
Nh∑ K (
X-Xi
h)
N
i=1
where K(•) is the Kernel function and h > 0 is the smoothing parameter also known as the
bandwidth or Kernel size.
The most significant parameter in Equation (4) is the bandwidth parameter (h) and several values
of bandwidths have to be tested to reach the best value that leads to a smooth curve. In the KDE
method, the density value is highest at the crash location and diminishes with increasing distance
from the crash, reaching zero at the radial distance from the crash (i.e., at the boundaries of the
circle around each crash). The individual cell densities are then calculated as the sum of the
overlapping Kernel values over the cell. The larger the radius, the flatter the Kernel density
surface. The concentration areas in the crash concentration or crash cluster maps are categorized
into very low, low, medium, high, and very high pedestrian crash risk locations, representing the
five quantiles. The very low risk category represents density values in the first 20th percentile.
Likewise, the very high risk category represents density values in the 80th percentile.
Compared to the simple density method, a smoother density surface (i.e., a well fitted smooth
curve, as shown by the red curve in Figure 2-3) is generally produced by the Kernel density
calculations (Pulugurtha et al., 2007). Therefore, the Kernel method is more appropriate since a
smoother surface can better identify hot spots.

16
Figure 2-3: Kernel Probability Density Curve Smoothing (Zucchini, 2003)
As documented in Truong and Somenahalli (2011), while the KDE method has been successfully
applied to identify pedestrian and vehicle hot spots (e.g., Pulugurtha et al., 2007; Anderson,
2009), it has two main issues. First, concentration or clustering maps could have different search
bandwidths and neighborhood sizes which might lead to inconsistent comparisons of clusters.
This issue could be addressed using a network-type KDE method. Several studies have extended
the KDE method to network spaces that estimate the density over a unit distance instead of a unit
area (e.g., Xie and Yan 2008). However, according to Xie and Yan (2008) and Anderson (2009),
one main limitation of both traditional and network KDE methods is that neither of them can be
tested for statistical significance. The second main issue with the KDE method is that the
exposure measures (e.g., pedestrian volumes) are neglected in the analysis since clusters are
defined using absolute crash counts. This issue could be addressed by using crash frequencies
per unit exposure or crash rates stratified by different injury severity levels, e.g., serious injury,
fatal injury, etc.
Relevant Studies
Two studies that successfully applied the crash density analysis are Pulugurtha et al. (2007) and
Jang et al. (2013). Pulugurtha et al. (2007) used the crash density method using the GIS tool to
study the spatial patterns of pedestrian crashes to identify pedestrian hot spots. The authors
created crash density maps using the simple and KDE methods and prioritized hot spots using
ranking methods, such as crash frequency, crash density, crash rate, as well as a combination of
methods such as the sum-of-the-ranks and the crash score methods. The authors used five years
(1998-2002) of crash data from the Las Vegas metropolitan area. They concluded that the KDE
method is better than the simple method since it results in a smoother density surface. The results
obtained from ranking pedestrian hot spots showed a significant variation in ranking when
individual methods were applied. However, rankings of high pedestrian crash zones were
relatively consistent with little variation when the sum-of-the-ranks method and the crash score
method were used. The authors further recommended a combination of methods while ranking
pedestrian hot spots instead of using individual methods.

17
Jang et al. (2013) identified pedestrian hot spots and the risk factors affecting pedestrian crash
injury severity using six-year crash data (2002-2007) from San Francisco. The authors used the
KDE method in GIS to generate pedestrian crash density maps. It was found that the pedestrian
crash frequency was higher in the vicinity of the central business district, while the pedestrian
crash rate (crash frequency normalized by pedestrian exposure) was higher in the periphery of
the city. It could, therefore, be concluded that disregarding pedestrian exposure could
significantly affect the results.
2.4.2 Clustering Methods
Clustering is classification of data into homogeneous groups or clusters that share similar
characteristics. It has been successfully applied in fields such as data mining, pattern recognition,
image processing, and safety analysis. K-means and latent class (LC) are the two examples of
clustering methods that have been used in safety analysis.
K-Means Clustering Method
K-means clustering is one of the simplest clustering methods and it works in an iterative process.
K-means clusters rely on the distance between the dataset attributes and attempt to maximize the
similarity within each cluster and the dissimilarity between clusters (Mohamed et al., 2013). The
procedure can be explained in the following four main steps:
1. The dataset is partitioned into K clusters and the data points are randomly assigned to the
clusters, so that clusters have roughly the same sample size.
2. The mean or centroid of each cluster is then estimated.
3. For each data point in a cluster, the distance from the data point to the mean point of each
cluster is then calculated. If the data point is closest to its own cluster, leave it where it is,
and if not, move it into the closest cluster.
4. Repeat the previous step until no data point can be moved from one cluster to another. At
this stage, the clusters are said to be stable.
There are four main properties of the K-means clustering method:
1. There are always K clusters.
2. At least one item is assigned to each cluster.
3. The clusters do not overlap.
4. Every member of a cluster is closer to its cluster than to any other cluster.
Note that the K-means algorithm aims at minimizing an objective function or a squared error
function. The objective function f(J) is defined as follows (Likas et al., 2003):
f(J)= ∑ ∑‖xi-cj‖2
n
i=1
K
j=1
where,

18
xi = attribute value of data point i,
n = total number of data points,
cj = centroid or mean value of cluster j, and
K = total number of clusters.
Latent Class Clustering Method
Latent class (LC) clusters are probabilistic and consider that the data come from a mixed model
of several probability distributions. This cluster is similar to fuzzy clustering as it considers
uncertainty in the analysis (Mohamed et al., 2013). According to Vermunt and Magison (2002),
the basic LC cluster functional form is as follows:
𝑓(zi|θ) = ∑ 𝜋𝑘𝑓𝑘(𝐾
𝑘=1zi|θk)
where,
zi = vector of observed variables of the ith crash,
K = total number of clusters,
πk = prior probability of being assigned to cluster k,
θk = vector of parameters of the kth latent class cluster model, and
fk(zi|θ) = probability density function.
The parameter estimation of the LC model is based on maximum likelihood estimation. The best
LC model (or optimum number of clusters) is obtained by trying multiple models and computing
various information criteria such as Bayesian Information Criterion (BIC) and Akaike
Information Criterion (AIC). The optimum number of clusters is the one that minimizes the
scores of these criteria. As indicated in Mohamed et al. (2013), LC is advantageous over the K-
means method since it does not depend on the distance between the elements and there is no
need to normalize the data before processing. Furthermore, according to Depaire et al. (2008)
and Mohamed et al. (2013), variables of different types (e.g., ordinal, nominal, continuous) can
be included in the analysis without special consideration.
Relevant Studies
Several studies have successfully applied clustering analysis, such as Truong and Somenahalli
(2011), Mohamed et al. (2013), and the method adopted by Florida Department of Transportation
(FDOT) District 6. Truong and Somenahalli (2011) proposed severity indices instead of
traditional crash counts in analyzing and ranking pedestrian hot spots and unsafe bus transit
stops. The authors used the ArcGIS software for the spatial and cluster analyses. The authors
used 13 years (1996-2008) of pedestrian crash data from the Adelaide metropolitan area in
Australia and concluded that the approach was reliable in identifying pedestrian hot spots and in
ranking unsafe bus stops. Mohamed et al. (2013) used cluster analysis by applying K-means
clusters and LC clusters. The authors generated cluster maps based on crash characteristics such
as traffic control, lighting conditions, vehicle type, and land use.

19
In the recent study for FDOT District 6 (AECOM, 2013), a combination of clustering and
density methods was applied in a GIS environment to identify pedestrian and bicyclist hot spots.
The procedure consists of the following steps:
1. Aggregate crash data and identify groupings of crashes: Apply an ArcGIS application to
identify groups of crashes based on a predetermined 250-ft search radius. Next, exclude
groups containing fewer than five pedestrian crashes from further investigation.
2. Identify pedestrian crash clusters: Rerun the ArcGIS application using a larger search
radius of 600 feet to identify larger pedestrian crash clusters.
3. Normalize crash frequency for each cluster: Normalize crash counts by segment length
along each roadway segment within a cluster to yield pedestrian crash frequency per
mile.
4. Rank locations: Rank roadway segments based on pedestrian crash frequency normalized
per unit length.
As part of the study, pedestrian crash data for the latest available five-year period for all state
roads within FDOT District 6’s jurisdiction were used. It was observed that for small clusters
(i.e., roadway segments less than 0.2 miles), normalized crash frequencies were inflated, and
these segments were ranked among the highest. Clusters were then categorized into intersections
and corridors using a 500-ft threshold. Segments shorter than the threshold were identified as
intersections, while those longer than the threshold were identified as corridors. Pedestrian crash
frequency was used to rank intersections, and pedestrian crash rate (crashes per mile) was used to
rank corridors. A total of 116 pedestrian crash clusters were first identified, where a majority of
these clusters were at intersections. A list of top 15 intersections and corridors was then
prepared.
2.5 Evaluation of Pedestrian Countermeasures
2.5.1 Examples of Pedestrian Countermeasures
An essential step in the pedestrian safety investigation is to evaluate countermeasures to alleviate
pedestrian crashes and injuries. Two major publications that detail pedestrian countermeasures
are Volume 10 of the National Cooperative Research Program (NCHRP) Report 500 (Zegeer et
al., 2004) and the PEDSAFE Handbook (Harkey and Zegeer, 2004). For example, the PEDSAFE
Handbook discussed several pedestrian countermeasures that should be used in specific locations
to be successfully implemented. It includes the following seven categories of countermeasures:
1. Pedestrian facility design
2. Roadway design
3. Intersection design
4. Traffic calming
5. Traffic management
6. Signals and signs
7. Other measures

20
Pedestrian Facility Design
Pedestrian facilities consist of sidewalks, curb ramps, marked crosswalks, transit stop treatments,
roadway lighting improvements, and street furniture. According to Harkey and Zegeer (2004),
appropriate walking areas “improve pedestrian safety dramatically”. The Florida Department of
Transportation (FDOT, 2000) determined that the crash reduction factor (CRF) for an installation
of a sidewalk or walk way is 75%. Designing “pedestrian lanes” that separate pedestrians from
vehicles provides a safe and efficient way for pedestrians to travel (Zegeer and Seiderman,
2001). Adding buffers to sidewalks give pedestrians a safer and more comfortable space
separating them from vehicles on the road. Curb ramps, as shown in Figure 2-4, give disabled
patrons an easy access to the sidewalk and are mandatory by federal legislation (Americans with
Disabilities Act “ADA”, 1990).
(a) Curb Ramp Design (b) Example of Curb Ramp
Figure 2-4: Curb Ramps (Harkey and Zegeer, 2004)
Marked crosswalks warn drivers that pedestrians might cross the street. These markings help
vehicles yield to pedestrians and provide a safe and designated area for pedestrians to cross.
Studies have shown that a crash modification factor (CMF) of 0.35 can be used for crash
predictions at unsignalized intersection (Haleem and Abdel-Aty, 2012). The Manual on Uniform
Traffic Control Devices (MUTCD) includes a variety of patterns for crosswalk markings. Figure
2-5 shows examples of the different types of crosswalk marking patterns.
Figure 2-5: Crosswalk Marking Types (Harkey and Zegeer, 2004)

21
The study by Richards (1999) found that crosswalk markings at unsignalized intersections were
associated with high pedestrian crash rates. Harkey and Zegeer (2004) stated that motorists could
see the ladder pattern more than the conventional standard type, and should generally be installed
with additional enhancements such as pedestrian signs for better safety performance. Figure 2-6
shows an example of a ladder crosswalk.
Figure 2-6: Crosswalk with Ladder Pattern (Harkey and Zegeer, 2004)
Bus stops, street furniture, and pedestrian walking environment have to be inviting to the
pedestrians. The walking facility has to be safe and provide adequate lighting and amenities so
that pedestrians feel comfortable. Roadway lighting makes the pedestrian path safer by
increasing pedestrian visibility. Illumination of intersections is an important countermeasure
when designing a good pedestrian facility. A CMF of 0.62 can be used for serious and minor
injuries at night (Elvik and Vaa, 2004) when predicting pedestrian crashes. Bahar et al. (2007a)
developed CMFs for lighting improvements for fatal (0.22) and injury (0.58) pedestrian crash
severities.
Roadway Design
Roadway design affects pedestrian safety in multiple ways, e.g., the impact of lane width and
direction of traffic. For example, the time it takes for pedestrians to cross the street depends on
the lane width and number of lanes, and the direction of traffic directly impacts the number of
conflicts between vehicles and pedestrians. Some of the countermeasures related to roadway
design include bicycle lane installation, lane narrowing, reduction in number of lanes,
installation of pedestrian refuge areas such as raised medians, conversion of two-way streets to
one-way streets, and reduction in curb radius.
Bicycle lanes are exclusive lanes for bicyclists that provide separation between vulnerable road
users and motorists and shorten the crossing distance for pedestrians. Using a before-and-after
study, Jensen (2008) found that the installation of bicycle lanes resulted in a CMF of 0.9 for
pedestrian crashes involving right-turning vehicles.

22
Narrowing a roadway can be done by removing travel lanes, narrowing lane widths, adding on-
street parking, or by curb relocation. Narrowing a roadway will provide safer pedestrian
movements by reducing vehicle speeds (VN Engineers, 2012). Distributing the available space to
other components of the roadway such as bicycle lanes, sidewalks, etc., will likely enhance the
safety of all road users. The other countermeasure, lane reduction, should only be used if there is
excess road capacity. Reducing the number of lanes can provide pedestrians a shorter crossing
distance and might help optimize signal timing (ITE, 2010).
Constructing raised medians is another countermeasure that can be implemented to improve
pedestrian safety. Raised medians provide a place of refuge for pedestrians crossing a wide
intersection or a midblock section (ITE, 2010). High speed and high volume roads can benefit
from raised medians with respect to pedestrian safety. Gan et al. (2005) stated that a CMF of
0.31 can be used for raised medians on a major approach for pedestrian crashes.
Although conversions of two-way streets to one-way streets reduce conflicts between the
motorists and pedestrians, this countermeasure is generally expensive and requires large-scale
implementation. It generally reduces speed, but can also increase travel distances for drivers.
Another roadway design countermeasure is reducing the turning radius of the curb, which will
lower the turning speed of the vehicles, reducing pedestrian crashes that involve right-turning
vehicles. A larger curb radius encourages vehicles to turn at a higher speed and also increases the
crossing distance for pedestrians (Harkey and Zegeer, 2004). Figure 2-7 shows an example of a
location with tighter corner radius.
(a) Example of Tight Turning Radii (b) Comparison of Different Radius Curbs
Figure 2-7: Intersection with Tight Turning Radii (Harkey and Zegeer, 2004)
Curb extensions extend the sidewalk out to the parking lane, and help reduce the crossing
distance, improve visibility between motorists and pedestrians, and reduce crossing time. Curb
extensions also reduce vehicle turning speeds (ITE, 2010). Figure 2-8 shows an example of a
curb extension.
Adding on-street parking on urban corridors could improve pedestrian safety since it creates a
buffer between vehicles and pedestrians and narrows the crossing distance (VN Engineers,

23
2012). This countermeasure decreases the pedestrian exposure time and encourages slower
speeds. However, restricting on-street parking near intersections improves intersection sight
distance and could improve overall safety (ITE, 2010). For example, Gan et al. (2005) found a
30% reduction in pedestrian crashes when parking is restricted near intersections.
Figure 2-8: Curb Extension (Harkey and Zegeer, 2004)
Crossing islands are used as pedestrian refuge areas at intersections and at midblock locations.
These give the pedestrians the advantage of crossing only one direction of traffic at a time.
According to the National Highway Traffic Safety Administration (NHTSA, 2012), a crossing
island and a curb extension, if used together, could improve pedestrian safety. Furthermore,
crossing island facilities have proven to show substantial reduction in the percentage of
pedestrian crashes. For example, Zegeer et al. (2005) found that raised medians resulted in
significantly lower pedestrian crash rates on multi-lane roads, compared to other roads with no
raised medians. Figure 2-9 gives an example of a refuge center island.
Figure 2-9: Pedestrian Refuge Island (FHWA, 2013)

24
Intersection Design
Roundabouts often improve both the safety and mobility of pedestrians (Shen et al., 2000).
Roundabouts reduce speed and number of conflict points, eliminate left turns, and improve
traffic flow effectiveness. However, roundabouts have to be carefully designed.
Accommodations for pedestrians using splitter islands for crossing can make a roundabout safer
and more efficient for drivers, pedestrians, and bicyclists. Constructing a roundabout resulted in
a CMF of 0.73 compared to an unsignalized intersection (De Brabander and Vereeck, 2007). In
order to observe a positive pedestrian safety impact, roundabouts should have a low design
speed. Figure 2-10 shows a roundabout constructed as a traffic calming measure and to improve
safety.
Figure 2-10: Roundabout (Harkey and Zegeer, 2004)
Right-turn slip lane design is mostly used on large arterial streets with large volume of right-turn
traffic. This design gives pedestrians an advantage to only have to worry about the right-turning
vehicles first. It reduces conflicts when trying to cross a multi-lane arterial street and shorten the
crossing distance. The right-turn slip also slows down motorists and allows drivers to see
pedestrians clearly (Harkey and Zegeer, 2004). Figure 2-11 shows an example of a right-turn slip
lane.
Figure 2-11: Right-turn Slip Lane (Harkey and Zegeer, 2004)
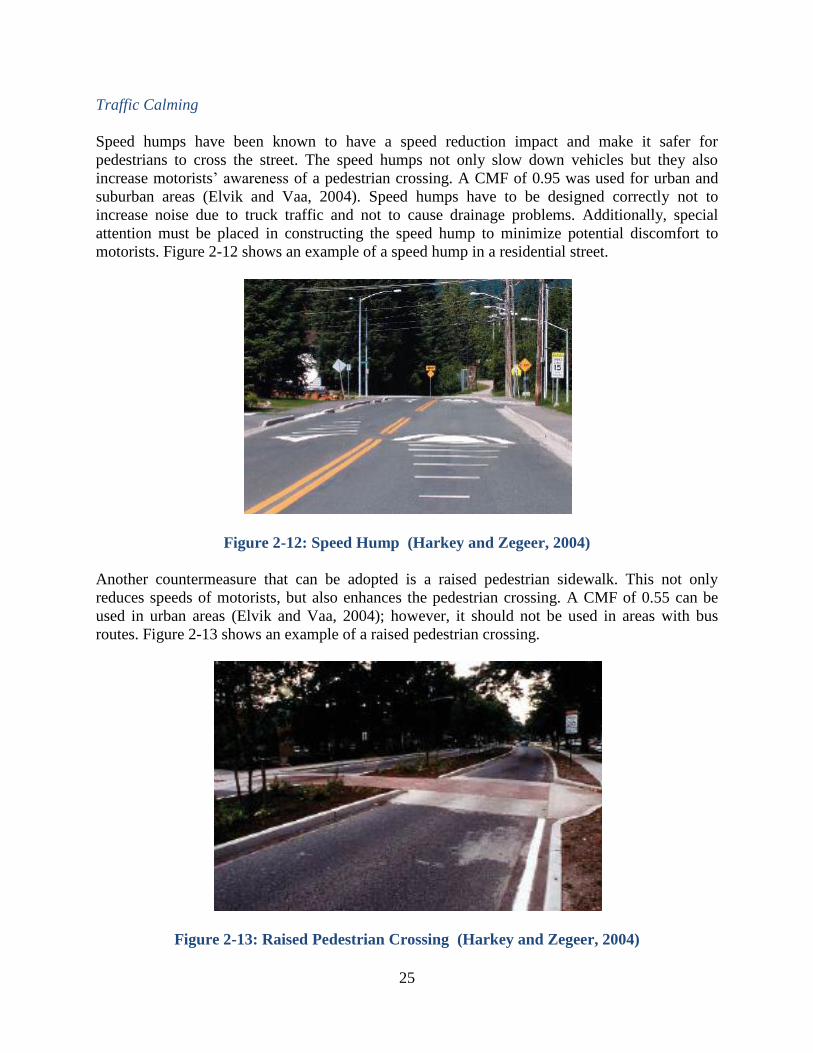
25
Traffic Calming
Speed humps have been known to have a speed reduction impact and make it safer for
pedestrians to cross the street. The speed humps not only slow down vehicles but they also
increase motorists’ awareness of a pedestrian crossing. A CMF of 0.95 was used for urban and
suburban areas (Elvik and Vaa, 2004). Speed humps have to be designed correctly not to
increase noise due to truck traffic and not to cause drainage problems. Additionally, special
attention must be placed in constructing the speed hump to minimize potential discomfort to
motorists. Figure 2-12 shows an example of a speed hump in a residential street.
Figure 2-12: Speed Hump (Harkey and Zegeer, 2004)
Another countermeasure that can be adopted is a raised pedestrian sidewalk. This not only
reduces speeds of motorists, but also enhances the pedestrian crossing. A CMF of 0.55 can be
used in urban areas (Elvik and Vaa, 2004); however, it should not be used in areas with bus
routes. Figure 2-13 shows an example of a raised pedestrian crossing.
Figure 2-13: Raised Pedestrian Crossing (Harkey and Zegeer, 2004)

26
Traffic Management
The PEDSAFE Handbook (Harkey and Zegeer, 2004) states that traffic management should be
assessed from an area-wide perspective. For traffic management to be successful it should be
complemented with traffic calming devices. Figure 2-14 shows an example of a traffic diverter
from the PEDSAFE Handbook.
Figure 2-14: Traffic Diverter (Harkey and Zegeer, 2004)
Signals and Signs
Traffic control devices such as traffic signals and pedestrian signals can be used to improve
pedestrian safety. For example, crosswalk marking and a pedestrian signal together would
substantially enhance pedestrian safety. Using traffic signals to create gaps for pedestrians to
cross at midblock locations on high-speed multi-lane arterials will also increase pedestrian
safety. MUTCD states that pedestrian signals should be installed wherever warranted. Pedestrian
signals are important to provide pedestrians with the necessary clearance time to cross the street
and to provide an indication of when it is safe to cross.
Pedestrian signals eliminate the conflict between vehicles and pedestrians. Although fixed time
signals increase safety, they can decrease the efficiency of the intersection. Traffic signal
enhancements such as automatic pedestrian detectors, large signals, and countdown signals are
being used in some cities in the U.S. to reduce vehicle-pedestrian conflicts. High intensity
Activated crossWalKs (HAWKs) are traffic signals that are used to allow pedestrians to cross
safely (Fitzpatrick and Park, 2010). Fitzpatrick and Park (2010) developed a CMF of 0.31 for
vehicle-pedestrian crashes in urban areas with HAWK signals. Figures 2-15, 2-16, and 2-17
show an example of HAWK, enhanced signal diagram, and countdown signal, respectively.
Reddy et al. (2008) conducted a before-and-after analysis to evaluate the effectiveness of
countdown pedestrian signals by comparing pedestrian behavior before and after the installation
of countdown signals. The pedestrian behavior measures included the percentage of pedestrians
initiating crossing during flashing “Don’t Walk” and steady “Don’t Walk” modes, as well as the
percentage of successful crossings. It was found that the pedestrian countdown signals were
effective in increasing the percentage of successful crossings and decreasing the percentage of
pedestrians who initiated crossing during the flashing “Don’t Walk” mode.

27
Figure 2-15: High Intensity Activated Crosswalk (HAWK) (Harkey and Zegeer, 2004)
Figure 2-16: Enhanced Signal Diagram (Harkey and Zegeer, 2004)
Figure 2-17: Countdown Signal (Harkey and Zegeer, 2004)
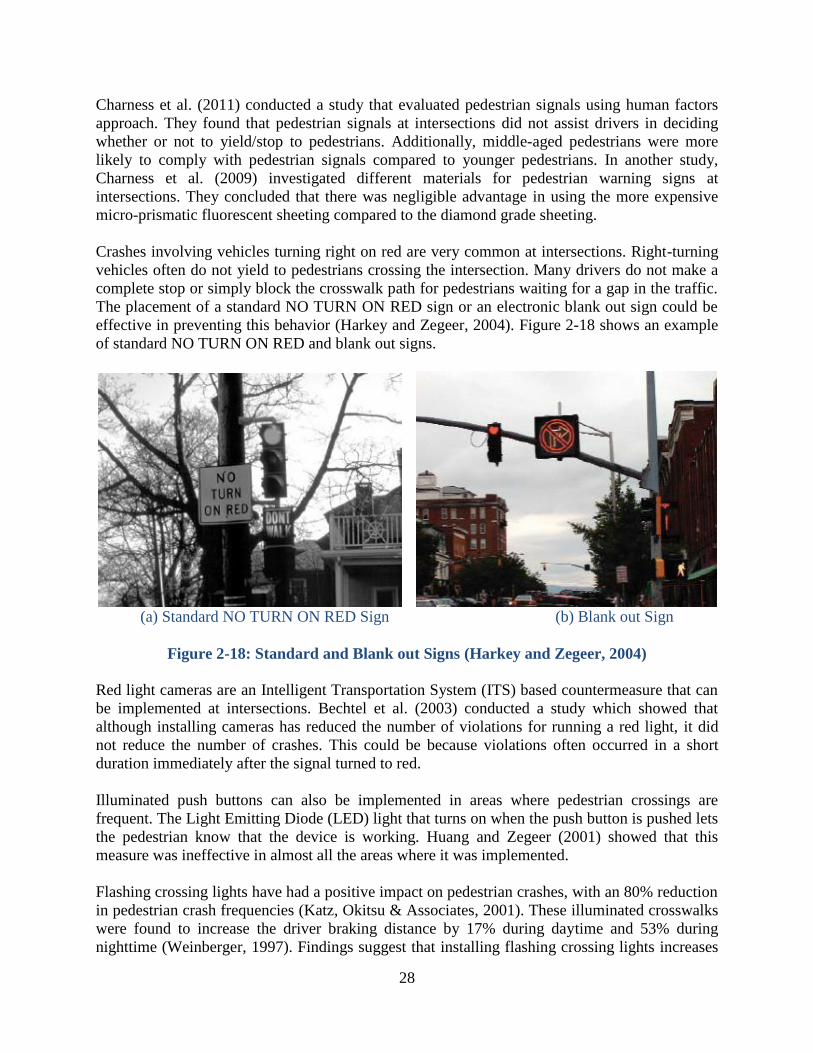
28
Charness et al. (2011) conducted a study that evaluated pedestrian signals using human factors
approach. They found that pedestrian signals at intersections did not assist drivers in deciding
whether or not to yield/stop to pedestrians. Additionally, middle-aged pedestrians were more
likely to comply with pedestrian signals compared to younger pedestrians. In another study,
Charness et al. (2009) investigated different materials for pedestrian warning signs at
intersections. They concluded that there was negligible advantage in using the more expensive
micro-prismatic fluorescent sheeting compared to the diamond grade sheeting.
Crashes involving vehicles turning right on red are very common at intersections. Right-turning
vehicles often do not yield to pedestrians crossing the intersection. Many drivers do not make a
complete stop or simply block the crosswalk path for pedestrians waiting for a gap in the traffic.
The placement of a standard NO TURN ON RED sign or an electronic blank out sign could be
effective in preventing this behavior (Harkey and Zegeer, 2004). Figure 2-18 shows an example
of standard NO TURN ON RED and blank out signs.
(a) Standard NO TURN ON RED Sign (b) Blank out Sign
Figure 2-18: Standard and Blank out Signs (Harkey and Zegeer, 2004)
Red light cameras are an Intelligent Transportation System (ITS) based countermeasure that can
be implemented at intersections. Bechtel et al. (2003) conducted a study which showed that
although installing cameras has reduced the number of violations for running a red light, it did
not reduce the number of crashes. This could be because violations often occurred in a short
duration immediately after the signal turned to red.
Illuminated push buttons can also be implemented in areas where pedestrian crossings are
frequent. The Light Emitting Diode (LED) light that turns on when the push button is pushed lets
the pedestrian know that the device is working. Huang and Zegeer (2001) showed that this
measure was ineffective in almost all the areas where it was implemented.
Flashing crossing lights have had a positive impact on pedestrian crashes, with an 80% reduction
in pedestrian crash frequencies (Katz, Okitsu & Associates, 2001). These illuminated crosswalks
were found to increase the driver braking distance by 17% during daytime and 53% during
nighttime (Weinberger, 1997). Findings suggest that installing flashing crossing lights increases
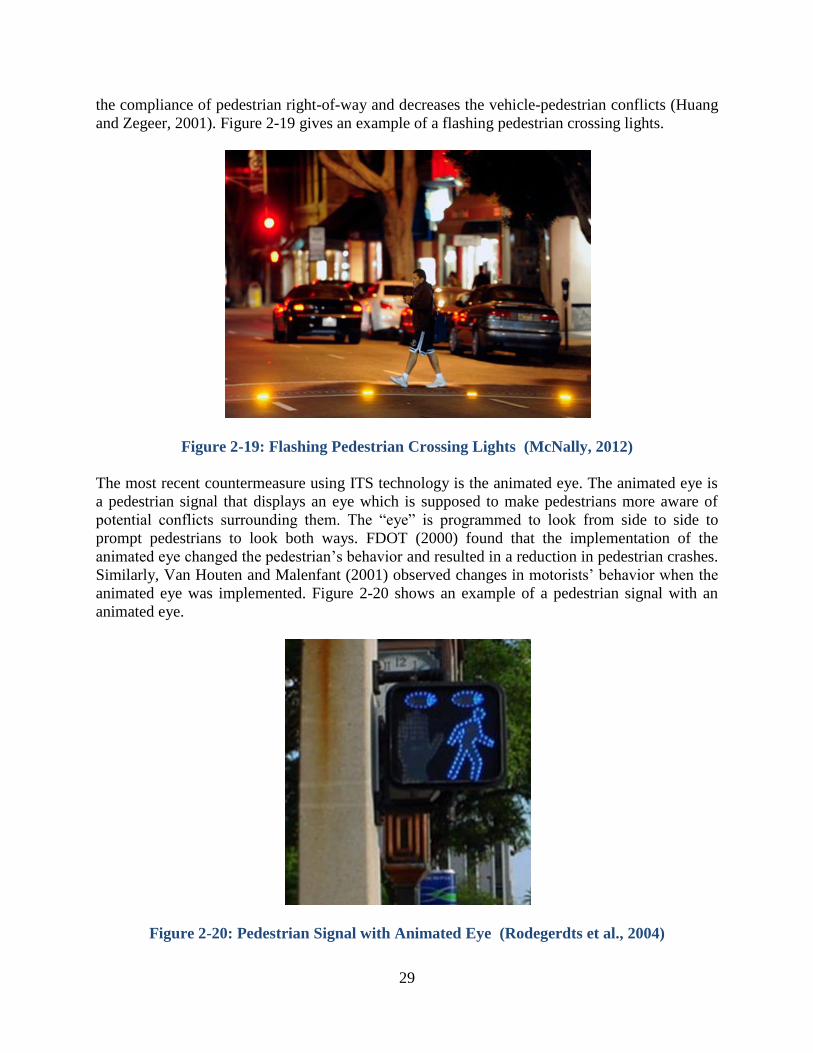
29
the compliance of pedestrian right-of-way and decreases the vehicle-pedestrian conflicts (Huang
and Zegeer, 2001). Figure 2-19 gives an example of a flashing pedestrian crossing lights.
Figure 2-19: Flashing Pedestrian Crossing Lights (McNally, 2012)
The most recent countermeasure using ITS technology is the animated eye. The animated eye is
a pedestrian signal that displays an eye which is supposed to make pedestrians more aware of
potential conflicts surrounding them. The “eye” is programmed to look from side to side to
prompt pedestrians to look both ways. FDOT (2000) found that the implementation of the
animated eye changed the pedestrian’s behavior and resulted in a reduction in pedestrian crashes.
Similarly, Van Houten and Malenfant (2001) observed changes in motorists’ behavior when the
animated eye was implemented. Figure 2-20 shows an example of a pedestrian signal with an
animated eye.
Figure 2-20: Pedestrian Signal with Animated Eye (Rodegerdts et al., 2004)

30
Other Measures
Adding advanced stop lines, as shown in Figure 2-21, help improve pedestrian safety. Pedestrian
visibility will be improved and vehicles will have to stop behind the crosswalk line which will
give pedestrians more room to cross (Harkey and Zegeer, 2004). In summary, Table 2-6 gives
the most common pedestrian countermeasure and their corresponding CMFs.
Figure 2-21: Signalized Intersection with Advanced Stop Lines (Harkey and Zegeer, 2004)
2.5.2 Relevant Studies
Studies that have evaluated pedestrian countermeasures include Cafiso et al. (2011), Vasudevan
et al. (2011), Pulugurtha et al. (2012), Chen et al. (2012), Pratt et al. (2012), and Deng et al.
(2013). Cafiso et al. (2011) evaluated the safety performance of traffic calming devices such as
speed humps that were installed instead of zebra crosswalks in Valencia, Spain. They used the
traffic conflict technique as a surrogate safety measure and proposed a pedestrian risk index
(PRI), which linked the probabilities of pedestrian crash and pedestrian severity in a single
measure. The PRI could reveal a significant improvement in pedestrian safety and was effective
in highlighting enhancements in drivers’ behavior due to installation of speed humps as an
alternative to zebra crosswalks.
Vasudevan et al. (2011) conducted a pilot study to evaluate the effectiveness of pedestrian call
buttons, pedestrian countdown signals with animated eyes, and pedestrian activated flashing
yellow signals. The treatments were deployed in the Las Vegas metropolitan area in Nevada and
were installed at three sites, two intersections and one midblock location. The evaluations were
based on field observations of pedestrian and driver behavior before and after the installation of
these countermeasures. Several measures of countermeasure effectiveness were used, such as
number of pedestrians trapped in the roadway, number of cycles in which call button was
pushed, frequency of signal violation, number of pedestrians who looked for vehicles before
crossing, number of pedestrians who began to crossing during the WALK phase, number of
drivers yielding to pedestrians, and number of drivers making RTOR who came to complete
stop. In general, the authors observed that the pedestrian crash countermeasures were successful

31
in enhancing safety and there were safety enhancements in pedestrians’ behavior. However, the
three countermeasures did not affect drivers’ yielding behavior.
Table 2-6: Common Pedestrian Countermeasures and Corresponding CMFs
Category Countermeasure Crash
Type
Crash
Severity CMF Source
Intersection
Design
Convert unsignalized intersection to
roundabout Ped Fatal/Injury 0.73
De Brabander and Vereeck
(2009)
Convert intersection to roundabout Ped All 0.11 Schoon and Van Minnen
(1994)
Roadway
Design
Install pedestrian overpass Ped Fatal/Injury 0.10 Gan et al. (2005)
Install raised median Ped All 0.75 Gan et al. (2005)
Install raised median (marked
crosswalk) Ped All 0.54 Zegeer and Seiderman (2001)
Install raised median (unmarked
crosswalk) Ped All 0.61 Elvik and Vaa (2004)
Install refuge island Ped All 0.44 ITE (2004)
Bicycle lanes (veh w/ped from right) Ped All 0.90 Jensen (2008)
Bicycle lanes (veh w/ped from left) Ped All 1.05 Jensen (2008)
Signs and
Signals
Permit right-turn on red (New York) Ped All 1.43 Bahar et al. (2007b)
Permit right-turn on red (New
Orleans) Ped All 1.81 Bahar et al. (2007b)
Permit right-turn on red (Ohio) Ped All 1.57 Bahar et al. (2007b)
Permit right-turn on red (Wisconsin) Ped All 2.08 Bahar et al. (2007b)
Prohibit left turn Ped All 0.90 Gan et al. (2005)
Install pedestrian signals Ped All 0.47 Gan et al. (2005)
Modify signal phasing Ped All 0.95 ITE (2004)
Install pedestrian countdown signal
heads Ped Fatal/Injury 0.75 Markowitz et al. (2006)
Add exclusive pedestrian phasing Ped All 0.66 ITE (2004)
Install HAWK Ped All 0.31 Fitzpatrick and Park (2010)
Restrict parking near intersection Ped All 0.70 Gan et al. (2005)
Traffic
Calming
Install speed humps Ped All 0.95 Elvik and Vaa (2004)
Install raised pedestrian crossing Ped All 0.92 Elvik and Vaa (2004)
Install raised intersection Ped All 1.05 Elvik and Vaa (2004)
Pedestrian
Facility
Design
Install sidewalks and walkways Ped All 0.25 Gan et al. (2005)
Install marked crosswalks (minor
intersection) Ped All 0.35 Haleem and Abdel-Aty (2012)
Improve lighting at intersection Ped Fatal 0.22 Elvik and Vaa (2004)
Improve lighting at intersection Ped Injury 0.58 Elvik and Vaa (2004)
On the same metropolitan area in Las Vegas, Nevada, Pulugurtha et al. (2012) evaluated the
safety effectiveness of pedestrian infrastructure countermeasures, such as high-visibility
crosswalks and pedestrian refuge areas. The authors used field observations of pedestrian and
driver behavior before and after the installation of the countermeasures to evaluate the
countermeasures. A total of eight sites were evaluated and measures of effectiveness similar to
Vasudevan et al. (2011) were used. High-visibility crosswalk was found to improve behavior of
both pedestrians and motorists, and was considered one of the most economical treatments. In
addition, pedestrian refuge islands showed significant safety improvements in the yielding
behavior of both pedestrians and drivers.

32
Similar to Pulugurtha et al. (2012), Chen et al. (2012) evaluated the safety effectiveness of high-
visibility crosswalks in New York City. They further evaluated other pedestrian
countermeasures, such as the change in split phase timing and total cycle length increase. They
adopted a two-stage design that first identified a comparison group corresponding to each
treatment group, then estimated an NB model with the generalized estimating equation (GEE)
method to control for confounding factors and within-subject correlation. They found that the
change in split phase timing was more effective in reducing pedestrian crashes than the high
visibility crosswalks. Furthermore, increasing total cycle length was considered effective near
senior centers, where there was a higher percentage of elderly pedestrians.
Pratt et al. (2012) evaluated the safety effectiveness of four pedestrian treatments at six
signalized intersection approaches in Texas. These treatments were adding a leading protected
left-turn phase, implementing split phasing, implementing pedestrian recalls, and increasing the
WALK interval duration. They collected video recordings of about 4,300 pedestrians crossing
the path of a left-turning vehicle, of which 100 conflicts between pedestrians and left-turning
vehicles were observed during the 24 hours of recording. A before-and-after comparison of
observed conflict revealed that there was an overall reduction in conflicts; however, the safety
benefit of increasing the WALK interval duration was questionable. Therefore, the authors
recommended this treatment to be installed at sites with high pedestrian volumes.
Using traffic microscopic simulation, Deng et al. (2013) evaluated the safety and mobility of four
pedestrian treatments at midblock crossings, pedestrian actuated (PA), pedestrian light controlled
(PELICAN), HAWK, and pedestrian user-friendly intelligent (PUFFIN). The authors used the
VISSIM (Verkehr In Städten - SIMulationsmodell) and SSAM (Surrogate Safety Assessment
Model) simulation packages and found that pedestrian signal violations during the clearance
interval reduced pedestrian delay, but on the other hand resulted in a rapid increase in pedestrian-
vehicle conflicts, especially for the HAWK-type crosswalk. In addition, they found that PA led
to high delay of both pedestrians and vehicles, but less conflicts. PELICAN was found beneficial
for vehicular traffic by reducing vehicle delay; however, unbeneficial for pedestrian traffic since
pedestrian delay was always high. HAWK and PUFFIN were found better than PA and
PELICAN for balancing both safety and mobility for all road users. HAWK had an acceptable
safety performance at “low” pedestrian volumes, but more conflicts were observed when
pedestrian volumes turned to “middle” and “high”. Furthermore, PUFFIN had a better safety
performance than HAWK when pedestrian volumes were classified as “middle” and “high”.
FDOT has been involved in multiple research projects sponsored by the Federal Highway
Administration (FHWA) that investigated the safety of pedestrian countermeasures. Examples
are the studies by FHWA (2002 and 2008). The FHWA (2002) study recommended conducting
surveys of pedestrians before introducing pedestrian countermeasures. As part of the study, many
ITS countermeasures were proposed, such as pedestrian signals, no right-turn on red signs, and
LED transponders for blind pedestrians. The FHWA (2008) study evaluated several
countermeasures, e.g., pedestrian push buttons, midblock traffic signals, elimination of
permissive left turns at signalized intersections, and reduction of minimum green time at
midblock crosswalks controlled by traffic signals. It was found that inexpensive pedestrian safety
engineering measures could produce a significant reduction in crashes if accompanied by public
education and enforcement programs that focus on pedestrian safety.
33
Hagen (2005) conducted a study to identify pertinent information on ITS applications related to
pedestrian safety. It was found that the use of countdown displays and in-pavement lighting were
very well received by the public. Compared to the flashing hands, the countdown displays were
found to be easier for pedestrians to understand. In-pavement lighting was found to reduce
vehicular speeds in the crossing area, making it much safer for the pedestrian crossing the
roadway.
2.6 Pedestrian Safety Programs
An important approach to improve pedestrian safety is involving citizens themselves in the
safety management process. As such, many communities have sponsored programs to enhance
pedestrian safety. For example, FHWA sponsored two programs: “How to Develop a Pedestrian
Safety Action Plan” (Zegeer et al., 2009) and “Pedestrian Safety Strategic Plan:
Recommendations for Research and Product Development” (Zegeer et al., 2010). Zegeer et al.
(2010) set a 15-year strategic pedestrian plan by developing dissemination activities and
innovation strategies. Examples of the dissemination activities were event marketing, in-person
and web-based training, and software development, whereas some of the recommended
innovative strategies included convening interactive webinars and developing a video-share
website. Other programs include the Community Pedestrian Safety Engagement Workshops in
California (Babka et al., 2011), the evaluation of a comprehensive pedestrian safety program in
the City of Detroit (Savolainen et al., 2011), and the identified barriers in pedestrian safety
programs in large central cities (Shin et al., 2011). Turner (2000) evaluated the yielding behavior
of motorists to pedestrians in crosswalks in Tampa, Florida. It was concluded that 60% of
motorists at signalized intersections have successfully yielded to pedestrians in crosswalks. On
the other hand, only 3% of motorists at unsignalized intersections yielded to pedestrians.
Zegeer et al. (2009) outlined a roadmap for developing a pedestrian safety action plan. The
following seven steps were identified for a successful safety action plan:
1. Define objectives: A clear objective should be identified at the beginning of
the plan, such as specific types of pedestrian crashes to be
reduced (e.g., walk-to-school) and the target percent of
reduction (e.g., 20% severe injury reduction).
2. Identify high crash locations: A list of areas with high concentrations of pedestrian
crashes has to be identified, e.g., at signalized
intersections, unsignalized intersections, and midblocks.
3. Select countermeasures: After identifying the list of high-crash locations in the
second step, more investigation of these locations is
required to identify high frequencies of pedestrian crashes.
This would help devise the appropriate countermeasures.
Examples are designing refuge islands for high pedestrian
midblock crashes and adding “NO TURN ON RED” sign
at signalized intersections with high pedestrian crashes
involving right-turning vehicles.

34
4. Prioritize countermeasures: After selecting a list of countermeasures, the list has to be
prioritized based on a pre-specified benefit-to-cost (B/C)
ratio or a net present value (NPV). For example, if a B/C
ratio of 2 is desired, then only the countermeasures with
an estimated B/C ratio ≥ 2 will be included.
5. Implement strategy: This is a crucial step of the safety action plan involving all
the stakeholders. Stakeholders could include citizens,
public agencies, law enforcement agencies, and the private
sector. In this step, stakeholders will be informed about
the intended countermeasures to be implemented and will
be educated on how to improve pedestrian safety. The
education could be via focus groups or workshops.
6. Reinforce commitment: In this step, awards for innovative ideas or projects that
provide safer pedestrian conditions could be provided.
Furthermore, the Department of Transportation could
collaborate with the Department of Health on conducting
education programs such as focus group studies.
7. Evaluate results: The final step is to evaluate the plan through before-and-
after safety studies or public surveys. A final conclusion
on whether or not the anticipated safety benefit was
achieved should be determined.
Babka et al. (2011) discussed the strategies used to engage residents and local professionals in
the Community Pedestrian Safety Engagement Workshops in California. These workshops were
designed to engage and educate residents to ensure they have the knowledge they needed to
improve pedestrian safety in their neighborhood. Several case studies were highlighted that
focused on a variety of engagement techniques, such as outreach and working with groups,
working with youth volunteers, Video Voice, and peer learning and sharing. The workshops
resulted in enhancing the residents’ understanding about potential directions to improve
pedestrian safety in communities in California.
Savolainen et al. (2011) documented a series of activities performed in the City of Detroit,
Michigan, that aimed at improving pedestrian safety following Detroit’s designation as a
Pedestrian Safety Focus City by FHWA in 2004. The activities included creation of a Pedestrian
Safety Action Team, development of a Pedestrian Safety Action Plan, and implementation of a
series of education, enforcement, and engineering countermeasures. The interventions included
development of new pavement marking guidelines for pedestrian crosswalks, phased installation
of countdown pedestrian signals, implementation of a pedestrian training curriculum for children
in grades K-8, and implementation of enforcement programs. The interventions resulted in
reducing pedestrian crashes and injuries in Detroit. In addition, the target crashes specific to each
countermeasure were reduced.
35
Shin et al. (2011) highlighted institutional settings, interagency collaboration, high risk
population groups, and institutional barriers in 13 large central cities in the U.S. (Chicago,
Illinois; Columbus, Ohio; Denver, Colorado; Indianapolis, Indiana; Los Angeles, California;
Milwaukee, Wisconsin; New York City, New York; Philadelphia, Pennsylvania; Phoenix,
Arizona; San Francisco, California; San Jose, California; Seattle, Washington; and Washington,
District of Columbia). Large cities were defined as cities with over a population of 500,000. To
achieve the study objectives, planning officials from the 13 cities were interviewed. The authors
found several barriers that needed to be addressed to improve pedestrian safety. These barriers
included competing priorities among agencies, lack of resources, and data gaps. The study
concluded that pedestrian countermeasures alone might not be sufficient for enhancing
pedestrian safety. The authors also found that participation and formalized policy integration
among multiple parties were required to create an effective pedestrian safety strategy.
2.7 Summary
This chapter reviewed studies on pedestrian safety, including risk factors affecting frequency and
severity of pedestrian crashes, pedestrian exposure measures, pedestrian-vehicle conflict analysis
techniques, pedestrian hot spot identification methods, pedestrian crash countermeasures and
their evaluation, and pedestrian safety programs. The review of literature has shown that there
has been abundant effort in analyzing pedestrian crashes and identifying pedestrian risk factors.
Several studies have concluded that higher pedestrian crashes were observed in commercial
areas, in dense road networks, and among uneducated populations. On the other hand, residential
areas were associated with relatively fewer pedestrian crashes.
The majority of studies that identified significant predictors of pedestrian injury severity have
observed an increased likelihood of a fatality risk among elderly pedestrians (individuals older
than 55 years of age) and young pedestrians (individuals younger than 15 years of age). A higher
risk of fatality was also observed for pedestrians who crossed the road compared to those who
walked along the road. Furthermore, pedestrian crashes involving trucks, buses, and tractor
trailers had a higher fatality risk compared to cars.
Existing methods for identifying pedestrian hot spots are broadly classified into three categories:
density, clustering, and exposure estimation. In the density method, simple and Kernel methods
are the two commonly used crash density calculation methods. A circular search area is used to
calculate density in each of the two methods and the variation in the search radius could lead to
inconsistent pedestrian high crash clusters. However, among these two methods, the Kernel
method is regarded as a better approach since it generates a well fitted smooth curve. The second
method relies on the clustering technique and it has been successfully applied in safety analysis
to identify groups of crashes. Clusters are defined using a predetermined search radius, e.g., 250
ft or 500 ft, and crashes are excluded if they are fewer than the minimum threshold. The most
common types of clustering techniques are the K-means and latent class methods.
The third method of hot spot identification is exposure estimation. This includes statistical
regression models, sketch plan and network models, micro-simulation models, and computer
vision techniques. These models have been used by researchers to estimate pedestrian exposure,
e.g., pedestrian volumes, due to the difficulty and high cost associated with collecting pedestrian

36
volumes, especially in urban areas. Common measures of pedestrian exposure are population
density, number of pedestrians, number of lanes crossed, time spent walking, number and
frequency of walk trips, etc. Several regression models have used population density and time
spent walking as surrogate measures to estimate pedestrian exposure. However, these measures
are flawed because they ignore the amount of walking people do. The other models to estimate
pedestrian volumes, such as micro-simulation and computer vision techniques, are not
extensively used as regression models. Specifically, the micro-simulation approach is relatively
complex and requires extensive data; thus, not preferred.
There have been studies that applied the pedestrian-vehicular conflict analysis as an alternative
to historical crash data analysis due to the rarity of observed crashes. These studies were found to
be successful in observing pedestrian-vehicle conflicts, e.g., conflicts that occurred between
right-turning or left-turning vehicles and crossing pedestrians. These studies could also
successfully identify the safety performance of the locations of interest.
Several pedestrian countermeasures have been proposed in the literature to improve pedestrian
safety. These include but are not limited to, converting intersections to roundabouts, installing
raised medians and refuge islands, adding on-street parking, installing pedestrian signals,
modifying signal phasing, installing pedestrian countdown signals, improving lighting at
intersections, and illuminating crosswalks. The majority of these countermeasures were found to
have been effective in reducing pedestrian crashes and fatalities.
In addition to pedestrian crash investigations, some studies and communities have proposed
pedestrian safety action plans that involved citizens and stakeholders in the safety management
process to enhance pedestrian safety through education and enforcement programs. The two
programs sponsored by FHWA, “How to Develop a Pedestrian Safety Action Plan” and
“Pedestrian Safety Strategic Plan: Recommendations for Research and Product Development”
are two good examples of these programs. During the evaluation phase of these programs, a
reduction in pedestrian crashes and injuries were observed as a result of the proposed safety plan.

37
CHAPTER 3
DATA PREPARATION
This chapter describes the data collection and preparation efforts undertaken to analyze
pedestrian crashes that occurred on state roads in Florida. It discusses the police reports’ review
process used to identify underlying pedestrian crash patterns and crash causes. It also describes
an effort undertaken to collect data on the presence and type of pedestrian facilities, including
crosswalks and pedestrian signals, at signalized intersections.
3.1 Pedestrian Crash Data
Three years of crash data from 2008-2010 was used to identify pedestrian crashes on state roads.
In total, 7,630 crashes were identified from the Crash Analysis Reporting (CAR) system as
vehicle-pedestrian crashes. Police reports of these 7,630 crashes were downloaded from the
FDOT Hummingbird System and were reviewed in detail to collect information that is not
typically available in the crash summary records. As such, for each vehicle-pedestrian crash, the
following information was collected:
Birth year of the pedestrian.
Injury severity of the pedestrian.
Fatal injury
Incapacitating injury
Non-incapacitating injury
Possible injury
None
Who was at fault?
Pedestrian
Driver
Both
Not sure
Where did the crash happen?
Signalized location
Non-signalized location
Not sure
Are there any types of pedestrian signals in the vicinity?
Yes, which type? __________________________
No
Not sure
Is there a raised median/a pedestrian refuge area in the vicinity?
Yes
No

38
Not sure
Is there a crosswalk in the vicinity?
Yes
If yes, what type of crosswalk?
o Solid
o Standard
o Continental
o Dashed
o Zebra
o Ladder
o Other
No
Not sure
If a crosswalk is present, is the pedestrian walking in the designated area?
Yes
No
Not sure
Is the pedestrian crossing the street or walking along the roadway when hit?
Crossing the street
Walking along the roadway
Not sure
All the above information was collected by reviewing descriptions and illustrative sketches in the
police reports and the aerial images of crash location. Particularly, the at-fault road user was
identified from the descriptions. For example, Figure 3-1 gives the description of a pedestrian
crash (crash ID: 105745350) where the driver was cited for careless driving, and therefore, was
considered to be at fault.
Figure 3-1: Description in Police Report (Crash ID: 105745350)

39
As another example, in Crash ID: 90438654, the pedestrian was found to be at fault as the
pedestrian stepped into the middle of the road in front of traffic. Figure 3-2 gives the description
of this crash.
Figure 3-2: Description in Police Report (Crash ID: 90438654)
An existing in-house web-based tool was adapted for this study to facilitate the process of
reviewing the police reports. The tool has the capability to display the police report of each crash
and the aerial photo of the crash location, as shown in Figure 3-3. The tool helps to quickly
navigate from one police report to the next by either clicking the “Next” and “Previous” buttons,
or by typing the crash number in the Search box. The tool also has the capability to query crashes
based on roadway ID and mileposts.

40
Figure 3-3: A Web-based Tool Customized to Review Police Reports

41
3.2 Intersection Data
Information on the presence and type of crosswalks at signalized intersections is currently
unavailable. Therefore, a major effort of this study was to manually collect this information.
First, Signalized Intersections GIS layer was used to identify all signalized intersections in the
state of Florida. Since crash data are available only for crashes that occurred on state roads, only
the locations where two or more state roads intersect were included in the analysis. The
Signalized Intersections layer and the State Roads layer were overlaid in ArcGIS 10.0 to identify
locations where state roads intersecting state roads. A total of 8,374 signalized intersections were
identified using this approach. An in-house web-based data collection tool, Visual Roadway
Inventory Collection System (VRICS), was customized to collect data at these 8,374 signalized
intersections. The VRICS application is a web-based system developed to facilitate the process
of collecting roadway data using Google Street View. Figure 3-4 shows a screen capture of the
main interface of the system. The system reads a linear-referenced roadway
segment/intersection, converts its coordinates to the Google Maps projection, and then displays
the location using Google Street View.
Figure 3-4: A Web-based VRICS Tool Customized to Collect Intersection Data
For each signalized intersection, the following data were collected:
total number of legs,
number of legs with pedestrian signals,
number of legs with pedestrian refuge areas (i.e., raised medians),

42
number of legs with each of the following types of crosswalks:
Solid
Standard
Continental
Ladder
Zebra
Dashed
Other
None
3.3 Summary
This chapter described the data collection and preparation efforts undertaken to analyze
pedestrian crashes that occurred on state roads in Florida. Police reports of a total of 7,630
pedestrian crashes that occurred during 2008-2010 were reviewed to identify pedestrian crash
patterns and contributing causes. Information on the presence and type of pedestrian facilities,
including crosswalks and pedestrian signals, at 8,374 signalized intersections on state roads was
collected.

43
CHAPTER 4
STATEWIDE CRASH PATTERNS AND CAUSES
This chapter focuses on identifying the overall statewide pedestrian crash patterns. In this
chapter, general trends in crash data and roadway characteristics data based on 6,434 pedestrian
crashes that occurred on state roads are identified. It also discusses the pedestrian high crash
corridors identified using Kernel Density function in ArcGIS 10.0. General trends by crash
characteristics are identified based on:
crash severity,
population,
number of walk trips,
lighting condition, and
at-fault road user.
Likewise, general trends by roadway characteristics are identified based on:
functional classification,
area type,
speed limit,
crash location, and
crosswalk type.
4.1 Crash Characteristics
4.1.1 Crash Severity
Table 4-1 gives annual pedestrian crash frequency by crash severity for years 2008-2010.
Overall, 10.3% of all pedestrian crashes resulted in fatalities and 81.5% of total pedestrian
crashes resulted in an injury to the pedestrians. As expected, only a very small percentage of
crashes (4.3%) resulted in no injury to the pedestrians. The crash severity of 248 pedestrian
crashes (3.9%) was unknown as a discrepancy exists between the coded crash severity in the
CAR system and that in the actual police report, or when the code is missing. There was 5.6%
reduction in total crashes from 2008 to 2009, but the total crashes between 2009 and 2010 were
essentially the same.
Table 4-1: Annual Pedestrian Crash Statistics by Severity
Crash Severity 2008 2009 2010 Total
Fatal 231 (10.4%) 236 (11.2%) 196 (9.3%) 663 (10.3%)
Injury 1822 (81.7%) 1699 (80.8%) 1723 (82.0%) 5244 (81.5%)
No Injury 91 (4.1%) 85 (4.0%) 103 (4.9%) 279 (4.3%)
Unknown Severity 85 (3.8%) 83 (3.9%) 80 (3.8%) 248 (3.9%)
Total 2,229 (100.0%) 2,103 (100.0%) 2,102 (100.0%) 6,434 (100.0%)

44
4.1.2 Population and Number of Walk Trips
Since pedestrian exposure data (e.g., pedestrian volumes) are not readily available and is
expensive to collect, researchers often rely on surrogate measures to estimate pedestrian
exposure, such as population or population density (Chu, 2003), number of lanes crossed (Keall,
1995), time spent walking (Chu, 2003), number of pedestrian trips (SafeTrec, 2010), and
aggregate distance traveled by all pedestrians in a specific area of interest (SafeTrec, 2010).
In this study, pedestrian crashes in each age group were normalized by population (i.e., crashes
per million) and number of walk trips (i.e., crashes per million walk trips). The 2009 travel
survey data extracted from the National Household Travel Survey (NHTS) database were used to
estimate population and number of walk trips by age group (FHWA, 2009).
Table 4-2 gives the summary statistics of pedestrian crashes by age group, population, and crash
severity. Among the different age groups, young people between 16 and 25 years of age
experienced 183 crashes per year per million. Pedestrians in the age group 46-55 years
experienced the highest fatal crash rate of 22 fatal crashes per year per million. The results from
this table have to be interpreted with caution because the statistics are based on the population
and it might not reflect the actual pedestrian exposure. For example, older population (i.e., over
65 years of age) experienced fewer crashes per million than the total pedestrian crash frequency
per million for all the age groups combined.
Table 4-2: Statistics by Age, Population, and Crash Severity
Age Group
(years)
Fatal
Crashes
(2008-
2010)
Injury
Crashes
(2008-
2010)
Total
Crashes
(2008-
2010)1
Population
(in Millions)
Crashes per
Year per
Million
Population
Fatal Crashes
per Year per
Million
Population
0-5 4 32 42 0.22 63.7 6.0
6-15 10 356 397 2.26 58.7 1.3
16-25 62 1,045 1,195 2.18 183.0 9.7
26-35 88 688 848 1.89 149.7 15.7
36-45 103 775 957 2.94 108.3 11.7
46-55 167 1,013 1,256 2.53 165.7 22.0
56-65 97 646 804 2.22 120.7 14.7
66-75 60 316 403 1.60 83.7 12.3
>75 42 237 303 1.35 74.7 10.3
Unknown 30 136 229 -- -- --
Total 663 5,244 6,434 17.19 124.7 13.0 1 Total crashes include crashes with no injury and unknown injury.
Table 4-3 gives the summary statistics of pedestrian crashes by age group, number of walk trips,
and crash severity. Again, among the different age groups, young people between 16 and 25
years of age experienced 0.79 crashes per year per million walk trips. In terms of fatal crashes,
pedestrians in the age group 46-55 years experienced the highest fatal crash rate of 0.082 fatal
crashes per year per million walk trips.

45
Table 4-3: Statistics by Age, Number of Walk Trips, and Crash Severity
Age
Group
(years)
Fatal
Crashes
(2008-
2010)
Injury
Crashes
(2008-
2010)
Total
Crashes
(2008-
2010)1
Total Walk
Trips in a Year
(in Millions)
Crashes per
year per
Million Walk
Trips
Fatal Crashes
per year per
Million Walk
Trips
0-5 4 32 42 48 0.29 0.028
6-15 10 356 397 574 0.23 0.006
16-25 62 1,045 1,195 505 0.79 0.041
26-35 88 688 848 448 0.63 0.065
36-45 103 775 957 710 0.45 0.048
46-55 167 1,013 1,256 676 0.62 0.082
56-65 97 646 804 513 0.52 0.063
66-75 60 316 403 345 0.39 0.058
>75 42 237 303 225 0.45 0.062
Unknown 30 136 229 -- -- --
Total 663 5,244 6,434 4,043 0.53 0.055 1 Total crashes include crashes with no injury and unknown injury.
4.1.3 Lighting
Lighting condition can affect pedestrian safety obviously because pedestrians are less visible to
drivers at night. Table 4-4 gives the pedestrian crash statistics by lighting condition. Although a
majority of crashes (49.0%) occurred during daylight, they resulted in a lower percentage of fatal
crashes. Crashes that occurred at night at locations with no additional lighting resulted in a
disproportionately high percentage of fatal crashes. The Z-test was used to compare the
proportion of fatal crashes that occurred during daytime and nighttime. The following equations
were used to calculate the Z-test statistic:
Z test statistic= (P̂1-P̂2)
√(P̂(1-P̂) ×(1
N1+
1
N2)
; P̂= x1+ x2
N1+ N2 (4-1)
where,
P̂1 and P̂2 = proportion of fatal crashes that occurred during daytime and nighttime,
respectively;
N1 and N2 = total number of crashes that occurred during daytime and nighttime,
respectively; and
x1 and x2 = number of fatal crashes that occurred during daytime and nighttime,
respectively.
At a 5% significance level, there was sufficient evidence to suggest that there was a significant
difference in the proportion of fatal crashes that occurred during daytime and nighttime.

46
Table 4-4: Statistics by Lighting Condition
Lighting Condition Fatal Crashes Injury Crashes Total Crashes1
Daylight 100 (3.2%) 2,755 (87.4%) 3,152 (100.0%)
Dusk 10 (6.5%) 127 (82.5%) 154 (100.0%)
Dawn 7 (8.4%) 73 (88.0%) 83 (100.0%)
Dark with Street Light 333 (14.8%) 1,757 (78.2%) 2,247 (100.0%)
Dark with No Street Light 213 (27.9%) 501 (65.7%) 763 (100.0%)
Unknown 0 (0.0%) 31 (88.6%) 35 (100.0%)
Total 663 (10.3%) 5,244 (81.5%) 6,434 (100.0%) 1 Total crashes include crashes with no injury and unknown injury.
4.1.4 At-fault Road User
For each pedestrian crash, the at-fault road user (i.e., driver, or pedestrian, or both) was identified
based on the descriptions in the police reports. Table 4-5 provides these statistics. The at-fault
road user cannot be determined for about 20% of the crashes. Drivers were found to be at fault in
28.2% of the crashes while pedestrians were at fault in over fifty percent (i.e., 53.0%) of the
crashes. From Table 4-5, it can be inferred that crashes where pedestrian was found to be at fault
were more severe compared to the crashes where the driver was at fault. At a 5% significance
level, there was sufficient evidence to suggest that the proportion of fatal crashes was
significantly greater when pedestrian was at fault compared to the proportion when the driver
was at fault.
Table 4-5: Statistics by At-fault Road User
At-fault Road User Fatal Crashes Injury Crashes Total Crashes1
Both Driver and Pedestrian 9 (13.6%) 53 (80.3%) 66 (100.0%)
Driver 56 (3.1%) 1,572 (86.7%) 1,814 (100.0%)
Pedestrian 431 (12.6%) 2,739 (80.3%) 3,411 (100.0%)
Not Sure 167 (14.6%) 880 (77.0%) 1,143 (100.0%)
Total 663 (10.3%) 5,244 (81.5%) 6,434 (100.0%) 1 Total crashes include crashes with no injury and unknown injury.
When the driver was found to be at fault, the following were the most frequent contributing
causes:
careless driving,
failed to yield right-of-way, and
disregarded traffic signal or other traffic control.
When the pedestrian was found to be at fault, the most frequent contributing causes were:
failed to yield right-of-way,
alcohol and/or drugs – under influence, and
disregarded traffic signal or other traffic control.
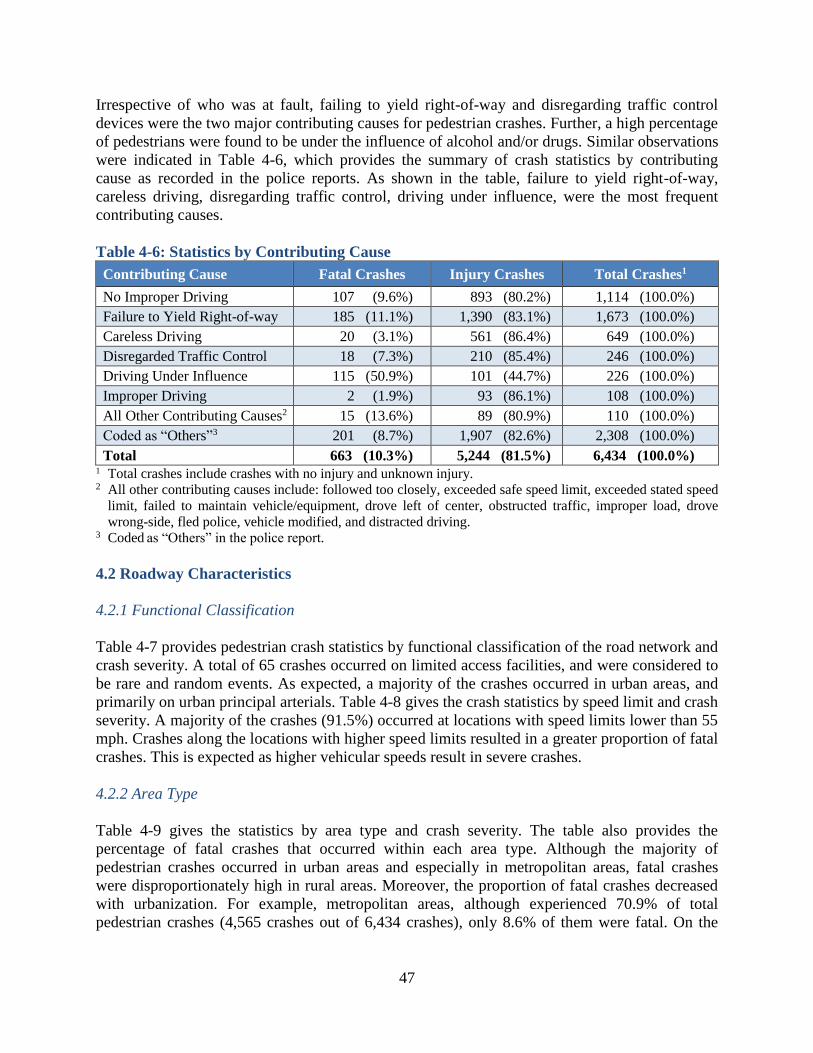
47
Irrespective of who was at fault, failing to yield right-of-way and disregarding traffic control
devices were the two major contributing causes for pedestrian crashes. Further, a high percentage
of pedestrians were found to be under the influence of alcohol and/or drugs. Similar observations
were indicated in Table 4-6, which provides the summary of crash statistics by contributing
cause as recorded in the police reports. As shown in the table, failure to yield right-of-way,
careless driving, disregarding traffic control, driving under influence, were the most frequent
contributing causes.
Table 4-6: Statistics by Contributing Cause
Contributing Cause Fatal Crashes Injury Crashes Total Crashes1
No Improper Driving 107 (9.6%) 893 (80.2%) 1,114 (100.0%)
Failure to Yield Right-of-way 185 (11.1%) 1,390 (83.1%) 1,673 (100.0%)
Careless Driving 20 (3.1%) 561 (86.4%) 649 (100.0%)
Disregarded Traffic Control 18 (7.3%) 210 (85.4%) 246 (100.0%)
Driving Under Influence 115 (50.9%) 101 (44.7%) 226 (100.0%)
Improper Driving 2 (1.9%) 93 (86.1%) 108 (100.0%)
All Other Contributing Causes2 15 (13.6%) 89 (80.9%) 110 (100.0%)
Coded as “Others”3 201 (8.7%) 1,907 (82.6%) 2,308 (100.0%)
Total 663 (10.3%) 5,244 (81.5%) 6,434 (100.0%) 1 Total crashes include crashes with no injury and unknown injury. 2 All other contributing causes include: followed too closely, exceeded safe speed limit, exceeded stated speed
limit, failed to maintain vehicle/equipment, drove left of center, obstructed traffic, improper load, drove
wrong-side, fled police, vehicle modified, and distracted driving. 3 Coded as “Others” in the police report.
4.2 Roadway Characteristics
4.2.1 Functional Classification
Table 4-7 provides pedestrian crash statistics by functional classification of the road network and
crash severity. A total of 65 crashes occurred on limited access facilities, and were considered to
be rare and random events. As expected, a majority of the crashes occurred in urban areas, and
primarily on urban principal arterials. Table 4-8 gives the crash statistics by speed limit and crash
severity. A majority of the crashes (91.5%) occurred at locations with speed limits lower than 55
mph. Crashes along the locations with higher speed limits resulted in a greater proportion of fatal
crashes. This is expected as higher vehicular speeds result in severe crashes.
4.2.2 Area Type
Table 4-9 gives the statistics by area type and crash severity. The table also provides the
percentage of fatal crashes that occurred within each area type. Although the majority of
pedestrian crashes occurred in urban areas and especially in metropolitan areas, fatal crashes
were disproportionately high in rural areas. Moreover, the proportion of fatal crashes decreased
with urbanization. For example, metropolitan areas, although experienced 70.9% of total
pedestrian crashes (4,565 crashes out of 6,434 crashes), only 8.6% of them were fatal. On the

48
other hand, rural areas experienced 3.4% of total pedestrian crashes (222 crashes out of 6,434
crashes); however, 22.5% of these crashes resulted in fatalities.
Table 4-7: Statistics by Functional Class
Functional Classification Fatal
Crashes
Injury
Crashes
Total
Crashes1
Total
Miles
Crashes
per year
per 100 miles
Rural Interstate 2 2 6 748 0.27
Rural Principal Arterial 32 110 157 2,865 1.83
Rural Minor Arterial 13 32 47 2,458 0.64
Rural Major Collector 3 4 8 4,286 0.06
Urban Interstate 5 12 18 756 0.79
Urban Principal Arterial- Other Freeways 6 27 41 572 2.39
Urban Principal Arterial 483 3426 4,236 3,680 38.37
Urban Minor Arterial 112 1539 1,810 4,214 14.32
Urban Collector 6 61 73 7,222 0.34
Urban Local 0 3 4 1,488 0.09
Unknown 1 28 34 -- --
Total 663 5244 6,434 28,289 7.58 1 Total crashes include crashes with no injury and unknown injury.
Table 4-8: Statistics by Speed Limit
Speed
Limit
(mph)
Total
Miles
Crashes
/100 miles
Fatal
Crashes
Injury
Crashes
Total
Crashes1
<40 3,968 49.02 102 (5.2%) 1658 (85.2%) 1,945 (100.0%)
40-50 6,937 56.84 441 (11.2%) 3206 (81.3%) 3,943 (100.0%)
≥ 55 9,407 5.00 116 (24.7%) 318 (67.7%) 470 (100.0%)
Unknown 31,193 0.24 4 (5.3%) 62 (81.6%) 76 (100.0%)
Total 51,505 12.49 663 (10.3%) 5244 (81.5%) 6,434 (100.0%) 1 Total crashes include crashes with no injury and unknown injury.
Table 4-9: Statistics by Area Type
Area Type Fatal
Crashes
Injury
Crashes
Total
Crashes1
Total
Miles
Crashes
per Year
per 100
Miles
Fatal Crashes
per Year
per 100 Miles
Rural 50 (22.5%) 152 (68.5%) 222 (100.0%) 18,556 0.40 0.09
Small Urban 35 (14.8%) 182 (76.8%) 237 (100.0%) 1,665 4.74 0.70
Small Urbanized 103 (14.9%) 554 (80.2%) 691 (100.0%) 3,764 6.12 0.91
Large Urbanized 81 (11.3%) 583 (81.2%) 718 (100.0%) 3,457 6.92 0.78
Metropolitan 394 (8.6%) 3,772 (82.6%) 4,565 (100.0%) 9,804 15.52 1.34
Unknown 0 (0.0%) 1 (100.0%) 1 (100.0%) -- -- --
Total 663 (10.3%) 5,244 (81.5%) 6,434 (100.0%) 51,505 4.16 0.43 1 Total crashes include crashes with no injury and unknown injury.

49
Figure 4-1 gives the pedestrian crash statistics by area type and population. The 2009 travel
survey data extracted from the NHTS database was used to estimate population in urban and
rural areas (FHWA, 2009). A majority of the population lives in urban areas, and these areas
experienced a significantly high number of pedestrian crashes.
Figure 4-1: Pedestrian Crash Statistics by Area Type and Population
4.2.3 Crash Location
Table 4-10 gives pedestrian crash statistics by crash location and crash severity. Crash locations
were broadly divided into two categories: signalized intersections and all other locations.
Locations outside the vicinity of signalized intersections experienced a greater number of
pedestrian crashes. These locations also experienced high pedestrian fatalities compared to
signalized intersections. From Table 4-10, it can be inferred that 13.9% of total crashes that
occurred at locations with no signals (i.e., unsignalized intersections and midblocks) resulted in
fatalities, while 6.8% of total crashes that occurred at signalized intersections were fatal crashes.
This is expected as vehicles travel at higher speeds at locations with no signalized intersections
compared to the vehicles at signalized intersections. Also, drivers are more likely to expect
pedestrians at signalized intersections.
Table 4-10: Statistics by Crash Location
Crash Location Fatal Crashes Injury Crashes Total Crashes1
Signalized intersection 205 (6.8%) 2,569 (84.7%) 3,034 (100.0%)
At all other locations 408 (13.9%) 2,313 (78.5%) 2,945 (100.0%)
Not sure 50 (11.0%) 362 (79.6%) 455 (100.0%)
Total 663 (10.3%) 5,244 (81.5%) 6,434 (100.0%) 1 Total crashes include crashes with no injury and unknown injury.
6,211
223
6,434
14.4
2.8
17.2
0
2
4
6
8
10
12
14
16
18
20
0
1000
2000
3000
4000
5000
6000
7000
Urban Rural Total
Po
pu
lati
on
in
Mil
lio
ns
To
tal
Ped
estr
ian
Cra
shes
Area Type Total CrashesPopulation (in million)
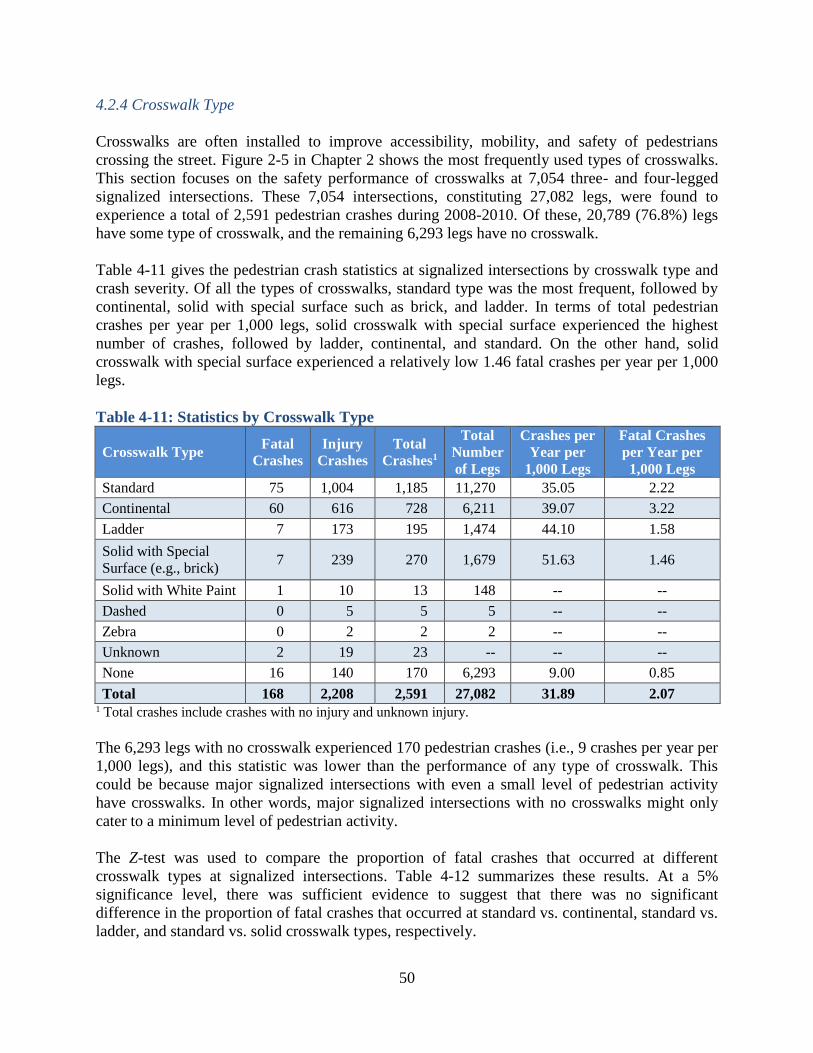
50
4.2.4 Crosswalk Type
Crosswalks are often installed to improve accessibility, mobility, and safety of pedestrians
crossing the street. Figure 2-5 in Chapter 2 shows the most frequently used types of crosswalks.
This section focuses on the safety performance of crosswalks at 7,054 three- and four-legged
signalized intersections. These 7,054 intersections, constituting 27,082 legs, were found to
experience a total of 2,591 pedestrian crashes during 2008-2010. Of these, 20,789 (76.8%) legs
have some type of crosswalk, and the remaining 6,293 legs have no crosswalk.
Table 4-11 gives the pedestrian crash statistics at signalized intersections by crosswalk type and
crash severity. Of all the types of crosswalks, standard type was the most frequent, followed by
continental, solid with special surface such as brick, and ladder. In terms of total pedestrian
crashes per year per 1,000 legs, solid crosswalk with special surface experienced the highest
number of crashes, followed by ladder, continental, and standard. On the other hand, solid
crosswalk with special surface experienced a relatively low 1.46 fatal crashes per year per 1,000
legs.
Table 4-11: Statistics by Crosswalk Type
Crosswalk Type Fatal
Crashes
Injury
Crashes
Total
Crashes1
Total
Number
of Legs
Crashes per
Year per
1,000 Legs
Fatal Crashes
per Year per
1,000 Legs
Standard 75 1,004 1,185 11,270 35.05 2.22
Continental 60 616 728 6,211 39.07 3.22
Ladder 7 173 195 1,474 44.10 1.58
Solid with Special
Surface (e.g., brick) 7 239 270 1,679 51.63 1.46
Solid with White Paint 1 10 13 148 -- --
Dashed 0 5 5 5 -- --
Zebra 0 2 2 2 -- --
Unknown 2 19 23 -- -- --
None 16 140 170 6,293 9.00 0.85
Total 168 2,208 2,591 27,082 31.89 2.07 1 Total crashes include crashes with no injury and unknown injury.
The 6,293 legs with no crosswalk experienced 170 pedestrian crashes (i.e., 9 crashes per year per
1,000 legs), and this statistic was lower than the performance of any type of crosswalk. This
could be because major signalized intersections with even a small level of pedestrian activity
have crosswalks. In other words, major signalized intersections with no crosswalks might only
cater to a minimum level of pedestrian activity.
The Z-test was used to compare the proportion of fatal crashes that occurred at different
crosswalk types at signalized intersections. Table 4-12 summarizes these results. At a 5%
significance level, there was sufficient evidence to suggest that there was no significant
difference in the proportion of fatal crashes that occurred at standard vs. continental, standard vs.
ladder, and standard vs. solid crosswalk types, respectively.
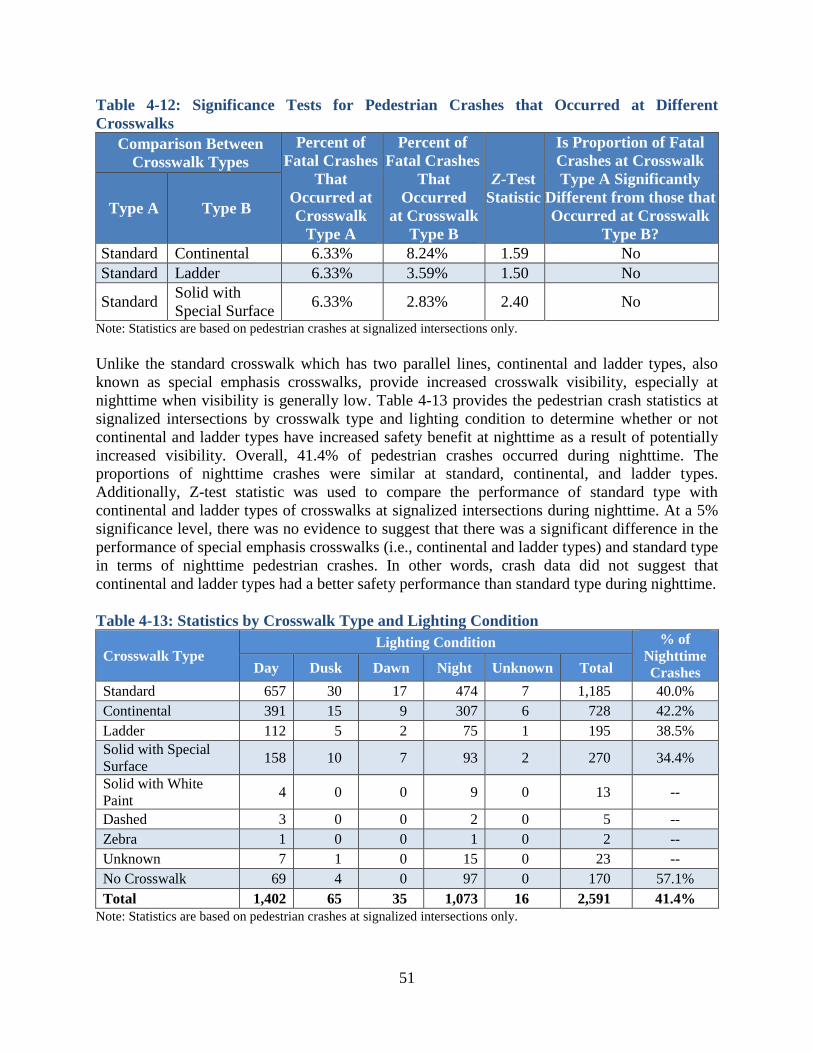
51
Table 4-12: Significance Tests for Pedestrian Crashes that Occurred at Different
Crosswalks
Comparison Between
Crosswalk Types
Percent of
Fatal Crashes
That
Occurred at
Crosswalk
Type A
Percent of
Fatal Crashes
That
Occurred
at Crosswalk
Type B
Z-Test
Statistic
Is Proportion of Fatal
Crashes at Crosswalk
Type A Significantly
Different from those that
Occurred at Crosswalk
Type B?
Type A Type B
Standard Continental 6.33% 8.24% 1.59 No
Standard Ladder 6.33% 3.59% 1.50 No
Standard Solid with
Special Surface 6.33% 2.83% 2.40 No
Note: Statistics are based on pedestrian crashes at signalized intersections only.
Unlike the standard crosswalk which has two parallel lines, continental and ladder types, also
known as special emphasis crosswalks, provide increased crosswalk visibility, especially at
nighttime when visibility is generally low. Table 4-13 provides the pedestrian crash statistics at
signalized intersections by crosswalk type and lighting condition to determine whether or not
continental and ladder types have increased safety benefit at nighttime as a result of potentially
increased visibility. Overall, 41.4% of pedestrian crashes occurred during nighttime. The
proportions of nighttime crashes were similar at standard, continental, and ladder types.
Additionally, Z-test statistic was used to compare the performance of standard type with
continental and ladder types of crosswalks at signalized intersections during nighttime. At a 5%
significance level, there was no evidence to suggest that there was a significant difference in the
performance of special emphasis crosswalks (i.e., continental and ladder types) and standard type
in terms of nighttime pedestrian crashes. In other words, crash data did not suggest that
continental and ladder types had a better safety performance than standard type during nighttime.
Table 4-13: Statistics by Crosswalk Type and Lighting Condition
Crosswalk Type Lighting Condition % of
Nighttime
Crashes Day Dusk Dawn Night Unknown Total
Standard 657 30 17 474 7 1,185 40.0%
Continental 391 15 9 307 6 728 42.2%
Ladder 112 5 2 75 1 195 38.5%
Solid with Special
Surface 158 10 7 93 2 270 34.4%
Solid with White
Paint 4 0 0 9 0 13 --
Dashed 3 0 0 2 0 5 --
Zebra 1 0 0 1 0 2 --
Unknown 7 1 0 15 0 23 --
No Crosswalk 69 4 0 97 0 170 57.1%
Total 1,402 65 35 1,073 16 2,591 41.4% Note: Statistics are based on pedestrian crashes at signalized intersections only.

52
4.3 Statewide Pedestrian Crash Concentrations
As discussed in Section 2.4.1, the density methods attempt to identify high concentrations of
pedestrian crashes. The degree of concentration was measured based on density, calculated as
pedestrian crash frequency per unit area (e.g., square miles) or unit length (e.g., mile). In this
section, statewide pedestrian crash concentrations were identified using pedestrian crash density
maps generated in ArcGIS 10.0. Figures 4-2 and 4-3 provide the density maps for the entire state
of Florida using three-year pedestrian crash data. From Figure 4-2, it can be inferred that a
majority of pedestrian crashes occurred along the coastline and in major urban areas including
Jacksonville, Miami, Orlando, Tallahassee, and Tampa. Figure 4-3 gives the pedestrian crash
density calculated using Kernel Density Function. Again, from the figure, it is clear that Miami
and Broward counties had the highest pedestrian crash density, followed by Pinellas and
Hillsborough, and Orange and Seminole counties, respectively.

53
Figure 4-2: Spatial Distribution of Pedestrian Crashes

54
Figure 4-3: Pedestrian Crash Density
4.4 Summary
This chapter focused on the statewide pedestrian crash causes and patterns. The analysis was
based on 6,434 pedestrian crashes that occurred on state roads during 2008-2010. In the three-
year analysis period, a total of 663 pedestrians (i.e., 10.3%) were killed on state roads. The
statistics show that there were 124.7 total crashes and 13 fatal crashes per million population

55
annually. Of the different age groups, the young pedestrian group (16-25 years) experienced
highest number of pedestrian crashes per million population. Pedestrians in the same age group
(16-25 years) experienced the highest pedestrian crash rate of 0.79 crashes per million walk trips
per year. The annual fatal crash rate (fatal crashes per million walk trips) was found to be slightly
higher for the older age groups.
Although a majority of crashes occurred during daytime, they resulted in a lower proportion of
fatalities. At 5% significance level, the proportion of fatal crashes that occurred during nighttime
were significantly greater compared to the proportion of fatal crashes in the daytime.
Of the 6,434 total pedestrian crashes, pedestrian was found to be at fault in 53.0% of the crashes
and the driver was at fault in 28.2% of the crashes. Irrespective of who was at fault, failing to
yield right-of-way and disregarding traffic control devices were the two major contributing
causes for pedestrian crashes. Moreover, crashes where pedestrian was at fault were found to be
more severe compared to the crashes where the driver was at fault, and this difference was found
to be statistically significant.
A majority of the crashes occurred primarily on urban principal arterials. Although the majority
of pedestrian crashes occurred in urban areas and especially in metropolitan areas, fatal crashes
were disproportionately high in rural areas. Moreover, the proportion of fatal crashes decreased
with urbanization. Crashes along the locations with higher speed limits resulted in a greater
proportion of fatal crashes.
A majority of signalized intersections on state roads were found to have crosswalks on at least
one of its legs. Of all the types of crosswalks, standard type was the most frequent, followed by
continental, solid with special surface such as brick, and ladder. Although the solid crosswalk
with brick fill experienced the highest number of pedestrian crashes per 1,000 legs, it
experienced a relatively low 1.46 fatal crashes per year per 1,000 legs. However, at 5%
significance level, there was no significant difference in the proportion of fatal crashes at
signalized intersections across the following crosswalk types: standard, continental, ladder, and
solid with special surface. Furthermore, crash data did not indicate that continental and ladder
types had a better safety performance than standard crosswalks at signalized intersections during
nighttime.
56
CHAPTER 5
STATEWIDE CRASH SEVERITY CONTRIBUTING FACTORS
This chapter identifies the significant factors that affect pedestrian crash injury severity at
signalized and non-signalized locations using the mixed logit model. It first provides an
overview of the data preparation and the exploratory variables used in developing the models.
The random forest technique (used to rank the importance of independent variables) and the
mixed logit model (used to determine the significant factors affecting injury severity) are
discussed. The analysis results along with detailed discussion are then provided.
5.1 Data Preparation
As mentioned in Section 3.1, a total of 7,630 pedestrian crashes occurred on state roads in
Florida during 2008-2010. About 35% of these crashes had to be excluded from this analysis due
to insufficient information in the police reports. Finally, a total of 4,923 pedestrian crashes were
included in the analysis. Of these crashes, 2,360 occurred at signalized locations, 2,282 occurred
at non-signalized locations, and the locations of the remaining 281 pedestrian crashes were
unknown. In addition to the data available in the crash summary records and the data collected
from reviewing the police reports (as discussed in Section 3.1), additional information on
roadway characteristics (e.g., road surface condition and land use type) and traffic (e.g., average
annual daily traffic (AADT), speed limit, and percentage of trucks) at the crash location was
retrieved from 2011 FDOT’s Roadway Characteristics Inventory (RCI) database.
The analysis in this chapter focuses on analyzing pedestrian injury severity at each of signalized
and non-signalized locations separately to identify the significant factors affecting injury severity
at each location to help in the appropriate selection of countermeasures. Note that the non-
signalized locations include unsignalized intersections and midblocks. For modeling pedestrian
injury severity, two types of severity were considered: non-severe injury (i.e., no injury, possible
injury, and non-incapacitating injury) and severe injury (i.e., incapacitating and fatal injuries).
Tables 5-1 and 5-2 provide a description of the dependent and independent variables and their
summary statistics at signalized and non-signalized locations, respectively. Two new variables,
at-fault road user and pedestrian maneuver type, were identified by reviewing the police reports
and were included in the analysis. Additional geometric and traffic variables such as presence of
pedestrian refuge areas, presence and type of crosswalk, presence of pedestrian signals, and type
of vehicle involved in the crash were also explored in this chapter. The analysis also included
environmental and temporal variables such as lighting condition, weather, and crash time (i.e.,
on- and off-peak crash hours).
The correlations among the explored independent variables at both signalized and non-signalized
locations were examined. Tables 5-3 and 5-4 show the correlation matrices of the 15 explored
independent variables at signalized and non-signalized locations, respectively. From both tables,
it can be seen that all correlation coefficients were close to zero. Hence, all the variables were
considered independent from each other and no meaningful correlations were found to exist.

57
Table 5-1: Summary Statistics of Explored Variables at Signalized Locations Category Variable Name Summary Statistics1
Dependent Variable
Response Pedestrian Injury Severity F (Non-Severe Injury) = 1,555 (65.89%);
F (Severe Injury) = 805 (34.11%)
Continuous Independent Variables
Traffic
Ln (AADT) M = 10.42, SD = 0.49
Speed Limit M = 40.35, SD = 6.07
Percentage of Trucks M = 4.56, SD = 2.58
Categorical Independent Variables
Environmental
Lighting Condition
F (Daylight) = 1,289 (54.62%); F (Dusk) = 56 (2.37%);
F (Dawn) = 29 (1.22%);
F (Dark Street Light) = 839 (35.55%);
F (Dark No Street Light) = 134 (5.67%);
F (Unknown) = 13 (0.55%)
Weather Condition
F (Clear) = 1,821 (77.16%); F (Cloudy) = 373 (15.81%);
F (Rainy) = 152 (6.44%); F (Foggy) = 2 (0.08%);
F (Other) = 12 (0.51%)
Traffic
Presence of Pedestrian
Signals?
F (Yes) = 2,166 (91.78%); F (No) = 160 (6.78%);
F (Not Sure) = 34 (1.44%)
Hour of Crash
F (Morning Peak) = 384 (16.27%);
F (Morning Off-Peak) = 558 (23.64%);
F (Afternoon Peak) = 609 (25.81%);
F (Night/Dawn Off-Peak) = 809 (34.28%)
Geometric
Road Surface Condition F (Dry) = 2,102 (89.07%);
F (Wet/Slippery) = 243 (10.29%); F (Other) = 15 (0.64%)
Land Use Type F (Urban/Suburban) = 2,345 (99.36%);
F (Rural) = 15 (0.64%)
Presence of Ped. Refuge Area? F (Yes) = 1,420 (60.17%); F (No) = 914 (38.73%);
F (Not Sure) = 26 (1.10%)
Crosswalk Type
F (No Crosswalk) = 166 (7.03%); F (Solid) = 7 (0.29%);
F (Standard) = 1,042 (44.15%); F (Ladder) = 215 (9.11%);
F (Continental) = 641 (27.16%); F (Zebra) = 8 (0.34%);
F (Dashed) = 4 (0.17%); F (Other) = 277 (11.74%)
Pedestrian/Driver
-Related
Pedestrian Age
F (Very Young, Age ≤ 19 years) = 303 (12.84%);
F (Young, 20 years ≤ Age ≤ 24 years) = 225 (9.53%);
F (Middle, 25 years ≤ Age ≤ 64 years) = 1,491 (63.18%);
F (Old, 65 years ≤ Age ≤ 79 years) = 266 (11.27%);
F (Very Old, Age ≥ 80 years) = 75 (3.18%)
Who is At-fault? F (Ped.) = 1,372 (58.14%); F (Driver) = 605 (25.64%);
F (Both) = 29 (1.23%); F (Not Sure) = 354 (15%)
Pedestrian Maneuver Before
Crash
F (Crossing Street) = 2,175 (92.16%);
F (Walking along Roadway) = 48 (2.03%);
F (Not Sure) = 137 (5.81%)
Vehicle-Related Driver’s Vehicle Type
F (Passenger Cars) = 802 (33.98%);
F (Vans) = 89 (3.77%);
F (SUVs and Pick-ups) = 194 (8.22%);
F (Medium Trucks) = 7 (0.29%);
F (Heavy Trucks) = 6 (0.25%);
F (Buses) = 12 (0.51%); F (Bicycles) = 1 (0.04%);
F (Motorcycles) = 6 (0.25%); F (Other) = 1,243 (52.67%) 1 F = Crash frequency (italicized % in parentheses), M = Mean, and SD = Standard deviation.

58
Table 5-2: Summary Statistics of Explored Variables at Non-Signalized Locations Category Variable Name Summary Statistics1
Dependent Variable
Response Pedestrian Injury Severity F (Non-Severe Injury) = 1,241 (54.38%);
F (Severe Injury) = 1,041 (45.62%)
Continuous Independent Variables
Traffic
Ln (AADT) on Major Road M = 10.24, SD = 0.62
Speed Limit on Major Road M = 42.31, SD = 7.54
% of Trucks on Major Road M = 5.21, SD = 3.48
Categorical Independent Variables
Environmental
Lighting Condition
F (Daylight) = 1,013 (44.39%); F (Dusk) = 57 (2.49%);
F (Dawn) = 29 (1.27%);
F (Dark Street Light) = 767 (33.61%);
F (Dark No Street Light) = 404 (17.70%);
F (Unknown) = 12 (0.52%)
Weather Condition
F (Clear) = 1,779 (77.96%); F (Cloudy) = 360 (15.77%);
F (Rainy) = 121 (5.30%); F (Foggy) = 5 (0.22%);
F (Other) = 17 (0.74%)
Traffic
Presence of Pedestrian
Signals?
F (Yes) = 128 (5.61%); F (No) = 2,079 (91.10%);
F (Not Sure) = 75 (3.29%)
Hour of Crash
F (Morning Peak) = 262 (11.48%);
F (Morning Off-Peak) = 494 (21.65%);
F (Afternoon Peak) = 572 (25.07%);
F (Night/Dawn Off-Peak) = 953 (41.76%);
F (Unknown) = 1 (0.04%)
Geometric
Road Surface Condition F (Dry) = 2,035 (89.17%);
F (Wet/Slippery) = 233 (10.21%); F (Other) = 14 (0.61%)
Land Use Type F (Urban/Suburban) = 2,162 (94.74%);
F (Rural) = 120 (5.25%)
Presence of Ped. Refuge Area? F (Yes) = 1,098 (48.11%); F (No) = 1,120 (49.08%);
F (Not Sure) = 64 (2.80%)
Crosswalk Type
F (No Crosswalk) = 1,902 (83.35%); F (Solid) = 2 (0.08%);
F (Standard) = 146 (6.40%); F (Ladder) = 22 (0.96%);
F (Continental) = 64 (2.80%); F (Zebra) = 1 (0.04%);
F (Other) = 145 (6.35%)
Pedestrian/Driver
-Related
Pedestrian Age
F (Very Young, Age ≤ 19 years) = 234 (10.25%);
F (Young, 20 years ≤ Age ≤ 24 years) = 228 (9.99%);
F (Middle, 25 years ≤ Age ≤ 64 years) = 1,517 (66.48%);
F (Old, 65 years ≤ Age ≤ 79 years) = 212 (9.29%);
F (Very Old, Age ≥ 80 years) = 91 (3.98%)
Who is At-fault? F (Ped.) = 1,323 (57.98%); F (Driver) = 573 (25.11%);
F (Both) = 30 (1.31%); F (Not Sure) = 356 (15.60%)
Pedestrian Maneuver Before
Crash
F (Crossing Street) = 1,821 (79.79%);
F (Walking along Roadway) = 206 (9.03%);
F (Not Sure) = 255 (11.17%)
Vehicle-Related Driver’s Vehicle Type
F (Passenger Cars) = 662 (29%);
F (Vans) = 78 (3.42%);
F (SUVs and Pick-Ups) = 234 (10.25%);
F (Medium Trucks) = 13 (0.57%);
F (Heavy Trucks) = 7 (0.31%); F (RVs) = 1 (0.04%);
F (Buses) = 7 (0.31%); F (Motorcycles) = 16 (0.70%);
F (Other) = 1,264 (55.39%) 1 F = Crash frequency (italicized % in parentheses), M = Mean, and SD = Standard deviation.

59
Table 5-3: Correlation Matrix of Explored Variables at Signalized Locations
*Var. 1 = Ln (AADT); Var. 2 = Percent of Trucks; Var. 3 = Speed Limit;
Var. 4 = Who is At-fault?; Var. 5 = Presence of Ped. Signals; Var. 6 = Presence of Pedestrian Refuge;
Var. 7 = Crosswalk Type; Var. 8 = Pedestrian Maneuver; Var. 9 = Hour of Crash;
Var. 10 = Lighting Condition; Var. 11= Weather Condition; Var. 12 = Road Surface Condition;
Var. 13 = Vehicle Type; Var. 14 = Land Use Type; Var. 15 = Pedestrian Age.
Table 5-4: Correlation Matrix of Explored Variables at Non-Signalized Locations
*Var. 1 = Ln (AADT); Var. 2 = Percent of Trucks; Var. 3 = Speed Limit;
Var. 4 = Who is At-fault?; Var. 5 = Presence of Ped. Signals; Var. 6 = Presence of Pedestrian Refuge;
Var. 7 = Crosswalk Type; Var. 8 = Pedestrian Maneuver; Var. 9 = Hour of Crash;
Var. 10 = Lighting Condition; Var. 11= Weather Condition; Var. 12 = Road Surface Condition;
Var. 13 = Vehicle Type; Var. 14 = Land Use Type; Var. 15 = Pedestrian Age.
5.2 Methodology
5.2.1 Random Forest Technique
As documented in previous research (e.g., Moore et al., 2011; Haleem and Gan, 2013), a major
issue while fitting the mixed logit model is to determine random parameters. The random forest
technique is adopted in the analysis for screening the severity predictors before fitting the mixed
logit model. In this technique, a number of trees are grown by randomly selecting some
observations from the original dataset with replacement, then searching over a randomly selected
subset of variables at each split till the variable importance is ranked (Haleem et al., 2010).
Var. 1* Var. 2 Var. 3 Var. 4 Var. 5 Var. 6 Var. 7 Var. 8 Var. 9 Var. 10 Var. 11 Var. 12 Var. 13 Var. 14 Var. 15
Var. 1 1 -0.15 0.45 -0.09 -0.04 -0.42 -0.08 -0.04 0.01 -0.02 0.00 0.00 0.07 0.15 -0.01
Var. 2 1 -0.03 0.08 0.02 0.04 0.09 0.06 0.04 0.02 0.03 0.02 0.03 -0.07 -0.03
Var. 3 1 -0.12 0.11 -0.43 -0.06 0.00 -0.01 -0.02 0.02 0.01 0.14 -0.03 0.02
Var. 4 1 -0.05 0.11 -0.04 0.13 0.04 0.01 -0.03 -0.04 -0.25 -0.02 -0.02
Var. 5 1 0.08 0.30 0.04 0.00 0.00 -0.02 -0.01 0.07 -0.07 -0.03
Var. 6 1 0.05 0.03 0.00 0.04 0.00 0.00 -0.12 -0.06 0.00
Var. 7 1 0.04 -0.03 0.02 0.00 -0.01 0.02 -0.02 -0.01
Var. 8 1 0.02 0.00 0.00 -0.01 -0.08 -0.02 -0.03
Var. 9 1 -0.01 -0.01 -0.04 -0.04 0.04 -0.03
Var. 10 1 0.39 0.19 0.06 -0.01 0.00
Var. 11 1 0.43 -0.04 0.01 -0.02
Var. 12 1 0.02 0.01 0.00
Var. 13 1 -0.01 -0.01
Var. 14 1 -0.01
Var. 15 1
Var. 1* Var. 2 Var. 3 Var. 4 Var. 5 Var. 6 Var. 7 Var. 8 Var. 9 Var. 10 Var. 11 Var. 12 Var. 13 Var. 14 Var. 15
Var. 1 1 -0.32 0.06 -0.06 0.07 -0.26 -0.02 -0.15 -0.02 -0.02 -0.01 -0.01 0.00 0.45 -0.09
Var. 2 1 0.23 0.02 0.05 0.03 0.01 0.12 0.03 0.05 0.04 0.05 0.06 -0.40 0.02
Var. 3 1 -0.06 0.12 -0.32 0.14 0.08 0.01 0.05 -0.03 -0.01 0.18 -0.34 -0.03
Var. 4 1 0.04 0.11 -0.11 0.19 0.00 -0.01 0.01 0.02 -0.20 -0.02 -0.03
Var. 5 1 0.10 0.29 0.02 0.02 -0.02 0.01 0.02 0.00 -0.02 -0.03
Var. 6 1 -0.08 0.08 -0.01 -0.05 0.00 -0.02 -0.20 -0.04 0.05
Var. 7 1 0.06 -0.01 -0.02 0.00 0.01 0.13 -0.04 -0.02
Var. 8 1 -0.04 0.02 0.05 0.04 -0.05 -0.12 0.00
Var. 9 1 -0.01 0.02 -0.04 -0.02 0.00 0.00
Var. 10 1 0.27 0.15 0.08 -0.02 -0.04
Var. 11 1 0.34 0.02 0.02 -0.03
Var. 12 1 0.02 -0.01 -0.02
Var. 13 1 -0.04 -0.08
Var. 14 1 -0.04
Var. 15 1

60
5.2.2 Mixed Logit Model
As documented in Kim et al. (2010), the traditional approaches of modeling injury severity such
as the multinomial logit and nested logit models assume that the effect of each variable is
constant across the observations. While these approaches have been applied in many severity
studies, they cannot model the influence of unobserved predictors, such as pedestrian's physical
health and driver behavior. To account for unobserved predictors, the mixed logit model, also
referred to as the random parameters logit model, is applied. It allows the parameter estimates to
randomly vary across the observations. The mixed logit model is a good modeling alternative
when the data for unobserved predictors are not present.
The methodological approach adopted in the analysis follows Milton et al. (2008), Pai et al.
(2009), and Train (2009). As documented in Haleem and Gan (2013), the function ( jnU ) that
defines the crash injury severity category j probability (severe injury or non-severe injury) on
segment n is:
jnjn
'
jjn XU (5-1)
where,
'
j = vector of parameters to be estimated;
jnX = vector of explored variables (geometric, traffic, environmental,
pedestrian/driver-related, and vehicle-related); and
jn = random error term that is iid (independently- and identically-distributed)
extreme value.
As pointed out in Train (2009), j or jn cannot be observed. Thus, the probability )j(Pn of
injury severity j from all injury severity categories J (representing non-severe and severe
injuries) on segment n is the following:
J
jn
'
j
jn
'
j
n)Xexp(
)Xexp()j(P (5-2)
Equation (5-2) describes the probability conditioned on j , which is unknown; thus, the
unconditioned choice probability, also known as the mixed logit probability, is the integral of
)j(Pn over all possible values of j , as follows:
d)/(f)Xexp(
)Xexp(P
J
jn
'
j
jn
'
j
jn (5-3)
where )/(f is the density function of , and is the vector of parameters for the assumed

61
distribution (e.g., mean and variance for the normal distribution). For example, if )/(f has a
normal distribution, then ~ N (b, W), with b and W denote the components of the vector.
From Equation (5-3), can now account for segment-specific variations of the effect of X on
injury probabilities. The mixed logit probabilities are a weighted average for different values of
across segments, where some components are held fixed and some are randomly-distributed.
For the random parameters, the mixed logit weights are determined by the density function
)/(f .
The mixed logit model in this study is fitted while considering the normal distribution of the
parameters as random parameters. The parameter estimates of a mixed logit model are computed
via the simulated maximum likelihood simulation which is performed using 200 Halton draws.
The mixed logit model is fitted using the LIMDEP software package (Econometric Software,
Inc.). Further, a 10% significance level is used to test the statistical significance of explored
variables.
5.3 Random Forest Technique Results
The random forest technique was used to rank the importance of the 15 independent variables at
both signalized and non-signalized locations before fitting the mixed logit models. Figures 5-1(a)
and 5-1(b) provide the results from the random forest technique at signalized and non-signalized
locations, respectively. At both locations, a total of 500 trees were used to grow the forest using
the “randomForest” library in the R package (R Software). Using the Gini index measure to
indicate the variable purity, the variables were ranked in descending order from the most to the
least important. As shown in Figure 5-1(a), in the case of signalized locations, a cut-off value of
30 was used and the following ten variables were chosen to be included in the model: percentage
of trucks, natural logarithm of AADT, crosswalk type, lighting condition, pedestrian age, speed
limit, hour of crash, at-fault road user, vehicle type, and weather condition.
As shown in Figure 5-1(b), for non-signalized locations, a cut-off value of 20 was used and the
following twelve variables were chosen to be included in the mixed logit model: percentage of
trucks, natural logarithm of AADT, lighting condition, speed limit, pedestrian age, at-fault road
user, hour of crash, vehicle type, presence of pedestrian refuge, crosswalk type, pedestrian
maneuver, and weather condition. Note that all the above variables except for two (presence of
pedestrian refuge and pedestrian maneuver) were included in the signalized locations model. It
can be also inferred from Figure 5-1 that the land use type was the least important variable. This
could be because the majority of pedestrian crashes occurred in urban and suburban areas, as
shown in Tables 5-1 and 5-2.
To confirm that the pruned 500 trees at both signalized and non-signalized locations would lead
to consistent and unbiased results, the plot of the out-of-bag (OOB) error against the number of
trees is shown in Figure 5-2. In Figures 5-2(a) and 5-2(b), the minimum OOB error rates were
achieved using 500 trees. Furthermore, the OOB error began to stabilize from 300 and 450 trees
at signalized and non-signalized locations, respectively. This shows that using 500 trees was
sufficient to yield reliable variable ranking using the random forest technique.

62
(a) Signalized Locations (b) Non-signalized Locations
Figure 5-1: Variable Importance Ranking Using Random Forest
(a) Signalized Locations
Cut-Off Value
30
Cut-Off Value

63
(b) Non-signalized Locations
Figure 5-2: Plot of Out-of-Bag Error Against Number of Trees
5.4 Mixed Logit Model Results
5.4.1 Signalized Locations Model
Table 5-5 shows the fitted mixed logit model for pedestrian injury severity at signalized locations
using 200 simulated Halton draws. It also provides the goodness-of-fit statistics for the model
including log-likelihood at convergence, log-likelihood at zero, McFadden Pseudo R2, and
Akaike information criterion (AIC). The fitted mixed logit model is considered to have a good fit
as the McFadden’s Pseudo R2 of the model is greater than 0.1 (Ulfarsson et al., 2010).
The parameters were considered to be random if they yielded statistically significant standard
deviations for the normal distribution. On the other hand, if the parameters’ estimated standard
deviations were not statistically different from zero, the parameters were held fixed across the
observations. As shown in Table 5-5, the percentage of trucks, speed limit, and very young
pedestrians were found to be statistically significant random parameters. On the other hand, the
natural logarithm of AADT, very old pedestrians, at-fault pedestrians, weather condition,
lighting condition, and night/dawn off-peak hours were found to be the fixed parameters in the
model.
The last column in Table 5-5 shows the elasticities or marginal effects of the severe injury
probabilities. The marginal effects are the partial derivatives of the probability of crash injury
severity with respect to the vector of independent variables (Zhang, 2010). The marginal effects

64
depict the effect of change in a certain independent variable on the probability of a specific
injury severity level (Haleem and Gan, 2013). For continuous variables, the marginal effect
measures the influence of a unit change in an independent variable on the probability of injury
occurrence. For categorical variables, the marginal effect represents the percentage the variable
is associated with injury occurrence.
Table 5-5: Mixed Logit Model Estimates at Signalized Locations
Variable Description
Simulated
Maximum
Likelihood
Estimate
Standard
Error P-Value
Severe
Injury
Elasticity
(%)
Random Parameters
Percentage of Trucks 0.381
(1.490)a
0.183
(0.463)a
0.037
(0.001)a
1.370
Speed Limit 0.671 0.177 0.000 1.221
Very Young Pedestriansb
(1.115)a
-0.308
(1.966)a
(0.591)a
0.186
(0.533)a
(0.059)a
0.097
(0.000)a
-0.029
Fixed Parameters
Intercept for Severe Injury -0.797 0.063 0.000 ---
Ln(AADT) 0.023 0.004 0.000 15.680 Very Old Pedestriansb 0.049 0.007 0.000 30.858
Pedestrian At-faultb 0.367 0.089 0.000 3.445
Weather Condition: Clearb -0.263 0.112 0.019 -3.056 Rainyb 0.353 0.184 0.055 0.385
Lighting Condition: Dark with Street Lightb 0.733 0.118 0.000 4.666
Dark with No Street Lightb 1.637 0.215 0.000 1.523
Night/Dawn Off-Peak Hour (8:00 pm-6:59 am)b 0.441 0.118 0.000 2.654
Number of Observations 2,360
-1,287.33 -1,635.83 0.21
2,604.66
Log-Likelihood at Convergence
Log-Likelihood at Fitting the Intercept
McFadden’s Pseudo R2
AIC a Standard deviation. b Binary categorical variables inserted as “1” if true; “0” otherwise.
Random Parameters
The percentage of trucks is normally distributed with a mean of 0.381 and a standard deviation
of 1.49. The probability that the distribution is less than zero can be calculated using the
following equation:
Z =EstimateofDeviation.St
EstimateParameterMean0 (5-4)
The Z-value calculated from the above equation is - 0.25. This value corresponds to 40.13%. In
other words, 40.13% of the distribution is less than 0 and the remaining 59.87% is greater than 0.
65
This indicates that the percentage of trucks is associated with higher probability of severe
injuries at signalized locations. The severe injury elasticity is 1.37%, which means that a one-
percent increase in the percentage of trucks increases the probability of severe injuries by about
1.4%.
Speed limit is also normally distributed with a mean of 0.671 and a standard deviation of 1.115,
which corresponds to a Z-value of -0.6. From the Z-tables, 27.43% of the distribution is less than
0 and the remaining 72.57% is greater than 0. Based on this, in 72.57% of the pedestrian crash
observations, higher speed limits are associated with greater severe injury probability.
Furthermore, a one mile per hour increase in the speed limit increases the probability of severe
injuries by 1.2%. This result is similar to several other studies, e.g., Milton et al. (2008), Kim et
al. (2010), Haleem and Abdel-Aty (2010), Haleem and Gan (2013), and Obeng and
Rokonuzzaman (2013).
The last random parameter, very young pedestrians, has a mean of -0.308 and a standard
deviation of 1.966. This corresponds to a Z-value of 0.16. From the Z-tables, approximately 56%
of the distribution is less than 0 and the remaining 44% is greater than 0. Thus, in 56% of the
pedestrian crash observations, very young pedestrians are associated with lesser probability of
severe injuries compared to other age groups.
Fixed Parameters - Environmental Factors
Two significant environmental predictors are weather and lighting conditions. Clear weather is
associated with 3% reduction in the severe injury probability compared to other weather
conditions. On the other hand, rainy weather is associated with 0.4% increase in the severe injury
probability compared to other weather conditions. This shows the adverse impact of rainy
weather on pedestrian injuries, which could mainly be due to visibility constraints.
The two lighting condition variables, dark with street light and dark with no street light, are also
significant variables. Both conditions are associated with an increase in the probability of severe
injuries compared to other lighting conditions. This shows that dark lighting conditions increase
severe injuries to pedestrians.
Fixed Parameters - Traffic Factors
Increasing the AADT at signalized locations significantly increases the probability of severe
injuries by around 16%, mainly due to the increase in vehicle-pedestrian conflicts. This result is
consistent with previous studies, e.g., Obeng and Rokonuzzaman (2013). The probability of
severe injury is increased by 2.7% during the night and dawn off-peak periods.
Fixed Parameters – Pedestrian/Driver-Related Factors
Very old pedestrians (80 years and older) are associated with 30.8% higher probability of severe
injuries compared to other age groups. This is mainly due to their weak physical conditions,
resulting in an increased probability of severe injuries. This result is consistent with the findings
of Kim et al. (2010).
66
Crashes involving at-fault pedestrians are associated with around 3.4% higher severe injury
probability compared to the crashes where drivers are at fault or both pedestrians and drivers are
at fault. This concurs with the studies by Kim et al. (2010) and Ulfarsson et al. (2010).
5.4.2 Non-signalized Locations Model
Table 5-6 gives the fitted mixed logit model for pedestrian injury severity at non-signalized
locations using 200 simulated Halton draws. The table also provides the goodness-of-fit
statistics. Similar to the signalized locations models, the fitted mixed logit model for non-
signalized locations is also considered to have a good fit as the McFadden’s Pseudo R2 of the
model is greater than 0.1.
Random Parameters
As shown in Table 5-6, the old pedestrian age and pedestrian crossing maneuver were the two
random parameters included in the model. The random parameter old pedestrian age has a mean
of 0.373 and a standard deviation of 0.995. This corresponds to a Z-value of - 0.37. From the Z-
tables, approximately 36% of the distribution is less than 0 and the remaining 64% is greater than
0. Thus, in approximately 64% of the pedestrian crash observations, older pedestrians are
associated with higher probability of severe injuries compared to other age groups. This result is
comparable to the signalized locations and is consistent with the study by Lee and Abdel-Aty
(2005).
Crashes involving pedestrians crossing the roadway are associated with higher severe injury
probabilities compared to the crashes involving pedestrians walking along the roadway. This
parameter has a mean of 0.187 and a standard deviation of 1.579, which corresponds to a Z-value
of - 0.12. From the Z-tables, approximately 45% of the distribution is less than 0 and the
remaining 55% is greater than 0.Thus, crossing the intersection maneuver is associated with
higher probability of severe injuries in 55% of the observations. This is anticipated and is mainly
due to the increased odds of pedestrian-vehicle conflicts at both unsignalized intersections and
midblocks. This result is also consistent with the finding of Sarkar et al. (2011). As it can be
inferred from Table 5-6, the crossing maneuver is associated with 1.8% higher probability of
severe injuries compared to walking along the roadway.
Fixed Parameters - Environmental and Vehicle Factors
The three lighting condition variables, daylight, dark with street light, and dark with no street
light, are significant environmental predictors. The daylight condition is associated with 2.4%
reduction in the probability of severe injuries, whereas both dark with and without street lights
are associated with an increase in the probability of severe injuries by 4.9% and 3.3%,
respectively. This result is consistent with the results at signalized locations.
Vans are associated with around 0.2% increase in the probability of severe injuries compared to
other vehicle types. A possible explanation could be that vans are relatively large vehicles and
when involved in a crash with pedestrians, regardless of who is at fault, is expected to result in
severe injuries to pedestrians. Chu (2006) also reached the same conclusion and indicated that

67
large vehicles are relatively difficult to stop and could collide at greater speeds compared to
small vehicles such as passenger cars.
Table 5-6: Mixed Logit Model Estimates at Non-signalized Locations
Variable Description
Simulated
Maximum
Likelihood
Estimate
Standard
Error P-Value
Severe
Injury
Elasticity
(%)
Random Parameters
Pedestrians Crossing Streetb 0.187
(1.579)a
0.124
(0.349)a
0.131
(0.000)a
1.822
Old Pedestriansb 0.373
(0.995)a
0.193
(0.491)a
0.053
(0.042)a
0.393
Fixed Parameters
Speed Limit on Major Road 0.039 0.006 0.000 27.725
Pedestrian Age: Very Youngb -0.475 0.177 0.007 -0.584
Middleb 0.318 0.133 0.016 3.717
Very Oldb 0.970 0.227 0.000 0.720
Pedestrian At-faultb 0.838 0.092 0.000 9.297
Van Vehicle Typeb 0.354 0.206 0.085 0.178
Lighting Condition: Dayb -0.440 0.185 0.017 -2.363
Dark with Street Lightb 0.715 0.185 0.000 4.917
Dark with No Street Lightb 0.925 0.202 0.000 3.320
Number of Observations 2,282
-1,274.00 -1,581.76 0.19
2,574.00
Log-Likelihood at Convergence
Log-Likelihood at Fitting the Intercept
McFadden’s Pseudo R2
AIC a Standard deviation. b Binary categorical variables inserted as “1” if true; “0” otherwise.
Fixed Parameters - Traffic Factors
Increasing the speed limit on major roads at non-signalized locations by one mile per hour is
associated with 27.7% higher severe injury probability. This is anticipated and was previously
concluded from the injury severity analysis at signalized locations. However, the increase in
speed limits nearby non-signalized locations poses higher pedestrian severity risk compared to
the signalized locations. This could be due to the lack of pedestrian signals and push buttons at
non-signalized locations.
Fixed Parameters – Pedestrian/Driver-Related Factors
The three age groups, very young, middle, and very old, were found to be significant predictors
in the model. As previously concluded from the model at signalized locations, very young
pedestrians are associated with lesser probability of severe injuries compared to other age
groups. On the other hand, very old pedestrians are associated with higher probability of severe
injuries, mainly due to their weak physical conditions. It is also noticed that very old pedestrians

68
experience a greater severity risk at signalized locations compared to non-signalized locations.
Additionally, similar to very old pedestrians, middle-aged pedestrians are associated with
increased severity likelihood at non-signalized locations.
When pedestrians are at fault, these crashes are associated with 9.3% higher severe injury
probability compared to where drivers are at fault or both pedestrians and drivers are at fault.
This concurs with the result from the analysis at signalized locations. However, when pedestrians
are at-fault, they are more vulnerable of severe injuries at non-signalized locations compared to
signalized locations.
5.5 Summary
This chapter identified the geometric, traffic, road user, environmental, and vehicle predictors of
pedestrian injury severity at both signalized and non-signalized locations in Florida using the
mixed logit model. The analysis was based on 4,923 pedestrian crashes that occurred on state
roads during 2008-2010. The following relatively new injury severity predictors were identified
from the detailed review of police reports and were considered in the analysis: at-fault road user,
pedestrian maneuver before crash, presence of pedestrian refuge area, type of crosswalk, and
presence of pedestrian signals. The random forest technique was first used to rank the
importance of independent variables at each location, and ten variables were common important
severity predictors at both locations. These variables were: percentage of trucks, natural
logarithm of AADT, crosswalk type, lighting condition, pedestrian age, speed limit, hour of
crash, at-fault road user, vehicle type, and weather condition.
The results from the mixed logit models showed that:
Crashes where pedestrians were at fault were more likely to result in severe injuries
compared to the crashes where drivers were at fault or both pedestrians and drivers were
at fault at both signalized and non-signalized locations.
Crashes involving at-fault pedestrians resulted in a greater probability of severe injuries
at non-signalized locations compared to signalized locations.
Very young pedestrians were associated with lower probability of severe injuries at both
signalized and non-signalized locations.
Very old pedestrians were associated with higher probability of severe injuries at both
signalized and non-signalized locations.
Very old pedestrians have a greater severity risk at signalized locations compared to non-
signalized locations.
At signalized locations, rainy weather was associated with a slight increase in the
probability of severe injuries compared to other weather conditions.
Dark conditions, with and without street light, were associated with an increase in the
probability of severe injuries at both signalized and non-signalized locations.
At non-signalized locations, vans were found to be associated with an increase in the
probability of severe injuries compared to other vehicle types.
Increasing the speed limit at signalized and non-signalized locations was associated with
higher severe injury probability.

69
The increase in speed limit at non-signalized locations posed greater pedestrian severity
risk compared to signalized locations.
At non-signalized locations, pedestrians crossing the roadway were associated with
higher probability of severe injuries compared to pedestrians walking along the roadway.
At signalized locations, increasing the AADT and the percentage of trucks significantly
increased the probability of severe pedestrian injuries.
At signalized locations, the probability of severe pedestrian injuries was higher during the
night and dawn off-peak periods.
The analysis results could help recommend appropriate countermeasures to reduce the severity of
pedestrian crashes. For example, since crashes where pedestrians were at fault were found to
result in an increased probability of severe pedestrian injuries, it is recommended to conduct
safety awareness and education campaigns targeting pedestrians on the laws and pedestrian
rights-of-way at both signalized and non-signalized locations. Since very old pedestrians were
associated with a greater probability of severe injuries at both signalized and non-signalized
locations, older population could be one of the main target age groups in the education programs.
Stricter enforcement of speeding and driver compliance with pedestrian right-of-way laws could
also improve pedestrian safety. These campaigns should be organized through the coordination
of law enforcement officers, safety engineers, and the public to integrate the components of the
four E’s: engineering, education, enforcement, and emergency response. It is also recommended
to improve lighting in the vicinity of signalized and non-signalized locations to reduce severe
pedestrian injuries at night and early morning.
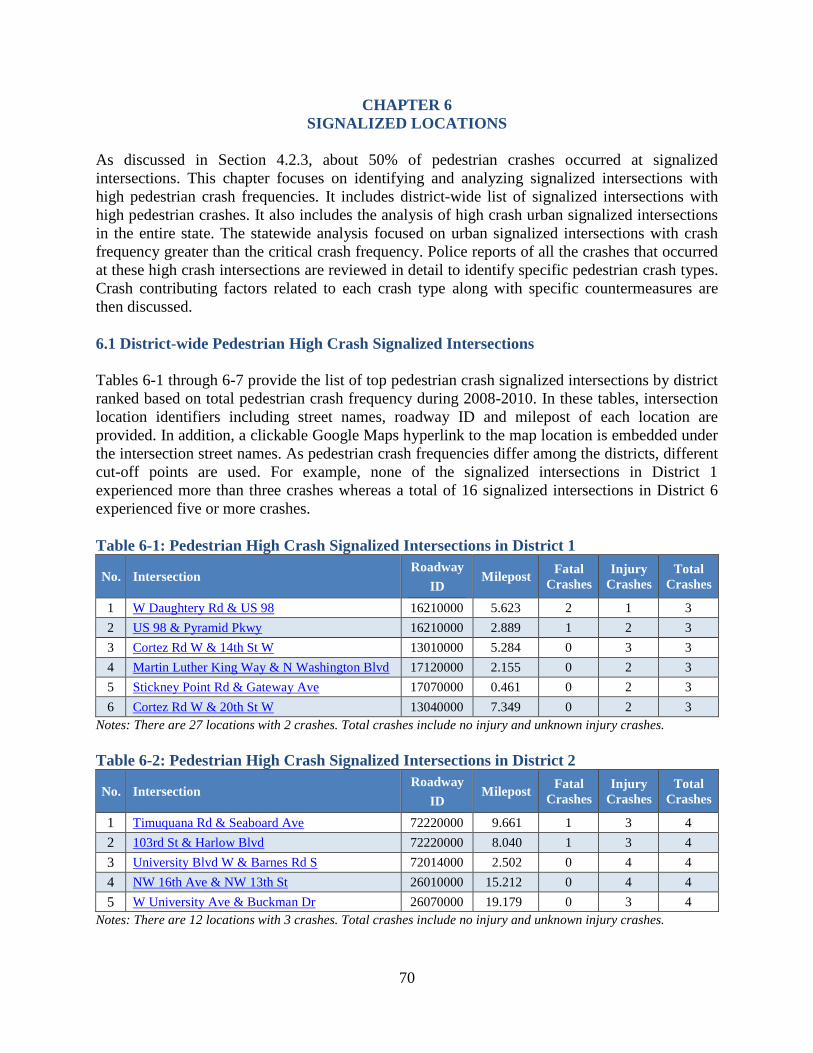
70
CHAPTER 6
SIGNALIZED LOCATIONS
As discussed in Section 4.2.3, about 50% of pedestrian crashes occurred at signalized
intersections. This chapter focuses on identifying and analyzing signalized intersections with
high pedestrian crash frequencies. It includes district-wide list of signalized intersections with
high pedestrian crashes. It also includes the analysis of high crash urban signalized intersections
in the entire state. The statewide analysis focused on urban signalized intersections with crash
frequency greater than the critical crash frequency. Police reports of all the crashes that occurred
at these high crash intersections are reviewed in detail to identify specific pedestrian crash types.
Crash contributing factors related to each crash type along with specific countermeasures are
then discussed.
6.1 District-wide Pedestrian High Crash Signalized Intersections
Tables 6-1 through 6-7 provide the list of top pedestrian crash signalized intersections by district
ranked based on total pedestrian crash frequency during 2008-2010. In these tables, intersection
location identifiers including street names, roadway ID and milepost of each location are
provided. In addition, a clickable Google Maps hyperlink to the map location is embedded under
the intersection street names. As pedestrian crash frequencies differ among the districts, different
cut-off points are used. For example, none of the signalized intersections in District 1
experienced more than three crashes whereas a total of 16 signalized intersections in District 6
experienced five or more crashes.
Table 6-1: Pedestrian High Crash Signalized Intersections in District 1
No. Intersection Roadway
ID Milepost
Fatal
Crashes
Injury
Crashes
Total
Crashes
1 W Daughtery Rd & US 98 16210000 5.623 2 1 3
2 US 98 & Pyramid Pkwy 16210000 2.889 1 2 3
3 Cortez Rd W & 14th St W 13010000 5.284 0 3 3
4 Martin Luther King Way & N Washington Blvd 17120000 2.155 0 2 3
5 Stickney Point Rd & Gateway Ave 17070000 0.461 0 2 3
6 Cortez Rd W & 20th St W 13040000 7.349 0 2 3
Notes: There are 27 locations with 2 crashes. Total crashes include no injury and unknown injury crashes.
Table 6-2: Pedestrian High Crash Signalized Intersections in District 2
No. Intersection Roadway
ID Milepost
Fatal
Crashes
Injury
Crashes
Total
Crashes
1 Timuquana Rd & Seaboard Ave 72220000 9.661 1 3 4
2 103rd St & Harlow Blvd 72220000 8.040 1 3 4
3 University Blvd W & Barnes Rd S 72014000 2.502 0 4 4
4 NW 16th Ave & NW 13th St 26010000 15.212 0 4 4
5 W University Ave & Buckman Dr 26070000 19.179 0 3 4
Notes: There are 12 locations with 3 crashes. Total crashes include no injury and unknown injury crashes.

71
Table 6-3: Pedestrian High Crash Signalized Intersections in District 3
No. Intersection Roadway
ID Milepost
Fatal
Crashes
Injury
Crashes
Total
Crashes
1 W Tennessee St & Basin St 55060000 6.832 0 5 5
2 W Tennessee St & N Ocala Rd 55060000 6.202 0 5 5
3 Mobile Hwy & Massachusetts Ave 48020000 9.974 0 3 4
4 N Fairfield Dr & N Pace Blvd 48050000 22.722 1 2 3
5 Mobile Hwy & N Fairfield Dr 48020000 11.095 0 4 4
6 W Tennessee St & N Copeland St 55060000 7.848 0 3 3
7 W Tennessee St & Dewey St 55060000 7.661 0 3 3
8 W Tennessee St & N Woodward Ave 55060000 7.391 0 3 3
9 Front Beach Rd & Hills Rd 46010000 9.117 0 3 3
Notes: There are 23 locations with 2 crashes. Total crashes include no injury and unknown injury crashes.
Table 6-4: Pedestrian High Crash Signalized Intersections in District 4
No. Intersection Roadway
ID Milepost
Fatal
Crashes
Injury
Crashes
Total
Crashes
1 E Oakland Park Blvd & N Andrews Ave 86090000 6.858 0 11 11
2 NW 50th St & SR 7 86014000 3.220 1 6 8
3 W Oakland Park Blvd & SR 7 86090000 3.323 0 7 7
4 W Sunrise Blvd & NW 7th Ave 86110000 7.247 0 7 7
5 W Broward Blvd & NW 31st Ave 86006000 4.120 1 5 6
6 10th Ave N & S Congress Ave 93006000 2.847 1 5 6
7 E Oakland Park Blvd & NE 6th Ave 86090000 7.356 1 5 6
8 Sheridan St & SR 7 86100000 4.091 1 4 5
9 NW 41st St & SR 7 86100000 14.079 1 4 5
10 W Atlantic Blvd & SR 845 86130000 3.788 1 4 5
11 Griffin Rd & SR 7 86100000 6.226 1 3 5
12 W Oakland Park Blvd & N University Dr 86220000 13.640 0 5 5
13 W Broward Blvd & NW 1st Ave 86006000 6.706 0 4 5
14 W Broward Ave & N Andrews Ave 86006000 6.773 0 4 5
Notes: There are 12 locations with 4 crashes. Total crashes include no injury and unknown injury crashes.
Table 6-5: Pedestrian High Crash Signalized Intersections in District 5
No. Intersection Roadway
ID Milepost
Fatal
Crashes
Injury
Crashes
Total
Crashes
1 Silver Star Rd & N Pine Hills Rd 75250000 6.304 0 7 8
2 Silver Star Rd & N Hiawassee Rd 75250000 4.812 2 4 7
3 Old Cheney Hwy & N Semoran Blvd 75003000 7.611 2 3 6
4 US 192 & N John Young Pkwy 92090000 14.635 0 6 6
5 Mason Ave & N Ridgewood Ave 79030000 1.192 0 5 5
6 Lokanotosa Trail & N Alafaya Trail 75037000 1.128 1 3 4
7 N Atlantic Ave & St Lucie Ln 70060000 35.837 0 4 4
8 SR 436 & Oxford Rd 77080000 7.718 0 4 4
9 E Colonial Dr & N Bumby Ave 75060000 2.653 0 3 4
Notes: There are 16 locations with 3 crashes. Total crashes include no injury and unknown injury crashes.

72
Table 6-6: Pedestrian High Crash Signalized Intersections in District 6
No. Intersection Roadway
ID Milepost
Fatal
Crashes
Injury
Crashes
Total
Crashes
1 NE 167th St & NE 6th Ave 87170000 1.477 0 7 7
2 Miami Gardens Dr & NW 27th Ave 87019000 2.740 0 6 7
3 NW 95th St & NW 7th Ave 87140000 6.666 0 6 7
4 S Dixie Highway & Caribbean Blvd 87020000 12.383 0 6 7
5 NW 54th St & NW 7th Ave 87140000 4.126 1 4 6
6 174th St & Collins Ave 87060000 15.142 0 6 6
7 NW 79th St & NW 7th Ave 87080900 38.493 0 5 6
8 NE 35th Terrace & Biscayne Blvd 87030000 13.480 0 3 6
9 NW 27th Ave & NW 54th St 87240000 5.787 0 4 5
10 NE 79th St & N Miami Ave 87080900 39.257 1 3 5
11 NE 163rd St & NE 12th Ave 87170000 2.306 0 5 5
12 S Dixie Hwy & SW 27th Ave 87030000 6.518 0 5 5
13 NW 14th St & NW 12th Ave 87085000 2.504 0 5 5
14 NW 79th St & NW 27th Ave 87240000 7.310 0 4 5
15 NE 125th St & NE 6th Ave 87066000 1.520 0 4 5
16 NE 135th St & NE 6th Ave 87008000 8.648 0 3 5
Notes: There are 19 locations with 4 crashes. Total crashes include no injury and unknown injury crashes.
Table 6-7: Pedestrian High Crash Signalized Intersections in District 7
No. Intersection Roadway
ID Milepost
Fatal
Crashes
Injury
Crashes
Total
Crashes
1 W Waters Ave & N Florida Ave 10020000 5.362 0 8 8
2 E Fowler Ave & N 15th St 10290000 1.013 0 7 7
3 Ulmerton Ave & 66th St N 15061000 6.447 0 2 5
4 38th Ave N & 4th St N 15090000 2.903 0 5 5
5 Gulf to Bay Blvd & Belcher Rd S 15040000 3.441 0 5 5
6 SR 600 & N 40th St 10005000 2.845 0 5 5
7 W Hillsborough Ave & Hanley Rd 10150000 6.049 0 2 5
8 Trouble Creek Rd & US 19 14030000 3.593 0 5 5
9 E Fletcher Ave & N Florida Ave 10020000 8.388 1 3 4
10 SR 54 and & Rowan Rd 14570000 2.720 0 4 4
11 E Hillsborough Ave & N 22nd St 10030000 0.999 0 3 4
12 Sunset Dr S & Pasadena Ave S 15110000 1.536 0 4 4
13 5th Ave N & 34th St N 15010000 2.502 0 4 4
14 62nd Ave N & 34th St N 15150000 8.398 0 3 4
Notes: There are 26 locations with 3 crashes. Total crashes include no injury and unknown injury crashes.
6.2 Statewide Pedestrian High Crash Signalized Intersections
In this section, the overall top high crash intersections statewide were further identified based on
critical pedestrian crash frequency for detailed analysis.

73
6.2.1 Location Identification
Urban signalized intersections with observed pedestrian crash frequency greater than three
standard deviations from the average crash frequency were identified and analyzed. Overall,
1,962 urban signalized intersections experienced at least one pedestrian crash from 2008-2010.
Over two-thirds of these intersections (i.e., 1,340) experienced one pedestrian crash during the
analysis period. These 1,340 signalized intersections were excluded from the analysis as one
crash is considered to be a random occurrence. A total of 622 urban signalized intersections that
experienced two or more pedestrian crashes during the three-year analysis period were analyzed.
During 2008-2010, these intersections experienced an average of 2.66 pedestrian crashes, with a
standard deviation (σ) of 1.16 pedestrian crashes. Note that the standard deviation (σ) is
calculated using the following equations:
σ = √1
N ∑(xi − µ)2
N
i=1
; µ = 1
N∑ xi
N
i=1
where,
σ = standard deviation,
N = total number of urban signalized intersections that experienced more than one
pedestrian crash during the analysis period,
xi = crash frequency at intersection i, and
µ = average crash frequency at the urban signalized intersections.
A total of 21 signalized intersections experienced ≥ 6 crashes (i.e., crash frequency > µ+3σ)
during 2008-2010. Table 6-8 lists these 21 urban signalized intersections.
(6-1)

74
Table 6-8: Statewide Pedestrian High Crash Urban Signalized Intersections
No. Intersection District Roadway
ID Milepost
Fatal
Crashes
Injury
Crashes
Total
Crashes
1 E Oakland Park Blvd & N Andrews Ave 4 86090000 6.858 0 11 11
2 Silver Star Rd & N Pine Hills Rd 5 75250000 6.304 0 7 8
3 NW 50th St & SR 7 4 86014000 3.220 1 6 8
4 W Waters Ave & N Florida Ave 7 10020000 5.362 0 8 8
5 Silver Star Rd & N Hiawassee Rd 5 75250000 4.812 2 4 7
6 E Fowler Ave & N 15th St 7 10290000 1.013 0 7 7
7 NW 95th St & NW 7th Ave 6 87140000 6.666 0 6 7
8 S Dixie Highway & Caribbean Blvd 6 87020000 12.383 0 6 7
9 Miami Gardens Dr & NW 27th Ave 6 87019000 2.740 0 6 7
10 W Sunrise Blvd & NW 7th Ave 4 86110000 7.247 0 7 7
11 W Oakland Park Blvd & SR 7 4 86090000 3.323 0 7 7
12 NE 167th St & NE 6th Ave 6 87170000 1.477 0 7 7
13 NE 35th Terrace & Biscayne Blvd 6 87030000 13.480 0 3 6
14 NW 54th St & NW 7th Ave 6 87140000 4.126 1 4 6
15 NW 79th St & NW 7th Ave 6 87080900 38.493 0 5 6
16 Old Cheney Hwy & N Semoran Blvd 5 75003000 7.611 2 3 6
17 E Oakland Park Blvd & NE 6th Ave 4 86090000 7.356 1 5 6
18 10th Ave N & S Congress Ave 4 93006000 2.847 1 5 6
19 174th St & Collins Ave 6 87060000 15.142 0 6 6
20 W Broward Blvd & NW 31st Ave 4 86006000 4.120 1 5 6
21 US 192 & N John Young Pkwy 5 92090000 14.635 0 6 6
Note: Total crashes include crashes with no injury and unknown injury.
6.2.2 Condition-collision Diagrams
Figures 6-1 through 6-21 plot the “condition-collision” diagrams of the 21 high crash urban
signalized intersections. In these diagrams, the locations of all pedestrian crashes were plotted on
the satellite images. The figures also provide additional information on the injury severity of the
pedestrian using the following codes:
red – fatal
yellow – injury
green – no injury to pedestrian
blue – unknown injury to pedestrian

75
Figure 6-1: E Oakland Park Blvd and N Andrews Ave (Roadway ID 86090000; MP 6.858)
(Map)
Figure 6-2: Silver Star Rd and N Pine Hills Rd (Roadway ID 75250000; MP 6.304) (Map)

76
Figure 6-3: SR 7 and NW 50th St (Roadway ID 86014000; MP 3.220) (Map)
Figure 6-4: W Waters Ave and N Florida Ave (Roadway ID 10020000; MP 5.362) (Map)
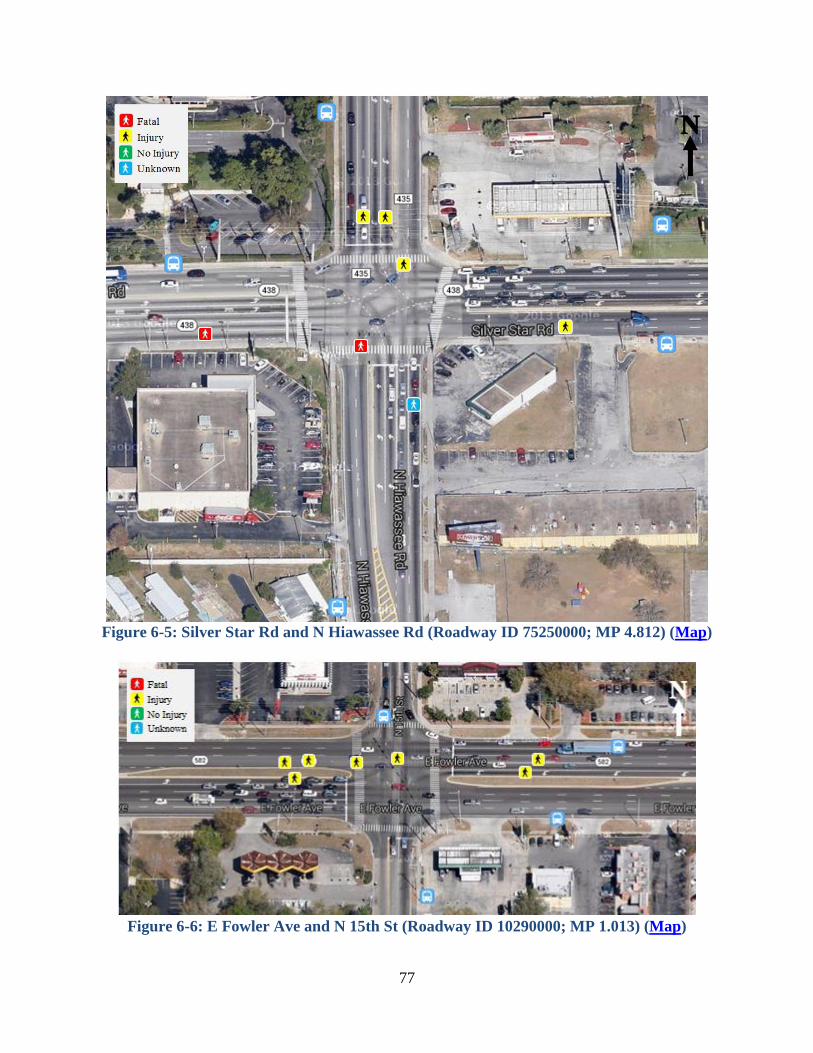
77
Figure 6-5: Silver Star Rd and N Hiawassee Rd (Roadway ID 75250000; MP 4.812) (Map)
Figure 6-6: E Fowler Ave and N 15th St (Roadway ID 10290000; MP 1.013) (Map)
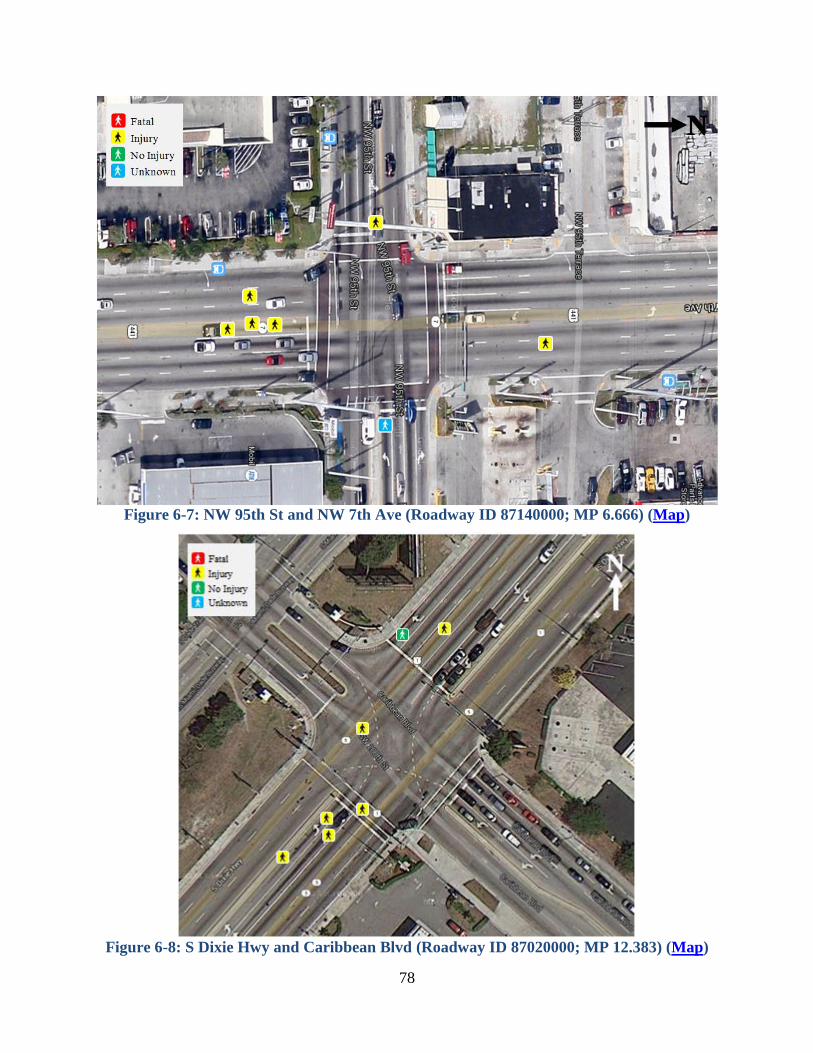
78
Figure 6-7: NW 95th St and NW 7th Ave (Roadway ID 87140000; MP 6.666) (Map)
Figure 6-8: S Dixie Hwy and Caribbean Blvd (Roadway ID 87020000; MP 12.383) (Map)

79
Figure 6-9: NW 27th St and NW 183rd St (Roadway ID 87019000; MP 2.74) (Map)
Figure 6-10: W Sunrise Blvd and NW 7th Ave (Roadway ID 86110000; MP 7.247) (Map)

80
Figure 6-11: W Oakland Park Blvd and SR 7 (Roadway ID 86090000; MP 3.323) (Map)
Figure 6-12: NE 167th St and NE 6th Ave (Roadway ID 87170000; MP 1.477) (Map)

81
Figure 6-13: NE 36th St and Biscayne Blvd (Roadway ID 87030000; MP 13.48) (Map)
Figure 6-14: NW 7th Ave and NW 54th St (Roadway ID 87140000; MP 4.126) (Map)

82
Figure 6-15: NW 79th St and NW 7th Ave (Roadway ID 87080900; MP 38.493) (Map)
Figure 6-16: N Semoral Blvd and Old Cheney Hwy (Roadway ID 75003000; MP 7.611)
(Map)

83
Figure 6-17: E Oakland Park Blvd and NE 6th Ave(Roadway ID 86090000; MP 7.356)
(Map)
Figure 6-18: 10th Ave N and S Congress Ave (Roadway ID 93006000; MP 2.847) (Map)

84
Figure 6-19: Collins Ave and 174th St (Roadway ID 87060000; MP 15.142) (Map)
Figure 6-20: W Broward Blvd and NW 31st Ave (Roadway ID 86006000; MP 4.12) (Map)

85
Figure 6-21: US 192 and N John Young Pkwy (Roadway ID 92090000; MP 14.635) (Map)
6.2.3 Crash Contributing Factors and Potential Countermeasures
This section focuses on reviewing the police reports of pedestrian crashes to identify factors that
adversely affect the safety of pedestrians at signalized intersections. The 21 high crash urban
signalized intersections experienced a total of 153 pedestrian crashes during 2008-2010. The
illustrative sketches and descriptions in the police reports of these 153 crashes were reviewed
and the crash contributing factors related to each of the following six types of crashes were
analyzed:
1. Crashes that involved right-turning vehicles.
2. Crashes that involved left-turning vehicles.
3. Crashes that occurred in the vicinity of bus stops.
4. Crashes that involved pedestrians who were not crossing at designated crossing locations.
5. Crashes that occurred in left-turning lanes and right-most lanes.
6. Crashes that involved pedestrians in a crosswalk and through traffic.
Crashes That Involved Right-turning Vehicles
Although the law requires right-turning traffic to come to a full stop and yield to side-street
traffic and pedestrians prior to turning right on red, motorists do not comply with these
regulations. For example, two pedestrian crashes involving right-turning vehicles occurred on the
south leg of the intersection shown in Figure 6-10. Figure 6-22 gives an example of a pedestrian

86
crash involving a right-turning vehicle. In such scenarios, prohibiting right turns on red could be
an easy strategy to minimize pedestrian conflicts involving right-turning vehicles.
Figure 6-22: Pedestrian Crash Involving Right-turning Vehicle (Crash ID: 819722650)
At intersections with high right-turning traffic and pedestrian volumes, a leading pedestrian
interval (LPI) could improve pedestrian safety. The LPI, also known as “Pedestrian Head Start”
or “Delayed Vehicle Green” provides the “Walk” signal for additional 3-5 seconds before the
adjacent through movement phase. This strategy gives pedestrians a head start while crossing the
intersection, reducing conflicts between pedestrians in the crosswalk and the right-turning
vehicles. It also makes the pedestrians more visible (Cheng, 2012). Figure 6-23 gives the ring-
barrier diagram with LPI signal phase. Figure 6-24 illustrates the LPI signal.
Figure 6-23: Ring-Barrier Diagram with a Leading Pedestrian Interval
(Koonce et al., 2008)

87
(a) Start of the LPI (b) Four seconds later of the LPI
Figure 6-24: An Illustrative Example of Leading Pedestrian Interval (Cheng, 2012)
Crashes That Involved Left-turning Vehicles
At signalized intersections with permissive or protected-permissive left-turn phase, the left-
turning traffic has to yield to pedestrians and opposing through traffic prior to accepting the gap
and completing the turn. In such scenarios, the left-turning vehicles sometimes fail to yield to
pedestrians crossing the street. Figure 6-25 shows the vehicle-vehicle and vehicle-pedestrian
conflict areas involving left-turning vehicles at signalized intersections. Figure 6-26 gives an
example of a crash where a pedestrian in a crosswalk was hit by a left-turning vehicle.
Figure 6-25: Intersection Conflict Areas of Left-turning Traffic
(Bonneson et al., 2011)
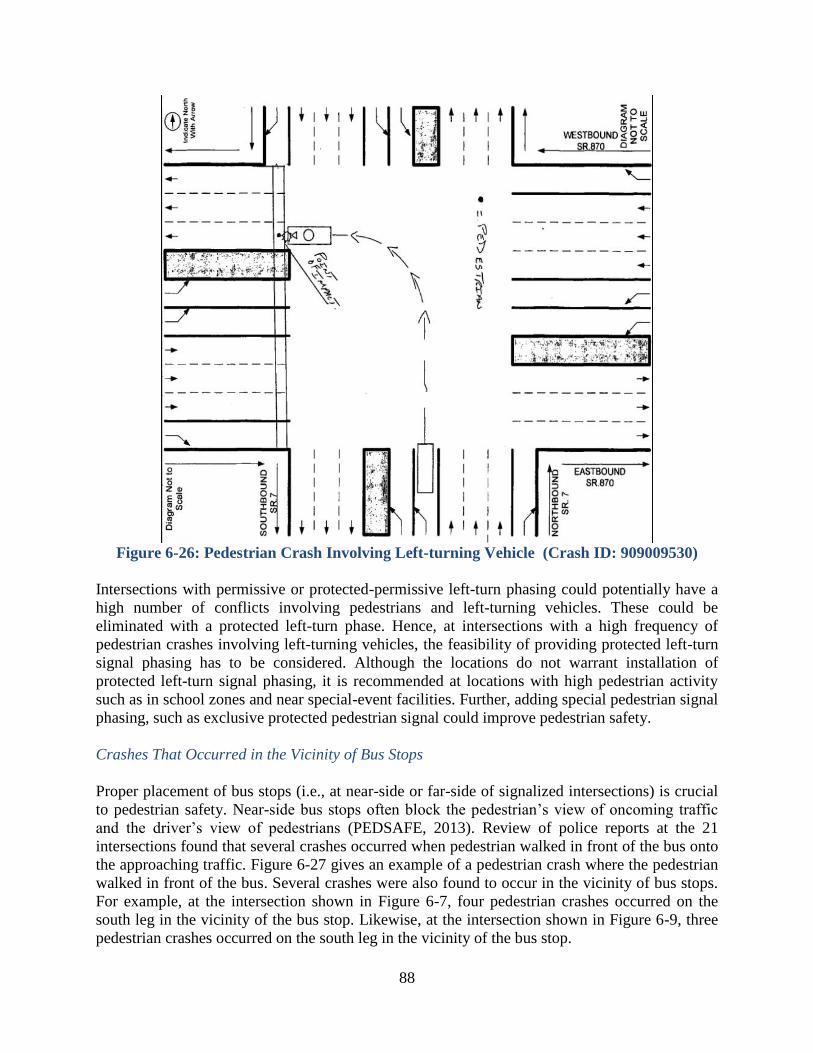
88
Figure 6-26: Pedestrian Crash Involving Left-turning Vehicle (Crash ID: 909009530)
Intersections with permissive or protected-permissive left-turn phasing could potentially have a
high number of conflicts involving pedestrians and left-turning vehicles. These could be
eliminated with a protected left-turn phase. Hence, at intersections with a high frequency of
pedestrian crashes involving left-turning vehicles, the feasibility of providing protected left-turn
signal phasing has to be considered. Although the locations do not warrant installation of
protected left-turn signal phasing, it is recommended at locations with high pedestrian activity
such as in school zones and near special-event facilities. Further, adding special pedestrian signal
phasing, such as exclusive protected pedestrian signal could improve pedestrian safety.
Crashes That Occurred in the Vicinity of Bus Stops
Proper placement of bus stops (i.e., at near-side or far-side of signalized intersections) is crucial
to pedestrian safety. Near-side bus stops often block the pedestrian’s view of oncoming traffic
and the driver’s view of pedestrians (PEDSAFE, 2013). Review of police reports at the 21
intersections found that several crashes occurred when pedestrian walked in front of the bus onto
the approaching traffic. Figure 6-27 gives an example of a pedestrian crash where the pedestrian
walked in front of the bus. Several crashes were also found to occur in the vicinity of bus stops.
For example, at the intersection shown in Figure 6-7, four pedestrian crashes occurred on the
south leg in the vicinity of the bus stop. Likewise, at the intersection shown in Figure 6-9, three
pedestrian crashes occurred on the south leg in the vicinity of the bus stop.

89
Figure 6-27: Crash That Involved Pedestrian Walking In front of a Bus
(Crash ID: 761813570)
These types of pedestrian crashes could be prevented by improving roadway lighting and
providing curb extensions in the vicinity of bus stops. Furthermore, since far-side bus stops
generally encourage pedestrians to cross behind the bus, restrictions on sight-distance are
eliminated, improving pedestrian safety. Therefore, the feasibility of relocating near-side bus
stops to the far-side of the intersection has to be studied. Furthermore, signs to warn drivers of
increased pedestrian activity near bus stops could make the drivers more attentive, and improve
pedestrian safety.
Crashes That Involved Pedestrians Who Were Not Crossing at Designated Crossing Locations
Although 20 of the 21 intersections have crosswalks on their approaches, it was found that 80%
of the 145 pedestrian crashes occurred while the pedestrian was not in the crosswalk. For
example, the two signalized intersections shown in Figures 6-14 and 6-15 have a solid crosswalk
with special surface on all of their approaches. These two intersections experienced a total of
twelve pedestrian crashes, none of which occurred while pedestrians were walking in the
crosswalk. Figure 6-28 gives a specific example of a pedestrian crash when the pedestrian was
not using the crosswalk when hit by the vehicle. From the figure, it is clear that a standard
crosswalk is present within a few feet from the pedestrian crossing location. Such crashes could
have been prevented if the pedestrians were using the designated crossing locations, i.e.,
crosswalks. This behavior could be due to the lack of pedestrian education and enforcement.
Pedestrians are often ignorant of the rules and right-of-way at pedestrian-vehicle conflict points.
Further, stricter and consistent enforcement could change the pedestrian behavior.

90
Figure 6-28: Crash Where Pedestrian Was Not Using a Crosswalk Although a Crosswalk Is
in the Vicinity (Crash ID: 906723850)
Crashes That Occurred in Left-turning Lanes and Right-most Lanes
From reviewing the police reports, it was observed that several crashes occurred when
pedestrians were crossing multiple lanes. For example, the intersection shown in Figure 6-16
experienced two fatal pedestrian crashes that occurred on the right-most and left-turning lanes on
the south leg with no raised median. Figures 6-29 and 6-30 give examples of pedestrian crashes
that occurred on the right-most and left-turning lanes, respectively. In these two crashes
pedestrians were struck while crossing the fifth lane. At locations where pedestrians are expected
to cross multi-lane roads with high travel speeds and heavy traffic, the following
countermeasures could be effective in reducing pedestrian crash frequency and severity
(PEDSAFE, 2013):
ensure curb ramps are provided to make crossing easier for all pedestrians,
install lighting along the corridor,
require pedestrians to cross the roadway at designated crossing locations such as
crosswalks,
install traffic calming measures, such as providing speed bumps, lane narrowing, etc., and
install raised medians.

91
Figure 6-29: Pedestrian Crash That Occurred in the Right-most Lane
(Crash ID: 774261190)
Figure 6-30: Pedestrian Crash That Occurred in the Left-most Lane
(Crash ID: 902134760)

92
Although providing pedestrian refuge areas is often considered an effective countermeasure to
improve the safety of pedestrians while crossing busy streets, police reports of some of the
pedestrian crashes found that pedestrians sometimes do not stop at the median and continue to
cross multiple lanes. For example, Figure 6-31 gives the description and illustrative sketch of a
crash when a pedestrian was struck in the left-most lane. From the description in Figure 6-31(b),
it is clear that the pedestrian did not use the median to stop and wait prior to crossing the west
bound lanes. Therefore, agency-wide pedestrian education focusing on pedestrian right-of-way,
the safety benefits of using crosswalks and pedestrian refuge areas, etc. could be beneficial.
(a) Illustrative Sketch from the Police report
(a) Crash Description from the Police report
Figure 6-31: Pedestrian Crash Where Median Was Not Used as a Refuge Area
(Crash ID: 776997890)
Crashes That Involved Pedestrians in a Crosswalk and Through Traffic
Through traffic is required to stop for pedestrians in crosswalks. Although vehicles in one lane
often stop for pedestrians, the drivers in the other lanes sometimes do not see the pedestrians in
crosswalks and do not stop, resulting in potential vehicle-pedestrian conflicts. Figure 6-32
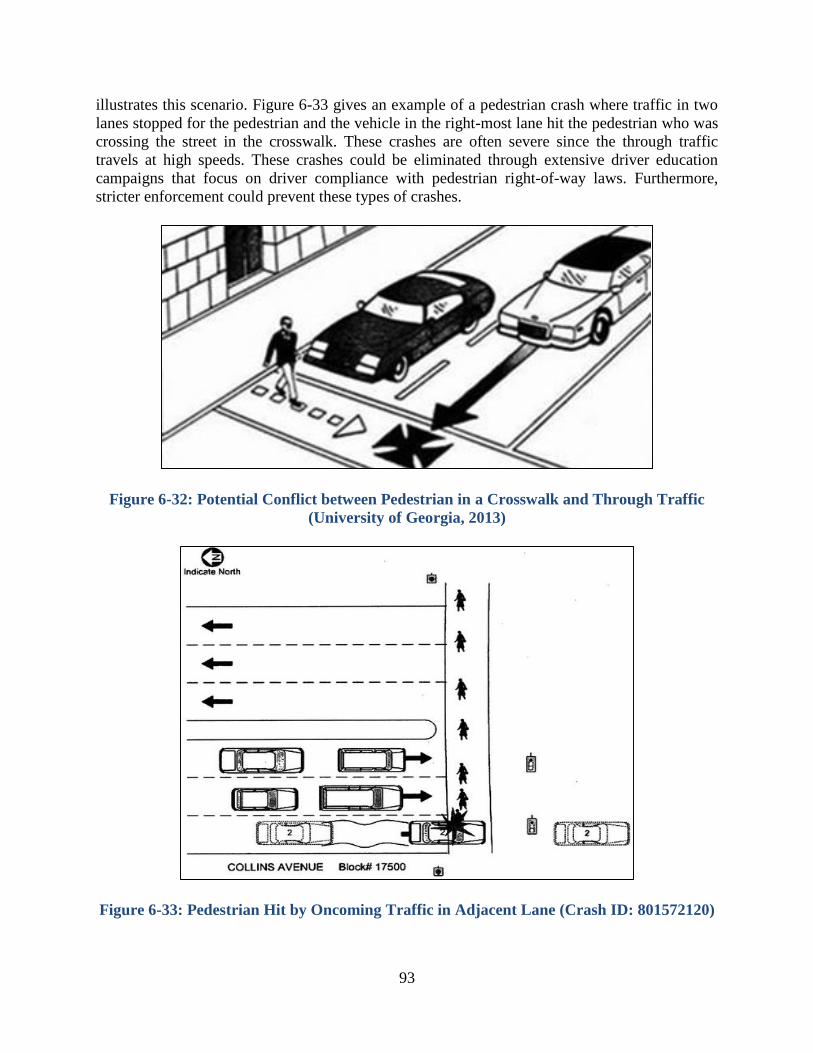
93
illustrates this scenario. Figure 6-33 gives an example of a pedestrian crash where traffic in two
lanes stopped for the pedestrian and the vehicle in the right-most lane hit the pedestrian who was
crossing the street in the crosswalk. These crashes are often severe since the through traffic
travels at high speeds. These crashes could be eliminated through extensive driver education
campaigns that focus on driver compliance with pedestrian right-of-way laws. Furthermore,
stricter enforcement could prevent these types of crashes.
Figure 6-32: Potential Conflict between Pedestrian in a Crosswalk and Through Traffic
(University of Georgia, 2013)
Figure 6-33: Pedestrian Hit by Oncoming Traffic in Adjacent Lane (Crash ID: 801572120)

94
6.3 Summary
This chapter focused on identifying and analyzing urban signalized intersections with high
pedestrian crash frequencies. Urban signalized intersections with observed pedestrian crash
frequency greater than three standard deviations from the average crash frequency were
identified and analyzed. A total of 21 signalized intersections with ≥ 6 pedestrian crashes during
2008-2010 were included in the analysis. Police reports of all the crashes that occurred at these
high crash intersections were reviewed and the crash contributing factors related to each of the
following six types of crashes were analyzed:
1. Crashes that involved right-turning vehicles.
2. Crashes that involved left-turning vehicles.
3. Crashes that occurred in the vicinity of bus stops.
4. Crashes that involved pedestrians who were not crossing at designated crossing locations.
5. Crashes that occurred in left-turning lanes and right-most lanes.
6. Crashes that involved pedestrians in a crosswalk and through traffic.
At locations where pedestrians are expected to cross multi-lane roads with high travel speeds and
heavy traffic, the following countermeasures could be effective in reducing pedestrian crash
frequency and severity (PEDSAFE, 2013):
ensure curb ramps are provided to make crossing easier for all pedestrians,
install lighting along the corridor,
require pedestrians to cross the roadway at designated crossing locations such as
crosswalks,
install traffic calming measures, such as providing speed bumps, lane narrowing, etc., and
install raised medians.
Several pedestrian crashes at signalized intersections involved left-turning and right-turning
vehicles. Turning vehicles often hit pedestrians in crosswalk and when pedestrians have the
right-of-way. These types of crashes could be prevented by eliminating the potential vehicle-
pedestrian conflicts. At locations with high pedestrian volumes, prohibiting right turns on red
could be an easy strategy to minimize pedestrian conflicts involving right-turning vehicles.
Additionally, providing a leading pedestrian interval (LPI) that gives pedestrians a head start
while crossing the intersection could improve pedestrian safety. Pedestrian crashes involving
left-turning vehicles could be reduced by providing either a protected left-turn phase or an
exclusive protected pedestrian signal.
Several pedestrian crashes occurred when the pedestrians walked in front of the bus onto the
approaching traffic. These types of pedestrian crashes could be prevented by improving roadway
lighting and providing curb extensions in the vicinity of bus stops. Furthermore, relocating near-
side bus stops to the far-side of the intersection could eliminate sight-distance restrictions,
improving pedestrian safety.
About 80% of the 145 pedestrian crashes that occurred at the 21 signalized intersections occurred
while the pedestrian was not in the crosswalk. However, it is to be noted that 20 of these 21

95
intersections have crosswalks on their approaches. Several of these crashes could have been
prevented if the pedestrians were walking in the crosswalks. This behavior could be due to the
lack of pedestrian education and enforcement. Agency-wide education campaigns on the laws
pertaining to pedestrians and the safety benefits of using pedestrian facilities such as crosswalks,
sidewalks, and pedestrian refuge islands could improve pedestrian safety. Furthermore, extensive
driver education campaigns that focus on driver compliance with pedestrian right-of-way laws
and stricter enforcement could prevent the crashes that were due to driver error.

96
CHAPTER 7
NON-SIGNALIZED LOCATIONS
This chapter focuses on identifying and analyzing non-signalized locations with high pedestrian
crash frequencies. It provides the district-wide list of pedestrian high crash non-signalized
locations. It includes the analysis of high crash non-signalized locations in the entire state. The
statewide analysis focused on locations with pedestrian crash frequency greater than the critical
crash frequency. Police reports of all the crashes that occurred at these high crash non-signalized
locations are reviewed in detail to identify specific pedestrian crash types. Crash contributing
factors related to each crash type along with specific countermeasures are then discussed.
7.1 District-wide Pedestrian High Crash Non-signalized Locations
As identified in Section 4.2.3, a total of 2,945 pedestrian crashes were found to occur at non-
signalized locations, which include both non-signalized intersections and midblock sections.
ArcGIS 10.0 was used to identify the high crash non-signalized locations. The 2,945 pedestrian
crashes that occurred at non-signalized locations during 2008-2010 were first imported into
ArcGIS 10.0 and were spatially located along the State Roads Layer using Linear Referencing
Tool. A 150-ft buffer was then generated around each crash. Locations with higher
concentrations of pedestrian crashes were identified by dissolving the overlapping buffers. For
example, if two crashes were within 150 ft of each other, their buffers (which overlap) were
dissolved to create a larger buffer. Information on the roadway ID and begin and end milepost of
each of the dissolved buffer was then retrieved. Also, the total number of crashes in each
dissolved buffer was retrieved. These dissolved buffers are considered as non-signalized
locations with at least one pedestrian crash, and are used in the analysis. Table 7-1 provides the
list of pedestrian high crash non-signalized locations by district ranked based on total pedestrian
crash frequency during 2008-2010.
Table 7-1: Pedestrian High Crash Non-signalized Locations in Each District
No. Roadway Name Roadway
ID Milepost
Fatal
Crashes
Injury
Crashes Total
Crashes
District 1
1 14th St W near 27th Ave W, Bradenton 13010000 6.233 2 2 4
2 14th St W near 66th Ave, Bradenton 13010000 2.688 1 2 3
3 N Tamiami Trail near Crescent Lake Dr, North
Fort Myres
12001000 2.237 1 2 3
4 N Washington Blvd near 5th St, Sarasota 17120000 0.852 1 1 3
5 N Combee Rd near Tanglewood St, Lakeland 16006000 3.586 0 3 3
6 14th St W near 56th Ave, Bradenton 13010000 3.876 0 3 3
District 2
1 3rd St N near 2nd Ave N, Jacksonville Beach 72100000 17.909 0 4 4
District 3
1 Gulf Bch Hwy near Colbert Ave, Pensacola 48050000 15.737 0 4 5
2 Front Brach Rd near 16th St, Panama City Beach 46010000 4.335 1 2 3
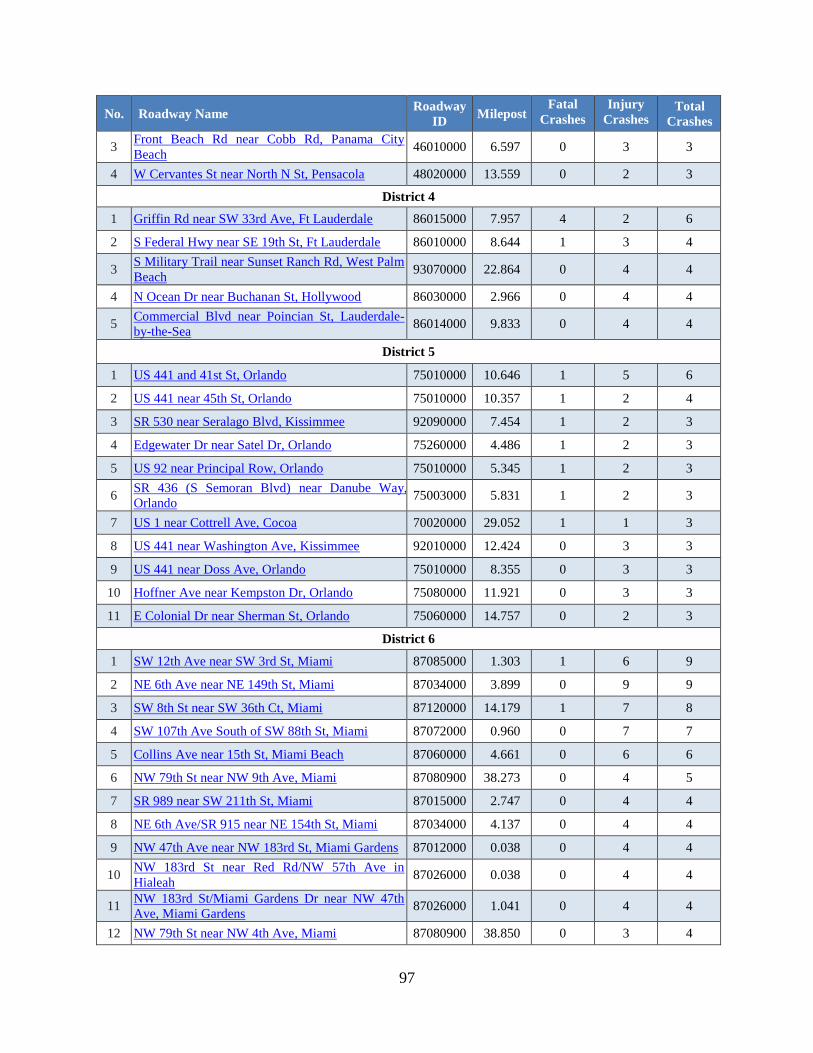
97
No. Roadway Name Roadway
ID Milepost
Fatal
Crashes
Injury
Crashes Total
Crashes
3 Front Beach Rd near Cobb Rd, Panama City
Beach
46010000 6.597 0 3 3
4 W Cervantes St near North N St, Pensacola 48020000 13.559 0 2 3
District 4
1 Griffin Rd near SW 33rd Ave, Ft Lauderdale 86015000 7.957 4 2 6
2 S Federal Hwy near SE 19th St, Ft Lauderdale 86010000 8.644 1 3 4
3 S Military Trail near Sunset Ranch Rd, West Palm
Beach
93070000 22.864 0 4 4
4 N Ocean Dr near Buchanan St, Hollywood 86030000 2.966 0 4 4
5 Commercial Blvd near Poincian St, Lauderdale-
by-the-Sea
86014000 9.833 0 4 4
District 5
1 US 441 and 41st St, Orlando 75010000 10.646 1 5 6
2 US 441 near 45th St, Orlando 75010000 10.357 1 2 4
3 SR 530 near Seralago Blvd, Kissimmee 92090000 7.454 1 2 3
4 Edgewater Dr near Satel Dr, Orlando 75260000 4.486 1 2 3
5 US 92 near Principal Row, Orlando 75010000 5.345 1 2 3
6 SR 436 (S Semoran Blvd) near Danube Way,
Orlando
75003000 5.831 1 2 3
7 US 1 near Cottrell Ave, Cocoa 70020000 29.052 1 1 3
8 US 441 near Washington Ave, Kissimmee 92010000 12.424 0 3 3
9 US 441 near Doss Ave, Orlando 75010000 8.355 0 3 3
10 Hoffner Ave near Kempston Dr, Orlando 75080000 11.921 0 3 3
11 E Colonial Dr near Sherman St, Orlando 75060000 14.757 0 2 3
District 6
1 SW 12th Ave near SW 3rd St, Miami 87085000 1.303 1 6 9
2 NE 6th Ave near NE 149th St, Miami 87034000 3.899 0 9 9
3 SW 8th St near SW 36th Ct, Miami 87120000 14.179 1 7 8
4 SW 107th Ave South of SW 88th St, Miami 87072000 0.960 0 7 7
5 Collins Ave near 15th St, Miami Beach 87060000 4.661 0 6 6
6 NW 79th St near NW 9th Ave, Miami 87080900 38.273 0 4 5
7 SR 989 near SW 211th St, Miami 87015000 2.747 0 4 4
8 NE 6th Ave/SR 915 near NE 154th St, Miami 87034000 4.137 0 4 4
9 NW 47th Ave near NW 183rd St, Miami Gardens 87012000 0.038 0 4 4
10 NW 183rd St near Red Rd/NW 57th Ave in
Hialeah
87026000 0.038 0 4 4
11 NW 183rd St/Miami Gardens Dr near NW 47th
Ave, Miami Gardens
87026000 1.041 0 4 4
12 NW 79th St near NW 4th Ave, Miami 87080900 38.850 0 3 4

98
No. Roadway Name Roadway
ID Milepost
Fatal
Crashes
Injury
Crashes Total
Crashes
13 NW 7th Ave North of NW 121st St, North Miami 87140000 8.378 0 2 4
District 7
1 Gulf Blvd near 106th Ave, Treasure Island 15100000 4.833 1 6 8
2 4th St N North of 6th Ave N, St Petersburg 15090000 1.021 0 5 7
3 Seminole Blvd near 98th Ave, Seminole 15010000 13.274 2 1 5
4 Blind Pass Rd near 77th Ave, St Petersburg 15100000 2.727 1 4 5
5 4th St N near 74th Ave N, St Petersburg 15090000 5.204 0 4 5
6 US 19 South of SR 52, Bayonet Point 14030000 11.375 2 2 4
7 Seminole Blvd near 14th Ave SW, Largo 15010000 16.195 1 3 4
8 US 19 near Panorama Ave, Holiday 14030000 0.476 1 3 4
9 US 19 near Bartelt Rd, Holiday 14030000 0.786 1 3 4
10 Gulf to Bay Blvd near Elizabeth Ave, Clearwater 15040000 5.103 2 1 3
11 US 19 near Green Key Rd, New Port Richey 14030000 5.647 1 2 3
12 SR 52 East of US 19, Bayonet Point 14120000 0.106 0 3 3
13 US 19 near Florestate Dr, Hudson 14030000 12.782 0 3 3
14 5th Ave N near 15th St N, St Petersburg 15010000 0.932 0 3 3
Notes: This table includes locations with at least 3 crashes, with the exceptions (i.e., not listed) of 15 locations with
3 crashes in District 4, and 24 locations with 3 crashes in District 6. Total crashes include no injury and unknown
injury crashes. The mileposts in this table represent the approximate center position of each non-signalized location.
7.2 Statewide Pedestrian High Crash Non-signalized Locations
In this section, the overall top high crash non-signalized locations statewide were further
identified based on critical pedestrian crash frequency for detailed analysis.
7.2.1 Location Identification
Similar to the analysis of signalized intersections in Chapter 6, non-signalized locations with
observed pedestrian crash frequency greater than three standard deviations from the average
crash frequency were identified and analyzed. Non-signalized locations that experienced one
pedestrian crash during the three-year analysis period were excluded from the analysis as one
crash is considered to be a random occurrence. A total of 351 non-signalized locations were
found to experience more than one pedestrian crash during the three-year analysis period. During
2008-2010, these locations experienced an average of 2.50 pedestrian crashes, with a standard
deviation (σ) of 1.06 pedestrian crashes. A total of 14 non-signalized locations experienced ≥ 5
crashes (i.e., crash frequency > avg. freq. + 3σ) during 2008-2010. Table 7-2 lists these 14 non-
signalized locations.

99
Table 7-2: Statewide Pedestrian High Crash Non-signalized Locations
No. Roadway Name District Roadway
ID Milepost
Fatal
Crashes
Injury
Crashes Total
Crashes
1 NE 6th Ave near NE 149th St, Miami 6 87034000 3.899 0 9 9
2 SW 12th Ave near SW 3rd St, Miami 6 87085000 1.303 1 6 9
3 SW 8th St near SW 36th Ct, Miami 6 87120000 14.179 1 7 8
4 Gulf Blvd near 106th Ave, Treasure Island 7 15100000 4.883 1 6 8
5 SW 107th Ave South of SW 88th St, Miami 6 87072000 0.960 0 7 7
6 4th St N North of 6th Ave N, St Petersburg 7 15090000 1.021 0 5 7
7 Collins Ave near 15th St, Miami Beach 6 87060000 4.661 0 6 6
8 US 441 and 41st St, Orlando 5 75010000 10.646 1 5 6
9 Griffin Rd near SW 33rd Ave, Ft Lauderdale 4 86015000 7.957 4 2 6
10 Seminole Blvd near 98th Ave, Seminole 7 15010000 13.274 2 1 5
11 NW 79th St near NW 9th Ave, Miami 6 87080900 38.273 0 4 5
12 4th St N near 74th Ave N, St Petersburg 7 15090000 5.204 0 4 5
13 Blind Pass Rd near 77th Ave, St Petersburg 7 15100000 2.727 1 4 5
14 Gulf Bch Hwy near Colbert Ave, Pensacola 3 48050000 15.737 0 4 5
Note: Total crashes include no injury and unknown injury crashes. The mileposts in this table represent the
approximate center position of each non-signalized location.
7.2.2 Condition-collision Diagrams
Figures 7-1 through 7-14 plot the “condition-collision” diagrams of the 14 high crash non-
signalized locations. In these diagrams, the locations of all pedestrian crashes were plotted on the
satellite images. The figures also provide additional information on the injury severity of the
pedestrian using the following codes:
red – fatal
yellow – injury
green – no injury to pedestrian
blue – unknown injury to pedestrian

100
Figure 7-1: NE 6th Ave near NE 149th St in Miami (Roadway ID 87034000; MP 3.899) (Map)
Figure 7-2: SW 12th Ave near SW 3rd St in Miami (Roadway ID 87085000; MP 1.303) (Map)
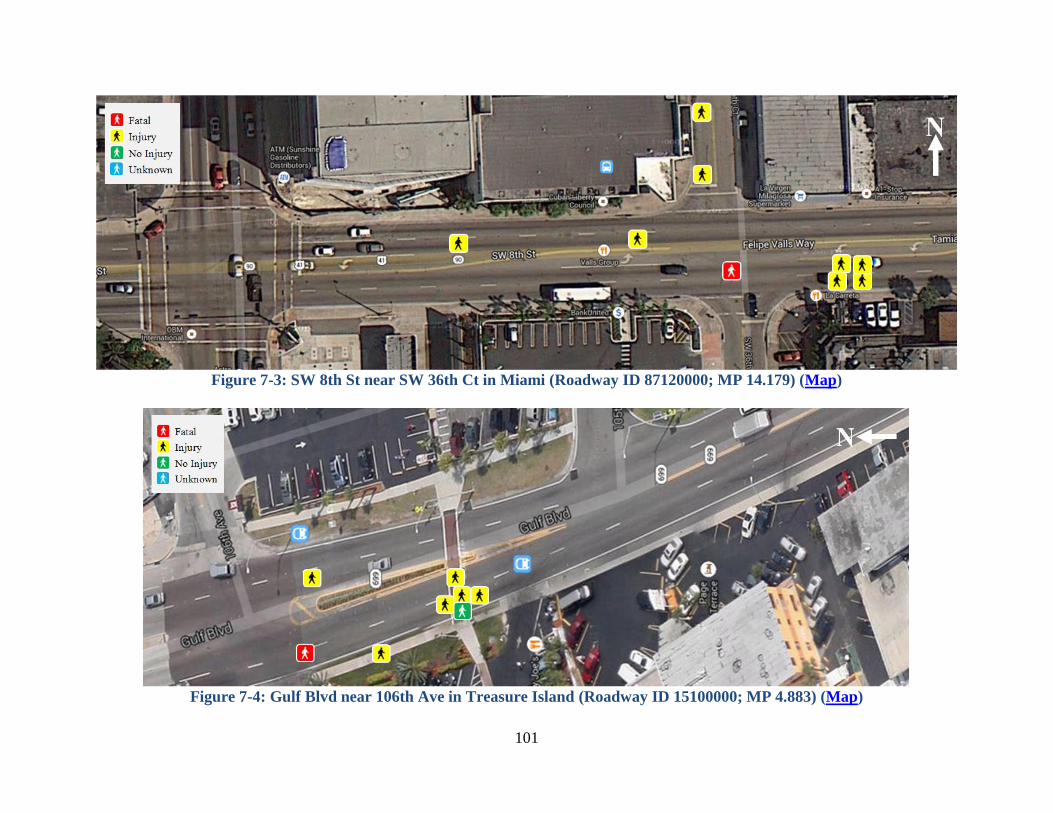
101
Figure 7-3: SW 8th St near SW 36th Ct in Miami (Roadway ID 87120000; MP 14.179) (Map)
Figure 7-4: Gulf Blvd near 106th Ave in Treasure Island (Roadway ID 15100000; MP 4.883) (Map)

102
Figure 7-5: SW 107th Ave South of SW 88th St in Miami (Roadway ID 87072000; MP 0.960) (Map)
Figure 7-6: 4th St N near 6th Ave N in St Petersburg (Roadway ID 15090000; MP 1.021) (Map)

103
Figure 7-7: Collins Ave near 15th St in Miami Beach (Roadway ID 87060000; MP 4.661) (Map)
Figure 7-8: US 441 and 41st Street in Orlando (Roadway ID 75010000; MP 10.646) (Map)

104
Figure 7-9: Griffin Rd near SW 33rd Ave in Ft Lauderdale (Roadway ID 86015000; MP 7.957) (Map)
Figure 7-10: Seminole Blvd near 98th Ave in Seminole (Roadway ID 15010000; MP 13.274) (Map)

105
Figure 7-11: NW 79th St near NW 9th Ave in Miami (Roadway ID 87080900; MP 38.273) (Map)
Figure 7-12: 4th St N near 74th Ave N in St Petersburg (Roadway ID 15090000; MP 5.204) (Map)

106
Figure 7-13: Blind Pass Rd near 77th Ave in St Pete Beach (Roadway ID 15100000; MP 2.727) (Map)
Figure 7-14: Gulf Bch Hwy near Colbert Ave in Pensacola (Roadway ID 48050000; MP 15.737) (Map)

107
7.2.3 Crash Contributing Factors and Potential Countermeasures
This section focuses on reviewing the police reports of pedestrian crashes to identify factors that
adversely affect the safety of pedestrians at non-signalized locations. The 14 high crash non-
signalized locations experienced a total of 115 pedestrian crashes during 2008-2010. The
illustrative sketches and descriptions in the police reports of these 115 crashes were reviewed.
Both signalized and non-signalized locations were found to experience similar types of
pedestrian crashes. Particularly, the following four crash types were observed at both signalized
and non-signalized locations:
1. Crashes that occurred in the vicinity of bus stops.
2. Crashes that involved pedestrians who were not crossing at designated crossing locations.
3. Crashes that occurred in left-turning lanes and right-most lanes.
4. Crashes that involved pedestrians in a crosswalk and through traffic.
In addition to the above identified crash types, the following two types of crashes were observed
at non-signalized locations: crashes that occurred at undivided roadways, and crashes that
involved pedestrians walking along a roadway. Crash contributing factors related to these two
types of crashes were analyzed.
Crashes That Occurred at Undivided Roadways
Of the 14 high crash non-signalized locations, only four locations had raised medians while the
remaining 10 locations were undivided. During 2008-2010, the four locations with medians
experienced a total of 24 pedestrian crashes (i.e., 6.0 crashes per location) while the remaining
10 locations experienced a total of 91 pedestrian crashes (i.e., 9.1 crashes per location). Figure 7-
15 gives an example of a pedestrian crash where a pedestrian was struck while crossing a multi-
lane arterial with no raised medians. Figure 7-16 gives another example of a pedestrian crash
where the pedestrian was struck while crossing the street in a crosswalk at a location with two-
way left-turn lane (TWLTL). It is evident from the illustrative sketches in the police reports that
pedestrians are at a higher risk of getting involved in a crash while crossing multi-lane arterials
with no raised medians.
Raised medians act as pedestrian refuge areas and "allow pedestrians to cross one direction of
traffic at a time, significantly reducing the complexity of the crossing" (FHWA, 2013). However,
raised medians often encourage high speeds and might result in an increase in pedestrian crash
severity. It was also observed from the police reports that pedestrians sometimes do not stop at
the raised medians, diminishing their actual safety benefits. In summary, locations with raised
medians increase pedestrian safety compared to undivided sections and corridors with TWLTLs.
In addition to the construction of raised medians, agency-wide pedestrian education campaigns
focusing on the safety benefits of using pedestrian refuge areas is recommended. Also, at
locations with high pedestrian activity, deployment of speed monitoring trailers and increased
enforcement of speed limit discourages drivers from speeding, providing a safer environment for
pedestrians to cross.

108
Figure 7-15: Pedestrian Crash at a TWLTL (Crash ID: 774292040)
Figure 7-16: An Example of a Crash Where a Pedestrian was Struck While in Crosswalk at
a Location with TWLTL (Crash ID: 730487530)
Crashes That Involved Pedestrians Walking Along a Roadway
A majority of pedestrian crashes occur while the pedestrian was crossing the street. Nonetheless,
pedestrians being hit by through traffic while walking along the roadway are also quite common.
Figure 7-17 shows a crash involving a pedestrian when struck while walking along a roadway.

109
These types of crashes are more frequent at locations with no sidewalks. In such locations,
pedestrians sometimes walk along the edge of the roadway, and often in the direction of traffic,
increasing the crash risk.
Figure 7-17: Pedestrian Crash That Occurred While Pedestrian was Walking Along the
Roadway (Crash ID: 770947240)
One of the most effective countermeasures to improve the safety of pedestrians while walking
along the roadway is to provide sidewalks on both sides of the road. At locations where
providing sidewalks is not feasible, paved shoulders could also help improve pedestrian safety
(PEDSAFE, 2013). Encouraging pedestrians to walk against the direction of traffic could
potentially make the pedestrians more visible. Also, encouraging pedestrians to wear reflective
accessories such as florescent shoes, clothing, or carrying a flashlight improves pedestrian safety
by making them visible and more conspicuous to motorists.
7.3 Summary
This chapter focused on identifying and analyzing non-signalized locations with high pedestrian
crash frequencies. ArcGIS 10.0 was used to identify the non-signalized locations with more than
one pedestrian crash. The top high crash non-signalized locations were identified based on
critical pedestrian crash frequency (i.e., greater than three standard deviations from the average
crash frequency). A total of 14 non-signalized locations with ≥ 5 crashes during 2008-2010 were
included in the analysis. Police reports of the 115 crashes that occurred at these 14 locations
were reviewed in detail to identify specific factors that adversely affected pedestrian safety.
Several of the pedestrian crash types identified at signalized intersections were also found at non-
signalized locations. Particularly, the following types of crashes were observed at both signalized
and non-signalized locations:
1. Crashes that occurred in the vicinity of bus stops.
2. Crashes that involved pedestrians who were not crossing at designated crossing locations.
3. Crashes that occurred in left-turning lanes and right-most lanes.
4. Crashes that involved pedestrians in a crosswalk and through traffic.

110
In addition to the above identified crash types, the following two types of crashes were identified
at non-signalized locations: crashes that occurred at undivided roadways, and crashes that
involved pedestrians walking along a roadway.
Undivided roadway segments were found to experience a greater number of pedestrian crashes
compared to the locations with raised medians. Raised medians act as pedestrian refuge areas,
providing an opportunity for pedestrians to pause while crossing multiple lanes of traffic.
Therefore, constructing raised medians is recommended on multi-lane corridors with high traffic.
In addition to the construction of raised medians, agency-wide pedestrian education campaigns
focusing on the safety benefits of raised medians is recommended to discourage pedestrians from
crossing multiple travel lanes without stopping and waiting for sufficient gaps to cross.
Sidewalks not only encourage walking but also significantly improve pedestrian safety. At
locations with no sidewalks, pedestrians are forced to walk along the edge of the roadway,
increasing the potential for pedestrian crashes. If feasible, it is recommended to provide
sidewalks, or at a minimum paved shoulder, on both sides of the road. Encouraging pedestrians
to walk against the direction of traffic could potentially make the pedestrians more visible.
111
CHAPTER 8
SUMMARY AND CONCLUSIONS
Pedestrian crashes are a major safety concern in Florida. About one in every five traffic-related
fatalities in the state is a pedestrian. The goal of this project was to conduct a comprehensive
study to improve pedestrian safety on state roads in Florida. The specific project objectives
included:
1. Reviewing and summarizing existing pedestrian safety studies, including methods of
analysis, and findings on pedestrian crash causes, crash contributing factors, and potential
countermeasures.
2. Identifying statewide pedestrian crash patterns and causes.
3. Identifying factors contributing to pedestrian injury severity.
4. Identifying and analyzing pedestrian high crash locations at both signalized and non-
signalized locations for crash causes and potential countermeasures.
For this study, a total of 6,434 pedestrian crashes that occurred on state roads during 2008-2010
were identified. A major effort of this project involved detailed review of police reports for these
crashes to obtain additional crash details, including those from police descriptions and
illustrative sketches, which are not available from crash summary records. In addition, additional
roadway information not available from the state roadway inventory such as types of crosswalks
were visually identified. Both of these efforts were performed using two in-house web-based
systems developed to facilitate police report review and data collection.
8.1 Literature Review
There has been significant effort in analyzing pedestrian crashes and identifying pedestrian risk
factors. Existing methods for identifying pedestrian hot spots are broadly classified into three
categories: density, clustering, and exposure estimation. In the density method, simple and
Kernel methods are the two commonly used crash density calculation methods. Among these two
methods, the Kernel method is regarded as a better approach since it generates a well fitted
smooth curve. The second method relies on the clustering technique and it has been successfully
applied in safety analysis to identify groups of crashes. The third method of hot spot
identification is exposure estimation. This includes statistical regression models, sketch plan and
network models, micro-simulation models, and computer vision techniques.
Several pedestrian countermeasures have been proposed in the literature to improve pedestrian
safety. These include but are not limited to, converting intersections to roundabouts, installing
raised medians and refuge islands, adding on-street parking, installing pedestrian signals,
modifying signal phasing, installing pedestrian countdown signals, improving lighting at
intersections, and illuminating crosswalks. The majority of these countermeasures were found to
have been effective in reducing pedestrian crashes and fatalities.
8.2 Statewide Crash Patterns and Causes
Statewide crash patterns and causes were identified based on the 6,434 pedestrian crashes in the
three-year analysis period. The crashes resulted in a total of 663 pedestrian fatalities (i.e.,

112
10.3%). Overall, there were 124.7 total crashes and 13 fatal crashes per million population
annually. Of the different age groups, the young pedestrian group (16-25 years) experienced the
highest number of pedestrian crashes per million population and also the highest pedestrian crash
rate per million walk trips per year. Older people were found to experience a slightly higher
number of fatal crashes per million walk trips per year. Although a majority of crashes occurred
during daytime, they resulted in a lower proportion of fatalities. At 5% significance level, the
proportion of fatal crashes that occurred during nighttime were significantly greater compared to
the proportion of fatal crashes in the daytime.
Overall, pedestrians were found to be at fault in over 53.0% of the crashes and drivers were at
fault in 28.2% of the crashes. Irrespective of who was at fault, failing to yield right-of-way and
disregarding traffic control devices were the two major contributing causes for pedestrian
crashes. Moreover, crashes where pedestrian was at fault were found to be more severe
compared to the crashes where the driver was at fault, and this difference was found to be
statistically significant.
A majority of the crashes occurred primarily on urban principal arterials. Although the majority
of pedestrian crashes occurred in urban areas and especially in metropolitan areas, fatal crashes
were disproportionately high in rural areas. Moreover, the proportion of fatal crashes decreased
with urbanization. Crashes along the locations with higher speed limits resulted in a greater
proportion of fatal crashes. At a 5% significance level, there was no significant difference in the
proportion of fatal crashes at signalized intersections across the following crosswalk types:
standard, continental, ladder, and solid with special surface. Furthermore, crash data did not
indicate that continental and ladder types had a better safety performance than standard
crosswalks at signalized intersections during nighttime.
8.3 Statewide Crash Severity Contributing Causes
Mixed logit models were developed to identify significant geometric, traffic, road user,
environmental, and vehicle factors contributing to pedestrian injury severity at signalized and
non-signalized locations. At both signalized and non-signalized locations, the following ten
variables were selected to be included in the model: percentage of trucks, natural logarithm of
AADT, crosswalk type, lighting condition, pedestrian age, speed limit, hour of crash, at-fault
road user, vehicle type, and weather condition.
The results from the mixed logit models showed that:
Crashes where pedestrians were at fault were more likely to result in severe injuries
compared to the crashes where drivers were at fault or both pedestrians and drivers were
at fault at both signalized and non-signalized locations.
Crashes involving at-fault pedestrians resulted in a greater probability of severe injuries
at non-signalized locations compared to signalized locations.
Very young pedestrians were associated with lower probability of severe injuries at both
signalized and non-signalized locations.
Very old pedestrians were associated with higher probability of severe injuries at both
signalized and non-signalized locations.

113
Very old pedestrians have a greater severity risk at signalized locations compared to non-
signalized locations.
At signalized locations, rainy weather was associated with a slight increase in the
probability of severe injuries compared to other weather conditions.
Dark conditions, with and without street light, were associated with an increase in the
probability of severe injuries at both signalized and non-signalized locations.
At non-signalized locations, vans were found to be associated with an increase in the
probability of severe injuries compared to other vehicle types.
Increasing the speed limit at signalized and non-signalized locations was associated with
higher severe injury probability.
The increase in speed limit at non-signalized locations posed greater pedestrian severity
risk compared to signalized locations.
At non-signalized locations, pedestrians crossing the roadway were associated with
higher probability of severe injuries compared to pedestrians walking along the roadway.
At signalized locations, increasing the AADT and the percentage of trucks significantly
increased the probability of severe pedestrian injuries.
At signalized locations, the probability of severe pedestrian injuries was higher during the
night and dawn off-peak periods.
8.4 Pedestrian Crash Causes and Countermeasures at Signalized Locations
Urban signalized intersections with observed pedestrian crash frequency greater than three
standard deviations from the average crash frequency were identified and analyzed. A total of 21
signalized intersections with ≥ 6 pedestrian crashes during 2008-2010 were included in the
analysis. Police reports of all the crashes that occurred at these high crash intersections were
reviewed and the crash contributing factors related to each of the following six types of crashes
were analyzed:
1. Crashes that involved right-turning vehicles.
2. Crashes that involved left-turning vehicles.
3. Crashes that occurred in the vicinity of bus stops.
4. Crashes that involved pedestrians who were not crossing at designated crossing locations.
5. Crashes that occurred in left-turning lanes and right-most lanes.
6. Crashes that involved pedestrians in a crosswalk and through traffic.
Pedestrian crashes involving turning traffic at signalized intersections could be prevented by
eliminating the potential vehicle-pedestrian conflicts. At locations with high pedestrian volumes,
prohibiting right turns on red could be an easy strategy to minimize pedestrian conflicts
involving right-turning vehicles. Additionally, providing a leading pedestrian interval (LPI) that
gives pedestrians a head start while crossing the intersection could improve pedestrian safety.
Pedestrian crashes involving left-turning vehicles could be reduced by providing either a
protected left-turn phase or an exclusive protected pedestrian signal.
Several pedestrian crashes occurred when the pedestrian walked in front of the bus onto the
approaching traffic. These types of pedestrian crashes could be prevented by improving roadway
lighting and providing curb extensions in the vicinity of bus stops. Furthermore, relocating near-

114
side bus stops to the far-side of the intersection could eliminate sight-distance restrictions,
improving pedestrian safety.
At locations where pedestrians are expected to cross multi-lane roads with high travel speeds and
heavy traffic, the following countermeasures could be effective in reducing pedestrian crash
frequency and severity:
ensure curb ramps are provided to make crossing easier for all pedestrians,
install lighting along the corridor,
require pedestrians to cross the roadway at designated crossing locations such as
crosswalks, and
install traffic calming measures, such as providing speed bumps, lane narrowing, etc.
Agency-wide education campaigns on the laws pertaining to pedestrians and the safety benefits
of using pedestrian facilities such as crosswalks, sidewalks, and pedestrian refuge islands could
improve pedestrian safety. Furthermore, extensive driver education campaigns that focus on
driver compliance with pedestrian right-of-way laws and stricter enforcement could prevent the
crashes that were due to driver error.
8.5 Pedestrian Crash Causes and Countermeasures at Non-signalized Locations
ArcGIS 10.0 was used to identify the non-signalized locations with more than one pedestrian
crash. The top high crash non-signalized locations were identified based on critical pedestrian
crash frequency (i.e., greater than three standard deviations from the average crash frequency). A
total of 14 non-signalized locations with ≥ 5 crashes during 2008-2010 were included in the
analysis. Police reports of the 115 crashes that occurred at these 14 locations were reviewed in
detail to identify pedestrian crash causes and potential countermeasures. Several of the
pedestrian crash types identified at signalized intersections were also found at non-signalized
locations. Particularly, the following types of crashes were observed at both signalized and non-
signalized locations:
1. Crashes that occurred in the vicinity of bus stops.
2. Crashes that involved pedestrians who were not crossing at designated crossing locations.
3. Crashes that occurred in left-turning lanes and right-most lanes.
4. Crashes that involved pedestrians in a crosswalk and through traffic.
In addition to the above identified crash types, the following two types of crashes were identified
at non-signalized locations: crashes that occurred at undivided roadways, and crashes that
involved pedestrians walking along a roadway. Crash contributing factors related to these two
types of crashes were analyzed.
Undivided roadway segments were found to experience a greater number of pedestrian crashes
compared to the locations with raised medians. Raised medians act as pedestrian refuge areas,
providing an opportunity for pedestrians to pause while crossing multiple lanes of traffic.
Therefore, constructing raised medians is recommended on multi-lane corridors with high traffic.
In addition to the construction of raised medians, agency-wide pedestrian education campaigns

115
focusing on the safety benefits of raised medians is recommended to discourage pedestrians from
crossing multiple travel lanes without stopping and waiting for sufficient gaps to cross.
Sidewalks not only encourage walking but also significantly improve pedestrian safety. At
locations with no sidewalks, pedestrians are forced to walk along the edge of the roadway,
increasing the potential for pedestrian crashes. If feasible, it is recommended to provide
sidewalks, or at a minimum paved shoulder, on both sides of the road.

116
REFERENCES
Abdel-Aty, M., S. Chundi, and C. Lee, Geo-Spatial and Log-Linear Analysis of Pedestrian and
Bicyclist Crashes Involving School-Aged Children, Journal of Safety Research, Vol. 38, pp.
571-579, 2007.
AECOM, Identify Locations for Vulnerable Road User Safety Studies, Draft Memorandum
Prepared for Florida Department of Transportation, District 6, Miami, FL, 2013.
Al-Shammari, N., S. Bendak, and S. Al-Gadhi, In-Depth Analysis of Pedestrian Crashes in
Riyadh, Traffic Injury Prevention, 10(6), pp. 551-559, 2009.
Americans with Disabilities Act, 1990, http://www.ada.gov/pubs/ada.htm, Accessed October
2012.
Anderson, T., Kernel Density Estimation and K-Means Clustering to Profile Road Accident Hot
Spots, Accident Analysis & Prevention, Vol. 41(3), pp. 359-364, 2009.
Azam, M., A. Tarko, and E. Chen, An Exposure-Based Model of Pedestrian Safety in Areas and
Its Application to Identification of Townships with Pedestrian Safety Problems, Proceedings of
the 91st Annual Meeting of the Transportation Research Board, Washington, D.C., 2012.
Babka, R., J. Cooper, W. Alfsen, and M. Sabin, Community Pedestrian Safety Engagement
Workshops in California, Proceedings of the 90th Annual Meeting of the Transportation
Research Board, Washington, D.C., 2011.
Bahar, G., M. Parkhill, E. Hauer, F. Council, B. Persaud, C. Zegeer, R. Elvik, A. Smiley, and B.
Scott, Prepare Parts I and II of a Highway Safety Manual: Knowledge Base for Part II,
Unpublished Material from NCHRP Project 17-27, 2007a.
Bahar, G., M. Masliah, R. Wolff, and P. Park, Desktop Reference for Crash Reduction Factors,
FHWA-SA-07-015, Federal Highway Administration, U.S. Department of Transportation,
Washington, D.C., 2007b.
Bechtel, A., J. Geyer, and D. Ragland, A Review of ITS-Based Pedestrian Injury
Countermeasures, UCB-TSC-RR-2003-09, Institute of Transportation Studies, UC Berkeley
Traffic Safety Center, University of California, Berkeley, CA, 2003.
Bonneson, J., Pratt, M., and Songchitruksa, P. Development of Guidelines for Pedestrian Safety
Treatments at Signalized Intersections, FHWA/TX-11/0-6402-1, Federal Highway
Administration, Alexandria, VA, 2011.
Byington, K., and D. Schwebel, Effects of Mobile Internet Use on College Student Pedestrian
Injury Risk, Accident Analysis & Prevention, Vol. 51, pp. 78-83, 2013.

117
Cafiso, S., A. García, R. Cavarra, and M. Rojas, Before and After Study of Crosswalks Using a
Pedestrian Risk Index, Proceedings of the 90th Annual Meeting of the Transportation Research
Board, Washington, D.C., 2011.
Campbell, B., C. Zegeer, H. Huang, and M. Cynecki, A Review of Pedestrian Safety Research in
the United States and Abroad, FHWA-RD-03-042, Federal Highway Administration, McLean,
VA, 2004.
Charness, N., M. Champion, A. Mitchum, and M. Fox, Intersection and Pedestrian Safety
Research, Final Report # BD543-17, Florida Department of Transportation, Tallahassee, FL,
2009.
Charness, N., A. Mitchum, M. Champion, B. Cowing, and C. Stothart, Aging Driver and
Pedestrian Safety: Human Factors Studies, Final Report #BDK83 977-09, Florida Department of
Transportation, Tallahassee, FL, 2011.
Charness, N., W. Boot, A. Mitchum, C. Stothart, and H. Lupton, Aging Driver and Pedestrian
Safety: Prking Lot Hazards, Final Report #BDK83 977-12, Florida Department of
Transportation, Tallahassee, FL, 2012.
Chen, L., C. Chen, and R. Ewing, The Relative Effectiveness of Pedestrian Safety
Countermeasures at Urban Intersections-Lessons from a New York City Experience,
Proceedings of the 91st Annual Meeting of the Transportation Research Board, Washington,
D.C., 2012.
Cheng, L. Leading Pedestrian Interval, Leading Through Interval and Dutch Intersection,
http://wiki.coe.neu.edu/groups/advtraffic2011/wiki/5a6d5/, Accessed October 2013.
Chu, X., Pedestrian Safety at Midblock Locations, Final Report #BD544-16, Florida Department
of Transportation, Tallahassee, FL, 2006.
Chu, X., The Fatality Risk of Walking in America: A Time-Based Comparative Approach,
Proceedings of the 4th International Conference on Walking in the 21st Century, Portland, OR,
2003.
Transportation for America, Dangerous by Design 2011,
http://t4america.org/resources/dangerousbydesign2011/states/worst-metros/, Accessed August
2013.
De Brabander, B., and L. Vereeck, Safety Effects of Roundabouts in Flanders: Signal Type,
Speed Limits and Vulnerable Road Users, Accident Analysis & Prevention, Vol. 39, pp. 591-599,
2007.
Deng, T., Y. Ni, and K. Li, Pedestrian Crossings at Mid-Block Locations: A Comparative Study
of Existing Signal Operations, Proceedings of the 92nd Annual Meeting of the Transportation
Research Board, Washington, D.C., 2013.

118
Depaire, B., G. Wets, and K. Vanhoof, Traffic Accident Segmentation by Means of Latent Class
Clustering, Accident Analysis & Prevention, Vol. (40), pp. 1257-1266, 2008.
Dovom, H., M. Saffarzadeh, M. Dovom, and N. Nadimi, An Analysis of Pedestrian Fatal
Accident Severity Using a Binary Logistic Regression Model, ITE Journal, Vol. 82(4), pp. 38-
43, April Issue, 2012.
Econometric Software, Inc., LIMDEP Software Package, http://limdep.com, Accessed March
2012.
Elvik, R., and T. Vaa, The Handbook of Road Safety Measures, Emerald Group Publishing,
United Kingdom, First Edition, 2004.
Espino, E., J. Gonzalez, and A. Gan, Identifying Pedestrian High-Crash Locations as Part of
Florida’s Highway Safety Improvement Program: A Systematic Approach, Transportation
Research Record, No. 1828, pp. 83-88, 2003.
Federal Highway Administration,
http://safety.fhwa.dot.gov/ped_bike/tools_solve/medians_brochure/medians_brochure.pdf,
Accessed August 2013.
Federal Highway Administration, Pedestrian Safety Engineering and Intelligent Transportation
System-Based Countermeasures Program for Reduced Fatalities, Injuries, Conflicts, and Other
Surrogate Measures, U.S. Department of Transportation, 2002.
Federal Highway Administration, Miami-Dade Pedestrian Safety Project: Phase II, U.S.
Department of Transportation, 2008.
Federal Highway Administration, 2009 National Household Travel Survey, http://nhts.ornl.gov,
Accessed August 2013.
Fernandes, D., L. Miranda-Moreno, and P. Morency, Vehicle-Pedestrian Accidents at Signalized
Intersections: Exposure Measures and Geometric Designs, Proceedings of the 91st Annual
Meeting of the Transportation Research Board, Washington, D.C., 2012.
Fitzpatrick, K., and E. Park, Safety Effectiveness of the HAWK Pedestrian Crossing Treatment,
FHWA-HRT-10-042, Federal Highway Administration, U.S. Department of Transportation,
Washington, D.C., 2010.
Florida Department of Transportation, Use of Animated LED “Eyes” Pedestrian Signals to
Improve Pedestrian Safety, 2000,
http://www11.myflorida.com/Safety/ped_bike/handbooks_and_research/research/led_eyes.pdf,
Accessed October 2012.

119
Gan, A., J. Shen, and A. Rodriguez, Update of Florida Crash Reduction Factors and
Countermeasures to Improve the Development of District Safety Improvement Projects, Final
Report #BD015-04, Florida Department of Transportation, Tallahassee, FL, 2005.
Garder, P., The Impact of Speed and Other Variables on Pedestrian Safety in Maine, Accident
Analysis & Prevention, Vol. 36, pp. 533-542, 2004.
Haleem, K., and A. Gan, Effect of Driver’s Age and Side of Impact on Crash Severity along
Urban Freeways: A Mixed Logit Approach, Journal of Safety Research, Vol. 46, pp. 67-76,
2013.
Haleem, K., and M. Abdel-Aty, Examining Traffic Crash Injury Severity at Unsignalized
Intersections, Journal of Safety Research, Vol. 41, pp. 347-357, 2010.
Haleem, K., M. Abdel-Aty, and J. Santos, Multiple Applications of the Multivariate Adaptive
Regression Splines in Predicting Rear-end Crashes at Unsignalized Intersections, Transportation
Research Record, No. 2165, pp. 33-41, 2010.
Hagen, T., Selecting the Most Effective ITS Application for Pedestrian Safety in Florida, Final
Report #BC353-50, Florida Department of Transportation, Tallahassee, FL, 2005.
Haleem, K., and M. Abdel-Aty, Application of GLASSO in Variable Selection and Crash
Prediction at Unsignalized Intersections, ASCE: Journal of Transportation Engineering, Vol.
138(7), pp. 949-960, 2012.
Harkey, D., and C. Zegeer, PEDSAFE: Pedestrian Safety Guide and Countermeasures Selection
System, FHWA-SA-04-003, Federal Highway Administration, U.S. Department of
Transportation, Washington, D.C., 2004.
Harruff, R., A. Avery, and A. Alter-Pandya, Analysis of Circumstances and Injuries in 217
Pedestrian Traffic Fatalities, Accident Analysis & Prevention, Vol. 30(1), pp. 11-20, 1998.
Helbing, D., P. Molnar, I. Farkas, and K. Bolay, Self-Organizing Pedestrian Movement,
Environment and Planning B: Planning and Design, Vol. 28, pp. 361-383, 2001.
Hess, P., A. Moudon, M. Snyder, and K. Sanilov, Site Design and Pedestrian Travel,
Transportation Research Record, No. 1674, pp. 9-19, 1999.
Hillier, B., A. Penn, J. Hanson, T. Grajewski, and J. Xu, Natural Movement: or, Configuration
and Attraction in Urban Pedestrian Movement, Environment and Planning B, Vol. 20(1), pp. 29-
66, 1993.
Hu, H., Z. Qu, Z. Li, S. Jiang, and J. Hu, Vision-Based Pedestrian Abnormal Crossing Behavior
Recognition and Analysis, Proceedings of the 91st Annual Meeting of the Transportation
Research Board, Washington, D.C., 2012.

120
Huang, H., and C. Zegeer, An Evaluation of Illuminated Pedestrian Push Buttons in Windsor,
Ontario, FHWA-RD-00-102, Federal Highway Administration, McLean, VA, 2001.
Institute of Transportation Engineers (ITE), Designing Walkable Urban Thoroughfares: A
Context Sensitive Approach, Washington, D.C., 2010.
Institute of Transportation Engineers (ITE), Toolbox of Countermeasures and their Potential
Effectiveness to Make Intersections Safer, Briefing Sheet 8, 2004.
Jang, K., S. Park, S. Kang, K. Song, S. Kang, and S. Chung, Evaluation of Pedestrian Safety:
Geographical Identification of Pedestrian Crash Hotspots and Evaluating Risk Factors for Injury
Severity, Proceedings of the 92nd Annual Meeting of the Transportation Research Board,
Washington, D.C., 2013.
Jensen, S., Bicycle Tracks and Lanes: A Before-After Study, Proceedings of the 87th Annual
Meeting of the Transportation Research Board, Washington, D.C., 2008.
Karsch, H., J. Hedlund, J. Tison, and W. Leaf, Review of Studies on Pedestrian and Bicyclist
Safety, 1991-2007, DTNH22-02-D-35121 - Task Order 02, National Highway Traffic Safety
Administration, U.S. Department of Transportation, Washington, D.C., 2012.
Katz, Okitsu & Associates, Illuminated Crosswalks: An Evaluation Study and Policy
Recommendations, Prepared for the City of Fountain Valley, California, 2000.
Keall, M., Pedestrian Exposure to Risk of Road Accident in New Zealand, Accident Analysis &
Prevention, Vol. 27(5), pp. 729-740, 1995.
Kennedy, J., Estimating Pedestrian Volumes and Crashes at Urban Signalized Intersections, M.S.
Thesis, Virginia Polytechnic Institute and State University, Falls Church, VA, 2008.
Khattak, A. Severity of Pedestrian Crashes at Highway-Rail Grade Crossings, Proceedings of the
92nd Annual Meeting of the Transportation Research Board, Washington, D.C., 2013.
Khattak, A., and Z. Luo, Pedestrian and Bicyclist Violations at Highway-Rail Grade Crossings,
Transportation Research Record, No. 2250, pp. 76-82, 2011.
Kim, J., G. Ulfarsson, S. Kim, and V. Shankar, A Mixed Logit Model Approach to Investigate
effects of Age on Driver-Injury Severity in Single-Vehicle Accidents, Proceedings of the 90th
Annual Meeting of the Transportation Research Board, Washington, D.C., 2011.
Kim, J., G. Ulfarsson, V. Shankar, and F. Mannering, A Note on Modeling Pedestrian-injury
Severity in Motor-vehicle Crashes with the Mixed Logit Model. Accident Analysis & Prevention,
Vol. 42, pp. 1751-1758, 2010.
Kim, K., and E. Yamashita, Motor Vehicle Crashes and Land use: Empirical Analysis from
Hawaii, Transportation Research Record, No. 1784, pp. 73-79, 2002.
121
Kim, K., and K. Ortega, Modeling the Relationships between Pedestrian Accidents and Census
Block Group Characteristics in Hawaii, Proceedings of the 78th Annual Meeting of the
Transportation Research Board, Washington, D.C., 1999.
Koonce, P., L. Rodegerdts, K. Lee, S. Quayle, S. Beaird, C. Braud, J. Bonneson, P. Tarnoff, and
T. Urbanik, Traffic Signal Timing Manual, 2008, FHWA-HOP-08-024-Task Order B98C75-009,
Federal Highway Administration, U.S. Department of Transportation, Washington, D.C., 2008.
Kourtellis, A., P. Lin, and M. Gawade, Measuring Unsafe Pedestrian Behavior Using
Observational Data, Proceedings of the 92nd Annual Meeting of the Transportation Research
Board, Washington, D.C., 2013.
Kravetz, D., and R. Noland, A Spatial Analysis of Income Disparities in Pedestrian Safety in
Northern New Jersey: Is there an Environmental Justice Issue? Transportation Research Record,
in Press, 2012.
LaScala E., D. Gerber, and P. Gruenewald, Demographic and Environmental Correlates of
Pedestrian Injury Collisions: A Spatial Analysis, Accident Analysis & Prevention, Vol. 32(5), pp.
651-658, 2000.
Lee, C., and M. Abdel-Aty, Comprehensive Analysis of Vehicle–Pedestrian Crashes at
Intersections in Florida, Accident Analysis & Prevention, Vol. 37, pp. 775-786, 2005.
Li, S., T. Sayed, M. Zaki, G. Mori, F. Stefanus, B. Khanloo, and N. Saunier, Automated
Collection of Pedestrian Data through Computer Vision Techniques, Transportation Research
Record, No. 2299, pp. 121-127, 2012.
Likas, A., N. Vlassis, and J. Verbeek, The Global K-Means Clustering Algorithm, Pattern
Recognition, Vol. 36, pp. 451-461, 2003.
Luoma, J., and H. Peltola, Does Facing Traffic Improve Pedestrian Safety? Accident Analysis &
Prevention, Vol. 50, pp. 1207-1210, 2013.
Markowitz, F., S. Sciortino, J. Fleck, and B. Yee, Pedestrian Countdown Signals: Experience
with an Extensive Pilot Installation, ITE Journal, January Volume, pp. 43-48, 2006.
McMahon, P., C. Zegeer, D. Chandler, R. Knoblauch, R. Stewart, and A. Khattak, An Analysis of
Factors Contributing to Walking along Roadway Crashes: Research Study and Guidelines for
Sidewalk and Walkways, FHWA-RD-01-101, Federal Highway Administration, U.S. Department
of Transportation, Washington, D.C., 2002.
McNally, J., http://www.joemcnally.com/blog/2008/12/14/bye-bchello-cal/, Accessed October
2012.
Milton, J., V. Shankar, F. Mannering, Highway Accident Severities and the Mixed Logit Model:
An Exploratory Empirical Analysis. Accident Analysis & Prevention, Vol. 40(1), pp. 260-266,
2008.

122
Mohamed, M., N. Saunier, L. Miranda-Moreno, and S. Ukkusuri, A Clustering Regression
Approach: A Comprehensive Injury Severity Analysis of Pedestrian–Vehicle Crashes in New
York, US and Montreal, Canada, Safety Science, Vol. 54, pp. 27-37, 2013.
Moore, D., W. Schneider IV, P. Savolainen, and M. Farzaneh, Mixed Logit Analysis of Bicyclist
Injury Severity Resulting from Motor Vehicle Crashes at Intersection and Non-intersection
Locations, Accident Analysis & Prevention, Vol. 43(3), pp. 621-630, 2011.
Nasar, J., and D. Troyer, Pedestrian Injuries due to Mobile Phone Use in Public Places, Accident
Analysis & Prevention, Vol. 57, pp. 91-95, 2013.
National Highway Traffic Safety Administration, Traffic Safety Facts, U.S. Department of
Transportation, Washington, D.C., 2012.
Ness, M., J. Morrall, and B. Hutchinson, An Analysis of Central Business District Pedestrian
Circulation Patterns, Highway Research Record, No. 283, pp. 11-18, 1969.
Noland, R., and M. Quddus, A Spatially Disaggregate Analysis of Road Casualties in England,
Accident Analysis & Prevention, Vol. 36(6), pp. 973-984, 2004.
Obeng, K., and M. Rokonuzzaman, Pedestrian Injury Severity in Automobile Crashes, Open
Journal of Safety Science and Technology, Vol. 3, pp. 9-17, 2013.
Oh, C., Y. Kang, B. Kim, and W. Kim, Analysis of Pedestrian-Vehicle Crashes in Korea:
Focused on Developing Probabilistic Pedestrian Fatality Model, Proceedings of the 84th Annual
Meeting of the Transportation Research Board, Washington, D.C., 2005.
Pai, C., K. Hwang, W. Saleh, A Mixed Logit Analysis of Motorists’ Right-of-way Violation in
Motorcycle Accidents at Priority T-junctions. Accident Analysis & Prevention, Vol. 41, pp. 565-
573, 2009.
PEDSAFE. Crash Analysis, http://www.walkinginfo.org/pedsafe/pedsafe_ca_crashtypes.cfm,
Accessed September 2013.
Penn, A., B. Hillier, D. Banister, and J. Xu, Configurational Modeling of Urban Movement
Networks, Environment and Planning B, Vol. 25(1), pp. 59-84, 1998.
Prato, C., V. Gitelman, and S. Bekhor, Mapping Patterns of Pedestrian Fatal Accidents in Israel,
Accident Analysis & Prevention, Vol. 44, pp. 56-62, 2012.
Pratt, M., J. Bonneson, and P. Songchitruksa, Effect of Left-Turn Operational Mode on
Pedestrian Safety: Development of Models and Guidelines, Proceedings of the 92nd Annual
Meeting of the Transportation Research Board, Washington, D.C., 2013.

123
Pratt, M., P. Songchitruksa, and J. Bonneson, Pedestrians and Left-Turning Vehicles: An
Evaluation of Safety Treatments, Proceedings of the 91st Annual Meeting of the Transportation
Research Board, Washington, D.C., 2012.
Pulugurtha, S., V. Krishnakumar, and S. Nambisan, New Methods to Identify and Rank High
Pedestrian Crash Zones: An Illustration, Accident Analysis & Prevention, Vol. 39(4), pp. 800-
811, 2007.
Pulugurtha, S., V. Vasudevan, S. Nambisan, and M. Dangeti, Evaluating Effectiveness of
Infrastructure-Based Countermeasures for Pedestrian Safety, Transportation Research Record,
No. 2299, pp. 100-109, 2012.
Qi, Y., and D. Li, When Should Right-turn on Red (RTOR) be Used? Synthesis on the Safety of
RTOR, Proceedings of the 91st Annual Meeting of the Transportation Research Board,
Washington, D.C., 2012.
Qi, Y., and P. Yuan, Pedestrian Safety at Intersections Under Control of Permissive Left-Turn
Signal, Transportation Research Record, No. 2299, pp. 91-99, 2012.
Qin, X., and J. Ivan, Estimating Pedestrian Exposure Prediction Model in Rural Areas,
Transportation Research Record, No. 1773, pp. 89-96, 2001.
R Software, http://www.r-project.org, Accessed September 2013.
Raford, N., and D. Ragland, Pedestrian Volume Modeling for Traffic Safety and Exposure
Analysis: The Case of Boston, Massachusetts, Proceedings of the 85th Annual Meeting of the
Transportation Research Board, Washington, D.C., 2006.
Reddy, V., T. Datta, P. Savolainen, and S. Pinapaka, Evaluation of Innovative Safety Treatments:
A Study of the Effectiveness of Countdown Pedestrian Signals, Final Report #B-D500, Volume 5,
Florida Department of Transportation, Tallahassee, FL, 2008.
Richards, G., Crosswalks maybe Becoming Extinct in California, Transportation Builder, Vol.
11(4), p. 27, 1999.
Rodegerdts, L., B. Nevers, B. Robinson, J. Ringert, P. Koonce, J. Bansen, T. Nguyen, J. McGill,
D. Stewart, J. Suggett, T. Neuman, N. Antonucci, K. Hardy, K. Courage, Signalized
Intersections: Information Guide, FHWA-HRT-04-091, Federal Highway Administration,
McLean, VA, 2004.
SafeTrec, Estimating Pedestrian Accident Exposure, UCB-ITS-PRR-2010-32, Institute of
Transportation Studies, California Path Program, Safe Transportation Education and Research
Center, University of California, Berkeley, CA, 2010.

124
Sarkar, S., T. Richard, and J. Hunt, Logistic Regression Model of Risk of Fatality in Vehicle–
Pedestrian Crashes on National Highways in Bangladesh, Transportation Research Record, No.
2264, pp. 128-137, 2011.
Savolainen, P., T. Gates, and T. Datta, Evaluation of the Effectiveness of a Comprehensive
Pedestrian Safety Program in a Major City, Proceedings of the 90th Annual Meeting of the
Transportation Research Board, Washington, D.C., 2011.
Schneider, R., O. Grembek, and M. Braughton, Pedestrian Crash Risk on Boundary Roadways:
A University Campus Case Study, Proceedings of the 92nd Annual Meeting of the
Transportation Research Board, Washington, D.C., 2013.
Schoon, C., and J. Van Minnen, The Safety of Roundabouts in The Netherlands, Traffic
Engineering & Control, Vol. 35(3), Hemming Information Services, London, United Kingdom,
pp. 141-148, 1994.
Schwartz, W., C. Porter, G. Payne, J. Suhrbier, P. Moe, and W. Wilkinson III, Guidebook on
Methods to Estimate Non-Motorized Travel: Overview of Methods, FHWA-RD-98-165, Federal
Highway Administration, McLean, VA, 1999.
Senevarante P., and J. Morall, Analysis of Factors Affecting the Choice of Route of Pedestrians,
Transportation Planning and Technology, Vol. 10, pp. 147-159, 1986.
Shen, L., H. Elbadrawi, and D. Ospina, Bicycle and Pedestrian Considerations at Roundabouts,
Final Report #WPI 0510824, Florida Department of Transportation, Tallahassee, FL, 2000.
Shin, H., G. Chen, and G. Hollsko, Pedestrian Safety Programs in Large Central Cities:
Institutional Settings and Identified Barriers, Proceedings of the 90th Annual Meeting of the
Transportation Research Board, Washington, D.C., 2011.
Tarko, A., and M. Azam, Pedestrian Injury Analysis with Consideration of the Selectivity Bias in
Linked Police-Hospital Data, Accident Analysis & Prevention, Vol. 43, pp. 1689-1695, 2011.
Teklenburg, J., H. Timmermans, and A. van Wagenberg, Space Syntax: Standardised Integration
Measures and Some Simulations, Environment and Planning B, Vol. 20(3), pp. 347-357, 2011.
Train, K., Discrete Choice Methods with Simulation, Cambridge University Press Publication,
2nd Edition, Cambridge, UK, 2009.
Truong, L., and S. Somenahalli, Using GIS to Identify Pedestrian-Vehicle Crash Hot Spots and
Unsafe Bus Stops, Journal of Public Transportation, Vol. 14(1), pp. 99-114, 2011.
Turner, P., Making Crosswalks Safer for Pedestrians, Final Report #BC010, Florida Department
of Transportation, Tallahassee, FL, 2000.
125
University of Georgia, What Georgia Drivers Must Know About Pedestrians.
www.police.uga.edu/documents/pedestriansafety.pdf, Accessed August 2013.
Ukkusuri, S., L. Miranda-Moreno, G. Ramadurai, and J. Isa-Tavarez, The Role of Built
Environment on Pedestrian Crash Frequency, Safety Science, Vol. 50, pp. 1141-1151, 2012.
Ukkusuri, S., S. Hasan, and H. Abdul Aziz, Random Parameter Model Used to Explain Effects
of Built-Environment Characteristics on Pedestrian Crash Frequency, Transportation Research
Record, No. 2237, pp. 98-106, 2011.
Ulfarsson, G., S. Kim, and K. Booth, Analyzing Fault in Pedestrian-Motor Vehicle Crashes in
North Carolina, Accident Analysis & Prevention, Vol. 42(6), pp.1805-1813, 2010.
Van Houten, R., and J. Malenfant, ITS Animated LED Signals Alert Drivers to Pedestrian
Threats, ITE Journal, 71(7), pp. 41-46, 2001.
Vasudevan, V., S. Pulugurtha, S. Nambisan, and M. Dangeti, Effectiveness of Signal-Based
Countermeasures on Pedestrian Safety: Findings from a Pilot Study, Proceedings of the 90th
Annual Meeting of the Transportation Research Board, Washington, D.C., 2011.
Vermunt, J., and J. Magidson, Latent Class Cluster Analysis, Applied Latent Class Analysis,
Cambridge: Cambridge University Press, pp. 89-106, 2002.
VN Engineers, Bicycle-Pedestrian Safety Corridors Study, South Western Regional Planning
Authority, Connecticut, 2012.
Weinberger, S., Experimental Crosswalk Warning Device Testing in California, Institute of
Transportation Engineers 67th Annual Meeting, Boston, MA, 1997.
Xie, Z., and J. Yan, Kernel Density Estimation of Traffic Accidents in a Network Space,
Computers, Environment and Urban Systems, Vol. 32(5), pp. 396-406, 2008.
Zaki, M., T. Sayed, A. Tageldin, and M. Hussein, Application of Computer Vision to the
Diagnosis of Pedestrian Safety Issues, Proceedings of the 92nd Annual Meeting of the
Transportation Research Board, Washington, D.C., 2013.
Zegeer, C., and C. Seiderman, Designing for Pedestrians, ITE Annual Meeting and Exhibit,
2001.
Zegeer, C., D. Nabors, D. Gelinne, N. Lefler, and M. Bushell, Pedestrian Safety Strategic Plan:
Recommendations for Research and Product Development, DTFH61-99-C-005, Federal
Highway Administration, U.S. Department of Transportation, Washington, D.C., 2010.
Zegeer, C., J. Stewart, H. Huang, and P. Lagerwey, Safety Effects of Marked versus Unmarked
Crosswalks at Uncontrolled Locations: Executive Summary and Recommended Guidelines,
FHWA-RD-01-075, Federal Highway Administration, McLean, VA, 2002.

126
Zegeer, C., J. Stewart, H. Huang, P. Lagerwey, J. Feaganes, and B. Campbell, Safety Effects of
Marked versus Unmarked Crosswalks at Uncontrolled Locations: Final Report and
Recommended Guidelines, DTFH61–92–C–00138, Federal Highway Administration, McLean,
VA, 2005.
Zegeer, C., J. Stutts, H. Huang, M. Cynecki, R. Houten, B. Alberson, R. Pfefer, T. Neuman, K.
Slack, and K. Hardy, Guidance for Implementation of the AASHTO Strategic Highway Safety
Plan, Volume 10: A Guide for Reducing Collisions Involving Pedestrian, National Cooperative
Research Program (NCHRP) 500, Transportation Research Board, Washington, D.C., 2004.
Zegeer, C., and M. Cynecki, Methods of Increasing Pedestrian Safety at Right-Turn-on-Red
Intersections, DTFH61-82-C-00046, Federal Highway Administration, McLean, VA, 1985.
Zhang, H., Identifying and Quantifying Factors Affecting Traffic Crash Severity in Louisiana,
PhD Dissertation, Louisiana State University, Baton Rouge, LA, 2010.
Zhang, Y., D. Yao, T. Qiu, L. Peng, and Y. Zhang, Pedestrian Safety Analysis in Mixed Traffic
Conditions Using Video Data, IEEE Transactions on Intelligent Transportation Systems, Vol.
13(4), 2012.
Zhou, Z., G. Ren, W. Wang, M. Ye, and H. Li, Crash Characteristics of Pedestrian Fatalities: A
Comparison of China and the United States, Proceedings of the 92nd Annual Meeting of the
Transportation Research Board, Washington, D.C., 2013.
Zucchini, W., Applied Smoothing Techniques, Part 1: Kernel Density Estimation, 2003.
Zupan, J., and B. Pushkarev, Pedestrian Travel Demand, Highway Research Record, No. 355,
pp. 37-53, 1971.