comprehensive housing needs assessment for fillmore county
TRANSCRIPT

Comprehensive Housing Needs Assessment For
Fillmore County, Minnesota
Prepared for:
Bluff Country Housing and Redevelopment Authority Rushford, Minnesota January 2009
615 First Avenue NE Suite 400 Minneapolis, MN 55413 612.338.0012

612-338-0012 (fax) 612-904-7979 615 First Avenue NE, Suite 400, Minneapolis, MN 55413
www.maxfieldresearch.com
March 11, 2009 Mr. Tom Falbo President Bluff Country Minnesota Multi County Housing and Redevelopment Authority 204 South Elm Street Rushford, MN 55971 Dear Mr. Falbo: Attached is the study Comprehensive Housing Needs Assessment for Fillmore County, Minne-sota conducted by Maxfield Research Inc. The study projects housing demand for each commu-nity in Fillmore County from 2008 to 2020. It also provides recommendations on the amount and types of housing that could be built to satisfy demand from current and future residents. The Comprehensive Housing Needs Assessment finds that household growth and changes in demographic characteristics and housing preferences will create demand for about 1,090 housing units in the County from 2008 to 2020. Included in this total is demand for about 750 ownership units and 335 rental and senior units. In total, we find demand for about 80 additional rental units from low- and moderate-income households. Assistance by the Bluff Country HRA and other government agencies may be necessary to ensure that the housing needs of these lower and moderate income households is provided. Detailed information regarding housing demand by community and recommended housing types can be found in the Conclusions and Recommenda-tions section at the end of the report. We have enjoyed performing this Market for you and are available should you have any ques-tions or need additional information. Sincerely, MAXIELD RESEARCH INC. Jay Thompson Vice President Attachment
ACKNOWLEDGMENT
MAXFIELD RESEARCH INC.
ACKNOWLEDGMENT
Financial support for this project was provided by:
Bluff Country Multi-County HRA Fillmore County
Minnesota Housing Partnership Semcac

TABLE OF CONTENTS
Page KEY FINDINGS ................................................................................................................ 1 PURPOSE AND SCOPE OF STUDY.............................................................................. 3 Study Impetus ................................................................................................................. 3 Scope of Work ................................................................................................................ 3 DEMOGRAPHIC ANALYSIS......................................................................................... 5 Introduction..................................................................................................................... 5 Population and Household Growth Trends and Projections ........................................... 6 Population Age Distribution Trends ............................................................................... 9 Household Tenure ........................................................................................................... 15 Household Income .......................................................................................................... 18 Household Income by Tenure ......................................................................................... 21 Household Type .............................................................................................................. 22 Employment Growth Trends........................................................................................... 24 Major Employers............................................................................................................. 30 Age of Housing Stock ..................................................................................................... 31 Residential Construction Trends 2000 through 2008...................................................... 33 MARKET CONDITIONS GENERAL-OCCUPANCY RENTAL HOUSING ........... 35 Introduction..................................................................................................................... 35 Fillmore County Rental Housing .................................................................................... 36 Housing Choice Voucher Program ................................................................................. 42 Pending Rental Developments ........................................................................................ 42 MARKET CONDITIONS SENIOR HOUSING ............................................................ 43 Introduction..................................................................................................................... 43 Senior Housing Defined.................................................................................................. 44 Market Rate Senior Developments in Fillmore County.................................................. 45 Pending Senior Housing Developments ......................................................................... 48 MARKET CONDITIONS FOR-SALE HOUSING........................................................ 51 Introduction..................................................................................................................... 51 Home Resales.................................................................................................................. 52 Current Supply of Homes on the Market ........................................................................ 55 New For-Sale Housing Subdivisions .............................................................................. 57

TABLE OF CONTENTS (continued)
Page
CONCLUSIONS AND RECOMMENDATIONS........................................................... 60 Introduction..................................................................................................................... 60 Demographic Profile and Housing Demand ................................................................... 61 Rental and Senior Housing Demand............................................................................... 62 For-Sale Housing Demand.............................................................................................. 65 Fillmore County Housing Recommendations................................................................. 68 Canton – Summary of Demographic and Housing Findings .......................................... 70 Canton Recommendations .............................................................................................. 71 Chatfield – Summary of Demographic and Housing Findings....................................... 72 Chatfield Recommendations ........................................................................................... 73 Fountain – Summary of Demographic and Housing Findings........................................ 74 Fountain Recommendations............................................................................................ 75 Harmony – Summary of Demographic and Housing Findings....................................... 76 Harmony Recommendations ........................................................................................... 77 Lanesboro – Summary of Demographic and Housing Findings ..................................... 78 Lanesboro Recommendations ......................................................................................... 79 Mabel – Summary of Demographic and Housing Findings ........................................... 80 Mabel Recommendations................................................................................................ 81 Ostrander – Summary of Demographic and Housing Findings ...................................... 82 Ostrander Recommendations .......................................................................................... 83 Peterson – Summary of Demographic and Housing Findings ........................................ 84 Peterson Recommendations ............................................................................................ 85 Preston – Summary of Demographic and Housing Findings.......................................... 86 Preston Recommendations .............................................................................................. 87 Rushford – Summary of Demographic and Housing Findings....................................... 88 Rushford Recommendations ........................................................................................... 89 Rushford Village – Summary of Demographic and Housing Findings .......................... 90 Rushford Village Recommendations............................................................................... 91 Spring Valley – Summary of Demographic and Housing Findings ................................ 92 Spring Valley Recommendations.................................................................................... 93 Whalen – Summary of Demographic and Housing Findings ......................................... 94 Whalen Recommendations ............................................................................................. 95 Wykoff – Summary of Demographic and Housing Findings ......................................... 96 Wykoff Recommendations ............................................................................................. 97 Townships – Summary of Demographic and Housing Findings .................................... 98 Townships Recommendations ........................................................................................ 99

LIST OF TABLES Table Number and Title Page 1. Population Growth Trends and Projections, Fillmore County, 1990 - 2020 ................ 7 2. Household Growth Trends and Projections, Fillmore County, 1990 - 2020 ................ 8 3. Population Age Distribution, Fillmore County, 1990 to 2020 ..................................... 10 4. Household Tenure Trends, Fillmore County, 1990 - 2008........................................... 16 5. Tenure by Age, Fillmore County, 2008........................................................................ 17 6. Household Income by Age of Householder, Fillmore County, 2008 ........................... 19 7. Household Income by Age of Householder, Fillmore County, 2013 ........................... 20 8. Tenure by Household Income, Fillmore County, 2008 ................................................ 21 9. Household Type Trends, Fillmore County, 1990 to 2008 ............................................ 23 10. Covered Employment by Industry, Fillmore County, 2000 and 2007.......................... 25 11. Resident Employment, Fillmore County, 1990 to 2008 ............................................... 27 12. Fillmore County Commuting Patterns, 2000................................................................ 28 13. Major Employers, Fillmore County, 2008.................................................................... 30 14. Age of Housing Stock, Fillmore County, 2008 ............................................................ 32 15. New Home Construction, Fillmore County, 2000 to 2008........................................... 33 16. Market Rate General Occupancy Housing, Fillmore County, December 2008 ........... 37 17. Subsidized General Occupancy Housing, Fillmore County, December 2008.............. 39 18. Market Rate Senior Housing, Fillmore County, December 2008................................. 46 19. Subsidized Senior Housing, Fillmore County, December 2008 ................................... 49 20. Volume and Median Sales Price of Homes Sold, Fillmore County, 2004 through 2008 53 21. Homes Sold by Price Range, Fillmore County, 2004 through 2008 ............................ 54 22. Homes Currently Listed For-Sale, Fillmore County Communities, January 2009....... 56 23. Recently Completed and Active Single Family Housing Developments, Fillmore
County, November 2008............................................................................................... 58 24. Demand for Additional Rental Housing, Fillmore County, 2008 to 2020.................... 64 25. Demand for Additional For-Sale Housing, Fillmore County, 2008 to 2020 ................ 67

FILLMORE COUNTY KEY FINDINGS
MAXFIELD RESEARCH INC. 1
Introduction Maxfield Research Inc. was engaged by the Bluff Country Minnesota Multi-County Housing and Redevelopment Authority to conduct a comprehensive housing needs assessment for Fillmore County. This study is an update of the previous comprehensive housing study conducted for Fillmore County by Maxfield Research in January 2003. Detailed calculations of housing demand from 2008 to 2020 can be found in the Conclusions and Recommendations section of the report. Recommendations on the amount and types of housing that should be developed to accommodate the housing needs in each community is presented as well. The following are key highlights from the comprehensive housing needs assessment. Key Findings 1. Fillmore County has been experiencing slow but steady population and household
growth. By 2020, Fillmore County is projected to have a population of over 25,100 peo-ple, including the portion of Chatfield in Olmstead County. This is up from an estimated 23,850 people in 2008 and 22,260 people in 2000.
2. Demand is projected for about 1,085 new housing units in Fillmore County during the
12-year period between 2008 and 2020. 3. Total projected housing demand by community from 2008 to 2020 is as follows (demand
factors household growth and replacement need of older, obsolete homes): • Chatfield = 170 units (15.5% of the County’s housing demand) • Rushford = 140 units (13%) • Spring Valley = 100 units (9%) • Preston = 78 units (7%) • Harmony = 65 units (6%) • Rushford Village = 34 units (3%) • Mabel = 30 units (3%) • Lanesboro = 25 units (2%) • Fountain = 24 units (2%) • Wykoff = 8 units (1%) • Canton = 5 units (<1%) • Ostrander = 4 units (<1%) • Peterson = 4 units (<1%) • Whalen = 3 units (<1%) • Townships = 400 units (36.5%)
4. About two-thirds of the demand for housing in Fillmore County will be driven by house-
hold growth. Household growth projections in this report were made by Maxfield Re-search Inc., based on Minnesota Demographic Center projections that were adjusted to reflect interviews with city representatives as well as recent building trends. It should be noted that because households are mobile and are willing to seek out various housing products in adjacent communities, the demand figures shown for each community may experience fluctuations based on local development trends.

FILLMORE COUNTY KEY FINDINGS
MAXFIELD RESEARCH INC. 2
5. Between 2008 and 2020, about 70% of the housing demand in the County is projected to be for owned housing and 30% for rental housing (including senior rental). When ex-cluding housing demand in the townships, which is entirely for owned housing, the re-maining demand in the 14 communities is for 351 owned units (51%) and 334 rental/sen-ior units (49%).
6. The projected demand for 1,085 housing units in Fillmore County from 2008 to 2020 is
shown by type of housing below. • Single-family = 650 units (60% of total demand) • Senior housing = 215 units (20%) • Rental housing = 120 units (11%) • For-sale multifamily = 100 units (9%)
7. With the exception of a few communities, there is an adequate supply of lots for single-
family homes in the County and private developers will likely meet the demand for new homes from higher-income buyers. The existing housing stock will meet most of the demand for modestly-priced single-family homes and rental units. Public assistance in the form of home rehabilitation loans for low- and moderate-income homeowners and af-fordable rental units will be needed to help maintain the quality of the affordable housing stock. This will be important to meet future housing needs, since most communities do not have enough growth to justify developing new apartment or senior buildings. Thus, maintaining the quality of the existing housing stock for future generations should be a high priority.
8. Almost all of the rental demand in Fillmore County between 2008 and 2020 will be in the
five largest communities – Chatfield, Harmony, Preston, Rushford, and Spring Valley. Most of the new rental units should have monthly rents below the payment standard for Housing Choice Vouchers in the County (currently $471 for 1BR units, $622 for 2BR units, and $832 for 3BR units). Public assistance may be necessary to develop units with rents that are affordable to moderate-income renters. Demand for new rental units in the remaining communities will be limited to a duplex or four-plex at most.
9. About 20% of total housing demand in Fillmore County between 2008 and 2020 is ex-
pected to be for senior housing. The following is senior housing demand in the County by service level. Most of this demand will be in the five largest communities, which have health care and other services that draw seniors from more rural areas.
• Adult rental (no services) = 72 units • Congregate = 60 units • Assisted living = 44 units • Memory care = 36 units
10. In addition to senior housing products that are age-restricted, almost all of the demand for
for-sale townhomes will be from empty-nesters and retirees seeking to downsize from their single-family homes. Townhomes should be one-level units with attached garages that are priced below $200,000.

FILLMORE COUNTY PUPOSE AND SCOPE OF STUDY
MAXFIELD RESEARCH INC. 3
Study Impetus Maxfield Research Inc. was engaged by the Bluff Country Minnesota Multi-County Housing and Redevelopment Authority to conduct a comprehensive housing needs assessment for Fillmore County. This study is an update of the previous comprehensive housing study conducted for Fillmore County by Maxfield Research in January 2003. The comprehensive housing needs assessment calculates demand from 2008 to 2020 for various types of housing in each community and the rural areas in the County. The study provides rec-ommendations on the amount and types of housing that should be developed to accommodate the housing needs of new and existing households. Scope of Work The scope of this study includes: • an analysis of the demographic growth trends and characteristics of the County to 2020; • an assessment of current housing characteristics in the County; • an analysis of the for-sale housing market in the County; • an analysis of the rental housing market in the County; • an analysis of the senior housing market in the County; • an estimate of the demand for all types of housing in the County from 2008 to 2020; and • recommendations of appropriate housing concepts to meet current and future needs of
County residents. The report contains primary and secondary research. Primary research includes interviews with rental property managers and owners, Realtors, developers, City staff and others involved in the housing market in Fillmore County. All of the market data on existing and pending housing de-velopments was collected by Maxfield Research Inc. and is accurate to the best of our knowl-edge. Secondary data, such as U.S. Census, is credited to the source and is used as a basis for analysis. Data was collected and analyzed for each city in the County as well as for the townships. A map on the following page shows the location of the cities and townships in the County.

FILLMORE COUNTY PUPOSE AND SCOPE OF STUDY
MAXFIELD RESEARCH INC. 4

FILLMORE COUNTY DEMOGRAPHIC ANALYSIS
MAXFIELD RESEARCH INC. 5
Demographic Analysis Introduction This section of the report examines factors related to the current and future demand for housing in Fillmore County, Minnesota. Included in this section is an analysis of:
Population and household growth trends and projections, projected age distribution, household income distribution, household types, household tenure (owner/renters), employment growth trends and characteristics, age of housing stock, and recent residential building permit trends.
This section of the report includes totals for each community within the County.

FILLMORE COUNTY DEMOGRAPHIC ANALYSIS
MAXFIELD RESEARCH INC. 6
Population and Household Growth Trends and Projections Tables 1 and 2 present population and household growth trends and projections for Fillmore County from 1990 projected to 2020. The data from 1990 and 2000 is from the U.S. Census, while the 2008 estimates and 2010 and 2020 projections were made by Maxfield Research Inc. based on Minnesota Demographic Center projections and recent housing development trends. It should be noted that the County figures include the portion of Chatfield in Olmstead County (about 500 people). Key findings of Tables 1 and 2 are: 4 Fillmore County’s population is projected to grow from 22,259 people in 2000 to almost
24,000 people in 2010. Between 2010 and 2020, the population is projected to increase by another 1,160 people.
4 Fillmore County added about 505 people during the 1990s. So far, the County has added
about 1,600 people this decade but growth has slowed the past two year as the national and state economies have slowed considerably.
4 About 10,000 people of the County’s total population live in the rural townships, with the
remainder living in the 14 communities. Housing development has been strong in the town-ships this decade, and thus the townships are projected to account for about half of the popu-lation growth this decade.
4 Chatfield is the largest community in Fillmore County, with about 2,700 people in 2008. A
portion of the City lies in Olmsted County. After Chatfield, the next largest community is Spring Valley with a population of about 2,600. The other communities range in size from 40 people (Whalan) to 1,800 people (Rushford).
4 Fillmore County is projected to add nearly 750 households between 2008 and 2020. Since
households represent occupied housing units, this growth translates into roughly the need for 750 housing units in the County over the 12-year period.
4 About 53% of the projected household growth in Fillmore County from 2008 to 2020 will be
in the communities. The townships are projected to see growth of about 300 households. Most new housing in the townships is single-family homes on farms or larger estates.
4 Chatfield is projected to have the greatest household growth in the County between 2008 and
2020, adding about 135 new households, or 11 households annually. This growth is double the growth of the next fastest growing community – Spring Valley, which is projected to add 60 households.
4 Overall, household growth is projected to slow next decade compared to this decade and the
1990s. This coincides with a projected slowdown in growth statewide.

FILLMORE COUNTY DEMOGRAPHIC ANALYSIS
MAXFIELD RESEARCH INC. 7
Estimate1990 2000 2008 2010 2020 No. Pct. No. Pct. No. Pct.
CitiesCanton 362 343 325 325 310 -19 -5.2 -18 -5.2 -15 -4.6Chatfield 2,226 2,394 2,700 2,735 3,000 168 7.5 341 14.2 265 9.7Fountain 327 343 400 400 440 16 4.9 57 16.6 40 10.0Harmony 1,081 1,080 1,140 1,150 1,210 -1 -0.1 70 6.5 60 5.2Lanesboro 858 788 855 865 875 -70 -8.2 77 9.8 10 1.2Mabel 745 766 825 835 870 21 2.8 69 9.0 35 4.2Ostrander 276 212 230 230 220 -64 -23.2 18 8.5 -10 -4.3Peterson 259 269 250 250 240 10 3.9 -19 -7.1 -10 -4.0Preston 1,530 1,426 1,430 1,440 1,480 -104 -6.8 14 1.0 40 2.8Rushford 1,485 1,696 1,790 1,770 1,840 211 14.2 74 4.4 70 4.0Rushford Village 705 714 785 790 820 9 1.3 76 10.6 30 3.8Spring Valley 2,461 2,518 2,665 2,675 2,780 57 2.3 157 6.2 105 3.9Whalan 94 64 40 40 50 -30 -31.9 -24 -37.5 10 25.0Wykoff 493 460 420 420 400 -33 -6.7 -40 -8.7 -20 -4.8 Subtotal 12,902 13,073 13,855 13,925 14,535 171 1.3 852 6.1 610 4.4
Townships 8,852 9,186 9,990 10,050 10,600 334 3.8 864 9.4 550 5.5
Fillmore County Total 21,754 22,259 23,845 23,975 25,135 505 2.3 1,716 7.7 1,160 4.8
Minnesota 4,375,099 4,919,479 5,320,000 5,445,000 5,940,000 544,380 12.4 525,521 10.7 495,000 9.1
Sources: U.S. Census, Minnesota Demographic Center, Maxfield Research Inc.
TABLE 1POPULATION GROWTH TRENDS AND PROJECTIONS
FILLMORE COUNTY1990 - 2020
1990 - 2000CensusChangePopulation
Projection 2010-20202000-2010

FILLMORE COUNTY DEMOGRAPHIC ANALYSIS
MAXFIELD RESEARCH INC. 8
Estimate1990 2000 2008 2010 2020 No. Pct. No. Pct. No. Pct.
CitiesCanton 160 157 155 155 150 -3 -1.9 -2 -1.1 -5 -3.4Chatfield 846 930 1,090 1,105 1,225 84 9.9 175 18.8 120 10.9Fountain 126 131 155 155 175 5 4.0 24 18.3 20 12.9Harmony 461 477 532 540 575 16 3.5 63 13.2 35 6.5Lanesboro 385 384 400 405 415 -1 -0.3 21 5.5 10 2.5Mabel 316 337 377 380 400 21 6.6 43 12.8 20 5.3Ostrander 99 100 100 100 95 1 1.0 0 0.0 -5 -5.0Peterson 101 98 95 95 95 -3 -3.0 -3 -3.1 0 0.0Preston 584 583 630 635 665 -1 -0.2 52 8.9 30 4.7Rushford 628 704 775 785 820 76 12.1 81 11.5 35 4.5Rushford Village 219 264 300 305 330 45 20.5 41 15.5 25 8.2Spring Valley 1,001 1,026 1,100 1,105 1,160 25 2.5 79 7.7 55 5.0Whalan* 42 34 22 20 25 -8 -19.0 -14 -41.2 5 25.0Wykoff 198 207 205 205 200 9 4.5 -2 -1.0 -5 -2.4 Subtotal 5,166 5,432 5,936 5,990 6,330 266 5.1 558 9.3 340 5.4
Townships 3,009 3,217 3,650 3,700 4,000 208 6.9 483 15.0 300 8.1
Fillmore County Total 8,175 8,649 9,586 9,690 10,330 474 5.8 1,041 12.0 640 7.4
Minnesota 1,647,853 1,895,127 2,078,000 2,141,800 2,374,000 247,274 15.0 246,673 13.0 232,200 12.3
* As of 2008, Whalen's housing stock consists of 22 homes occupied by permanent residents and 18 that are occupied seasonally.
Sources: U.S. Census, Minnesota Demographic Center, Maxfield Research Inc.
Population ChangeCensus Projection 1990 - 2000 2000-2010 2010-2020
TABLE 2HOUSEHOLD GROWTH TRENDS AND PROJECTIONS
FILLMORE COUNTY1990 - 2020

FILLMORE COUNTY DEMOGRAPHIC ANALYSIS
MAXFIELD RESEARCH INC. 9
4 The higher rate of household growth compared to population growth in the County can be at-tributed to declining household sizes (2.66 people per household in 1990 to 2.57 in 2000 and a projected 2.46 in 2010). These rates are declining because of several factors, including the aging of the population, couples’ decisions to have fewer children than their parents or no children at all, as well as an increase in single-person households. In 2020, the average household size is projected to decline to 2.43 people per household.
Population Age Distribution Trends Table 3 shows the age distribution of Fillmore County’s population in 1990 and 2000, as well as projections for 2010 and 2020. The 1990 and 2000 distributions are from the U.S. Census, while the projections were made by Maxfield Research Inc. based on data from the State Demographic Center and Claritas Inc. The tables show the age distribution for each community in the County, as well as the townships as a whole. The following are key trends noted in the age distribution of Fillmore County’s population: 4 With the aging of the baby boom generation, the greatest growth in Fillmore County from
2010 to 2020 will be among people age 55 to 74, as their population is projected to increase by 32% – or a total of about 1,600 people. This growth will increase the demand for mainte-nance-free living, such as townhomes.
4 With an increasing proportion of the population becoming empty-nesters, the number of
children age 17 and under is project to grow only slightly. The younger adult population is projected to decline, losing 320 people between the ages of 25 and 34 between 2010 and 2020. The adult population is also projected to decline, losing 670 people between the ages of 45 and 54 between 2010 and 2020. However, the 35 to 44 age group is projected to grow, adding 485 people.
Distribution of the Adult PopulationFillmore County, 1990 to 2020
0
1,000
2,000
3,000
4,000
5,000
6,000
7,000
8,000
18-24 25-44 45-64 65+Age Group
No.
of P
eopl
e
1990200020102020

FILLMORE COUNTY DEMOGRAPHIC ANALYSIS
MAXFIELD RESEARCH INC. 10
1990 2000 2010 2020 No. Pct. No. Pct.17 & under 6,069 5,856 5,535 5,765 -321 -5.5 230 4.218-24 1,506 1,558 1,690 1,510 132 8.5 -180 -10.725-34 2,919 2,317 2,890 2,570 573 24.7 -320 -11.135-44 2,791 3,334 2,785 3,260 -549 -16.5 475 17.145-54 2,028 2,862 3,660 2,995 798 27.9 -665 -18.255-64 2,092 2,077 3,020 3,720 943 45.4 700 23.265-74 2,172 1,944 1,970 2,875 26 1.3 905 45.975+ 2,177 2,311 2,425 2,440 114 4.9 15 0.6 Total 21,754 22,259 23,975 25,135 1,716 7.9 1,160 5.2
Age: 1990 2000 2010 2020 No. Pct. No. Pct.17 & under 89 75 55 45 -20 -26.7 -10 -18.218-24 22 18 15 15 -3 -16.7 0 0.025-34 47 27 25 20 -2 -7.4 -5 -20.035-44 49 60 40 35 -20 -33.3 -5 -12.545-54 25 49 60 40 11 22.4 -20 -33.355-64 43 28 55 65 27 96.4 10 18.265-74 44 45 30 60 -15 -33.3 30 100.075+ 43 41 45 30 4 9.8 -15 -33.3 Total 362 343 325 310 -18 -5.0 -15 -4.4
1990 2000 2010 2020 No. Pct. No. Pct.17 & under 581 622 655 745 33 5.3 90 13.718-24 167 178 215 210 37 20.8 -5 -2.325-34 340 314 400 430 86 27.4 30 7.535-44 274 374 370 430 -4 -1.1 60 16.245-54 201 244 360 340 116 47.5 -20 -5.655-64 194 167 215 300 48 28.7 85 39.565-74 223 199 180 240 -19 -9.5 60 33.375+ 246 296 315 305 19 6.4 -10 -3.2 Total 2,226 2,394 2,735 3,000 316 14.2 290 12.1
Population
Population
FILLMORE COUNTY1990 to 2020
Fillmore County Total
Change
TABLE 3POPULATION AGE DISTRIBUTION
2010-20202000-2010
Change
Change
2000-2010 2010-2020
Canton
Population
Chatfield
2000-2010 2010-2020

FILLMORE COUNTY DEMOGRAPHIC ANALYSIS
MAXFIELD RESEARCH INC. 11
1990 2000 2010 2020 No. Pct. No. Pct.17 & under 92 90 95 110 5 5.6 15 15.818-24 32 39 45 50 6 15.4 5 11.125-34 51 42 60 55 18 42.9 -5 -8.335-44 37 62 55 70 -7 -11.3 15 27.345-54 30 34 60 50 26 76.5 -10 -16.755-64 32 29 35 50 6 20.7 15 42.965-74 31 23 25 30 2 8.7 5 20.075+ 22 24 25 25 1 4.2 0 0.0 Total 327 343 400 440 57 17.4 40 11.7
1990 2000 2010 2020 No. Pct. No. Pct.17 & under 239 223 195 190 -28 -12.6 -5 -2.618-24 66 54 60 50 6 11.1 -10 -16.725-34 116 94 95 95 1 1.1 0 0.035-44 128 135 120 115 -15 -11.1 -5 -4.245-54 83 132 155 135 23 17.4 -20 -12.955-64 119 112 185 210 73 65.2 25 13.565-74 143 125 125 205 0 0.0 80 64.075+ 187 205 215 210 10 4.9 -5 -2.3 Total 1,081 1,080 1,150 1,210 70 6.5 60 5.6
1990 2000 2010 2020 No. Pct. No. Pct.17 & under 206 142 130 105 -12 -8.5 -25 -19.218-24 70 54 45 35 -9 -16.7 -10 -22.225-34 92 77 70 55 -7 -9.1 -15 -21.435-44 119 115 110 95 -5 -4.3 -15 -13.645-54 68 129 135 120 6 4.7 -15 -11.155-64 77 98 180 200 82 83.7 20 11.165-74 120 71 105 170 34 47.9 65 61.975+ 106 102 80 85 -22 -21.6 5 6.3 Total 858 788 855 865 67 7.8 10 1.3
Population
Population
TABLE 3POPULATION AGE DISTRIBUTION
FILLMORE COUNTY1990 to 2020(continued)
2010-2020
Population
Change
Fountain
Harmony
Lanesboro
Change
Change2000-2010 2010-2020
2000-2010 2010-2020
2000-2010

FILLMORE COUNTY DEMOGRAPHIC ANALYSIS
MAXFIELD RESEARCH INC. 12
1990 2000 2010 2020 No. Pct. No. Pct.17 & under 136 154 155 175 1 0.6 20 12.918-24 32 39 50 40 11 28.2 -10 -20.025-34 76 63 90 85 27 42.9 -5 -5.635-44 73 81 70 80 -11 -13.6 10 14.345-54 48 86 100 85 14 16.3 -15 -15.055-64 96 70 120 130 50 71.4 10 8.365-74 117 105 80 140 -25 -23.8 60 75.075+ 167 168 170 135 2 1.2 -35 -20.6 Total 745 766 835 870 69 9.3 35 4.6
1990 2000 2010 2020 No. Pct. No. Pct.17 & under 53 40 40 35 0 0.0 -5 -12.518-24 12 10 15 10 5 50.0 -5 -33.325-34 21 22 25 20 3 13.6 -5 -20.035-44 33 21 30 30 9 42.9 0 0.045-54 19 31 25 30 -6 -19.4 5 20.055-64 23 18 35 25 17 94.4 -10 -28.665-74 45 27 25 45 -2 -7.4 20 80.075+ 70 43 35 25 -8 -18.6 -10 -28.6 Total 276 212 230 220 18 6.5 -10 -4.7
1990 2000 2010 202017 & under 75 51 40 35 -11 -21.6 -5 -12.518-24 17 17 15 10 -2 -11.8 -5 -33.325-34 22 19 20 15 1 5.3 -5 -25.035-44 35 34 30 30 -4 -11.8 0 0.045-54 28 38 35 30 -3 -7.9 -5 -14.355-64 22 25 35 30 10 40.0 -5 -14.365-74 34 27 30 40 3 11.1 10 33.375+ 26 58 45 50 -13 -22.4 5 11.1 Total 259 269 250 240 -19 -7.3 -10 -3.7
POPULATION AGE DISTRIBUTIONFILLMORE COUNTY
1990 to 2020(continued)
TABLE 3
Population
PopulationChange
1990-2000 2000-20102000-2010 2010-2020
Peterson
2000-2010 2010-2020
Change2000-2010Population
Change
Mabel
Ostrander
2010-2020

FILLMORE COUNTY DEMOGRAPHIC ANALYSIS
MAXFIELD RESEARCH INC. 13
1990 2000 2010 2020 No. Pct. No. Pct.17 & under 387 335 260 255 -75 -22.4 -5 -1.918-24 121 75 75 65 0 0.0 -10 -13.325-34 216 157 120 130 -37 -23.6 10 8.335-44 192 217 170 140 -47 -21.7 -30 -17.645-54 113 165 210 175 45 27.3 -35 -16.755-64 170 132 210 280 78 59.1 70 33.365-74 130 159 125 210 -34 -21.4 85 68.075+ 201 186 270 230 84 45.2 -40 -14.8 Total 1,530 1,426 1,440 1,480 14 0.9 45 3.2
1990 2000 2010 2020 No. Pct. No. Pct.17 & under 397 390 340 335 -50 -12.8 -5 -1.518-24 99 120 115 95 -5 -4.2 -20 -17.425-34 216 180 215 195 35 19.4 -20 -9.335-44 192 221 180 200 -41 -18.6 20 11.145-54 101 214 240 190 26 12.1 -50 -20.855-64 142 129 260 285 131 101.6 25 9.665-74 172 164 150 300 -14 -8.5 150 100.075+ 166 278 265 240 -13 -4.7 -25 -9.4 Total 1,485 1,696 1,770 1,840 69 4.6 75 4.4
1990 2000 2010 2020 No. Pct. No. Pct.17 & under 159 198 175 165 -23 -11.6 -10 -5.718-24 59 41 60 45 19 46.3 -15 -25.025-34 76 69 55 75 -14 -20.3 20 36.435-44 91 120 110 80 -10 -8.3 -30 -27.345-54 73 115 155 140 40 34.8 -15 -9.755-64 67 79 125 160 46 58.2 35 28.065-74 57 54 65 100 11 20.4 35 53.875+ 123 38 45 55 7 18.4 10 22.2 Total 705 714 790 820 76 10.8 30 4.2
Preston
Change2000-2010 2010-2020
2010-2020
Rushford
(continued)
Change2000-2010Population
Rushford Village
Population
PopulationChange
2000-2010 2010-2020
TABLE 3POPULATION AGE DISTRIBUTION
FILLMORE COUNTY1990 to 2020

FILLMORE COUNTY DEMOGRAPHIC ANALYSIS
MAXFIELD RESEARCH INC. 14
1990 2000 2010 2020 No. Pct. No. Pct.17 & under 655 656 620 650 -36 -5.5 30 4.818-24 186 209 225 190 16 7.7 -35 -15.625-34 354 290 375 365 85 29.3 -10 -2.735-44 313 362 300 350 -62 -17.1 50 16.745-54 209 312 390 310 78 25.0 -80 -20.555-64 193 201 300 360 99 49.3 60 20.065-74 241 193 200 280 7 3.6 80 40.075+ 310 295 265 275 -30 -10.2 10 3.8 Total 2,461 2,518 2,675 2,780 157 6.4 105 4.2
1990 2000 2010 2020 No. Pct. No. Pct.17 & under 20 11 5 7 -6 -54.5 2 40.018-24 6 5 3 4 -2 -40.0 1 33.325-34 10 5 4 4 -1 -20.0 0 0.035-44 18 9 5 6 -4 -44.4 1 20.045-54 8 13 7 9 -6 -46.2 2 28.655-64 15 5 8 9 3 60.0 1 12.565-74 9 13 4 6 -9 -69.2 2 50.075+ 8 3 4 5 1 33.3 1 25.0 Total 94 64 40 50 -24 -25.5 10 15.6
1990 2000 2010 2020 No. Pct. No. Pct.17 & under 139 93 75 70 -18 -19.4 -5 -6.718-24 24 36 20 20 -16 -44.4 0 0.025-34 76 45 55 40 10 22.2 -15 -27.335-44 52 65 35 50 -30 -46.2 15 42.945-54 43 57 65 35 8 14.0 -30 -46.255-64 47 44 55 65 11 25.0 10 18.265-74 49 49 45 55 -4 -8.2 10 22.275+ 63 71 70 65 -1 -1.4 -5 -7.1 Total 493 460 420 400 -40 -8.1 -20 -4.3
1990 to 2020(continued)
Change
POPULATION AGE DISTRIBUTIONFILLMORE COUNTY
TABLE 3
Population
Wykoff
Change2000-2010 2010-2020
2000-2010 2010-2020
Spring Valley
Change2000-2010 2010-2020Population
Population
Whalen

FILLMORE COUNTY DEMOGRAPHIC ANALYSIS
MAXFIELD RESEARCH INC. 15
1990 2000 2010 2020 No. Pct. No. Pct.17 & under 2,841 2,776 2,695 2,845 -81 -2.9 150 5.618-24 593 663 730 670 67 10.1 -60 -8.225-34 1,206 913 1,280 980 367 40.2 -300 -23.435-44 1,185 1,458 1,160 1,555 -298 -20.4 395 34.145-54 979 1,243 1,665 1,305 422 34.0 -360 -21.655-64 852 940 1,200 1,550 260 27.7 350 29.265-74 757 690 785 995 95 13.8 210 26.875+ 439 503 575 705 72 14.3 130 22.6 Total 8,852 9,186 10,050 10,600 904 10.2 515 5.6
Sources: Census Bureau; MN Demographic Center; Claritas Inc.; Maxfield Research Inc.
Townships
Change2000-2010 2010-2020Population
FILLMORE COUNTY1990 to 2020(continued)
TABLE 3POPULATION AGE DISTRIBUTION
4 When the first baby boomers begin turning age 75 shortly after 2020, demand for senior housing will rise dramatically. Until then, most demand from baby boomers will continue to be for single-family homes and, increasingly, for townhomes.
Household Tenure Table 4 shows the number of owner and renter households in Fillmore County in 1990, 2000, and an estimate for 2008. Table 5 shows the estimated number of owner and renter households by age of householder in each of the communities and the townships as a whole in 2008. The 1990 and 2000 figures are from the Census Bureau and the 2008 figures are estimated by Max-field Research, based on recent housing trends. Key points derived from the tables are:
In 1990, about 79% of all households in Fillmore County owned their housing. By 2000, that percentage increased slightly to 81%, as about 93% of the new households added during the 1990s were owners. Based on recent development trends, we project that the 2008 home-ownership rate is 82.6%. The increasing homeownership rate is primarily due to the aging of the baby boomers into peak homeownership years, increased development of single-family homes in the County, and low mortgage interest rates that made homeownership more ob-tainable for younger households.

FILLMORE COUNTY DEMOGRAPHIC ANALYSIS
MAXFIELD RESEARCH INC. 16
Table 5 shows that renter growth in Fillmore County during the 1990s was concentrated in the communities, particularly Chatfield, which gained a total of 21 renters. However, the townships lost a total of -112 renters. The loss of renters in the townships is due primarily to fewer homes being available for rent, while renter growth in the communities is due to new apartment developments (senior and general-occupancy), as well as single-family homes be-ing rented. These trends are projected to continue through 2020.
As households progress through their life cycle, housing needs change. The proportion of renter households decreases significantly as households age out of their young-adult years. However, by the time households reach their senior years, rental housing often becomes a more viable option than homeownership, as seniors look for more maintenance-free housing options.
Pct.Own Rent Own Rent Own Rent Own Rent Owner
CitiesCanton 118 42 140 17 138 17 -2 0 -- Chatfield 655 191 718 212 862 228 144 16 90.0%Fountain 113 13 110 21 122 33 12 12 50.0%Harmony 357 104 377 100 393 139 16 39 29.1%Lanesboro 282 103 284 100 298 102 14 2 87.5%Mabel 265 51 282 55 294 83 12 28 30.0%Ostrander 84 15 80 20 79 21 -1 1 -- Peterson 88 13 78 20 76 19 -2 -1 66.7%Preston 446 138 459 124 481 149 22 25 46.8%Rushford 456 172 529 175 621 154 92 -21 129.6%Rushford Village 192 27 244 20 282 18 38 -2 105.6%Spring Valley 757 244 786 240 838 262 52 22 70.3%Whalan 38 4 30 4 20 2 -10 -2 -- Wykoff 174 24 176 31 175 30 -1 -1 --
Subtotal 4,025 1,141 4,293 1,139 4,679 1,257 386 118 76.6%
Townships 2,409 600 2,729 488 3,238 412 509 -76 117.6%
Fillmore County 6,434 1,741 7,022 1,627 7,917 1,669 895 42 95.5%
Homeownership Rate
Sources: U.S. Census; Claritas Inc.; Maxfield Research Inc.
TABLE 4HOUSEHOLD TENURE TRENDS
FILLMORE COUNTY1990 - 2008
82.6%78.7%
Households Change, 2000 to 20081990 20082000
81.2%

FILLMORE COUNTY DEMOGRAPHIC ANALYSIS
MAXFIELD RESEARCH INC. 17
Own Rent Own Rent Own Rent Own Rent Own Rent Own Rent Own Rent Own RentCitiesCanton 2 1 8 5 16 2 34 2 31 1 15 1 33 4 139 16Chatfield 18 46 144 70 179 23 184 23 112 13 89 13 135 41 861 229Fountain 3 6 23 12 23 4 28 4 19 1 10 2 16 4 122 33Harmony 8 9 24 25 60 10 78 9 88 15 56 16 79 55 393 139Lanesboro 2 7 15 23 44 14 69 6 101 6 36 23 32 22 299 101Mabel 12 5 37 16 36 6 49 7 60 5 46 10 55 33 295 82Ostrander 2 2 9 2 16 1 10 1 15 2 11 4 17 8 80 20Peterson 0 1 7 4 12 5 17 3 16 1 14 2 11 2 77 18Preston 7 17 46 25 63 18 101 21 102 9 63 13 100 45 482 148Rushford 14 22 80 34 86 13 122 12 139 14 85 8 95 51 621 154Rushford Village 5 3 26 1 48 2 76 6 58 1 41 1 28 4 282 18Spring Valley 18 50 140 47 148 23 204 27 148 13 98 17 80 87 836 264Whalan 1 0 2 0 2 1 4 0 4 1 3 0 4 0 20 2Wykoff 1 5 23 12 17 2 34 2 32 4 23 3 44 3 174 31
Subtotal 93 174 584 276 750 124 1,010 123 925 86 590 113 729 359 4,681 1,255
Townships 44 56 395 181 532 65 820 55 616 12 448 13 382 31 3,237 413
Fillmore County 137 230 979 457 1,282 189 1,830 178 1,541 98 1,038 126 1,111 390 7,918 1,668
Sources: U.S. Census, Maxfield Research Inc.
Age 55 - 64 Age 65 - 74 Age 75+ TotalAge 15 - 24 Age 25 - 34 Age 35 - 44 Age 45 - 54
TABLE 5TENURE BY AGE
FILLMORE COUNTY2008

FILLMORE COUNTY DEMOGRAPHIC ANALYSIS
MAXFIELD RESEARCH INC. 18
Household Income The estimated distribution of households by income in Fillmore County for 2008 and 2013 is shown in Tables 6 and 7. The data was estimated by Maxfield Research and is based on income trends provided by Claritas Inc., a national demographics firm. The data helps ascertain the de-mand for different housing products based on the size of the market at specific cost levels. The Department of Housing and Urban Development defines affordable housing costs as less than 30% of a household’s adjusted gross income. Maxfield Research Inc. uses a figure of 25% to 30% for younger households and 40% or more for seniors, since seniors generally have lower living expenses and can often sell their homes and use the proceeds toward housing payments. The following are key points from Table 7: 4 The overall median household income in Fillmore County is estimated at about $46,700 in
2008. This is lower than the state median of $56,800. However, the state median is boosted by much higher incomes in the Twin Cities Metro Area, which had a median household in-come of $62,850 in 2008.
4 As shown in Table 6 and the chart below, Fillmore County’s median income peaks in the 45-
to-54-year-old age group at about $62,500, as these householders are generally in their peak earning years. Seniors over age 75 had the lowest median income at under $24,000. While their incomes are lower, most seniors also have fewer expenses and often own their home out-right.
Income Trends by Age of HouseholderFillmore County, 2008 to 2013
0
500
1,000
1,500
2,000
2,500
15-24 25-34 35-44 45-54 55-64 65 -74 75+
Age of Householder
# of
Hou
seho
lds
$0
$10,000
$20,000
$30,000
$40,000
$50,000
$60,000
$70,000M
edia
n In
com
e
2008 2013 2008 Income

FILLMORE COUNTY DEMOGRAPHIC ANALYSIS
MAXFIELD RESEARCH INC. 19
Total 15-24 25-34 35-44 45-54 55-64 65 -74 75+
CommunitiesLess than $15,000 624 41 58 60 61 96 76 232$15,000 to $24,999 666 54 41 58 78 95 112 230$25,000 to $34,999 726 27 99 94 104 139 115 149$35,000 to $49,999 1,058 77 194 127 150 155 155 201$50,000 to $74,999 1,429 35 270 286 298 267 125 149$75,000 to $99,999 763 8 140 124 236 131 56 68$100,000 or more 669 25 59 126 206 129 65 60 Total 5,936 267 860 874 1,133 1,011 703 1,088
Median Income $48,487 $37,230 $53,581 $58,632 $64,546 $51,997 $39,722 $30,526
TownshipsLess than $15,000 511 14 58 42 59 72 91 175$15,000 to $24,999 500 6 76 59 45 79 61 174$25,000 to $34,999 500 47 105 73 71 74 84 45$35,000 to $49,999 563 14 107 97 153 106 92 -6$50,000 to $74,999 868 12 159 145 267 154 102 29$75,000 to $99,999 455 3 53 129 176 84 10 0$100,000 or more 254 4 17 52 105 61 20 -5 Total 3,650 100 576 597 875 628 461 413
Median Income $43,367 $31,329 $41,783 $54,638 $60,260 $47,828 $34,289 $16,815
Fillmore CountyLess than $15,000 1,136 56 116 102 119 168 168 407$15,000 to $24,999 1,166 59 117 116 123 173 173 404$25,000 to $34,999 1,225 74 204 167 176 212 198 194$35,000 to $49,999 1,621 91 301 224 303 260 246 195$50,000 to $74,999 2,297 48 429 431 565 420 227 177$75,000 to $99,999 1,218 11 193 253 412 215 66 68$100,000 or more 923 28 76 178 310 191 85 55 Total 9,586 367 1,436 1,471 2,008 1,639 1,164 1,501
Median Income $46,709 $34,197 $49,004 $57,289 $62,522 $50,356 $37,607 $23,499
Sources: Claritas, Inc. Maxfield Research Inc.
2008
Age of Householder
TABLE 6HOUSEHOLD INCOME BY AGE OF HOUSEHOLDER
FILLMORE COUNTY(Number of Households)

FILLMORE COUNTY DEMOGRAPHIC ANALYSIS
MAXFIELD RESEARCH INC. 20
Total 15-24 25-34 35-44 45-54 55-64 65 -74 75+
CommunitiesLess than $15,000 499 37 52 49 47 110 75 129$15,000 to $24,999 532 33 45 38 62 81 81 193$25,000 to $34,999 672 37 63 64 86 131 96 195$35,000 to $49,999 1,003 47 217 88 100 146 160 244$50,000 to $74,999 1,391 76 277 194 222 255 149 219$75,000 to $99,999 947 18 184 139 224 198 86 98$100,000 or more 1,142 33 147 148 302 244 112 157 Total 6,186 280 984 721 1,043 1,165 759 1,234
Median Income $56,945 $45,760 $60,405 $65,503 $75,436 $61,204 $46,946 $41,157
TownshipsLess than $15,000 495 9 45 42 51 79 90 178$15,000 to $24,999 461 18 70 52 25 91 68 138$25,000 to $34,999 450 24 89 57 66 70 90 54$35,000 to $49,999 529 21 98 118 125 114 71 -18$50,000 to $74,999 814 7 134 145 241 156 134 -3$75,000 to $99,999 523 3 89 122 159 111 40 -0$100,000 or more 422 3 41 109 163 107 16 -17 Total 3,695 85 566 646 830 727 509 332
Median Income $47,507 $31,392 $47,139 $59,133 $65,365 $51,639 $36,308 $13,971
Fillmore CountyLess than $15,000 994 46 97 92 98 189 166 307$15,000 to $24,999 994 51 115 90 87 172 148 331$25,000 to $34,999 1,122 61 151 122 152 201 186 249$35,000 to $49,999 1,532 68 315 207 225 260 231 226$50,000 to $74,999 2,205 82 411 340 464 411 283 215$75,000 to $99,999 1,470 21 273 261 383 308 127 97$100,000 or more 1,564 36 188 257 465 351 127 140 Total 9,881 365 1,550 1,367 1,873 1,892 1,268 1,566
Median Income $53,385 $40,526 $55,868 $62,777 $70,196 $57,571 $43,672 $30,820
Sources: Claritas, Inc. Maxfield Research Inc.
2013
Age of Householder
TABLE 7HOUSEHOLD INCOME BY AGE OF HOUSEHOLDER
FILLMORE COUNTY(Number of Households)

FILLMORE COUNTY DEMOGRAPHIC ANALYSIS
MAXFIELD RESEARCH INC. 21
Household Income by Tenure Table 8 and the graph show the estimated number of owner and renter households within eight income ranges in Fillmore County as of 2008. This information is helpful as it shows the impact of income on housing choice. Key points derived from the table are: There is a positive relationship between income and homeownership, as the percentage of
households that own their housing increases with income (from 61% among those with in-comes below $15,000 to 99% among those with incomes of $150,000 or more).
About half of the County’s renters in 2008 had incomes below $25,000, and based on spend-
ing no more than 30% of their income for gross rent, could not afford more than $650 per month for rent plus utilities. As shown in Table 15 in the Rental Section of this report, al-most all of the County’s rental units have rents well below $650 per month.
Most affordable rental buildings financed with the Low Income Housing Tax Credit program
have income limits set at 60% of median household income – or $23,820 for a single-person household increasing to $36,720 for a five-person household. Adjusting for household size, we estimate that about 15% to 20% of the County’s current renters – or just over 250 renters – would be income-eligible for affordable rental developments. About 40% of the renters have very-low-incomes and would be eligible for deep-subsidized rental buildings where residents pay 30% of their adjusted gross income for rent. The remaining 40% to 45% of renters have higher incomes and would seek market rate units.
No. Pct. No. Pct.
Less than $15,000 690 60.8 446 39.2$15,000 to $24,999 796 68.3 370 31.7$25,000 to $34,999 969 79.1 256 20.9$35,000 to $49,999 1,366 84.2 255 15.8$50,000 to $74,999 2,034 88.6 263 11.4$75,000 to $99,999 1,157 95.0 61 5.0$100,000 to $149,999 646 97.9 14 2.1$150,000 or more 260 98.9 3 1.1Total 7,918 82.6 1,668 17.4
Median Income
Source: US Census Bureau; Maxfield Research Inc.
$51,700 $25,700
Own Rent
TABLE 8TENURE BY HOUSEHOLD INCOME
FILLMORE COUNTY2008

FILLMORE COUNTY DEMOGRAPHIC ANALYSIS
MAXFIELD RESEARCH INC. 22
It is likely that most of the 1,500 owner households with incomes below $25,000 in 2008 were seniors. Most own their homes outright, and thus their monthly housing expense is still low since they do not have a mortgage. Otherwise, most buyers of single-family homes need incomes well above $25,000 to afford the monthly cost.
Tenure by Household IncomeFillmore County, 2008
690 796 9691,366
2,034
1,157
646260
370256
255
263
3
14
61
446
0
250
500
750
1,000
1,250
1,500
1,750
2,000
2,250
2,500
<$15K $15-24K $25-$34K
$35-$49K
$50-$74K
$75-$99K
$100-$149K
$150K+
Hou
seho
lds
Rent
Own
Household Type Table 9 on the following page show a breakdown of the type of households present in Fillmore County in 1990 and 2000 and estimated for 2008. The 1990 and 2000 figures are from the U. S. Census Bureau, while the 2008 estimates are made by Maxfield Research based on data from Claritas Inc. and the Minnesota Demographic Center. The data is useful in assessing housing demand since the household composition often dictates the type of housing needed and preferred. Key points derived from the table are: 4 Since 1990, Fillmore County has seen a decreasing proportion of married couples with chil-
dren and an increase in the proportion of married couples without children, non-family households and other family households. This shift has occurred throughout Minnesota and is due to several factors, including couples waiting longer to have children, baby boomers ag-ing into their empty nester years, an increase in single parents, and the societal trend of un-married couples living together.
4 Overall, the communities in Fillmore County have a much greater proportion of persons liv-
ing alone and a lower proportion of married couples with children. This is largely due to the number of seniors living in apartments or single-family homes. This is a trend that is likely to continue through 2020, as single seniors often move from rural areas into communities and many families seek housing on larger estates in rural areas.

FILLMORE COUNTY DEMOGRAPHIC ANALYSIS
MAXFIELD RESEARCH INC. 23
Non - Family Family
Other Married Married OtherTotal Households (Roommates) With Children W/O Children Family
1990 2000 2008 1990 2000 2008 1990 2000 2008 1990 2000 2008 1990 2000 2008 1990 2000 2008Number of HouseholdsCanton 160 157 155 61 52 50 1 10 13 35 30 27 49 42 41 14 23 24Chatfield 846 958 1,090 224 255 320 21 42 45 250 259 285 290 265 306 61 109 134Fountain 126 136 155 35 27 35 2 9 12 41 40 44 38 49 56 10 6 8Harmony 461 499 532 156 164 181 12 14 29 98 82 83 153 165 180 42 52 59Lanesboro 385 386 400 154 144 159 14 19 18 72 61 57 111 135 138 34 25 28Mabel 316 343 377 109 127 150 2 11 9 61 41 40 124 122 134 20 36 44Ostrander 99 102 100 32 32 34 3 3 3 22 18 14 38 37 37 4 10 12Peterson 101 99 95 26 29 30 0 3 4 26 18 14 34 38 37 15 10 10Preston 584 594 630 163 192 218 19 17 20 149 134 130 191 186 200 62 54 62Rushford 628 719 775 209 245 285 14 25 30 157 160 158 181 207 225 67 67 77Rushford Village 219 271 300 39 42 55 4 7 12 80 77 76 84 118 135 12 20 22Spring Valley 1,001 1,052 1,100 290 309 344 25 54 58 264 237 236 307 289 303 115 137 159Whalan 42 34 22 13 16 9 2 2 3 8 6 3 14 6 4 5 4 3Wykoff 198 209 205 52 59 62 7 10 11 52 33 27 71 81 80 16 24 25 Subtotal 5,166 5,559 5,936 1,563 1,693 1,932 126 226 267 1,315 1,196 1,194 1,685 1,740 1,876 477 577 667
Townships 3,009 3,245 3,650 473 571 688 69 111 127 1,141 1,034 1,096 1,155 1,288 1,514 171 213 225
Fillmore County 8,175 8,808 9,586 2,036 2,264 2,620 195 337 394 2,456 2,230 2,290 2,840 3,028 3,390 648 790 892
Percent of All HouseholdsCommunities 100.0 100.0 100.0 30.3 30.5 32.5 2.4 4.1 4.5 25.5 21.5 20.1 32.6 31.3 31.6 9.2 10.4 11.2
Townships 100.0 100.0 100.0 15.7 17.6 18.8 2.3 3.4 3.5 37.9 31.9 30.0 38.4 39.7 41.5 5.7 6.6 6.2
Fillmore County 100.0 100.0 100.0 24.9 25.7 27.3 2.4 3.8 4.1 30.0 25.3 23.9 34.7 34.4 35.4 7.9 9.0 9.3
Minnesota 100.0 100.0 100.0 25.1 26.9 27.8 6.3 6.9 6.7 28.4 25.2 22.8 28.8 28.5 29.4 11.4 12.5 13.2
Sources: U.S. Census Bureau (1990 & 2000); Claritas Inc.; Maxfield Research Inc.
PersonsLiving Alone
TABLE 9HOUSEHOLD TYPE TRENDS
FILLMORE COUNTY1990 to 2008

FILLMORE COUNTY DEMOGRAPHIC ANALYSIS
MAXFIELD RESEARCH INC. 24
Employment Growth Trends Since employment growth generally fuels household growth, employment trends are a reliable indicator of housing demand. Typically, households prefer to live near work for convenience. Employment growth trends and projections for Fillmore County are shown in Tables 10 through 13. The following are key trends derived from the employment data: Jobs Located in Fillmore County Table 10 shows data on covered employment for Fillmore County in 2000 and 2007. Covered employment data is calculated as an annual average and reveals the number of jobs in the County, which are covered by unemployment insurance. Most farm jobs, self-employed people, and some other types of jobs are not covered by unemployment insurance and are not included in the table. The data comes from the Employment and Economic Development Department. 4 The number of jobs in Fillmore County declined slightly from about 6,800 in 2000 to 6,400
2007. With no job growth, most housing demand will be generated from people commuting to jobs located elsewhere, replacement of obsolete housing, or seniors moving into alterna-tives to their single-family homes. Much of the housing growth in Spring Valley and Chat-field earlier this decade was generated by people working in Rochester.
4 Between 2000 and 2007, goods-producing jobs (mining, manufacturing, and construction)
and service jobs decreased while government jobs increased slightly in Fillmore County. This is similar to what has happened in most locations around the nation, in which manufac-turing jobs declined and service jobs increased, largely due to the expanding medical field.
4 The average annual wage of jobs in the County increased by 22% between 2000 and 2007, to
about $26,500. Although dependant on household size, most households with an income of $26,500 would qualify for housing that is income-restricted. It should be noted, however, that most households with two people earning the average annual wage would be able to af-ford market rate rental or for-sale housing.

FILLMORE COUNTY DEMOGRAPHIC ANALYSIS
MAXFIELD RESEARCH INC. 25
Avg. Wage Avg. Wage No. Pct.
Goods Producing Industries 1,715 25.3% $27,820 1,465 23.0% $34,788 -250 -14.6% Natural Resources & Mining 173 2.6% $16,900 191 3.0% $21,268 18 10.4% Construction 261 3.8% $28,236 306 4.8% $35,256 45 17.2% Manufacturing 1,281 18.9% $29,224 969 15.2% $37,284 -312 -24.4%
Service Providing Domain 3,720 74.7% $18,408 3,559 55.8% $22,412 -161 -4.3% Retail Trade 828 12.2% $17,368 719 11.3% $20,436 -109 -13.2% TWU** & Wholesale Trade 482 7.1% $30,302 488 7.6% $40,012 6 1.2% Information 99 1.5% $23,296 79 1.2% $26,832 -20 -20.2% Financial Activities 331 4.9% $29,796 320 5.0% $33,020 -11 -3.3% Proffesional and Business Services 165 2.4% $22,516 192 3.0% $25,376 27 16.4% Education & Health Services 814 -- $17,264 822 12.9% $20,644 -- -- Leisure and Hospitality 625 9.2% $7,020 588 9.2% $8,424 -37 -5.9% Other Services 375 5.5% $13,468 351 5.5% $17,316 -24 -6.4%
Government 1,349 19.9% $23,244 1,357 21.3% $28,236 8 0.6%
Total 6,784 100% $21,736 6,381 102% $26,468 -403 -5.9%
** Transportation, warehousing, & utilities
Sources: MN Dept. of Employment and Economic Development; Maxfield Research Inc.
Employment Employment2000 2007 Change
TABLE 10COVERED EMPLOYMENT BY INDUSTRY
FILLMORE COUNTYAnnual Average 2000 and 2007

FILLMORE COUNTY DEMOGRAPHIC ANLAYSIS
MAXFIELD RESEARCH INC. 26
Employed People Living in Fillmore County Table 11 presents resident employment data for Fillmore County from 1990 through 2008 (through September). Resident employment data is calculated as an annual average and reveals the work force and number of employed people living in the County. It is important to note that not all of these individuals necessarily work in the County. Table 12 shows commuter patterns to and from Fillmore County based on data obtained from the 2000 Census. The data shows the work destinations for people who live in the County, as well as where employees live who work in the County. 4 While Table 10 showed that there were about 6,400 jobs in Fillmore County in 2007, Table
11 shows that there were over 10,600 employed people in the County in the same year. This indicates that half of all Fillmore County residents are commuting to jobs located outside of the County. This is further highlighted by the worker commuting pattern data shown in Ta-ble 12.
The labor force in Fillmore County grew rapidly from 1995 to 2000 – adding 1,534 people.
It peaked in 2001 with 12,078 people employed and has been declining since. While the size of the labor force has remained steady since 2006, unemployment has been ris-
ing (from 4.2% in 2006 to 6.2% in 2008). The current unemployment rate is the highest this decade, and parallels what has been happing with the economic slowdown around the nation.
As illustrated in Table 12 and in the map on Page 29, there is a large out migration of work-
ers from Fillmore County. In 2000, roughly two-thirds of Fillmore County residents also worked in Fillmore County, while 25% of the residents commuted to jobs in Olmsted County.
Over 80% of the jobs in Fillmore County in 2000 were filled by people living in the County.
This is largely due to Fillmore County being mostly rural with fewer jobs than in surrounding counties that have larger regional centers, such as Rochester, Winona, and Austin.

FILLMORE COUNTY DEMOGRAPHIC ANLAYSIS
MAXFIELD RESEARCH INC. 27
Labor FillmoreYear Force Employment Unemployment County MN
1990 10,321 9,844 477 4.6% 4.8%1995 10,204 9,727 477 4.7% 3.7%2000 11,738 11,371 367 3.1% 3.1%2001 12,078 11,635 443 3.7% 3.8%2002 11,976 11,467 509 4.3% 4.5%2003 11,871 11,283 588 5.0% 4.9%2004 11,703 11,127 576 4.9% 4.6%2005 11,417 10,931 486 4.3% 4.2%2006 11,294 10,825 469 4.2% 4.0%2007 11,206 10,632 574 5.1% 4.6%2008* 11,202 10,513 689 6.2% 5.3%
Change 1990-2000 Number 1,417 1,527 -110 --- --- Percent 13.7 15.5 -23.1 --- ---
Change 2000-2008 Number -536 -858 322 --- --- Percent -4.6 -7.5 87.7 --- ---
* 2008 through SeptemberSources: MN Dept. of Employment and Economic Development; Maxfield Research Inc.
Unemployment Rate
TABLE 11RESIDENT EMPLOYMENT
FILLMORE COUNTY 1990 TO 2008*
The map on the following page highlights the commuting patterns throughout Fillmore County. The data is from the U.S. Census Bureau for the year 2000, and shows three job destinations – the local community, elsewhere in Fillmore County, and outside of Fillmore County. Key find-ings from the map are as follows: 8 A quarter of Fillmore County’s workers commuted to jobs in neighboring Olmsted County
while 63.0% were employed within the county. 8 Rushford, Preston, and Lanesboro had the greatest percentage of residents that worked lo-
cally – a little over half. Harmony and Spring Valley had about slightly less than half of resi-dents working locally.
8 Chatfield is located on the County’s border with Olmstead, and over half of the residents
work in Olmstead County. Job growth in Rochester has contributed to Chatfield’s having the greatest household growth in the County.

FILLMORE COUNTY DEMOGRAPHIC ANLAYSIS
MAXFIELD RESEARCH INC. 28
8 Mabel is located in the very southeastern portion of the County and is only about seven miles west of Spring Grove. With Northern Engraving scheduled to close in February 2009, the loss of its 250 jobs could impact housing demand in Mabel somewhat. However, 2000 commuting pattern data indicated that less than 10% of Mabel’s workforce worked in Spring Grove, and of course, not all of them worked at Northern Engraving. Thus, the closing of Northern Engraving should have a minimal impact on Mabel’s housing demand.
County County ofof Residence Employment Count Percent
Fillmore Fillmore 6,710 63.0%Fillmore Olmsted 2,621 24.6%Fillmore Winona 439 4.1%Fillmore Mower 158 1.5%Fillmore Houston 154 1.4%Fillmore Howard, IA 129 1.2%Fillmore Winneshiek, IA 122 1.1%Fillmore La Crosse, WI 83 0.8%Fillmore Other 233 2.2%
10,649 100.0%
Fillmore Fillmore 6,710 81.2%Olmsted Fillmore 439 5.3%Winona Fillmore 326 3.9%Houston Fillmore 295 3.6%Mower Fillmore 186 2.3%Howard, IA Fillmore 84 1.0%Winneshiek, IA Fillmore 84 1.0%Other Fillmore 138 1.7%
8,262 100.0%
Sources: US Census Bureau Maxfield Research Inc.
TABLE 12FILLMORE COUNTY COMMUTING PATTERNS
2000
Place of Employment for Fillmore County Residents
Place of Residence for Workers Commuting to Fillmore County

FILLMORE COUNTY DEMOGRAPHIC ANLAYSIS
MAXFIELD RESEARCH INC. 29

FILLMORE COUNTY DEMOGRAPHIC ANLAYSIS
MAXFIELD RESEARCH INC. 30
Major Employers Table 13 lists the major employers in Fillmore County based on the most recent data provided by the Minnesota Department of Employment and Economic Development – or MN PRO. The fol-lowing are a few key points from Table 13.
Chatfield and Rushford account for most of the larger employers in the County. Together these two cities have nine of the top 20 largest employers. Of these, Tuohy Furniture Corp, Strongwell Corp, Chosen Valley Care Center, Chosen Valley Public Schools, Good Shepherd Home and Rushford-Peterson Public Schools are the largest. Tuohy Furniture, Strongwell and Good Shepherd combined employ about 425 employees.
Employer Products/Services City Employees
Tuohy Furniture Corp Manufacturing Chatfield 150Strongwell Corporation Manufacturing Chatfield 135Chosen Valley Care Center Nursing Care Facilities Chatfield 112Chosen Valley Public Schools Schools Chatfield 100Skippy's Food Center Grocery/Pharmacy Chatfield 61Fillmore Central Schools Schools Haromony 50Harmony/Gundersen Lutheran Health Care General Medical & Surgical Haromony 70Harmony Enterprises Inc Manufacturing Haromony 50Minnowa Construction Construction Haromony 75Green Lea Manor Nursing Home Nursing Care Facilities Mabel 85Fillmore, County of Government Preston 200Fillmore Central School District #2198 Schools Preston 90Root River Hardwoods Manufacturing Preston 65Good Shepherd Home Nursing Care Facilities Rushford 140Riverside Electronics Ltd Wholesales Rushford 50Rushford-Peterson Public Schools Schools Rushford 90Tri-County Electric Cooperative Electric Power Distribution Rushford 53Kingsland Public Schools Schools Spring Valley 120SATA Sign/Equipment Manufacturer Spring Valley 35Swiss Valley Cheese Dairy Product Manufacturer Spring Valley 30
Sources: MN Dept. of Employment and Economic Development; Maxfield Research Inc.
TABLE 13MAJOR EMPLOYERSFILLMORE COUNTY
2008
Harmony and Preston also have sizable employment bases from major employers. Minnowa Construction and Harmony/Gunderson Lutheran Health Care employ about 150 people in Harmony. Fillmore County, the largest employer in the County, is located in Preston and employs around 200 people.

FILLMORE COUNTY DEMOGRAPHIC ANLAYSIS
MAXFIELD RESEARCH INC. 31
Chatfield has some businesses that provide goods and services to the regional and national economy as a whole. These employers help driving economic and population growth in the County as their market base expands and they need more and more workers.
Major employers in smaller communities in the County tend to provide goods and services
for the communities themselves – for example, school districts, local government, grocery stores, etc. As such, the market base for those businesses does not have the expansion poten-tial, and they do not provide as much growth potential for the community.
Age of Housing Stock Table 14 shows the estimated age distribution of Fillmore County’s housing stock in 2008, based on data from the Census Bureau. The table includes the number of housing units built in each community and the township as a whole prior to 1950 and during the four periods since – the 1950s and 1960s, the 1970s and 1980s, the 1990s, and since 2000. Key points derived from Ta-ble 14 are: 4 Overall, the County’s housing stock is relatively old. In 2008, 45% of the housing units were
built before 1950. In addition, about two-thirds of the owned homes and 70% of the rental units were more than 30 years old.
4 About 43% of the rental housing in Fillmore County was constructed prior to 1950. About
one-quarter was built in the 1970s and 1980s and roughly 15% in the 1950s and 1960s. Be-cause of their age, many of the rental buildings may need rehab to maintain their appeal to today’s renters. While almost 200 rental units have been added this decade, the majority of them have been senior rental units. Thus, the general-occupancy supply has not increased much through new construction during this decade.
4 Not surprisingly, the larger communities have newer housing stock as they captured a greater
percentage of Fillmore County’s recent growth. The cities of Chatfield, Rushford, and Rush-ford Village have a significant amount of housing constructed during the 1990s (17%, 13%, and 23%, respectively). Smaller communities have an older housing stock. These communi-ties included Wykoff, Harmony, Spring Valley, Preston, and Mabel which all had over half of their housing stock constructed before 1950.

FILLMORE COUNTY DEMOGRAPHIC ANLAYSIS
MAXFIELD RESEARCH INC. 32
< 1950 1950-69 1970-89 1990-00 2000-07 < 1950 1950-69 1970-89 1990-00 2000-07CitiesCanton 61 28 40 7 2 11 0 6 0 0Chatfield 244 156 198 128 136 60 48 66 29 25Fountain 52 27 25 2 16 8 3 4 7 11Harmony 206 92 54 22 19 48 12 43 0 36Lanesboro 211 42 20 7 18 48 10 41 3 0Mabel 150 64 48 18 14 34 5 11 2 31Ostrander 39 9 26 2 3 8 4 3 0 6Peterson 50 8 18 0 0 8 2 7 2 0Preston 236 105 84 36 20 51 32 37 2 27Rushford 235 94 118 68 106 47 29 36 19 23Rushford Village 90 29 60 55 48 16 2 0 0 0Spring Valley 411 184 132 35 76 94 37 98 6 27Whalan 10 5 3 0 2 2 0 0 0 0Wykoff 108 12 41 12 2 14 8 3 0 5
Subtotal 2,103 855 867 392 462 449 192 355 70 191
Townships 1,451 275 578 352 582 270 48 74 20 0
Fillmore County 3,554 1,130 1,445 744 1,044 719 240 429 90 191 Pct. of Housing 37% 12% 15% 8% 11% 8% 3% 4% 1% 2%
Sources: U.S. Census, Maxfield Research Inc.
Renter OccupiedOwner Occupied
TABLE 14AGE OF HOUSING STOCK
FILLMORE COUNTY2008
Age of HousingFillmoreCounty, 2008
0500
1,0001,5002,0002,5003,0003,5004,0004,500
<1950 1950-1969 1970-1989 1990s 2000s
No.
of U
nits
RentedOwned

FILLMORE COUNTY DEMOGRAPHIC ANLAYSIS
MAXFIELD RESEARCH INC. 33
Residential Construction Trends 2000 through 2008 The number of homes built this decade through 2008 in Fillmore County was estimated based on interviews with city staff and the Fillmore County GIS regarding recent home construction trends. These estimates, made for each community and the townships as a whole, are shown in Table 15. The following are key points from the Table. 4 Nearly 1,300 homes have been built in Fillmore County from 2000 through 2008, for an av-
erage of about 145 new units annually. 4 Single-family homes are the predominant new housing type accounting for 83% of all new
homes. A portion of the single-family total is twinhomes (we estimate about 15% to 20% of the units in the communities). All of the homes built in the townships are single-family de-tached dwellings.
Single-Family* Multifamily TotalCitiesCanton 2 0 2Chatfield 140 28 168Fountain 16 12 28Harmony 20 38 58Lanesboro 19 0 19Mabel 14 34 48Ostrander 3 6 9Peterson 0 0 0Preston 21 34 55Rushford** 100 24 124Rushford Village 50 0 50Spring Valley 78 31 109Whalan 2 0 2Wykoff 2 5 7 Subtotal 467 212 679
Townships 600 0 600
Fillmore County 1,067 212 1,279
* Single-family includes twinhomes and townhomes.
Sources: Maxfield Research Inc.
** Permits were issued for the demolition of 51 housing units after the 2007 floods.
TABLE 15
2000 through 2008FILLMORE COUNTY
ESTIMATED HOME CONSTRUCTION TRENDS

FILLMORE COUNTY DEMOGRAPHIC ANLAYSIS
MAXFIELD RESEARCH INC. 34
The following are among the larger multifamily buildings added this decade in Fillmore County. Except for Pine Meadows, all of these buildings are senior housing. Most of the remaining multifamily units are rental units, primarily in 4-plex buildings.
o Chosen Valley Assisted Living Chatfield 19 units o Heritage Grove Harmony 34 units o Pine Meadows Rushford 24 units o Green Lea Manor Mabel 22 units o Park Lane Estates Preston 20 units o Evergreen Spring Valley 20 units
Home construction was very strong in Spring Valley during the beginning of this decade.
However, only eight single-family homes have been built in the community since 2003. Of these, six have been townhome units. Housing development earlier this decade was aug-mented by the 12-lot Capelle Subdivision, which was a collaboration between Semcac, the Greater Minnesota Housing Fund, First Homes and the City of Spring Valley. All homes in the subdivision sold for between $99,000 and $121,600. Semcac developed and sold the homes. Greater Minnesota Housing Fund provided technical assistance, and financing for the project. First Homes provided buyers assistance of up to $30,000 per home. The City of Spring Valley provided tax increment financing of $10,000 per lot that paid for site im-provements. The Spring Valley EDA and the Greater Minnesota Housing Fund also teamed up to provide a down payment assistance grant of up to $4,000.
About 100 single-family homes have been built in Rushford so far this decade. However,
over 20 of them have been built to replace homes that were destroyed in the flooding during August 2007. Additional homes will need to be built to replace other destroyed homes, which include 36 mobile homes in the Bluffview mobile home park, the 16-unit Rushford Manor Apartments, 4-unit Winona Street Apartments, and 12-unit Rush Creek Senior Apartments.

FILLMORE COUNTY GENERAL-OCCUPANCY RENTAL HOUSING
MAXFIELD RESEARCH INC. 35
Market Conditions General-Occupancy
Rental Housing Introduction This section summarizes the current supply of general-occupancy rental housing options in Fill-more County. Senior rental options are summarized in the following section. This section looks at the market conditions for general-occupancy rental housing in Fillmore County by examining data on:
performance of market rate rental developments, performance of subsidized rental developments, usage trends of Housing Choice Vouchers, planned and proposed rental housing developments, and interviews with housing professionals and municipal staff members familiar with the rental market.
This section of the report includes summary totals for rental housing trends in the County.

FILLMORE COUNTY GENERAL-OCCUPANCY RENTAL HOUSING
MAXFIELD RESEARCH INC. 36
Fillmore County Rental Housing Maxfield Research Inc. surveyed rental developments in Fillmore County to analyze current market conditions for rental housing in the County. The survey was conducted in November and December 2008 and encompassed buildings with four or more units in all communities. Over 270 units in 25 buildings were surveyed, including market rate and affordable. A summary of the survey findings is shown in Tables 16 and 17. The following are key points about rental conditions in the County. Market Rate Rental Housing
Market rate rental units are concentrated in Preston, Rushford, and Spring Valley which to-gether accounted for about three-quarters of all market rate units surveyed in the County. The smaller communities typically have a few older market rate buildings with a few units. However, most market rate units in these smaller communities are in single-family homes or duplexes, versus apartment buildings.
The overall vacancy rate for market rate rental units in December 2008 was 6.5%; however about half of the vacancies were at one building. Excluding this building, the overall va-cancy rate decreases to 3.8%. Twelve of the 14 buildings surveyed that provided occupancy information had none or only one vacancy. Overall, market rate buildings are performing well.
The average monthly rent for the five Fillmore County developments built since 2000 was $355 for one-bedroom units and $535 for two-bedroom units. These rents are much lower than overall average rents in larger metropolitan areas, primarily due to lower land and labor costs for development.
The average monthly rent at all market rate developments in the County was $370 for one-bedroom units and $455 for two-bedroom units. Average rents were highest in Rushford which has a greater proportion of newer units.
Chatfield’s supply of market rate rental housing consists mostly of rented homes and apart-ments above downtown businesses. Ten units exist above one business – Coyote Club. Cur-rently all of its units are occupied, although there were six vacancies this summer. Accord-ing to the owner, construction workers at the local schools have contributed to the recent high occupancy. The units were remodeled in 2005 and are now among the nicest in Chatfield. Monthly rents are $490 for one-bedroom units and $585 for two-bedroom units, including all utilities and off-street parking.
To be eligible for use with the Housing Choice Voucher program, units must have rents be-low the Payment Standard ($471 for one-bedroom units, $622 for two-bedroom units, and $832 for three-bedroom units). Almost all of the units in buildings surveyed had qualifying rents.

FILLMORE COUNTY GENERAL-OCCUPANCY RENTAL HOUSING
MAXFIELD RESEARCH INC. 37
Year TotalProject Name/Location Built Units Vacant Comments
215 Main St. S n/a 10 0 n/a 1BR2BR
Junge Apts. 2002 8 n/a 1 - 1BR7 - 2BR
Speer Apts. I & II 1991/ 8 0 4 - 2BR 800 - 9002003 4 - 2BR
Village Apts. 2001/ '08 12 1 12 - 2BR Rent includes A/C, water, sewer, and trash. Tenant pays electric & heat.
Old School Apts./ 1992 22 1 2 - 0BR 1,000 - 1,200Corson Condominiums 3 - 1BR
17 - 2BR $375 - $550 1,000 - 1,500K & K Apts. 1969 8 0 2 - 1BR
6 - 2BRPreston Apts. 1960 6 0 1 - 1BR
5 - 2BR $365 - $410
Bisek Apts. 2005 4 0 3 - 1BR $300 - $3251 - 2BR
Carriage House Apts. 1991 9 2 4 - 1BR5 - 2BR
Chatfield$490 n/a Located above Coyote Club. Rent includes all utilities. All units were remodeled in 2005.
Building features secured-entry and elevator, off-street parking, and on-site laundry.$585
Old office building built in 1904, upper floor renovated in 2005 into 4 apts, residents pay all utilities, no laundry facilities (laundry mat across the street), on street parking. Profile: 2 single-males, 2 single-females.
$450
$325
Resident pay electric, coin-op laundry. Off-street parking w/plug-ins. Garbage Disposals. Profile: mix of residents, mostly singles.
$485
Originally an old church; Resident pays for electric and garbage. On street parking. Profile: 3-single males, 1-single family, 1-single female,1 3-male roommates. Two-story bldg w/basement. Coin-operated laundry.
n/a
Mabel
TABLE 16MARKET RATE GENERAL OCCUPANCY RENTAL HOUSING
FILLMORE COUNTYDecember 2008
Renovation of old school; 7-9 apartments remaining to be built out. Residents pay all of their utilities, except for the 0BR, which pays phone & cable only.
Rent includes all utilities, off-street parking w/plug-ins, coin-op laundry on each floor. Profile: middle-aged singles & young couples (only one senior). Originally focused on 55+, but changed around 1996. Now building is GO.
Rushford
950
Unit Mix Unit SizeRent Range
n/a$375
Fountain
$425
$375
450
$480
n/an/a
n/a
580
n/a
n/an/a
1,100
$415 n/a
Preston
Tenant pays all utilities. Garbage Disposal. Coin-op laundry. Profile: All but one residents works outside the community.
$600
Tenant pays heat, cable, and phone. Owner pays water and sewer
$350
n/an/a
$350

FILLMORE COUNTY GENERAL-OCCUPANCY RENTAL HOUSING
MAXFIELD RESEARCH INC. 38
Year TotalProject Name/Location Built Units Vacant Comments
Pine Meadows 2003 24 1 24 - 2BR $600 - $795 1,100 - 1,250
Northend Apts. 1977 8 4 2 - 1BR6 - 2BR
Commercial House 2002 11 0 4 - 1BR $520 - 916Apartments 7 - 2BR $980 - 1,234
Warehouse Apts. 1980s 4 0 1 - 1BR3 - 2BR
Farmer St. Apts. 1970s 8 0 8 - 2BR
Tracy Road Apts. 1970s 4 0 1 - 1BR3 - 2BR
Napa Building Apts. Pre-1940 4 n/a 3 - 1BR1 - 2BR
n/a = not available
Source: Maxfield Research Inc.
Rushford (Continued)
TABLE 16
Renovated hotel built in 1874. Was Tax Credit project; residents could not earn more than 60% of the County median swtiched to Market Rate May 2008. Residents pay phone and cable; off-street parking.
$536
Residents pay electric. Owner pays heat. No laundry. Off-street parking. Profile: most residents are older singles and couples.
$350
$375$400
Residents pay electric, heat. Owner pays water and garbage. Common laundry and off-street parking. Profile: younger singles and couples, some children
Two-story building; resident pays electric, water, sewer. Off-street parking w/plug-ins. Mostly younger singles and families. Coin-op laundry room.
$400
n/a
$340$375 n/a
n/a
n/a
Spring Valley
n/a
n/a n/a
Unit Size
FILLMORE COUNTYDecember 2008
(continued)
Unit Mix Rent Range
Residents pay electric heat. No laundry. Off-street parking. Profile: most residents are young singles and families.n/a
MARKET RATE GENERAL OCCUPANCY RENTAL HOUSING
Larger unit have 2.5 car garage, single car garage for smaller. Consists of 6 4-unit buildings. Lage units have central air, small have window units. Rent inlcudes water and sewer. Profile: many are retired farmers, some young families.
Residents pay electric. Owner pays heat. Common laundry and off-street parking. Profile: younger singles.
$350
$430
n/a
n/a
n/a

FILLMORE COUNTY GENERAL-OCCUPANCY RENTAL HOUSING
MAXFIELD RESEARCH INC. 39
Year TotalProject Name/ Address Built Units Vacant Unit Mix Comments
Mill Pond Townhomes 1999 24 2 12 - 2BR12 - 3BR
Cherrywood Estates 1982 16 0 2 - 0BR10 - 1BR
4 - 2BR
Vesterheim Manor 1979 16 1 2 - 1BR $350 - $465(base) (market)
14 - 2BR $380 - $490(base) (market)
Scenic View Townhomes 1999 20 2 10 - 2BR10 - 3BR
Winona Street Apts. 1993 4 -- Former MHFA funded building destroyed by the 2007 flood.
Rushford Manor Apts. 1985 16 --
Rush Creek Apts. 1984 12 -- Rushford
-- Former USDA Rural Development subsidized building destroyed by the 2007 flood. -- --
----
----
$630 960 Resident pays heat and electric. Units include dishwasher, A/C, W/D hookups. Coin-op common laundry.$700 1,050
Chatfield
TABLE 17
December 2008
Unit SizeRent Range
FILLMORE COUNTYSUBSIDIZED GENERAL-OCCUPANCY RENTAL HOUSING
Mabel$526
$540
Rushford
Preston
--
--
HRA Subsidy, income qualified. Two-story building. Attached garages. Resident pays all utilities, except garbage and water. Coin-op laundry. The gounds consist of a b-ball court and playground.
--Rural Development building damaged by 2007 flood. It has not been renovated, and therefore no units are available for occupancy.
582386
$563
$480
HUD-Sect. 8. Off-street parking w/plug-ins. Families: water, sewer, trash removal incl. / heat, electric, phone and cable not incl. Seniors: heat, water, sewer and trash incl. / electric, phone and cable not incl. Coin-op laundry.
Rural Development subsidy. One resident pays basic rent. Off-street parking w/plug-ins; coin-op laundry. Water, sewer, garbage included in rent. Profile: avg. age is 35, 8 couples.
$596
-- --
772
620
720
1,2541,157

FILLMORE COUNTY GENERAL-OCCUPANCY RENTAL HOUSING
MAXFIELD RESEARCH INC. 40
Year TotalProject Name/ Address Built Units Vacant Unit Mix Comments
Southwest Properties 1980s 12 2 11 - 1BR $341 - $546(base) (market)
1 - 2BR $391 - $596(base) (market)
Northwest Properties 1970s 12 1 12 - 2BR
Northwest Properties 1970s 8 0 2 - 1BR $371 - $537(base) (market)
6 - 2BR $391 - $566(base)(market)
Source: Maxfield Research Inc.
Spring Valley
550
700
700
$450 (market)
Wykoff
550 Rural Development subsidy. No residents pay basic rent. Two-story building without elevator; common coin-operated laundry; off-street parking.
Unit Size
(continued)
$331 (base) Rural Development subsidy. Two residents pay basic rent and one pays market rent. Residents pay electric heat. Common laundry; off-street parking. Profile: split between young couples w/kids and seniors.
700
Rural Development subsidy. No reisents pay basic rent. Residents pay electric heat. Common laundry; off-street parking. Although full, this has historically been a struggling property. Profile: most are young singles, some seniors.
TABLE 17SUBSIDIZED GENERAL-OCCUPANCY RENTAL HOUSING
FILLMORE COUNTYDecember 2008
Rent Range

FILLMORE COUNTY GENERAL-OCCUPANCY RENTAL HOUSING
MAXFIELD RESEARCH INC. 41
Affordable Rental Housing Only one property – Mill Pond Townhomes in Chatfield – was identified in Fillmore County as affordable, or restricted to households with low to moderate incomes. Affordable developments offer a “shallow” subsidy in which income-qualified households pay reduced rents. Mill Pond Townhomes was developed through the Low-Income Housing Tax Credit (LIHTC) program and is restricted to households with incomes at or below 60% of median income. Mill Pond Townhomes was built in 1999 and has 24 units located in four 6-unit buildings. In-come-qualified residents pay monthly rent of $630 for two-bedroom units and $700 for three-bedroom units. Currently, two units are vacant. The 2008 income limits for Fillmore County are shown below for one- to four-person households at 60% of median income: 1 Person $23,820 2 Person $27,240 3 Person $30,600 4 Person $34,020 Subsidized Rental Housing There are six rental developments in Fillmore County that offer “deep” subsidies in which the monthly rents for most residents are based on 30% of a qualified household’s Adjusted Gross In-come. All but two of the subsidized developments in the County are Rural Development build-ings. The maximum income limit for the Rural Development buildings ranges from $37,250 for single-person households up to $54,500 for five-person households. These incomes limits are liberal, as they are at a minimum based on the United States median family income, which is higher than most rural areas.
The six developments combine for a total of 84 units.
Six vacancies were identified, for an overall vacancy rate of 7.1%. This is higher than the stabilized vacancy rate of 5%, which indicates that the buildings are meeting the current de-mand for subsidized housing.
The subsidized developments primarily appeal to families, as the overall unit-mix at the de-velopments consists of two-thirds two- and three-bedroom units. Most of the one-bedroom units were at Cherrywood Estates in Mabel and Southwest Properties in Spring Valley.
In addition to the six subsidized rental buildings surveyed, three subsidized rental buildings in Rushford (Rush Creek, Rushford Manor, and Winona Street Apartments) were dam-aged/destroyed by the August 2007 flood and have yet to be replaced. It is uncertain when these buildings will be available for occupancy again. Currently, Minnesota Housing and Rural Development are working on rebuilding the units at Rushford Manor.

FILLMORE COUNTY GENERAL-OCCUPANCY RENTAL HOUSING
MAXFIELD RESEARCH INC. 42
Housing Choice Voucher Program The Housing Choice Voucher Program (also known as Section 8) utilizes the existing private rental market in Fillmore County to provide decent, safe and sanitary housing opportunities for low-income families, elderly, handicapped, and disabled persons at an affordable cost. The Southeast Minnesota Multi-County Housing and Redevelopment Authority (SEMMCHRA) ad-ministers this federal program for six counties, including Fillmore County. Currently, the SEMMCHRA assists 36 households in the County through this program. To be eligible for a voucher, households must have incomes at or below 50% of median. The as-sistance the household is eligible to receive is equal to the difference between 30% of a house-hold’s monthly adjusted income and the unit’s monthly rent, which is capped by the Voucher Payment Standard. Fillmore County’s Voucher Payment Standard ranges from $471 for one-bedroom units to $622 for two-bedroom units and $832 for three-bedroom units. Because Housing Choice Vouchers are mobile, utilization by community could vary from year to year depending on where voucher holders choose to live. As shown below, Housing Choice Vouchers are utilized in nine communities throughout the County, with Rushford having the most (11). Compared to surrounding counties with larger employment centers, demand for Vouchers is limited in Fillmore County.
Rushford 11Preston 7Chatfield 5Mabel 4Spring Valley 3Lanesboro 2Harmony 2Ostrander 1Wykoff 1
Use of Housing Choice Vouchers by City, November 2008
The SEMMCHRA’s waiting list for the Housing Choice Voucher Program is currently about six months to one year. People who obtain a voucher typically are able to find units with qualifying rents. The quality of units can sometimes be an issue, since most units are in small buildings that are not professionally managed. Pending Rental Developments Interviews were conducted with representatives of communities in the County to reveal planned and pending general-occupancy rental developments that may come on-line in the near future. There were no identified pending rental developments in Fillmore County at this time.

FILLMORE COUNTY SENIOR HOUSING
MAXFIELD RESEARCH INC. 43
Market Conditions Senior Housing
Introduction This section evaluates the market conditions for senior housing in Fillmore County by examining data on:
the performance of market rate and subsidized senior housing developments, planned and proposed senior housing developments, and interviews with housing professionals and municipal staff members who are familiar with senior housing trends.
This section of the report includes summary data of current market conditions.

FILLMORE COUNTY SENIOR HOUSING
MAXFIELD RESEARCH INC. 44
Senior Housing Defined The term “senior housing” refers to any housing development that is restricted to people age 55 or older. Senior housing includes an entire spectrum of housing alternatives, with overlapping markets making the differences somewhat ambiguous. However, the level of support services offered best distinguishes them. Maxfield Research Inc. classifies senior housing developments into four categories based on the level of support services: Adult/Few Services: where few, if any, support services are provided. “Adult” housing includes both rental and ownership (such as senior condominiums, cooperatives, or townhomes). Congregate: where support services such as meals and light housekeeping are provided, either on an optional basis for an additional fee (optional-service) or included in the monthly fee (service-intensive). Assisted Living: where two or three daily meals as well as basic support services such as trans-portation, housekeeping and/or linen changes are included in the fees. Personal care services such as assistance with bathing, grooming, and dressing is included in the monthly fees or is available for an additional fee. Memory Care: where more service-intensive personal care is required for people with dementia and Alzheimer’s disease. Typically, support services and meal plans are similar to those found at assisted living facilities, but the heightened levels of personalized care demand more staffing and higher rental fees. These four senior housing products tend to share several characteristics. First, they usually offer individual living apartments with living areas, bathrooms, and kitchens or kitchenettes. Second, they generally have an emergency response system with pull-cords or pendants. Third, they of-ten have a community room and other common space to encourage socialization. Finally, they are age-restricted and offer conveniences desired by seniors, although assisted living develop-ments sometimes serve non-elderly people with special health considerations. The four senior housing products offered today form a continuum of care (Figure 1), from a low level to a fairly intensive one. Often the service offerings at one type overlap with those at an-other. In general, however, adult developments tend to attract younger, more independent sen-iors, while assisted living and memory care developments tend to attract older, frailer seniors.
Senior Housing Product TypeSource: Maxfield Research Inc.
Fully or HighlyLifestyle Dependent on Care
Age-Restricted Project offering no Services
Congregate Apartments w/ Intensive Services Memory Care Units
Fully Independent
FIGURE 1CONTINUUM OF HOUSING AND SERVICES FOR SENIORS
Single-Family Home
Townhome, Condo, or Apartment
Congregate Apartments w/ Optional Services Assisted Living Nursing Facilities

FILLMORE COUNTY SENIOR HOUSING
MAXFIELD RESEARCH INC. 45
Market Rate Senior Developments in Fillmore County Maxfield surveyed senior housing developments in Fillmore County to analyze current market conditions. The developments surveyed are listed in Tables 18 and 19 along with information on location, year built, total units, and vacant units. Information on Fillmore County’s market rate senior housing market is summarized in the fol-lowing tables. The following are key points.
Market rate senior housing is a relatively new concept in Fillmore County. Seven of the 10 senior buildings in the County opened this decade, accounting for three-quarters of the mar-ket rate supply. The oldest senior building is Spring Valley Estates, which was converted from a hospital to independent units in the 1970s before becoming assisted living. The other two buildings built before 2000 were Chosen Valley Apartments in Chatfield (1995) and Bremer Suites/Good Samaritan Assisted Living in Rushford (1998).
Of the total market rate senior units, the most are assisted living (112 units), followed by congregate (49 units). There is one adult/few-services building – PME Senior Townhomes in Wykoff (5 units). The only memory care facility is a six-unit secured wing in the Heritage Grove facility in Harmony.
4 Overall, the market rate senior housing developments in Fillmore County are performing
well. Of the eight buildings surveyed for which occupancy information was available, six had no or only one vacancy. Evergreen in Spring Grove has several available units, but it opened for occupancy in 2007 and is still in its initial lease-up period. The slow housing market overall is contributing to the slower lease-up of the senior building.
4 All of the senior buildings are attached to skilled care facilities with the exception of PME
Senior Townhomes, Heritage Grove, and Park Lane Estates. Attaching senior housing to skilled care facilities allows for more efficiency in the delivery of services, since support staff can be shared. It also creates a continuum of care campus where residents can transition from more independent living to skilled care without having to move locations.
Average monthly rents at the senior buildings reflect the level of services offered. Monthly rents for two-bedroom units at the adult facility average $650. Monthly rents average $1,100 for one-bedroom congregate units and $2,100 for assisted living units.
Seniors with greater care needs can allocate a greater portion of their income toward housing because they have fewer other expenses. Typically, seniors are able and willing to allocate 30% of their income for adult units, 50% for congregate and 85% for assisted living. In addi-tion, most seniors allocate the equity from their single-family home and other savings to pay for senior housing with services. Thus, seniors with lower incomes can often afford market rate senior housing. This is particularly true for assisted living where many seniors are will-ing to spend down assets to avoid placement in a nursing home.

FILLMORE COUNTY SENIOR HOUSING
MAXFIELD RESEARCH INC. 46
Year TotalProject Name/Location Built Units Vacant No. Type Sizes Comments
Chosen Valley Apts. 1990 15 n/a 13 - 1BR 428 Jensen Ln SE 2 - 2BR
Chosen Valley Asst. Living 2005 19 n/a 19 - n/a428 Jensen Ln SE
Heritage Grove 2002 34 1 2 - 1BR 455 Main Ave N 12(IL) (0) 10 - 2BR
16(AL) (0) 8 - Studio 476 - 5156(MC) (1) 8 - 1BR
6 - Studio
Green Lea Manor 2005 22 1 20 - 1BR 115 N. Lyndalle 2 - 2BR
Ostrander Assisted Living 2001 6 0 6 - 1BR 305 Minnesota Street
Park Lane Estates 2001 20 4 16 - Studio 320 - 425 $1,895 - $2,307 111 Fillmore Pl SE 4 - 1BR
Mabel
n/a
Harmony
546
$2,150 Heat, electric, trash, included in monthly fee. Emergency pendant system, 24 hour staff. 3 meals a day plus snacks, light housekeeping weekly, 3 loads of laundry weekly included in rent.
Independent living, assisted living, and memory care all in same building, but in separate wings. IL prices include van service, activities, emergency call system. AL & MC prices also include 3 meals per day, weekly housekeeping, laundry, and showering. Most residents from within 10 to 15 miles. Avg. age 85 (IL) / 90 (AL) / 92 (MC).$2,953
$773
$1,990
TABLE 18MARKET RATE SENIOR HOUSING
FILLMORE COUNTYDecember 2008
Unit Mix/Sizes/RentsMonthly Rent
Chatfield
n/a n/a
On Chosen Valley Care Center campus. Secured building. Rent includes daily noon meal, weekly housekeeping, emergency call, activities, and all utilities. Building features coin-op laundry, off-street parking w/plug-ins, beauty shop, storage units.
On Chosen Valley Care Center campus. Secured building staffed 24hrs. Units feature full kitchens and private baths, and walk-in closets. Residents have priority admission to Care Center. Rent includes 3 meals daily, emergency call, and weekly laundry/housekeeping.
650850
n/a
471 $2,606
1,032
308
$946
$2,228
n/a $2,250
Preston
n/a
On Campus with Ostrander Care & Rehab. Rent includes 3 meals/day, weekly housekeeping, emergency call, 24hr staff. Full with waiting list.
Assisted Living complex; rates include 3 meals per day, housekeeping and laundry once per week, scheduled transportation, and activities. Second occupant fee of $650/month. Studios offer private or shared bathrooms. Units do not include a kitchen, residents may bring own fridge or microwave.
709
Ostrandern/a $1,640

FILLMORE COUNTY SENIOR HOUSING
MAXFIELD RESEARCH INC. 47
Year TotalProject Name/Location Built Units Vacant No. Type Sizes Comments
Bremmer Suites/Good 1998 15 0 15 - 1BRSamaritan Assisted Living 803 Home St
Spring Valley Estates n.a. 14 0 Studio1BR2BR2BR/Deluxe
Evergreen 2007 22 9 1BR 2BR
PME Senior Townhomes 2004 5 0 5 - 2BR $600 - $700229 N. Main
Source: Maxfield Research Inc.
900 $1,395
Spring Valley
TABLE 18
$2,051410 Assisted Living units are connected to nursing home; off-street parking; unit A/C; kitchenette; emergency call system; community/party room; dining room; activities program; 3 daily meals+snacks; personal care assistance; weekly housekeeping & laundry service; Avg age is 82, mostly from Rushford, Peterson, and Lanesboro.
Rushford
700 $1,195
n.a. $1,550
Monthly Rent
(Continued)
MARKET RATE SENIOR HOUSINGFILLMORE COUNTY
December 2008
Unit Mix/Sizes/Rents
$2,050
Two-story congregate building attached to Spring Valley Care Center. Four levels of care offered. Level 1 does not inlcude any meals, emergency call, or services (only housekeeping/month). Level 2 includes 1 meal/day & weekly light housekeeping. Level 3 includes emergency call and access to nursing. Level 4 includes 3 meals/day.
to
Asisted living attached to Spring Valley Care Center. Units feature full kitchen and priate bathroom. Rent includes 3 meals/daily, weekly housekeeping, 24hr staff, emergency call, transportation, and all utilities. Additional home health services avail. for extra fee. Building includes great room, dining room, beauty shop, & library.
WykoffEach unit has attached 1.5 stall heated garbage, tenant pays all utilities, washher/dryer, range, refrigerator, dishwasher, microwave, all individual entry, back entry leads to back garden area, all handicapped accessible.
1,200

FILLMORE COUNTY SENIOR HOUSING
MAXFIELD RESEARCH INC. 48
In 2002, Chatfield had another 15-bed assisted living facility named Oakenwald Terrace. It was a 100-year-old rest home renovated into assisted living in the 1970s. Since 2002, Oakenwald Terrace ceased as an assisted living and was converted into a bed and breakfast.
Subsidized and Affordable Senior Housing There are a total of 206 subsidized/affordable senior housing units in 11 developments in Fill-more County. The subsidized senior developments are listed in Table 19, along with their loca-tion, total units, and vacant units. The following are key points about the subsidized senior hous-ing market. 4 The 11 subsidized senior buildings combine for a total of 206 units. Combined, they had a
vacancy rate of 3.9%. However, seven of the buildings were fully occupied. 4 Six of the subsidized senior buildings were developed through the Rural Development, Sec-
tion 515 program. The income limit for these buildings is liberal – at $37,250 for a one-person household and $41,800 for a two-person household. Most residents of these buildings have incomes far below the income-limit, however. Unless the resident has rental assistance, in which case they pay 30% of their adjusted gross income for rent, they must pay the basic rent, which averaged $400 for a one-bedroom unit, or higher. Eighteen of the 70 residents in the Rural Development buildings had rental assistance and paid 30% of their income for rent.
4 Eight of the communities in Fillmore County have at least one subsidized senior building,
and of these, Harmony, Lanesboro, and Spring Valley have two. The communities without subsidized senior housing are Fountain, Mabel, Peterson, Rushford Village, Whalen, and Wykoff. While it is not a senior building, Mabel does have a subsidized rental building with two efficiency and 10 one-bedroom units (Cherrywood Estates) that has many senior resi-dents.
Pending Senior Housing Developments Our interviews with representatives of communities in the County revealed that there is one planned senior housing development. The 38-bed nursing home in Preston closed and the new owner – Traditions Management – is planning to convert it into a senior housing facility with 15 memory care units and five assisted living units. This new facility will satisfy most of the excess senior housing demand in Preston for several years.

FILLMORE COUNTY SENIOR HOUSING
MAXFIELD RESEARCH INC. 49
Year TotalProject Name/City Built Units Vacant No. Type Sizes Comments
Canton Manor 1984 8 1 7 - 1BR $475 - $640 Canton (base) (market)
1 - 2BR $500 - $660(base) (market)
Lakewood Apts. 1984 24 3 24 1BR Chatfield $140 - $400
Harmony Apts. 1986 12 0 12 - 1BR $420 - $613 Harmony (base) (market)
Harmony Manor 1977 20 2 18 - 1BR Harmony 2 - 2BR
Kenilworth Apts. 1982 19 0 18 - 1BR $320 - $371 Lanesboro 1 - 2BR $360 - $411
Sylvan Manor Apts. 1979 20 0 19 - 1BR Lanesboro 1 - 2BR
Prairie View Manor 1996 8 0 7 - 1BR $460 - $626 Ostrander 1 - 2BR $480 - $651
J & L Properties n/a 14 2 14 - 1BR Preston
n/a
600
800Rural Development subsidy. No residents pay basic rent, depends on income. Heat, water and trash removal included, electricity separate. Community room, off-street parking w/plug-ins, coin-op laundry. Profile: avg age is 68, 2 married couples.
TABLE 19SUBSIDIZED SENIOR HOUSING
FILLMORE COUNTYDecember 2008
600
Unit Mix/Sizes/RentsMonthly Rent
621
780
Rural Development subsidy. Community room; off-street parking w/plug-ins; coin-op laundry. No residents pay basic rent. Water, sewer, garbage included in rent. Profile: avg age is 70, no couples.
n/a
n/a
Rural Development subsidy. Community room; off-street parking w/plug-ins; coin-op laundry. No residents pay basic rent. Heat, garbage, water, sewer included in rent. Profile: avg age is 70, one couple.
$524
n/a
n/a
n/a
n/an/a
$446
HUD subsidy; residents pay 30% of AGI toward rent. Projet does not include activities or any other services. Includes transportation from Rochester and meals on wheels. Heat, water, sewer, and trash are included in the rent.
30% of Income30% of Income
Section 8 assistance. Three-story building; elevator; off-street parking; community room w/kitchen, coin-op laundry; Gas, water, and sewer included in rent. Avg age is 83, two couples. No residents paying MR rents.
$677 (market)
Section 8 assistance. Two-story building; off-street parking; community room with kitchen; coin-operated laundry. All utilities covered. Avg age is 75, three couples.
Rural Development subsidy. Two residents pay basic rent and five pay market rent. Two-story building; off-street parking w/electrical plugs; community room with kitchen; coin-operated laundry. Heat, wter, sewer, garbage is included. Avg age is 85, one couple.
Rural Development building. Nine residents pay basic rent and two pay market rent.n/a

FILLMORE COUNTY SENIOR HOUSING
MAXFIELD RESEARCH INC. 50
Year TotalProject Name/City Built Units Vacant No. Type Sizes Comments
Good Shepard Apts. 1980 32 0 32 - 1BR Rushford
Downtowner 1980 12 0 12 - 1BR Spring Valley
Hillside Homes 1979 37 0 1 - 1BR (HC) Spring Valley 36 - 1BR
n/a = not available
Source: Maxfield Research Inc.
TABLE 19
$549 (market)
SUBSIDIZED SENIOR HOUSING
525 HUD subsidy; residents pay 30% of AGI toward rent. Rent can go as low as $25 per month. Project does not include transportation, activities, meals, or any other services.
FILLMORE COUNTYDecember 2008
(continued)
$478 (market)n/a
Rural Development subsidized. One story building, private entrances for all units; common coin-operated laundry; community rom; off-street parking; residents pay for gas heat.
Section 8 assistance; restricted to seniors and persons w/diabilities. Three-story building with elevator; common coin-operated laundry; off-street parking; residents pay for electric heat. Avg Age is 70, 3 couples. Most from Spring Valley area.
$478 (market)
550 $313 (base)$485 (market)
Unit Mix/Sizes/RentsMonthly Rent

FILLMORE COUNTY FOR-SALE HOUSING
MAXFIELD RESEARCH INC. 51
Market Conditions For-Sale Housing
Introduction This section of the report summarizes recent trends and the current supply of for-sale housing in Fillmore County, including single-family, townhomes, and condominiums. This section examines the market conditions for for-sale housing in Fillmore County by examin-ing data on:
home resale value trends since 2004, pricing and trends of new housing, planned and proposed for-sale housing developments, and interviews with housing professionals and municipal staff members who are familiar with
for-sale housing trends.

FILLMORE COUNTY FOR-SALE HOUSING
MAXFIELD RESEARCH INC. 52
Home Resales Tables 20 and 21 show trends in the average resale price of single-family homes and town-home/condominiums in Fillmore County from 2004 through 2008. The resale data is from the Regional Multiple Listing Service. The following are key findings about the resale housing mar-ket.
As shown in Table 20, the number of home resales has steadily decreased through 2008 pri-marily due to the economic crisis. As of October 2008, there were 127 single-family home resales in the County, down from 267 in 2004.
The average resale price of homes in Fillmore County increased by an annual average of 7.4% from 2004 to 2007. This past year, however, the average resale price actually de-creased by 0.9%. The housing slowdown that has affected the entire State of Minnesota, as well as the nation, has also impacted the for-sale housing market in Fillmore County.
Table 20 shows that between 2007 and 2008, the average resale price of single-family homes declined in five of the 14 communities in Fillmore County. While this provides a good indi-cation that the housing market has slowed, it should be noted that it does not mean that homes in general are depreciating. Rather, there were fewer home sales in 2008 and it is likely that the decrease in sales was greatest among higher priced homes, thereby lowering the overall average resale price. An exception would be Rushford Village, where the number of resales declined from eight sales in 2007 to three sales in 2008, but the average resale price increased from $131,075 to $215,000. This is a very large increase, which could be ex-plained by the relatively low number of sales and the fact that resales of a few expensive homes could greatly change the average.
Table 21 shows the distribution of single-family home resales in Fillmore County in six price ranges from 2004 to October 2008. The Table shows that in 2004, 92.5% of the single-family home resales were priced below $200,000 and only 7.5% were priced above $200,000. By 2008, 87.4% of the home resales were priced below $200,000 and 12.6% were priced above $200,000.
Table 20 shows that the average resale price of single-family homes sold in the County in 2008 was about $105,000. The Townships had the highest average resale price ($168,500), followed by Rushford Village ($215,000) and Chatfield ($53,000). Ostrander, Wykoff, Lanesboro, Canton, and Mabel all had an average resale price under $100,000.

FILLMORE COUNTY FOR-SALE HOUSING
MAXFIELD RESEARCH INC. 53
No. Median No. Median No. Median No. Median No. MedianYear Sold Sales Price Sold Sales Price Sold Sales Price Sold Sales Price Sold Sales Price
Mabel City 14 $63,500 21 $65,000 11 $68,900 12 $78,305 8 $75,350Rushford Village 9 $135,000 6 $148,750 5 $115,000 8 $131,075 3 $215,000Rushford City 33 $98,500 30 $115,000 33 $110,000 23 $168,500 13 $143,400Peterson City 8 $87,250 1 $108,000 1 $113,000 3 $80,000 4 $112,000Canton City 6 $51,050 6 $61,250 6 $50,000 3 $82,700 2 $47,500Whalan City 1 $144,000 2 $67,100 0 -- 2 $38,986 0 --Harmony City 21 $74,900 28 $85,500 17 $86,500 16 $78,500 8 $78,950Preston City 27 $84,600 21 $71,000 21 $81,400 15 $87,600 10 $105,500Lanesboro City 22 $128,500 10 $108,750 7 $95,950 15 $115,000 3 $70,000Fountain City 9 $107,500 9 $124,900 7 $110,900 4 $96,177 5 $147,500Chatfield City 25 $121,340 27 $118,000 23 $137,000 21 $145,000 26 $153,000Wykoff City 8 $88,450 5 $74,000 6 $71,720 2 $70,250 2 $71,350Ostrander City 6 $64,450 4 $70,200 8 $57,220 4 $39,950 4 $65,250Spring Valley City 43 $88,000 43 $101,000 38 $110,000 40 $111,988 21 $105,000 Subtotal 232 $88,225 213 $93,250 183 $95,950 168 $85,150 109 $105,000
Townships 35 $127,500 37 $149,350 32 $150,224 30 $146,750 18 $168,500
Fillmore County 267 $92,800 250 $100,125 215 $108,000 198 $115,000 127 $114,000
Sources: Fillmore County Assessors' Office, Maxfield Research Inc.
2008 (YTD)2004 2005 2006 2007
TABLE 20VOLUME AND MEDIAN SALES PRICE OF HOMES SOLD
CITIES IN FILLMORE COUNTY2003 through October 2008

FILLMORE COUNTY FOR-SALE HOUSING
MAXFIELD RESEARCH INC. 54
Price Range No. Pct. No. Pct. No. Pct. No. Pct. No. Pct.
<$100,000 152 56.9% 124 49.6% 100 46.5% 82 41.4% 46 36.2%$100,000 to $149,999 65 24.3% 82 32.8% 70 32.6% 64 32.3% 42 33.1%$150,000 to $199,999 30 11.2% 23 9.2% 29 13.5% 34 17.2% 23 18.1%$200,000 to $249,999 10 3.7% 16 6.4% 9 4.2% 7 3.5% 10 7.9%$250,000 to $299,999 4 1.5% 3 1.2% 4 1.9% 5 2.5% 3 2.4%$300,000 and Over 6 2.2% 2 0.8% 3 1.4% 6 3.0% 3 2.4%
267 100% 250 100% 215 100% 198 100% 127 100%
Min.Max.Med.Avg.
Sources: Fillmore County Assessors' Office Maxfield Research Inc.
$126,549$110,959 $112,663 $114,010 $131,650
$350,000$92,800 $100,125 $108,000 $115,000 $114,000
$1,235,000 $1,319,000 $400,000 $1,189,000
2008 (YTD)
$11,000 $10,000 $14,700 $15,000 $17,092
2004 2005 2006 2007
TABLE 21HOMES SOLD BY PRICE RANGE
FILLMORE COUNTY2004 through October 2008

FILLMORE COUNTY FOR-SALE HOUSING
MAXFIELD RESEARCH INC. 55
While there generally are pockets of entry-level and move-up homes in each of the cities of Fillmore County, the communities with the most affordable single-family housing stock overall were the communities in the western and southeastern portions of the County. Prices in these communities are generally lower because of their rural nature and distance from lar-ger communities. In addition, they contain a greater proportion of older homes, as they have not experienced as significant new home construction over the past decade as Chatfield, Spring Valley or Peterson.
Current Supply of Homes on the Market Table 22 shows the number of homes currently listed for sale in Fillmore County communities, distributed into five price ranges. The current listings are shown for the five largest communities and the smaller communities combined (due to limited listings in any one community). The data was obtained from the Southeast Minnesota Realtors Association and Realtor.com websites. Key findings from our assessment of the actively listed homes in the County are: The average price of homes currently listed for sale in Fillmore County communities shown
in Table 22 are generally higher than the actual resales that have occurred over the past few years. The lower resale averages may be due in part to higher priced homes staying on the market longer than lower priced homes – such that at any given time, there is a more bal-anced supply of entry-level and upper-end homes available to purchase, but over the long-term more entry-level homes are actually sold.
The median list price of homes for sale in Fillmore County varied between communities.
The median price was highest in Lanesboro ($224,900), as it did not have any homes listed under $150,000. Of the larger communities, Harmony and Preston had the lowest median, at about $70,000 in each community.
The median list price of homes in Chatfield was roughly $125,000 with a majority of home
listings (15) being under $150,000. While Chatfield median price is higher than most of the other communities in the County, it is less than in Rochester. Thus, Chatfield, along with other communities in the northern part of Fillmore County, has drawn residents who work in Rochester but are willing to commute to lower their housing costs.

FILLMORE COUNTY FOR-SALE HOUSING
MAXFIELD RESEARCH INC. 56
Price Range No. Pct. No. Pct. No. No. Pct. Pct. No. Pct. No. Pct. No. Pct.
<$100,000 7 31.8% 6 100.0% 0 0.0% 8 72.7% 1 9.1% 19 61.3% 12 63.2%$100,000 to $149,999 8 36.4% 0 0.0% 0 0.0% 2 18.2% 6 54.5% 7 22.6% 4 21.1%$150,000 to $199,999 4 18.2% 0 0.0% 2 28.6% 1 9.1% 4 36.4% 0 0.0% 0 0.0%$200,000 to $249,999 2 9.1% 0 0.0% 2 28.6% 0 0.0% 0 0.0% 0 0.0% 0 0.0%$250,000 and Over 1 4.5% 0 0.0% 3 42.9% 0 0.0% 0 0.0% 5 16.1% 3 15.8%
22 100% 6 100% 7 100% 11 100% 11 100% 31 100% 19 100%
Min.Max.Med.Avg.
* Includes Canton, Fountain, Mabel, Ostrander, Peterson and WykoffSources: Southeast Minnesota Realtors Association; Maxfield Research Inc.
TABLE 22HOMES CURRENTLY LISTED FOR-SALE
FILLMORE COUNTY COMMUNITIESJanuary 2009
$425,000$144,950$161,425
$48,900$289,900$125,200$140,288
$172,500$69,900$83,264
$69,900$69,900
Preston RushfordHarmony
$33,000 $19,900$49,900$94,900
$224,900
Chatfield Lanesboro
$154,900$360,000
$249,057
Spring Valley
$39,900$849,000$95,600
$133,985
$499,000$89,900$145,337
OtherCommunities*
$25,900

FILLMORE COUNTY FOR-SALE HOUSING
MAXFIELD RESEARCH INC. 57
New For-Sale Housing Subdivisions Maxfield Research Inc. surveyed actively marketing subdivisions in Fillmore County in Novem-ber, December 2008 and January 2009. In total, 16 subdivisions were surveyed, with a total of 363 lots. Almost all of the lots are for single-family homes, although some of the subdivisions also allow twinhomes. Orchard Ridge in Chatfield, Parkview addition in Mabel, and North Park Estates in Spring Valley are subdivisions entirely of twinhome lots. Table 23 summarizes infor-mation on each inventoried subdivision, including information on year platted, total lots, lots available, typical lot sizes and prices, and typical home prices. Key points about the actively marketing subdivisions are listed below.
Table 23 shows that all of the communities had active subdivisions except Wykoff, Whalen, Canton and Peterson. These communities are smaller with little to no residential develop-ment occurring. Through most of this decade, development had been brisk enough in the remaining communities that all of the subdivisions were platted within the past 10 years.
Over 210 lots within the inventoried subdivisions were identified as vacant and available for a new home. Chatfield had the greatest inventory of available lots at 64, followed by Spring Valley (42 lots), Fountain (40 lots), Lanesboro (26 lots), and Harmony (25 lots). New con-struction cannot occur in Fountain until the sewer system is expanded, which is projected to begin in March 2009.
Of the 13 single-family subdivisions, six have lots that support the construction of entry-level homes (priced under $200,000). Beginning prices for new homes in these subdivisions aver-ages about $150,000. Some homes in these subdivisions are built with prices up to about $300,000, however. Most subdivisions have lots that support move-up housing – or homes priced between $200,000 and $300,000. Executive homes, priced at over $300,000 are be-ing built mostly in subdivisions in Chatfield, Lanesboro, and some in Harmony. Overall, we estimate that most executive homes being built in Fillmore County are in the townships.
Based on our estimates of pricing, about 40% of newly-constructed single-family homes are
affordable to modest income buyers. The greatest supply of affordable lots is in the Bucknell subdivision in Spring Valley (24 lots). Lots begin at $25,000 and would be reduced by an additional $10,000 for income-qualified buyers.
Between entry-level new construction homes and the existing resale market (the average re-sale price was $126,000 in 2008 for existing homes) there are adequate ownership options for modest income households in Fillmore County.
4 One factor leading to higher prices for new single-family homes in Lanesboro is lot costs.
With land at a premium, lots in Lanesboro are anywhere between double and triple, on aver-age, than lots in other communities in Fillmore County.

FILLMORE COUNTY FOR-SALE HOUSING
MAXFIELD RESEARCH INC. 58
Year Type ofSubdivision Platted Homes Total Avail.
ChatfieldHilltop Estates 2008 SF 17 13 13,000 - 43,500 $50,000 - $69,000
(Phase I)Fingerson-Donahoe 2002 SF 30 15 8,400 - 15,000 $35,000 - $65,000 $150,000 - $350,000
Lonestone 2008 SF 65 30 9,000 - 10,125 $31,000 - $45,000 $140,000 - $250,000
Orchard Ridge 2001 TH 24 6 $180,000 - $200,000Twinhomes
FountainJunge Addition North
Phase I 2008 SF 12 12Phase II Pend. SF 28 28
HarmonyHahn Addition 1999 SF 17 10 12,000 - 30,000 $140,000 - $300,000
Southview Addition 1999 SF 11 7 14,400 - 33,500 $23,000 - $34,100 $118,000 - $185,500
Scrabeck Addition 2006 SF 14 8 13,600 - 16,000 $23,500 - $29,500 $225,000 - $350,000
LanesboroSouthern Hills 2000 SF 15 4 43,500 - 152,500 $55,000 - $60,000 $250,000 - $400,000
Southern Woods 2000 SF 65 22 15,000 - 30,000 $44,900 - $84,900 $250,000 - $450,000
MabelParkview Addition 2001 TH 4 0 $127,000 - $130,000
Gjere 1st Addition 2006 SF/ 9 4 $20,000 - $25,000 $250,000 - $500,000TH
PrestonGolf View Estates 2001 SF/TH 16 11 $230,000 - $450,000
Rushford VillageWoodland Heights 2002 SF 12 1 $34,000 - $45,000 $194,000 - $220,000
Spring ValleyNorth Park Estates 2002 TH 24 18
Bucknell* 2006 SF 24 24 $25,000 - $30,000*
* There is a $10,000 lot price reduction if buyers are income-qualified.
Source: Maxfield Research Inc.
N/A N/A
Lot Inventory Lot Sizes Base Lot Price Typical Home Price
N/A Incl. in Home Price
TABLE 23RECENTLY COMPLETED AND ACTIVE FOR-SALE HOUSING DEVELOPMENTS
FILLMORE COUNTYNovember 2008
$149,900
(Sq. Ft.) (w/o assessments) (including lot price)
$319,000
n/a Incl. in Home Price
$20,000
14,000
10,000
2.5 - 10 acres
10,900 $35,000
$5,000
8,000 n/an/a8,000 n/a n/a

FILLMORE COUNTY FOR-SALE HOUSING
MAXFIELD RESEARCH INC. 59
A three-year lot supply is an industry standard to allow for adequate consumer choice but not prolonged developer carrying costs. Given the average of about 50 new homes built per year in Fillmore County’s communities over the past few years, the current supply of about 210 lots would constitute a four-year supply. However, given the downturn in the housing mar-ket in the past couple years, the current lot supply may last longer. Some communities will likely need more lots sooner. These include Preston and Rushford, which have very few lots available. Chatfield and Spring Valley have the greatest supply.
Almost all of the new homes being added in the subdivisions inventoried in Table 23 are sin-gle-family homes. Only Orchard Ridge Townhomes in Chatfield, Parkview Addition in Mabel, and North Park Estates in Spring Valley are entirely twinhomes. Average prices for these units range from about $140,000 at Parkview and North Park Estates to about $190,000 at Orchard Ridge. Orchard Ridge has averaged just over two units built annually since it was platted in 2001 and North Park Estates has averaged less than one per year. It should be noted that townhomes are also allowed in some other subdivisions that are primarily single-family homes.
The townhomes developments in Fillmore County are almost exclusively one-level units. These one-level units are typically marketed toward empty-nesters downsizing from single-family homes. With the first baby boomers reaching their 60s this decade, the proportion of townhome buyers seeking one-level units will increase over the coming decades. Two-story units are typically built in larger urban areas as an affordable alternative to single-family homes and are marketed toward younger buyers who are often first-time buyers. Because ex-isting single-family homes are affordable in Fillmore County, there would be very little de-mand for affordable two-story townhome units.

FILLMORE COUNTY CONCLUSIONS AND RECOMMENDATIONS
MAXFIELD RESEARCH INC. 60
Conclusions and Recommendations
Introduction This section of the report presents calculations of demand for various types of housing in Fill-more County from 2008 to 2020, and provides recommendations for types of housing that could be supported in the short-term. The demand calculations and housing recommendations were made based on the analysis of data presented in this report, including demographic and employ-ment growth trends and characteristics, housing stock characteristics, and housing market condi-tions. This section includes:
housing demand calculations from 2008 to 2020, overall housing recommendations for Fillmore County, a summary of demographic and housing characteristics and market conditions for each com-munity, and
housing recommendations for each community.

FILLMORE COUNTY CONCLUSIONS AND RECOMMENDATIONS
MAXFIELD RESEARCH INC. 61
Demographic Profile and Housing Demand The demographic profile in Fillmore County will affect housing demand and the types of hous-ing that are needed. The various household types are:
1. Entry-level householders • Often prefer to rent basic, inexpensive apartments • Usually singles or couples in their early 20's without children • Will often “double-up” with roommates in apartment setting
2. First-time homebuyers and move-up renters
• Often prefer to purchase modestly-priced single-family homes and townhomes or rent more upscale apartments
• Usually married or cohabiting couples, some with children, in their mid-20's or 30's
3. Move-up homebuyers
• Typically prefer to purchase newer, larger, and therefore more expen-sive single-family homes
• Typically families with children where householders are in their late 30's to 40's
4. Empty-nesters (persons whose children have grown and left home) and never-
nesters (persons who never have children) • Prefer owning and some will move to alternative lower-maintenance
housing products • Generally couples in their 50's or 60's
5. Younger independent seniors
• Prefer owning but will consider renting their housing • Some will move to alternative lower-maintenance housing products • Will often move (at least part of the year) to retirement havens in the
Sunbelt and desire to reduce their responsibilities for upkeep and maintenance
• Generally in their late 60's or 70's
6. Older seniors • May need to move out of their single-family home due to physical
and/or health constraints or a desire to reduce their responsibilities for upkeep and maintenance
• Generally single females (widows) in their mid-70's or older Demand for housing can come from several sources including: household growth, changes in housing preferences, and replacement need. Household growth necessitates building new hous-ing unless there is enough desirable vacant housing available to absorb the increase in house-

FILLMORE COUNTY CONCLUSIONS AND RECOMMENDATIONS
MAXFIELD RESEARCH INC. 62
holds. Demand is also affected by shifting demographic factors such as the aging of the popula-tion, which dictates the type of housing preferred. New housing to meet replacement needs is required, even in the absence of household growth, when existing units no longer meet the needs of the population and when renovation is not feasible because the structure is physically or func-tionally obsolete. Smaller communities and rural areas, such as Fillmore County, tend to have higher proportions of younger households that own their housing than in the larger growth centers or metropolitan areas. In addition, senior households tend to move to alternative housing at an older age. These conditions are a result of housing market dynamics, which typically provide more affordable sin-gle-family housing for young households. Therefore, the age categories for housing life cycles will be somewhat different in Fillmore County than in communities located in larger urban areas. The aging baby boom generation will have a big effect on the housing market in Fillmore County. Baby boomers are currently ages 44 to 62, and as they age over the next 12 years, they will increase the population in the mid-50s to mid-70s age range. Many of these baby boomers who become empty nesters may prefer to downsize or desire maintenance-free alternatives. Between 2008 and 2020, Fillmore County is projected to see an increase of approximately 745 households. Since each household equates to an occupied housing unit, the County will need to build an equal number of housing units to support this growth. Because of the older age of the County’s housing stock, demand for housing in Fillmore County will be driven not only by household growth, but also by replacement need. Over 4,200 of the County’s homes were built before 1950 (45% of the total housing stock). While we observed that the overall housing stock is in good condition, we estimate that half a percent of these homes built before 1950 should be replaced annually. Replacing these older homes, along with the homes lost in the flooding in Rushford in 2007, creates the need another 340 replacement homes. Most of the homes that should be replaced are small, functionally obsolete, and no longer meet the expectation of to-day’s households. With household growth and replacement need combined, we find demand for about 1,085 new housing units in Fillmore County from 2008 to 2020. Rental and Senior Housing Demand Table 24 shows demand calculations for rental housing, including senior rental, in Fillmore County between 2008 and 2020. The table displays demand for general-occupancy housing by “subsidized” (affordable to households with incomes at or below 60% of median) and market rate. Senior housing is also displayed by subsidized as well as market rate by service level. The demand calculations in Tables 24 are shown by community as well as the townships as a whole. It should be noted that to the extent that households are mobile and different market segments are willing to seek out various housing products in adjacent communities, or even out-side the County, the demand figures in the tables may experience fluctuations between communi-ties. The following are key points from Table 24.

FILLMORE COUNTY CONCLUSIONS AND RECOMMENDATIONS
MAXFIELD RESEARCH INC. 63
4 Fillmore County is projected to need 1,085 housing units to accommodate household growth and replacement need between 2008 and 2020. Overall, we project that about 30% of the new housing units added will need to be rental to satisfy renter and senior demand. This is higher than the County’s rental rate of 17% in 2000. The primary factor for the increase in the rental rate is growing demand for senior rental housing – including assisted living.
Based on the growth of younger and older age groups and current market conditions, we pro-
ject that about 65% of the County’s renter demand between 2008 and 2020 will be for age-restricted (senior) units and the remainder will be for general-occupancy units. This equates to demand for approximately 125 general-occupancy units and 210 senior rental units. (Be-tween 2008 and 2020, the 65+ population is projected to grow by over 900 people while the 18 to 34 age group is projected to experience a loss of almost 500 people.)
Between 2008 and 2020, about 5% of the senior rental demand (12 units) and 55% of the general-occupancy rental demand (65 units) will be from low- and moderate-income house-holds who could not afford market rents, and therefore would need subsidized/affordable housing. Among the general-occupancy demand, we estimate that about 20% of the demand will be from households income-eligible for rental housing affordable at 50% to 60% of me-dian income, or the typical income limits for units created through the Low Income Housing Tax Credit program (LIHTC).
Demand for general-occupancy rental housing will be concentrated in the County’s five larg-est communities – Chatfield, Harmony, Preston, Rushford, and Spring Valley. Rental de-mand is more limited in the smaller communities, primarily because limited job growth is creating limited housing demand, the younger population is not growing significantly, if at all, and the affordability of existing single-family homes allows a greater proportion of younger people with modest incomes to become homeowners than in larger communities.
Market rate senior housing is a relatively new concept in the County, as well as the State. There were only 44 service-intensive (congregate, assisted living, and memory care) market rate units in 2000. Combining those units with the 128 units added in the County so far this decade and the projected demand for 140 units between 2008 and 2020 would result in a sup-ply of about 372 units in 2020. The overall ratio of service-intensive market rate senior units to the senior (65+) population in 2020 would be about 1:17 (one senior unit for every 17 sen-iors) up from about 1:97 in 2000. In comparison, the Twin Cities Metro Area has a ratio of about 1:12 in 2008.
There will be seniors from the smaller communities in the County who will need/desire sen-ior housing. However, demand in these communities will be too small to support a develop-ment. Thus, demand from the seniors in these communities will be met by developments in the County’s larger communities.

FILLMORE COUNTY CONCLUSIONS AND RECOMMENDATIONS
MAXFIELD RESEARCH INC. 64
Projected Household Growth+Replacement Need Estimated percent rentersTotal New RentersProportion General-Occupancy/Senior 44 / 56 38 / 62 16 / 84 45 / 55 32 / 68 29 / 71 0 / 0 37 / 63No. of Units (G-O/Senior) 30 / 38 10 / 16 8 / 42 48 / 58 18 / 38 8 / 20 0 / 0 122 / 212
General OccupancyPercent Subsidized Shallow Subsidy (50-60% of Median) Deep Subsidy (50% of Median) Number (total)
Percent Market Rate Number
Senior Rental HousingPercent Subsidized Adult Number
Percent Market RateAdultCongregateAssisted LivingMemory Care
Number (total)
Source: Maxfield Research Inc.
604436
66
46%56
6%12
6094%
TABLE 24DEMAND FOR ADDITONAL RENTAL HOUSING
FILLMORE COUNTY2008 to 2020
Spring RemainingChatfield
10
FillmoreValley Communities Townships
40056% 21% 0%
CountyHarmony
170 65 75 140
Preston Rushford
1,08510040% 40% 67% 76% 31%
135
28 0 33468 26 50 106
54%60% 40% 50% 58%
56
2 08 2 2 844% 50% --
2610 2 2 20 4 2 0 40
4
18 4 4 28 8 4 0
6
56% 50% -- 10 4 0
40% 60% 50% 42%12 6 4 20
8
0 -- -- -- 21%
12 --
0 0
79% 100%
-- -- 0 00
816
8100% -- 100% --
0200
-- 0
220
12 4 610 4 8 1210 0
02 8 1088 0
2000
38 16 42 46 38 20

FILLMORE COUNTY CONCLUSIONS AND RECOMMENDATIONS
MAXFIELD RESEARCH INC. 65
Figure 2 below displays a summary of demand calculations for various rental products in Fill-more County from 2008 to 2020.
Figure 2 Fillmore County Rental Housing Demand Summary – 2008 to 2020
Market Rate66 56
44 36
Affordable
12 60 60
122
Affordable Adult Congregate Assisted Living Memory Care
212
Rental Housing Demand334
General-OccupancySenior Rental
For-Sale Housing Demand Table 25 shows for-sale demand calculations in Fillmore County from 2008 to 2020. The table displays for-sale demand by single-family and multifamily (twinhomes, townhomes and condo-miniums). Single-family demand is calculated for modest homes (<$200,000), move-up homes ($200,000 to $300,000) and executive homes ($300,000+). Multifamily housing is calculated by modest homes (<$200,000) and move-up homes ($200,000+). The price ranges for these hous-ing products are quoted in 2008 dollars. As with rental housing, it should be noted that to the extent that households are mobile and dif-ferent market segments are willing to seek out various housing products in adjacent communi-ties, or even outside the County, the demand figures in Table 25 may experience fluctuations be-tween communities. The following are key points from Table 25. Overall, about 70% of the housing demand in Fillmore County between 2008 and 2020 will
be for ownership housing, or about 750 homes. This equates to just over 60 new homes an-nually. This is down considerably from the 120+ new homes added annually earlier this dec-ade. Over the next couple of decades, the aging of the population will cause a shift in hous-ing demand to include more senior housing and fewer single-family homes. In addition, the early-2000s was a period of robust development that likely will go unmatched over the next decade or longer.

FILLMORE COUNTY CONCLUSIONS AND RECOMMENDATIONS
MAXFIELD RESEARCH INC. 66
Until this current decade, nearly all of the for-sale homes developed in Fillmore County were single-family homes. However, with an increasing proportion of buyers being older adults and seniors, demand for twinhomes and townhomes is increasing, especially for those that would be association maintained. Twinhomes and townhomes appeal to empty nesters be-cause they offer a more maintenance-free environment (allowing more time for travel or other activities) compared to a single-family home. Between 2008 and 2020, we project that 25% to 30% of the for-sale demand in the communities will be for townhomes and twin-homes – or a total of 100 multifamily units. All of the for-sale demand in the townships will be for single-family homes.
In Fillmore County, demand for multifamily owned housing will be almost exclusively gen-
erated by older adults and seniors (mostly empty nesters). Younger households are generally attracted to townhomes if they are more affordable than single-family homes. Because the supply of existing single-family homes in the County is affordable (and generally less than the price for a new townhome), we believe that almost all younger households will prefer single-family homes.
Overall, we project that less than 30% of the demand for new single-family homes will be for
modest homes priced under $200,000 (205 homes between 2008 and 2020). While a greater percentage of the overall demand for housing will be for modest homes, the existing supply will meet most of this demand. This is particularly true when seniors are moving from their single-family homes into either senior housing or townhomes.
About two-thirds of the new single-family homes built in Fillmore County between 2008 and
2020 are projected to be move-up ($200,000 to $300,000) or executive homes ($300,000+). A significant portion of the executive homes will be developed in the townships, where peo-ple seek to build homes on larger acreages.
Figure 3 displays a summary of demand calculations for various for-sale housing products in Fillmore County from 2008 to 2020.
Figure 3 Fillmore County For-Sale Housing Demand Summary – 2008 to 2020
For-Sale Demand
750
Modest Move-Up
Multifamily
205 85Move-Up
360Executive
85 15
100Single-Family
650
Modest

FILLMORE COUNTY CONCLUSIONS AND RECOMMENDATIONS
MAXFIELD RESEARCH INC. 67
Projected Household Growth+Replacement Need
Estimated homeownership Rate
Total New HomeownersProportion Single-Family/Multifamily 70 / 30 75 / 25 70 / 30 70 / 30 65 / 35 75 / 25 100 / 0 87 / 13No. of Units (Single-Family/Multifamily) 71 / 31 29 / 10 18 / 8 24 / 10 29 / 15 80 / 27 400 / 0 651 / 100
Single-FamilyPercent Modest (<$200,000) Number
Percent Move-up ($200,000-$300,000) Number
Percent Executive ($300,000+) Number
Multifamily - General-OccupancyPercent Modest (<$200,000) Number
Percent Move-Up ($200,000+) Number
Source: Maxfield Research Inc.
280 36170% 56%
29 12 7 8 6 2020% 25%40% 40% 40% 35%
Townships
TABLE 25DEMAND FOR ADDITIONAL FOR-SALE HOUSING
FILLMORE COUNTY2008 to 2020
Remaining FillmoreChatfield Harmony Preston Rushford Valley Communities County
Spring
170 65 75 140 100 135 400 1,085
60% 60% 33% 24% 44% 79% 100% 69%
102 39 25 34 44 107 400 751
70% 15%45% 55% 35% 55% 32%32 16 6 13 21 56 60 205
75%
15% 5% 25% 5% 5% 5% 15% 13%11 1 4 2 1 4 60 84
80% 85% 85% 85% 85% 90% -- 75%24 8 6 9 13 24 -- 85
20% 15% 15% 15% 15% 10% -- 25%6 1 1 2 2 3 -- 15

FILLMORE COUNTY CONCULSIONS
MAXFIELD RESEARCH INC. 68
Fillmore County Housing Recommendations The housing demand calculations in Tables 24 and 25 indicate that between 2008 and 2020, an estimated 1,085 housing units will be needed in Fillmore County to satisfy the housing demand of current and future residents. The chart below displays demand by type of housing. The ma-jority of housing demand through 2020 will be for owned housing, particularly single-family homes (about 650 homes). Following demand for single-family homes will be demand for mar-ket-rate senior housing (200 units). Overall, about 80 new affordable housing units will be needed to accommodate demand from low- and moderate-income renters and seniors. The Bluff Country HRA or another governmental agency will likely need to assist in development of these units to meet this affordable demand.
Demand by Housing TypeFillmore County, 2008 to 2020
0 100 200 300 400 500 600 700
Senior - Affordable
Senior - Market Rate
Rental - Affordable
Rental - Market Rate
Townhome/Condo
Single-Family
Number of Units
Almost all of the demand through 2020 for new single-family homes and townhomes will be from moderate- to higher-income younger households and empty-nesters with significant equity in an existing home. Private developers are likely to meet the demand from these buyers with new products, with minimal public assistance. The existing housing stock will meet the demand for modestly-priced single-family homes. However, public assistance in the form of home reha-bilitation loans for low- and moderate-income homeowners will be needed to help maintain the quality of the affordable housing stock. This will be important to meeting future housing needs, since the County’s smaller communities do not have enough growth to justify developing new apartment or senior buildings. Thus, the existing housing stock will play a large role in meeting future housing needs. Additional senior developments will be needed to meet the demand from the growing senior population in Fillmore County over the next decade. This includes both independent rental de-velopments as well as market rate service-intensive developments (i.e., congregate, assisted liv-ing, and memory care).

FILLMORE COUNTY CONCULSIONS
MAXFIELD RESEARCH INC. 69
The following pages outline key findings from the demographic and housing market analyses and present specific recommendations for each community in the County. Because households are mobile and are willing to seek out various housing products in adjacent communities, the demand figures shown for each community may experience fluctuations based on trends in de-velopment activity.

FILLMORE COUNTY CONCULSIONS
MAXFIELD RESEARCH INC. 70
Canton - Summary of Demographic and Housing Findings Canton is a smaller community that has been experiencing slight declines in its population and household base. Currently, Canton has about 325 people. Between 2008 and 2020, Canton is projected to lose five households, meaning that there will be no housing demand generated from household growth. There will be some housing demand from replacement need of older, obso-lete housing. We project total demand for five new housing units in Canton by 2020. Key demographic trends affecting housing needs over the next 12 years are shown below. Be-sides the lack of growth, the greatest demographic trend impacting housing demand will be the aging of the population. While the younger populations are not projected to see any growth, the 65+ age group is projected to grow by 20%.
1990 2000 2010 2020Population 362 343 325 310Households 160 157 155 150
Number PercentAge 18 to 44 -10 -12.5%Age 45 to 64 -10 -8.7%Age 65+ 15 20.0%
Homeowners 138 (89.0%)Renters 17
Population & Household Growth Trends & Projections
Adult Population Growth by Age Group, 2010 to 2020
Household Mix in 2008
Being a small town, the vast majority of Canton’s housing stock is single-family homes. Due to the age of housing and the limited need for new housing, maintaining the quality of the existing housing stock will be one of Canton’s greatest housing needs over the next decade.

FILLMORE COUNTY CONCULSIONS
MAXFIELD RESEARCH INC. 71
Canton Recommendations Rental demand in Canton is limited because of the limited job base and the fact that existing homes are affordable to younger households with modest incomes who are the typical market for rental housing. Our research also revealed that the local senior population is not large enough to support a senior building. Thus, we find that all of the demand for new housing will be for owned housing. Because the likely buyers of new homes in Canton will be retired farmers and other seniors, the new homes should be ranch-style homes, and could potentially be a one-level twinhome. We also believe that a rental duplex would appeal to some seniors who wish to re-duce maintenance and homeownership responsibilities. These rental units should be on one-level and feature attached garages and monthly rents of about $700.
Canton Projected Housing Demand, 2008 to 2020
Housing Demand5
Ownership Senior
Adult Rental Service-Intensive
Rental3 2 0
Affordable Market Rate3 0 2 0 0 0
Single-Family Multifamily
Note: Because households are mobile and are willing to seek out various housing products in adjacent com-munities, these demand figures may experience fluctuations. Detailed demand calculations can be found in Tables 24 and 25 of this report.
We understand that the City of Canton will be applying for a grant from the Small Cities Devel-opment Program (managed by the Department of Employment and Economic Development) for the purpose of assisting low- and moderate-income households with rehabilitating their homes. A similar grant for home rehabilitation was received in 2002 and 25 homeowners participated. An additional 25 homeowners remain on a waiting list. Since maintaining the quality of the ex-isting housing stock is a priority, we find that additional funds for home rehabilitation would be very beneficial to the community and recommend pursing funds again in the future if the 2009 grant is not awarded.

FILLMORE COUNTY CONCULSIONS
MAXFIELD RESEARCH INC. 72
Chatfield - Summary of Demographic and Housing Findings Chatfield is located on the Fillmore and Olmstead County line and is the County’s largest com-munity with about 2,700 people. Growth is also greatest in Chatfield, as it is driven by local em-ployment and people commuting to Rochester, which is only about 20 miles away. Between 2008 and 2020, Chatfield is projected to grow by 135 households. Combined with an estimated replacement need of 20 housing units over the 12-year period plus some additional demand gen-erated by a senior building drawing residents from the surrounding rural areas, we project total demand for 170 new housing units by 2020. Key demographic trends affecting housing needs in Chatfield over the next 12 years are shown below. Chatfield is projected to experience steady growth of younger families, which will cause Chatfield to see population growth in every age group, whereas most other rural communities will see a disproportionate amount of their growth in the senior population. Chatfield demo-graphic growth trends indicate that demand will exist for all types of housing, including single-family homes, townhomes, apartments, and senior housing.
1990 2000 2010 2020Population 2,226 2,394 2,735 3,000Households 846 930 1,105 1,225
Number PercentAge 18 to 44 85 8.6%Age 45 to 64 65 11.3%Age 65+ 50 10.1%
Homeowners 862 (79%)Renters 228
Population & Household Growth Trends & Projections
Adult Population Growth by Age Group, 2010 to 2020
Household Mix in 2008
Chatfield has a housing stock that overall is in good condition – with most of the housing being single-family homes. Chatfield has not participated in home rehab programs for low- and mod-erate-income homeowners, however. So far this decade, all of the housing added has been sin-gle-family homes and townhomes, with the exception of Chosen Valley Assisted Living in 2005. The most recent rental development is Mill Pond Townhomes (an affordable rental develop-ment), added in 1999.
Chatfield has plenty of single-family lots with the opening of the first phase of the Hilltop Estates sub-division in 2008. Lots also remain available in the Fingerson-Donahue, Lonestone, and Orchard Ridge Townhome subdivisions.

FILLMORE COUNTY CONCULSIONS
MAXFIELD RESEARCH INC. 73
Chatfield Recommendations Housing demand in Chatfield is more balanced between ownership, rental, and senior than in most other communities in the County. This is because Chatfield has the largest employment base and also has goods and services (including health care) that are attractive to area seniors as they get older. Between 2008 and 2020, we project demand for about 100 owned homes, 40 sen-ior housing units, and 30 rental units.
Chatfield Projected Housing Demand, 2008 to 2020
Affordable Market Rate72 30 8 30 18 12
Single-Family Multifamily Adult Rental Service-Intensive
Rental102 38 30
Housing Demand170
Ownership Senior
Note: Because households are mobile and are willing to seek out various housing products in adjacent com-munities, these demand figures may experience fluctuations. Detailed demand calculations can be found in Tables 24 and 25 of this report.
The demand for 100 owned homes includes about 70 single-family homes for younger families and about 30 twinhomes/townhomes for empty-nesters and other active seniors. The develop-ment of more congregate and assisted living housing in the community will also indirectly satisfy some of the new ownership demand as existing single-family homes become available for younger singles and families as seniors transition into senior housing. The City should consider seeking grant funds for a home rehab program for low- and moderate-income homeowner We calculate demand for about 40 senior housing units with services – including congregate, as-sisted living, and memory care. These units would meet the growing demand from the senior population and could be added to the Chosen Valley Care Center campus if land is available. We also find a small amount of demand for independent rental units for active seniors who wish to rid themselves of the maintenance responsibilities of their single-family homes and would also prefer to rent versus own. About 15% of the overall housing need in Chatfield between 2008 and 2020 is for rental hous-ing, or about 30 units. Most of the rental need will be to provide newer, contemporary units to maintain the overall quality and appeal of the rental stock. The target market will be retiree’s as well as younger people moving to the community. Monthly rents for most of the units should be below the payment standard for the Housing Choice Voucher program, or $471 for one-bedroom units, $622 for two-bedroom units and $832 for three-bedroom units. Any market rate units with rents above the payment standard should be one-level units with attached garages, which would appeal to seniors who could afford the higher rents.

FILLMORE COUNTY CONCULSIONS
MAXFIELD RESEARCH INC. 74
Fountain - Summary of Demographic and Housing Findings Fountain is a community with about 400 people located on Highway 52 between Chatfield and Preston. Its strategic location between Chatfield and Preston has spurred greater household growth than many other rural communities of its size, as residents can easily commute to jobs in these neighboring towns. Between projected household growth and replacement need, we pro-ject demand for 24 housing units over the 12-year period, or about two new homes each year. Key demographic trends affecting housing needs over the next 12 years are shown below. Foun-tain’s population is growing steadily, including among younger age-groups. Seniors are grow-ing, but the numerical growth of seniors is small enough (5 seniors) that demand for new alterna-tive housing would still be minimal.
1990 2000 2010 2020Population 327 343 400 440Households 126 131 155 175
Number PercentAge 18 to 44 15 9.4%Age 45 to 64 5 5.3%Age 65+ 5 10.0%
Homeowners 122 (77.4%)Renters 33
Population & Household Growth Trends & Projections
Adult Population Growth by Age Group, 2010 to 2020
Household Mix in 2008
Fountain’s housing stock consists mostly of single-family homes owned by their occupants. However, 12 new apartment units have been added this decade. The rental units are performing well as they are drawing heavily from people working in adjacent communities. Demand for single-family lots has been steady, but no new development is allowed until Fountain’s sewer capacity is expanded. Expansion is planned for March 2009 and will enable 28 single-family lots to come on-line in the second phase of the Junge Addition.

FILLMORE COUNTY CONCULSIONS
MAXFIELD RESEARCH INC. 75
Fountain Recommendations About two-thirds of the housing demand in Fountain will be for single-family homes and twin-homes. The primary market for these homes will be families working in neighboring communi-ties as well as retiring farmers from the surrounding countryside. Fountain does not have a suffi-cient number of seniors to support the development of a service-intensive senior housing facility (such as assisted living). Local seniors in need of housing with support services will need to re-locate to housing in Chatfield, Preston, or other communities. However, there is potential for a four-plex of one-level rental townhomes with attached garages marketed toward seniors. We would recommend these rental units have two-bedroom units and monthly rents of about $700. While rental demand generated locally will be minimal, there is potential demand to support an-other four-plex with monthly rents of about $500 marketed toward younger households.
Fountain Projected Housing Demand, 2008 to 2020
Affordable Market Rate12 4 4 0 2 2
Single-Family Multifamily Adult Rental Service-Intensive
Rental16 4 4
Housing Demand24
Ownership Senior
Note: Because households are mobile and are willing to seek out various housing products in adjacent com-munities, these demand figures may experience fluctuations. Detailed demand calculations can be found in Tables 24 and 25 of this report.
The 28 lots planned in phase two of the Junge Addition should accommodate most of the de-mand for new homes in Fountain over the next 12 years. Maintaining the quality of the existing housing stock should also be a priority in Fountain. We understand that a rehab program for the purpose of assisting low- and moderate-income households with rehabilitating their homes was administered about ten years ago and was successful. We recommend that Fountain purse rehab funds again in the future.

FILLMORE COUNTY CONCULSIONS
MAXFIELD RESEARCH INC. 76
Harmony - Summary of Demographic and Housing Findings Harmony is located in the south central part of the County and has a population of about 1,100 people. Recent population growth has been modest. While there has been greater household growth, the aging population has resulted in declining household sizes (fewer people per house-hold). Between 2008 and 2020, 45 new households are projected to be added to the community, resulting in a need for new housing. Combined with an estimated replacement need of 15 hous-ing units over the 12-year period plus some additional demand generated by a senior building drawing residents from the surrounding rural areas, we project total demand for 65 new housing units by 2020. Key demographic trends affecting housing needs over the next 12 years are shown below. Growth next decade is projected to slow from this decade’s pace, as it is in most communities around the State. In addition, with the population continuing to age, growth of the younger populations is projected to be limited while the 65+ age group grows by over 20%. This will in-crease the number of residents desiring alternatives to their single-family homes.
1990 2000 2010 2020Population 1,081 1,080 1,150 1,210Households 461 477 540 575
Number PercentAge 18 to 44 -15 -5.5%Age 45 to 64 5 1.5%Age 65+ 75 22.1%
Homeowners 393 (73.9%)Renters 139
Population & Household Growth Trends & Projections
Adult Population Growth by Age Group, 2010 to 2020
Household Mix in 2008
Harmony’s housing stock is in good condition, but is older (over half the single-family homes are at least 50 years old). So far this decade about 20 single-family homes have been built and about 25 lots remain available to accommodate more homes. Also added this decade is Heritage Grove, a 34-unit senior building that includes congregate, assisted living, and memory care hous-ing. This facility is meeting most of the current demand for senior housing with support ser-vices.

FILLMORE COUNTY CONCULSIONS
MAXFIELD RESEARCH INC. 77
Harmony Recommendations We calculate that about 60% of the demand for new housing in Harmony will be for single-family homes and for-sale twinhomes. Some demand was also calculated for additional senior housing and rental units. Given the current pace of development, we project that another subdi-vision with single-family and townhome lots will be needed in Harmony in about five years to provide adequate choices to prospective buyers. New lots should be priced at less than $30,000 (in 2008 dollars). Heritage Grove is meeting most of the senior housing demand in Harmony and while growth is projected in the senior population, it is not projected to be sufficient to support another facility the size of Heritage Grove. Instead, demand will likely only be sufficient to add a roughly 10-unit wing onto the current facility, provided that is structurally feasible. In addition to service-intensive senior housing, we also recommend developing about six independent rental units for active seniors who wish to rid themselves of the maintenance responsibilities of their single-family homes and would also prefer to rent versus own.
Harmony Projected Housing Demand, 2008 to 2020
Affordable Market Rate30 10 6 10 4 6
Single-Family Multifamily Adult Rental Service-Intensive
Rental40 16 10
Housing Demand66
Ownership Senior
Note: Because households are mobile and are willing to seek out various housing products in adjacent com-munities, these demand figures may experience fluctuations. Detailed demand calculations can be found in Tables 24 and 25 of this report.
So far this decade, one 4-plex rental building with detached garages has been added and it is fully occupied. There are few newer rental buildings in Harmony and we recommend another 10 units be built by 2020. Monthly rents for new units should be below the payment standard for the Housing Choice Voucher program, or $471 for one-bedroom units, $622 for two-bedroom units and $832 for three-bedroom units.

FILLMORE COUNTY CONCULSIONS
MAXFIELD RESEARCH INC. 78
Lanesboro - Summary of Demographic and Housing Findings Lanesboro is a historic community of about 850 people located along the Root River. Many of its grander homes have been converted into Bed & Breakfast Inns that draw tourists from across the multi-state area. Lanesboro’s population has remained relatively steady while its household base has increased. This is primarily the result of declining household sizes due to the aging population. Between projected household growth and replacement need, we project demand for 25 new housing units in Lanesboro over the 12-year period, or about two new homes each year. Key demographic trends affecting housing needs over the next 12 years are shown below. The greatest demographic trend impacting housing demand will be the aging of the population. While the younger populations are not projected to see any growth, the 65+ age group is pro-jected to grow by 38%. While the senior population is growing, it likely won’t be sufficient to support a new stand-alone assisted living facility.
1990 2000 2010 2020Population 858 788 865 875Households 385 384 405 415
Number PercentAge 18 to 44 -40 -17.8%Age 45 to 64 5 1.6%Age 65+ 70 37.8%
Homeowners 298 (74.5%)Renters 102
Population & Household Growth Trends & Projections
Adult Population Growth by Age Group, 2010 to 2020
Household Mix in 2008
Lanesboro’s housing stock consists primarily of single-family homes, about 70% of which were built prior to 1950. New development in Lanesboro is constrained by the surrounding bluffs and the Root River. The available lots are in the Southern Hills and Southern Woods subdivision, lo-cated above the bluffs to the southwest. Most of the rental stock is located in single-family homes. We did not survey any market rate apartments and there are no market rate senior buildings. Two subsidized senior buildings – Kenilworth and Sylvan Manor Apartments – provide rental housing to low- and moderate-income seniors.

FILLMORE COUNTY CONCULSIONS
MAXFIELD RESEARCH INC. 79
Lanesboro Recommendations Housing demand in Lanesboro will be primarily for single-family homes and for-sale town-homes/twinhomes. The 26 existing lots in Southern Hills and Southern Woods subdivisions should satisfy most of the demand for single-family lots through 2020. Additional lots may be needed in about 2015 to provide adequate consumer choice. Most of the demand for the for-sale multifamily units will come from local empty-nesters and active seniors seeking to downsize from their existing homes. Lanesboro does not have a sufficient number of seniors to support the development of a service-intensive senior housing facility (such as assisted living). Local seniors in need of housing with support services will need to relocate to housing in Chatfield, Preston, or other communities. However, there is potential for a four-plex of one-level rental townhomes with attached garages marketed toward seniors. We would recommend these rental units have two-bedroom units and monthly rents of about $700. While rental demand generated locally will be minimal, there is potential demand to support another four-plex with monthly rents of about $500 marketed to-ward younger households.
Lanesboro Projected Housing Demand, 2008 to 2020
Affordable Market Rate11 6 4 0 2 2
Single-Family Multifamily Adult Rental Service-Intensive
Rental17 4 4
Housing Demand25
Ownership Senior
Note: Because households are mobile and are willing to seek out various housing products in adjacent com-munities, these demand figures may experience fluctuations. Detailed demand calculations can be found in Tables 24 and 25 of this report.
While Lanesboro’s overall housing stock is in good condition, it is older. To maintain the qual-ity of the existing housing stock, we recommend that Lanesboro pursue loan rehabilitation pro-grams over the next 12 years for rental units and moderate-income homeowners.

FILLMORE COUNTY CONCULSIONS
MAXFIELD RESEARCH INC. 80
Mabel - Summary of Demographic and Housing Findings Mabel is a community of about 850 people located in the far southeastern portion of the County. It has experienced steady growth, adding 21 households during the 1990s and an estimated 40 households so far this decade. About half of the household growth this decade has come from the addition of Green Lea Manor, a 22-unit assisted living facility. Between projected household growth and replacement need, we project demand for 30 new housing units in Mabel over the 12-year period, or about two to three new homes each year. Demand in the short-term may be slightly less with the announcement that Northern Engraving in nearby Spring Grove will be closing in February 2009. Key demographic trends affecting housing needs over the next 12 years are shown below. The greatest demographic trend impacting housing demand will be the aging of the population. While the younger populations are projected to decline slightly, the 65+ age group is projected to grow by 10%. This growth will strengthen demand for Mabel’s existing senior housing prod-ucts, and will create demand for more alternatives to single-family homes, such as townhomes.
1990 2000 2010 2020Population 745 766 835 870Households 316 337 380 400
Number PercentAge 18 to 44 -5 -2.4%Age 45 to 64 -5 -2.3%Age 65+ 25 10.0%
Homeowners 294 (78%)Renters 83
Population & Household Growth Trends & Projections
Adult Population Growth by Age Group, 2010 to 2020
Household Mix in 2008
Mabel’s housing stock is mostly single-family homes, of which most are in good condition. Like the other communities in the County, the housing stock is aging (about half of Mabel’s homes were built before 1950). Thus, maintaining the quality of the existing housing stock should be a housing priority. Only about four lots are available in Mabel to accommodate future single-family homes and townhomes, all of which are in the Gjere 1st Addition. About 40 acres is available for future phases. An assisted living facility was added in 2005 adjacent to Green Lea Manor (skilled care facility). This facility provides senior housing with support services to area seniors. There are no inde-pendent senior buildings, however. The general-occupancy rental stock consists mostly of sin-gle-family homes. Cherrywood Estates provides 16 subsidized rental units, and the 12-unit Vil-lage Apartments was added in two buildings in 2001 and 2008, respectively.

FILLMORE COUNTY CONCULSIONS
MAXFIELD RESEARCH INC. 81
Mabel Recommendations We project that almost all of the housing demand through 2020 in Mabel will be for single-family homes and townhomes/twinhomes. The remaining demand will be for about four rental units. Since the primary target market for rental housing is retired seniors, these four units could be age-restricted. We would recommend units similar to Village Apartments, which features one-level units with garages. While there is some increased demand for senior housing with services, Green Lea Manor is meeting most of that need and additional demand will not be sufficient to support another build-ing. At most, a small addition to the existing facility could be added to provide a few more units in the future, assuming there is land available.
Mabel Projected Housing Demand, 2008 to 2020
Housing Demand30
26Senior Rental
4 0Ownership
14 12 4Single-Family Multifamily Adult Rental Affordable Market Rate
0 0 0Service-Intensive
Note: Because households are mobile and are willing to seek out various housing products in adjacent com-munities, these demand figures may experience fluctuations. Detailed demand calculations can be found in Tables 24 and 25 of this report.
Most of the demand for owned homes is also from older adults and active seniors, many of whom would prefer to reduce their maintenance burden. Thus, we project that nearly half of the ownership demand will be for townhomes and twinhomes. Additional lots will need to be cre-ated to meet this demand as there are only about five available lots remaining in the community. While Mabel’s overall housing stock is in good condition, it is older. To maintain the quality of the existing housing stock, we recommend that Mabel pursue loan rehabilitation programs over the next 12 years for rental units and moderate-income homeowners.

FILLMORE COUNTY CONCULSIONS
MAXFIELD RESEARCH INC. 82
Ostrander - Summary of Demographic and Housing Findings Ostrander is one of Fillmore County’s smaller communities, with a current population of about 230 people. The household base has remained at about 100 since 1990, although the population has declined slightly due to the aging population. Between 2008 and 2020, Ostrander is pro-jected to lose five households, meaning that there will be no housing demand generated from household growth. There will be some housing demand from replacement need of older, obso-lete housing. We project total demand for four new housing units in Ostrander by 2020. Key demographic trends affecting housing needs over the next 12 years are shown below. Be-sides the lack of growth, the greatest demographic trend impacting housing demand will be the aging of the population. While the younger populations are projected to decline, the 65+ age group is projected to grow by 17%.
1990 2000 2010 2020Population 276 212 230 220Households 99 100 100 95
Number PercentAge 18 to 44 -10 -14.3%Age 45 to 64 -5 -8.3%Age 65+ 10 16.7%
Homeowners 79 (79%)Renters 21
Population & Household Growth Trends & Projections
Adult Population Growth by Age Group, 2010 to 2020
Household Mix in 2008
Being a small town, the vast majority of Ostrander’s housing stock is single-family homes. Due to the age of housing and the limited need for new housing, maintaining the quality of the existing housing stock will be one of Canton’s greatest housing needs over the next decade. A six-unit assisted living was added to the Ostrander Care and Rehab facility in 2001 and is full with a waiting list. Given the growing senior population, there may be potential to add a few more assisted living units onto the existing facility, but not enough to support a new stand-alone assisted living facility.

FILLMORE COUNTY CONCULSIONS
MAXFIELD RESEARCH INC. 83
Ostrander Recommendations Rental demand in Ostrander is limited because of the limited job base and the fact that existing homes are affordable to younger households with modest incomes, who are the typical market for rental housing. We find that demand for new housing will come primarily from retiring sen-iors in the area, including farmers from the rural areas. New homes that would appeal to these seniors are ranch-style, single-family homes, and potentially one-level twinhomes. We also be-lieve that a rental duplex would appeal to some seniors who wish to reduce maintenance and homeownership responsibilities. These rental units should be on one-level and feature attached garages and monthly rents of about $700.
Ostrander Projected Housing Demand, 2008 to 2020
Affordable Market Rate2 0 2 0 0 0
Single-Family Multifamily Adult Rental Service-Intensive
Rental2 2 0
Housing Demand4
Ownership Senior
Note: Because households are mobile and are willing to seek out various housing products in adjacent com-munities, these demand figures may experience fluctuations. Detailed demand calculations can be found in Tables 24 and 25 of this report.
Because of the older age of the housing stock, we recommend that the City of Ostrander seek a grant from the Small Cities Development Program (managed by the Department of Employment and Economic Development) for the purpose of assisting low- and moderate-income households with rehabilitating their homes within the next 12 years.

FILLMORE COUNTY CONCULSIONS
MAXFIELD RESEARCH INC. 84
Peterson - Summary of Demographic and Housing Findings Peterson is a community of 250 people located along the Root River between Lanesboro and Rushford. The population and the household base have remained fairly steady since 1990. The household base is projected to remain steady over the next 12 years as well. Almost all of the housing demand will be generated by replacement need of older, obsolete housing. We project total demand for four new housing units in Peterson by 2020. Key demographic trends affecting housing needs over the next 12 years are shown below. Be-sides the lack of growth, the greatest demographic trend impacting housing demand will be the aging of the population. While the younger populations are projected to decline, the 65+ age group is projected to grow by 20%.
1990 2000 2010 2020Population 259 269 250 240Households 101 98 95 95
Number PercentAge 18 to 44 -10 -15.4%Age 45 to 64 -10 -14.3%Age 65+ 15 20.0%
Homeowners 76 (80%)Renters 19
Household Mix in 2008
Population & Household Growth Trends & Projections
Adult Population Growth by Age Group, 2010 to 2020
Being a small town, the vast majority of Peterson’s housing stock is single-family homes. Due to the age of housing and the limited need for new housing, maintaining the quality of the existing housing stock will be one of Peterson’s greatest housing needs over the next decade.

FILLMORE COUNTY CONCULSIONS
MAXFIELD RESEARCH INC. 85
Peterson Recommendations Rental demand in Peterson is limited because of the limited job base and the fact that existing homes are affordable to younger households with modest incomes, who are the typical market for rental housing. We find that most of the demand for new housing will come from retiring seniors in the area, including farmers from the rural areas. New homes that would appeal to these seniors are ranch-style, single-family homes, and potentially one-level twinhomes. Some demand will also be generated by younger people working in the area who are attracted to the small-town charm of Peterson and/or the affordable housing costs.
Peterson Projected Housing Demand, 2008 to 2020
0Rental
0Market Rate
0Affordable
4Single-Family
Housing Demand4
0Adult Rental
0Multifamily
Ownership4
Senior0
Service-Intensive0
Note: Because households are mobile and are willing to seek out various housing products in adjacent com-
munities, these demand figures may experience fluctuations. Detailed demand calculations can be found in Tables 24 and 25 of this report.
We understand that the City of Peterson will be applying for a grant from the Small Cities De-velopment Program (managed by the Department of Employment and Economic Development) for the purpose of assisting low- and moderate-income households with rehabilitating their homes. Since maintaining the quality of the existing housing stock is a priority, we find that funds for home rehabilitation would be very beneficial to the community and recommend purs-ing funds again in the future if the 2009 grant is not awarded.

FILLMORE COUNTY CONCULSIONS
MAXFIELD RESEARCH INC. 86
Preston - Summary of Demographic and Housing Findings Preston is centrally located in Fillmore County and is the County Seat. With just over 1,400 people, Preston is the County’s fourth largest community. There was no household growth dur-ing the 1990s in Preston but demand increased earlier this decade and thus, about 45 households have been added this decade so far. Between 2008 and 2020, Preston is projected to grow by an-other 35 households. Combined with an estimated replacement need of 20 housing units over the 12-year period plus some additional demand generated by a senior building drawing residents from the surrounding rural areas, we project demand for almost 80 new housing units by 2020. Key demographic trends affecting housing needs in Preston over the next 12 years are shown be-low. The greatest demographic trend impacting housing demand will be the aging of the popula-tion. While the younger population is projected to see a slight decline, the 65+ age group is pro-jected to grow by 11%. While most of these seniors will remain in their single-family homes, many will also seek other types of housing, such as townhomes, apartments, and senior housing.
1990 2000 2010 2020Population 1,530 1,426 1,440 1,480Households 584 583 635 665
Number PercentAge 18 to 44 -30 -8.2%Age 45 to 64 35 8.3%Age 65+ 45 11.4%
Homeowners 481 (76.3%)Renters 149
Population & Household Growth Trends & Projections
Adult Population Growth by Age Group, 2010 to 2020
Household Mix in 2008
Preston has a housing stock that overall is in good condition – with most of the housing being single-family homes. So far this decade, about 20 single-family homes have been added, as have 20 senior housing units and seven rental units. Park Lane Estates (20-unit assisted living) opened in 2001 and has satisfied some of the senior housing demand. However, the local nursing home closed. Taking its place is a redevelopment that will convert it into a 20-unit facility with 15 memory care units and five assisted living units.
The lot supply in Preston is low, with only about 11 lots remaining in the Golf View Estates subdivi-sion. A new subdivision would require a lift station, which is a barrier that needs to be addressed in order to create more lots.

FILLMORE COUNTY CONCULSIONS
MAXFIELD RESEARCH INC. 87
Preston Recommendations There is demand in Preston for a variety of housing types. The majority of demand is for senior housing, as the closing of the local nursing home has somewhat created a void in the City’s con-tinuum of care. The renovated facility, with 20 service-intensive units, will satisfy most of this demand until close to 2020 when senior growth will warrant the addition of more units. Most of ownership demand will be for single-family homes, as local employment, plus that in nearby towns, will attract younger households. There will be growing demand for more maintenance-free housing from empty-nesters and retired seniors. A combination of about eight for-sale twinhomes and eight rental townhomes should accommodate most of this demand. All of these units should be one-level with attached garages.
Preston Projected Housing Demand, 2008 to 2020
Housing Demand78
28Senior Rental
42 8Ownership
20 8 8Single-Family Multifamily Adult Rental Affordable Market Rate
34 4 4Service-Intensive
Note: Because households are mobile and are willing to seek out various housing products in adjacent com-munities, these demand figures may experience fluctuations. Detailed demand calculations can be found in Tables 24 and 25 of this report.
With a dwindling number of available lots, one of Preston’s major housing needs will to increase the supply of single-family and townhome lots. Also, we recommend that the City of Preston seek a grant from the Small Cities Development Program for the purpose of assisting low- and moderate-income households with rehabilitating their homes within the next 12 years. The most recent apartment added in Preston is the four-unit Bisek Apartments, which is the con-version of an older office building. All of the units are occupied, and we project demand for an additional eight general-occupancy rental units. This represents only about 10% of the overall housing need in Preston between 2008 and 2020. This relatively low percentage is largely be-cause the 18-to-24-age group is projected to see little or no growth over the next 12 years. Most of the rental need will be to provide newer, contemporary units to maintain the overall quality and appeal of Preston’s rental stock. The target market will be retiree’s as well as younger peo-ple moving to the community. Monthly rents for new rental units should be below the payment standard for the Housing Choice Voucher program, or $471 for one-bedroom units, $622 for two-bedroom units and $832 for three-bedroom units.

FILLMORE COUNTY CONCULSIONS
MAXFIELD RESEARCH INC. 88
Rushford - Summary of Demographic and Housing Findings Rushford is one of Fillmore County’s larger communities with about 1,800 people. It is located in the Root River Valley in the far northeast corner of the County. Both population and house-holds have been growing since 1990. However, the flooding of August 2007 destroyed many homes and damaged others. Thus, the population has taken a temporary dip. Between 2008 and 2020, Rushford is projected to grow by 45 households. Combined with an estimated replace-ment need of 85 housing units plus some additional demand generated by a senior building draw-ing residents from the surrounding rural areas, we project demand for 140 new housing units by 2020. Key demographic trends affecting housing needs over the next 12 years are shown below. Like many other communities in the County and across the State, Rushford’s population is aging. While the younger population is projected to see a slight decline, the 65+ age group is projected to grow by 30%. While most of these seniors will remain in their single-family homes, many will also seek other types of housing, such as townhomes, apartments, and senior housing.
1990 2000 2010 2020Population 1,485 1,696 1,770 1,840Households 628 704 785 820
Number PercentAge 18 to 44 -20 -3.9%Age 45 to 64 -25 -5.0%Age 65+ 125 30.1%
Homeowners 621 (80.1%)Renters 154
Population & Household Growth Trends & Projections
Adult Population Growth by Age Group, 2010 to 2020
Household Mix in 2008
Notwithstanding the damaged caused by the flooding in 2007, Rushford’s housing stock is in good condition. Permits were pulled to replace, repair, or remodel about 230 homes shortly after the flood. However, additional homes will need to be built to replace other destroyed homes, which include 36 mobile homes in the Bluffview mobile home park, the 16-unit Rushford Manor Apartments, 4-unit Winona Street Apartments, and 12-unit Rush Creek Senior Apartments. Among Rushford’s multifamily stock are the 24-unit Pine Meadows townhome development, built in 2003 and the 15-unit Bremmer Assisted Living. Given the growing senior population, additional senior housing will likely be needed to accommodate demand.
The lot supply in Rushford is low, and new subdivisions will be needed in order for Rushford to meet its projected housing needs.

FILLMORE COUNTY CONCULSIONS
MAXFIELD RESEARCH INC. 89
Rushford Recommendations There is demand in Rushford for a variety of housing types. The most demand is for senior housing, at almost 60 units, followed by rental demand (50 units), and ownership demand (34 units). It should be noted that the development of a new service-intensive senior building (con-gregate, assisted living, and memory care) will indirectly satisfy some of the new ownership de-mand as existing single-family homes become available for younger singles and families as sen-iors transition into senior housing. In addition to service-intensive senior housing, we also rec-ommend developing about 20 independent rental units for active seniors who wish to rid them-selves of the maintenance responsibilities of their single-family homes and would also prefer to rent versus own. Most of the ownership demand will be for single-family homes, as local employment growth will attract younger households to the area. There will be growing demand for more maintenance-free housing from empty-nesters and retired seniors. A combination of for-sale twinhomes along with the recommended adult rental townhomes should meet most of this demand.
Rushford Projected Housing Demand, 2008 to 2020
Housing Demand140
34Senior Rental
58 48Ownership
24 10 20Single-Family Multifamily Adult Rental Affordable Market Rate
38 28 20Service-Intensive
Note: Because households are mobile and are willing to seek out various housing products in adjacent com-munities, these demand figures may experience fluctuations. Detailed demand calculations can be found in Tables 24 and 25 of this report.
A study examining the short-term and long-term housing needs in Rushford in the wake of the August 2007 floods was prepared in March 2008 for the City. The study was funded by the Greater Minnesota Housing Fund. This study can be reviewed to provide more detailed housing recommendations for the City of Rushford.

FILLMORE COUNTY CONCULSIONS
MAXFIELD RESEARCH INC. 90
Rushford Village - Summary of Demographic and Housing Findings Rushford Village encompasses the very northeastern six-mile square area excluding Rushford and Peterson, which it surrounds. Rushford Village is rural in nature, with the greatest housing concentration being located south of the Root River from Rushford. Population and household growth has been steady since 1990, and currently Rushford Village has a population of 785 peo-ple. Combined with an estimated replacement need of seven housing units over the 12-year pe-riod, we project total demand for 34 new housing units by 2020, or nearly three new homes an-nually. Key demographic trends affecting housing needs over the next 12 years are shown below. The greatest demographic trend impacting housing demand will be the aging of the population. While growth of the younger populations is limited, the 65+ age group is projected to grow by 40%. This will increase the number of residents desiring alternatives to their single-family homes.
1990 2000 2010 2020Population 705 714 790 820Households 219 264 305 330
Number PercentAge 18 to 44 -25 -11.1%Age 45 to 64 20 7.1%Age 65+ 45 40.9%
Homeowners 282 (94%)Renters 18
Population & Household Growth Trends & Projections
Adult Population Growth by Age Group, 2010 to 2020
Household Mix in 2008
There are no multifamily buildings in Rushford Village, only single-family homes. Almost 95% of the residents own single-family homes and the few renters are also living in single-family homes.

FILLMORE COUNTY CONCULSIONS
MAXFIELD RESEARCH INC. 91
Rushford Village Recommendations We calculate demand for 34 new housing units in Rushford Village. All of the demand will be for single-family homes, with the exception that a few units could be developed as for-sale twin-homes. Because of the aging population, many current residents may seek more maintenance-free housing. Most of these people, however, especially those needing support services, will move into Rushford or other communities to be in multifamily housing closer to services.
Rushford Village Projected Housing Demand, 2008 to 2020
Housing Demand34
34Senior Rental
0 0Ownership
30 4 0Single-Family Multifamily Adult Rental Affordable Market Rate
0 0 0Service-Intensive
Note: Because households are mobile and are willing to seek out various housing products in adjacent com-munities, these demand figures may experience fluctuations. Detailed demand calculations can be found in Tables 24 and 25 of this report.

FILLMORE COUNTY CONCULSIONS
MAXFIELD RESEARCH INC. 92
Spring Valley - Summary of Demographic and Housing Findings Spring Valley is located on Highway 63 in the western portion of Fillmore County, about 25 miles from Rochester. Its relatively close proximity has spurred some of the strong growth that occurred earlier this decade. As of 2008, Spring Valley had a population just shy of 2,700, mak-ing it almost tied with Chatfield as the County’s largest community. Between 2008 and 2020, Spring Valley is projected to grow by 60 households. Combined with an estimated replacement need of 30 housing units over the 12-year period plus some additional demand generated by a senior building drawing residents from the surrounding rural areas, we project total demand for 100 new housing units by 2020 – or about eight new homes annually. Key demographic trends affecting housing needs in Spring Valley over the next 12 years are shown below. The greatest demographic trend impacting housing demand will be the aging of the population. While the younger population is projected to see a slight decline, the 65+ age group is projected to grow by 19%. While most of these seniors will remain in their single-family homes, many will also seek other types of housing, such as townhomes, apartments, and senior housing.
1990 2000 2010 2020Population 2,461 2,518 2,675 2,780Households 1,001 1,026 1,105 1,160
Number PercentAge 18 to 44 5 0.6%Age 45 to 64 -20 -2.9%Age 65+ 90 19.4%
Homeowners 838 (76.2%)Renters 262
Population & Household Growth Trends & Projections
Adult Population Growth by Age Group, 2010 to 2020
Household Mix in 2008
Spring Valley has a housing stock that overall is in good condition – with most of the housing being single-family homes. However, Spring Valley has over 500 homes built prior to 1950, or close to double any other community in the County. So far this decade, all of the housing added has been single-family homes and townhomes, with the exception of Evergreen Assisted Living and Commercial House Apartments (renovation of an 1874 building).
Currently, Spring Valley has an adequate supply of lots – with over 40 in the North Park Estates and Bucknell subdivisions combined. In comparison, only eight homes have been built in the community during the past five years.

FILLMORE COUNTY CONCULSIONS
MAXFIELD RESEARCH INC. 93
Spring Valley Recommendations Housing demand in Spring Valley is more balanced between ownership, rental, and senior than in most other communities in the County. This is because Spring Valley has the largest em-ployment base and also has goods and services (including health care) that are attractive to area seniors as they get older. Between 2008 and 2020, we project demand for about 45 owned homes, 40 senior housing units, and 20 rental units.
Spring Valley Projected Housing Demand, 2008 to 2020
Affordable Market Rate30 14 10 28 8 10
Single-Family Multifamily Adult Rental Service-Intensive
Rental44 38 18
Housing Demand100
Ownership Senior
Note: Because households are mobile and are willing to seek out various housing products in adjacent com-munities, these demand figures may experience fluctuations. Detailed demand calculations can be found in Tables 24 and 25 of this report.
The demand for 100 owned homes includes about 30 single-family homes for younger families and about 14 twinhomes/townhomes for empty-nesters and other active seniors. The Evergreen Assisted Living was added in 2007, and we project that it will meet the local service-intensive demand until closer to 2020. It should be noted that the development of The Evergreen will indi-rectly satisfy some of the new ownership demand as existing single-family homes become avail-able for younger singles and families as seniors transition into senior housing. The City should consider seeking grant funds for a home rehab program for low- and moderate-income home-owner Most of the demand for 20 general-occupancy rental units will be to provide newer, contempo-rary units to maintain the overall quality and appeal of the rental stock. The target market will be retiree’s as well as younger people moving to the community. Monthly rents for most of the units should be below the payment standard for the Housing Choice Voucher program, or $471 for one-bedroom units, $622 for two-bedroom units and $832 for three-bedroom units. Any market rate units with rents above the payment standard should be one-level units with attached garages, which would appeal to seniors who could afford the higher rents. There would be over-lap with these one-level units and the 10 units of adult rental demand, which also appeals to ac-tive seniors who wish to rid themselves of the maintenance responsibilities of their single-family homes and would also prefer to rent versus own.

FILLMORE COUNTY CONCULSIONS
MAXFIELD RESEARCH INC. 94
Whalen - Summary of Demographic and Housing Findings Whalen is Fillmore County’s smallest community with about 40 people. It is nestled along the Root River and about half of the homes are seasonal (or “second” or “vacation” homes) while the other half are occupied by permanent residents. Whalen is land locked and there is little room for new development. Between projected household growth and replacement need, we project demand for three housing units over the 12-year period, or one new home every four years. Key demographic trends affecting housing needs over the next 12 years are shown below. In ad-dition to limited growth, almost all of the growth is likely to be for owned homes, as 90% of the current residents are owners.
1990 2000 2010 2020Population 94 64 40 50Households 42 34 20 25
Number PercentAge 18 to 44 2 16.7%Age 45 to 64 3 20.0%Age 65+ 3 37.5%
Homeowners 20 (90.1%)Renters 2
Population & Household Growth Trends & Projections
Adult Population Growth by Age Group, 2010 to 2020
Household Mix in 2008
Whalen’s housing stock consists almost entirely of single-family homes either owned by perma-nent residents or by people seeking vacation homes in the Root River Valley. Whalen annexed 95 acres above the bluffs that has added 12 large lots to its supply. To date, none of the lots have sold.

FILLMORE COUNTY CONCULSIONS
MAXFIELD RESEARCH INC. 95
Whalen Recommendations All of the housing demand in Whalen will be for single-family. The primary market for these homes will be retiring farmers from the surrounding countryside and people working in neighboring communities. Rental demand will be minimal and would most likely be accommo-dated by existing single-family homes that are rented.
Whalen Projected Housing Demand, 2008 to 2020
Housing Demand3
3Senior Rental
0 0Ownership
3 0 0Single-Family Multifamily Adult Rental Affordable Market Rate
0 0 0Service-Intensive
Note: Because households are mobile and are willing to seek out various housing products in adjacent com-munities, these demand figures may experience fluctuations. Detailed demand calculations can be found in Tables 24 and 25 of this report.
We understand that the City of Whalen will be applying for a grant from the Small Cities Devel-opment Program (managed by the Department of Employment and Economic Development) for the purpose of assisting low- and moderate-income households with rehabilitating their homes. Since maintaining the quality of the existing housing stock is a priority, we find that funds for home rehabilitation would be very beneficial to the community and recommend pursing funds again in the future if the 2009 grant is not awarded.

FILLMORE COUNTY CONCULSIONS
MAXFIELD RESEARCH INC. 96
Wykoff - Summary of Demographic and Housing Findings Wykoff is a community of about 420 people located between Spring Valley and Preston. While seven households have been added since 1990, the population has declined by 73 people. This is primarily the result of declining household sizes (fewer people per household) due to the aging population. While the community’s household base is holding steady, the limited growth means there is limited new housing need. Between projected household growth and replacement need, we project demand for eight housing units over the 12-year period, or less than one new home each year. Key demographic trends affecting housing needs over the next 12 years are shown below. While the younger population is projected to see a slight decline, the 65+ age group is projected to grow by 9%. While most of these seniors will remain in their single-family homes, some will also seek other types of housing, such as townhomes and apartments.
1990 2000 2010 2020Population 493 460 420 400Households 198 207 205 200
Number PercentAge 18 to 44 -5 -4.5%Age 45 to 64 -20 -16.7%Age 65+ 10 8.7%
Homeowners 175 (85.4%)Renters 30
Population & Household Growth Trends & Projections
Adult Population Growth by Age Group, 2010 to 2020
Household Mix in 2008
Wykoff’s housing stock consists almost entirely of single-family homes, and most of them are owned by their occupants. As of 2008, 85% of its households were homeowners. The most re-cent housing added in Wykoff is PME Senior Townhomes. This development consists of a five-unit building featuring one-level units with attached garages and monthly rents of $600 to $700 units. All of the units are occupied. There is no active subdivision in Wykoff for new single-family homes, only scattered in-fill lots.

FILLMORE COUNTY CONCULSIONS
MAXFIELD RESEARCH INC. 97
Wykoff Recommendations Rental demand in Wykoff is limited because of the limited job base and the fact that existing homes are affordable to younger households with modest incomes, who are the typical market for rental housing. We find that demand for new housing will come primarily from retiring sen-iors in the area, including farmers from the rural areas. New homes that would appeal to these seniors are ranch-style single-family homes and one-level twinhomes. Rental units, such as PME Senior Townhomes, also appeal to seniors who wish to reduce maintenance and homeown-ership responsibilities. We project that the housing need in Wykoff over the next 12 years would be met with the development of four single-family homes and four more senior rental town-homes. New lots may need to be created to accommodate the new housing.
Wykoff Projected Housing Demand, 2008 to 2020
Housing Demand8
4Senior Rental
4 0Ownership
4 0 4Single-Family Multifamily Adult Rental Affordable Market Rate
0 0 0Service-Intensive
Note: Because households are mobile and are willing to seek out various housing products in adjacent com-munities, these demand figures may experience fluctuations. Detailed demand calculations can be found in Tables 24 and 25 of this report.
While Wykoff’s overall housing stock is in good condition, it is older. To maintain the quality of the existing housing stock, we recommend that Wykoff pursue loan rehabilitation programs over the next 12 years for rental units and moderate-income homeowners.

FILLMORE COUNTY CONCULSIONS
MAXFIELD RESEARCH INC. 98
Townships - Summary of Demographic and Housing Findings There are 23 townships in Fillmore County which combine to account for the vast majority of the County’s geographic area. There are about 10,000 people living in the townships as of 2008, or about 42% of the County’s total population. Being rural, the housing stock consists almost en-tirely of single-family homes. Rural homesteads have been a popular housing choice among many people. About 210 house-holds were added in the townships during the 1990s and the pace of development quickened this decade, as about 430 new households were added through 2008. Between 2008 and 2020, 350 new households are projected to be added in the townships. Combined with an estimated re-placement need of 50 housing units over the 12-year period, we project total demand for 400 new housing units in the townships by 2020. Key demographic trends affecting housing needs over the next 12 years are shown below. Like the communities in the County, the townships have an aging population. Most of the seniors will remain in their single-family homes, and those who desire alternatives to their single-family homes will move to communities where townhomes, apartments, and senior housing are avail-able.
1990 2000 2010 2020Population 8,852 9,186 10,050 10,600Households 3,009 3,217 3,700 4,000
Number PercentAge 18 to 44 35 1.1%Age 45 to 64 -10 -0.3%Age 65+ 340 25.0%
Homeowners 3,238 (88.7%)Renters 412
Population & Household Growth Trends & Projections
Adult Population Growth by Age Group, 2010 to 2020
Household Mix in 2008
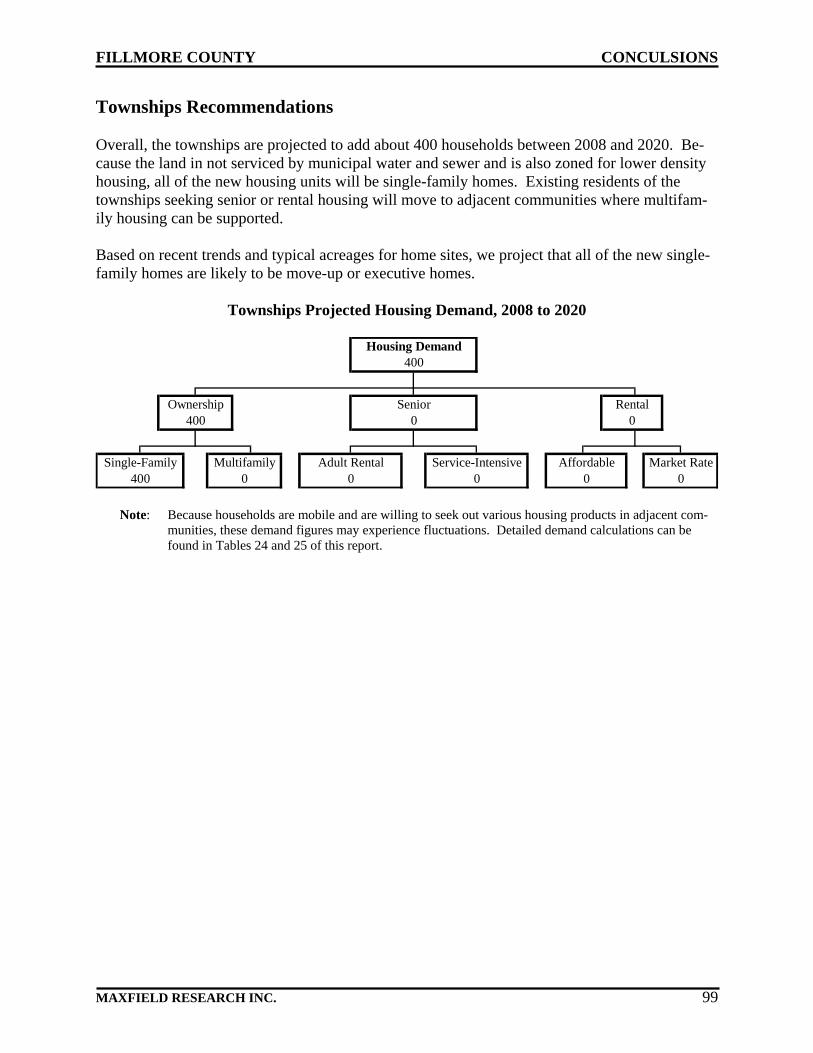
FILLMORE COUNTY CONCULSIONS
MAXFIELD RESEARCH INC. 99
Townships Recommendations Overall, the townships are projected to add about 400 households between 2008 and 2020. Be-cause the land in not serviced by municipal water and sewer and is also zoned for lower density housing, all of the new housing units will be single-family homes. Existing residents of the townships seeking senior or rental housing will move to adjacent communities where multifam-ily housing can be supported. Based on recent trends and typical acreages for home sites, we project that all of the new single-family homes are likely to be move-up or executive homes.
Townships Projected Housing Demand, 2008 to 2020
Housing Demand400
400Senior Rental
0 0Ownership
400 0 0Single-Family Multifamily Adult Rental Affordable Market Rate
0 0 0Service-Intensive
Note: Because households are mobile and are willing to seek out various housing products in adjacent com-munities, these demand figures may experience fluctuations. Detailed demand calculations can be found in Tables 24 and 25 of this report.