comprehensive housing market analysis racine, wisconsin · 2019-05-10 · racine, isconsin...
TRANSCRIPT

COMPREHENSIVE HOUSING MARKET ANALYSIS
Racine, Wisconsin
U.S. Department of Housing and Urban Development, Office of Policy Development and Research
As of January 1, 2019

!!!
!
!
!
!
WISCONSIN
ILLINOIS
Racine
Kenosha
WaukeshaMilwaukee
Walworth
LakeMcHenry
Racine
Caledonia
Waterford
Burlington
SturtevantUnion Grove
Mount Pleasant
§̈¦43
§̈¦94
! Places of Interest
Interstate Highway
Urbanized AreasRacine HMAChicago MSAMilwaukee MSA
LAKEMICHIGAN
Executive Summary 2Racine, Wisconsin Comprehensive Housing Market Analysis as of January 1, 2019
Comprehensive Housing Market Analysis Racine, Wisconsin U.S. Department of Housing and Urban Development, Office of Policy Development and Research
Executive SummaryHousing Market Area DescriptionThe Racine Housing Market Area (HMA) includes all towns, cities, villages, and unincorporated areas in Racine County, Wisconsin and is coterminous with the Racine, WI Metropolitan Statistical Area (MSA).
The current population is estimated at 197,500.
The Racine HMA is in southeastern Wisconsin and is adjacent to the Milwaukee-Waukesha-West Allis, WI MSA (Milwaukee MSA, hereafter) to the north and the Chicago-Naperville-Elgin, IL-IN-WI MSA (Chicago MSA, hereafter) to the south. Kringle, the official state pastry of Wisconsin, was first popularized in the city of Racine. The largest of the four kringle bakeries in the HMA, O&H Danish Bakery, employs approximately 100 people and bakes up to 7,000 pastries daily.
Tools and ResourcesFind interim updates for this metropolitan area, and select geographies nationally,at PD&R’s Market-at-a-Glance tool.Additional data for the HMA can be found in this report’s supplemental tables.For information on HUD-supported activity in this area, see the Community Assessment Reporting Tool.

Executive Summary 3Racine, Wisconsin Comprehensive Housing Market Analysis as of January 1, 2019
Comprehensive Housing Market Analysis Racine, Wisconsin U.S. Department of Housing and Urban Development, Office of Policy Development and Research
Market Qualifiers
Nonfarm payroll jobs have expanded during 7 of the past 8 years. Payroll growth has averaged 500 jobs, or 0.7 percent, annually since 2011, which includes a decline in 2013. The economy continues to recover from the Great Recession, with both the goods-producing and the service-providing sectors adding jobs; however, current nonfarm payroll jobs remain below both the 2007 prerecessionary peak and the historic high in 2000. During the 3-year forecast period, nonfarm payrolls are expected to increase an average of 0.7 percent annually.
The home sales market is currently balanced, improving from soft conditions in 2010. The sales vacancy rate is currently estimated at 1.3 percent, down from 2.3 percent in 2010. The average inventory of homes for sale increased to 3.1 months in December 2018, up from 2.8 months in December 2017. Total home sales fell 3 percent to 3,575 during 2018 but remain well above the historic low of 2,100 in 2010 (Metrostudy, A Hanley Wood Company, with adjustments by the analyst). During the 3-year forecast period, demand is estimated for 1,575 additional units. The 75 units under construction are expected to meet a portion of demand during the first year of the forecast period.
The rental vacancy rate was 9.3 percent in 2010 and has fallen to an estimated 7.5 percent currently. The apartment market is tight, with a vacancy rate of 3.3 percent during the fourth quarter of 2018, down from 3.5 percent a year earlier (RealPage, Inc). Average apartment rent increased 4 percent during 2018, faster than the average increase of 2 percent annually from 2012 through 2017. During the 3-year forecast period, demand is expected for an additional 640 rental units. The 80 units under construction are expected to meet a portion of demand.
Economy
Stable: with 500 jobs added during 2018.
Rental Market
Balanced: but tightening, with more than 90 percent of household growth since 2010 attributed to renter households.
Sales Market
Balanced: with the average home sales price up 9 percent from a year earlier, to $185,700, during 2018.
TABLE OF CONTENTSEconomic Conditions 4
Population and Households 9
Home Sales Market Conditions 12
Rental Market Conditions 16
Terminology Definitions and Notes 18Notes: Total demand represents estimated production necessary to achieve a balanced market at the end of the forecast period. Units under construction as of January 1, 2019. The forecast period is January 1, 2019 to January 1, 2022. Source: Estimates by the analyst
3-Year Housing Demand Forecast Sales Units Rental Units
Racine HMATotal Demand 1,575 640
Under Construction 75 80

Economic Conditions 4Racine, Wisconsin Comprehensive Housing Market Analysis as of January 1, 2019
Comprehensive Housing Market Analysis Racine, Wisconsin U.S. Department of Housing and Urban Development, Office of Policy Development and Research
Economic ConditionsLargest sector: Manufacturing
In 2017, Foxconn, an international electronics manufacturer, announced plans to build a manufacturing facility, creating up to 13,000 jobs and investing up to $10 billion in the HMA.
Primary Local Economic FactorsThe economy in the Racine HMA is similar to that of the adjacent Milwaukee and Chicago MSAs because all were founded on and grew from jobs in the manufacturing sector. Currently, manufacturing remains the largest sector in the HMA, unlike neighboring MSA economies, which have diversified through gains in the service-providing sectors. Manufacturing sector jobs accounted for 23 percent of all jobs in the HMA during 2018 (Figure 1), compared with 7 and 14 percent in the Chicago and Milwaukee MSAs, respectively.
Fabricated metals and machinery manufacturing are the most common types of manufacturing businesses in the HMA, but all types of goods are produced in the area. One-half of the approximately 330 manufacturing employers are fabricated metals or machinery manufacturers, and food, paper, plastics, rubber, computer and electronics, furniture, and transportation equipment manufacturers constitute the other one-half. The largest manufacturing employer, S.C. Johnson & Son, Inc., employs 2,600 workers in the HMA, and 7 of the 10 largest employers are in the manufacturing sector (Table 1).
Table 1. Major Employers in the Racine HMA
Name of Employer Nonfarm Payroll Sector Number of Employees
Wheaton Franciscan Healthcare Education & Health Services 2,661
S.C. Johnson & Son, Inc. Manufacturing 2,600
CNH Industrial America LLC Manufacturing 2,500
InSinkErator Manufacturing 1,000
Aurora Healthcare Hospital Education & Health Services 970
City of Racine Government 940
Cree Inc. Manufacturing 618
Nestlé Manufacturing 500
BRP US, Inc. Manufacturing 500
Andis Company Manufacturing 450
Note: Excludes local school districts.Source: Racine County Economic Development Corporation
Government 12%
Education & Health Services 15%
Trade 16%
Total78.0
Mining, Logging, & Construction 4%
Manufacturing 23%
Wholesale 5%
Retail 11%
Transportation & Utilities 3%
Information 1%Financial Activities 3%
Professional & Business Services 9%
Leisure & Hospitality 10%
Other Services 5%
Federal 1%
State 2%Local 9%
Figure 1. Current Nonfarm Payroll Jobs in the Racine HMA, by Sector
Notes: Total nonfarm payroll is in thousands. Numbers may not add to 100 percent due to rounding.Source: U.S. Bureau of Labor Statistics

Economic Conditions 5Racine, Wisconsin Comprehensive Housing Market Analysis as of January 1, 2019
Comprehensive Housing Market Analysis Racine, Wisconsin U.S. Department of Housing and Urban Development, Office of Policy Development and Research
Table 2. 12-Month Average Nonfarm Payroll Jobs in the Racine HMA, by Sector
12 Months Ending
December 2017
12 Months Ending
December 2018
Absolute Change
Percentage Change
Total Nonfarm Payroll Jobs 77.5 78.0 0.5 0.6
Goods-Producing Sectors 20.7 21.0 0.3 1.4
Mining, Logging, & Construction 2.8 3.0 0.2 7.1
Manufacturing 17.9 18.0 0.1 0.6
Service-Providing Sectors 56.8 57.0 0.2 0.4
Wholesale & Retail Trade 12.5 12.3 -0.2 -1.6
Transportation & Utilities 2.3 2.3 0.0 0.0
Information 0.5 0.5 0.0 0.0
Financial Activities 2.3 2.3 0.0 0.0
Professional & Business Services 6.6 6.7 0.1 1.5
Education & Health Services 11.5 11.6 0.1 0.9
Leisure & Hospitality 7.8 8.1 0.3 3.8
Other Services 3.8 3.9 0.1 2.6
Government 9.5 9.3 -0.2 -2.1
Notes: Based on 12-month averages through December 2017 and December 2018. Numbers may not add to totals due to rounding. Numbers are in thousands.Source: U.S. Bureau of Labor Statistics
Current Conditions—Nonfarm PayrollsJob growth in the HMA during 2018 was higher than it was during 2017. Nonfarm payrolls rose by 500 jobs, or 0.6 percent, during the most recent year (Table 2), following a gain of 200 jobs, or 0.3 percent, during the previous year. The stronger growth was partially because of a shift from decline to growth in the manufacturing sector, which added 100 jobs, or 0.6 percent, compared with a loss of 200 jobs, or 1.3 percent, during 2017. Job growth in
the manufacturing sector was supported by the opening of a new $34 million headquarters for InSinkErator, a waste-disposal manufacturer, in late 2018, adding approximately 180 engineers and professional staff. In addition, the completion of a building on the Foxconn manufacturing campus, with an unannounced number of jobs, contributed to the job growth.
During 2018, nine sectors, including the manufacturing sector, added jobs or remained stable, compared with eight sectors during 2017. The leisure and hospitality sector had the largest increase in jobs, adding 300 jobs, or 3.8 percent, from a year earlier and continuing a trend of year-over-year job growth since 2012. The opening of new restaurants in downtown Racine and along the Washington Avenue retail corridor, between downtown Racine and Interstate 94, supported job gains in the sector during the past 6 years. The mining, logging, and construction sector was the fastest growing sector, increasing 7.1 percent, or by 200 jobs. The construction of a $14 million warehouse, part of a planned expansion of Lavelle Industries, contributed to the gains. Offsetting job growth during 2018 were losses in the wholesale and retail trade and the government sectors, each declining by 200 jobs, or 1.6 and 2.1 percent, respectively. The closure of retail stores, including a Bon-Ton department store and a Toys “R” Us, contributed to losses.
During the summer of 2017, Foxconn, an international electronics manufacturer, announced that it was planning to build a manufacturing facility in the HMA and research and development centers in cities throughout the state of Wisconsin. At the time of the announcement, the company was planning for 13,000 jobs and $10 billion of capital investment statewide, with most of the jobs at the manufacturing facility. During 2018, the company reported that it had invested $200 million, employed 180 people, and supported 850 construction jobs statewide.

Economic Conditions 6Racine, Wisconsin Comprehensive Housing Market Analysis as of January 1, 2019
Comprehensive Housing Market Analysis Racine, Wisconsin U.S. Department of Housing and Urban Development, Office of Policy Development and Research
OverviewTotal nonfarm payrolls in the Racine HMA have been in recovery from the Great Recession since 2011 and remain below both the prerecessionary high and the
70
75
80
85
National Recession Nonfarm Payrolls
Non
farm
Pay
rolls
(in
Thou
sand
s)
Dec-00
Dec-01
Dec-02
Dec-03
Dec-04
Dec-05
Dec-06
Dec-07
Dec-08
Dec-09
Dec-10
Dec-11
Dec-12
Dec-13
Dec-14
Dec-15
Dec-16
Dec-17
Dec-18
Figure 3. 12-Month Average Nonfarm Payrolls in the Racine HMA
Note: 12-month moving average.Source: U.S. Bureau of Labor Statistics
Economic Periods of Significance
NationRacine HMA12.0%
10.0%
8.0%
6.0%
4.0%
2.0%
0.0%
Dec-00
Dec-01
Dec-02
Dec-03
Dec-04
Dec-05
Dec-06
Dec-07
Dec-08
Dec-09
Dec-10
Dec-11
Dec-12
Dec-13
Dec-14
Dec-15
Dec-16
Dec-17
Dec-18
Source: U.S. Bureau of Labor Statistics
Figure 2. 12-Month Average Unemployment Rate in the Racine HMA and the Nation
UnemploymentThe unemployment rate fell during 2018 after matching the previous historical low in 2000 during 2017 (Figure 2). The unemployment rate averaged 3.6 percent during 2018, down from 4.1 percent in 2017, and has fallen each year since reaching a high of 10.2 percent in 2010. For comparison, the national unemployment rate was 3.7 percent in 2018.
The decline in the unemployment rate during the past year is partially because of a reduction in the labor force and relatively stable resident employment. During 2018, the labor force declined by 500, or 0.5 percent, compared with a year ago, and resident employment was relatively unchanged at 96,000.
historical high during 2000 (Figure 3). Currently, nonfarm payrolls are 3,700 jobs below the historical high (Figure 4). Jobs in the goods-producing sectors declined during 12 of the past 18 years, resulting in 6,400 fewer jobs in those sectors compared with the number of jobs in 2000. Job growth in the service-providing sectors, specifically the leisure and hospitality and the education and health services sectors, are up from levels in 2000, offsetting some of the losses in other sectors.
Figure 4. Sector Growth in the Racine HMA, 2000 to Current
Source: U.S. Bureau of Labor Statistics
-5,000-6,000-7,000 -4,000 -3,000 -2,000 -1,000 1,000 2,000 3,0000
Change in Jobs
Total Nonfarm Payroll JobsGoods-Producing SectorsMining, Logging, & ConstructionManufacturingService-Providing SectorsWholesale & Retail TradeTransportation & UtilitiesInformationFinancial ActivitiesProfessional & Business ServicesEducation & Health ServicesLeisure & HospitalityOther ServicesGovernment

Commuting PatternsAn Amtrak station in the city of Sturtevant and six entrances onto Interstate 94 provide connections to major employment centers, including downtown Milwaukee, 25 miles to the north, and downtown Chicago, 75 miles to the south. Employment centers, such as Mitchell International Airport in south Milwaukee County, and distribution centers, including Amazon and Uline in Kenosha County, are within 20 miles, or a 30-minute drive, of the HMA. The direct transportation routes, in addition to the adjacency of two larger metropolitan areas, support commuting into and out of the HMA for employment.
Economic Conditions 7Racine, Wisconsin Comprehensive Housing Market Analysis as of January 1, 2019
Comprehensive Housing Market Analysis Racine, Wisconsin U.S. Department of Housing and Urban Development, Office of Policy Development and Research
sector averaged 200 jobs a year and supported stronger job growth during the first few years of the recovery period, but more recent declines in the sector have slowed economic recovery in the HMA.
During the first four years of recovery, job growth was relatively faster, despite a decline in 2013. Nonfarm payrolls in the HMA increased by an average of 700 jobs, or 0.9 percent, annually from 2011 through 2014. The manufacturing sector accounted for more than 85 percent of net payroll gains, adding an average of 600 jobs, or 3.6 percent, annually. Most of the manufacturing jobs added were at existing facilities, as production increased. During the early recovery period, job gains were offset by a decline in the government sector, which decreased by an average of 200 jobs, or 1.6 percent, annually from 2011 through 2014. The Wisconsin Budget Repair Bill (Wisconsin Act 10), which passed in 2011, contributed to the decline in the sector.
Recovery slowed from 2015 through 2017 to an average increase of 300 jobs, or 0.4 percent, annually. Gains in 9 of the 11 sectors were offset by notable job loss in the manufacturing sector, which declined by an average of 400 jobs, or 2.0 percent, annually from 2015 through 2017. S.C. Johnson & Son, Inc. moved 175 jobs to downtown Chicago in 2015, contributing to the decline. Expansions and retentions, including 190 additional jobs at Seda North America, nearly 150 additional jobs at Applied Material Solutions, and retention of 400 jobs at Ardagh Group because of a new contract with New Glarus Brewing, were insufficient to increase total nonfarm payrolls in the manufacturing sector.
2001 through 2007Total nonfarm payrolls peaked in 2000 at 81,700 jobs and then declined by an average of 1,200 jobs, or 1.5 percent, annually, from 2001 through 2003. Job loss in the manufacturing sector accounted for nearly all the decline. Closure in 2001 of Western Publishing, the company that published Little Golden Books, contributed to the overall decline.
A period of nonfarm payroll fluctuation occurred from 2004 through 2007, with an average increase of 500 jobs, or 0.6 percent, annually. The education and health services sector added the most jobs, and fewer jobs were lost in the manufacturing sector, compared with the 2001-through-2003 period.
2008 through 2010The economy in the HMA, which had not yet recovered from job losses earlier in the decade, was further weakened by the Great Recession. From 2008 through 2010, nonfarm payrolls fell by an average of 2,000 jobs, or 2.6 percent, annually. Payrolls in 10 of the 11 sectors declined or had no gains. The manufacturing sector, which had added jobs during only 1 of the previous 7 years, declined by an average of 800 jobs, or 4.3 percent, annually from 2008 through 2010. Most of the losses resulted from reduced production at manufacturers. The only sector with job growth was the education and health services sector, adding an average of 300 jobs, or 2.3 percent, annually.
2011 through 2017The economy in the HMA transitioned into recovery during 2011 and, aside from a decline in 2013, has added jobs every year from 2011 through 2017. Payrolls increased by an average of 500 jobs, or 0.7 percent, annually during the 2011-through-2017 period, including a decline of 500 jobs, or 0.7 percent, during 2013. The leisure and hospitality sector, one of only two sectors to grow by an average of more than 100 jobs annually, added an average of 200 jobs, or 2.6 percent, a year from 2011 through 2017. Reinvestment in downtown Racine, including a $4 million upgrade to a downtown hotel, increased use of the marinas along the Root River, and new restaurants in downtown Racine have contributed to growth in the sector. Payroll growth in the manufacturing

Employment ForecastDuring the next 3 years, payrolls are expected to increase an average of 0.7 percent, annually, from current levels. To support modernizing the skills of current manufacturing workers and to train new workers, a $6.5 million expansion at Gateway Technical College is underway and expected to be complete in mid-2019. Planned construction of healthcare facilities, including a new $250 million Advocate Aurora hospital and a $42 million Froedtert South facility, are expected to contribute to job growth in the construction and healthcare industries; the number of jobs to be added are unannounced. A portion of the announced jobs at the Foxconn facility may also support growth during the 3-year forecast period.
Among employed residents of the HMA, less than one-half work in the HMA, approximately one-third work in the Milwaukee MSA, 14 percent work in the Chicago MSA, and 10 percent work elsewhere (Figure 5a). Among jobs in the HMA, 57 percent are filled by residents of the HMA, 31 percent by residents of the Chicago or Milwaukee MSA, and 12 percent by residents of other areas (Figure 5b). Approximately 80 percent of all jobs in the HMA are east of I-94, with the largest share in the communities of Racine and Mount Pleasant. The remaining 20 percent of jobs in the HMA are west of I-94, with the largest share in the community of Burlington. The closest suburban communities in the Chicago and Milwaukee MSAs are also within 20 miles, or a 30-minute drive, of the communities of Racine and Mount Pleasant.
Economic Conditions 8Racine, Wisconsin Comprehensive Housing Market Analysis as of January 1, 2019
Comprehensive Housing Market Analysis Racine, Wisconsin U.S. Department of Housing and Urban Development, Office of Policy Development and Research
Chicago-Naperville-Elgin MSA 16%
Racine HMA 57%
Milwaukee-Waukesha-West Allis MSA 15%
Other 12%
Source: U.S. Census, OnTheMap, 2015Source: U.S. Census, OnTheMap, 2015
Chicago-Naperville-Elgin MSA 14%
Racine HMA 43%Milwaukee-Waukesha-West Allis MSA 33%
Other 10%
Figure 5a. Where Residents of the Racine HMA Work Figure 5b. Where Workers Employed in the Racine HMA Live

Population and Households 9Racine, Wisconsin Comprehensive Housing Market Analysis as of January 1, 2019
Comprehensive Housing Market Analysis Racine, Wisconsin U.S. Department of Housing and Urban Development, Office of Policy Development and Research
2,000
1,000
0
- 1,000
- 2,000
2000
-2001
2001
-2002
2002
-2003
2003
-2004
2004
-2005
2005
-2006
2006
-2007
2007
-2008
2008
-2009
2009
-2010
2010
-2011
2011-
2012
2012
-2013
2013
-2014
2014
-2015
2015
-2016
2016
-2017
2017-
Curre
nt
Curre
nt-Fo
recast
Net MigrationNet Natural Change Population Growth
Figure 6. Components of Population Change in the Racine HMA, 2000 Through the Forecast
Note: Net natural change and net migration totals are average annual totals over the time period.Sources: 2000–2017—U.S. Census Bureau. 2017–current and current–forecast—estimates by the analyst
Population and HouseholdsCurrent population: 197,500
The relative affordability of the HMA and continued job growth have contributed to an increase in population growth since 2016.
Population TrendsPopulation growth has slowed in the Racine HMA during the current decade, partially because of lower levels of net natural increase (NNI). During the 2000s, population growth averaged 660, or 0.3 percent, annually, including an average NNI of 1,050 people. Since 2010, population growth has averaged 240, or 0.1 percent, annually (Table 3), including an average NNI of 680 people a year. Rising net in-migration in recent years of the current decade has partially offset lower levels of NNI.
Population Quick Facts
2010 Current Forecast
Population 195,408 197,500 200,900
Average Annual Change 660 240 1,125
Percentage Change 0.3% 0.1% 0.6%
Household Quick Facts
2010 Current Forecast
Households 75,651 77,750 79,600
Average Annual Change 480 240 620
Percentage Change 0.7% 0.3% 0.8%
Note: Average annual changes and percentage changes are based on averages from 2000–2010, 2010 to current, and current to forecast.Sources: 2000 and 2010—2000 Census and 2010 Census; current and forecast—estimates by the analyst
Table 3. Racine HMA Population Quick Facts
Population growth during the current decade has strengthened in recent years, as payrolls move toward prerecession levels and relatively low home prices attract new residents. From 2010 to 2012, the population declined by an average of 380, or 0.2 percent, annually, including average net out-migration of 1,175 people a year, the highest level of out-migration during the past two decades (Figure 6). Historically low housing prices in the Milwaukee MSA in 2011 and in the Chicago MSA in 2012 contributed to elevated net out-migration, as residents who were previously commuting to these MSAs left the Racine HMA to be closer to their jobs. From 2012 to 2016, the population increased by an average of 90, or less than 0.1 percent, annually, as net out-migration slowed to an average of 530 people a year. Strengthening job growth in the HMA and recovering home prices in the larger nearby MSAs slowed net out-migration. Since 2016, the population is estimated to have increased by an average of 990, or 0.5 percent, annually, including net in-migration averaging 290 people a year. Relative housing affordability in the HMA, as recently noted in 2017 by the Demographia International Housing Affordability Survey, has also supported recent in-migration.

Population and Households 10Racine, Wisconsin Comprehensive Housing Market Analysis as of January 1, 2019
Comprehensive Housing Market Analysis Racine, Wisconsin U.S. Department of Housing and Urban Development, Office of Policy Development and Research
0
5%
10%
15%
20%
25%
30%
20172010
17 and Younger 18-39 40-59 60 and Older
Figure 8. Population by Age in the Racine HMA
Source: American Community Survey, 2010 and 2017, 1-year data
Population ForecastThe anticipated job growth and relative affordability of the HMA are expected to contribute to an increase in population growth, including rising net in-migration, during the forecast period. During the next 3 years, the population is expected to increase by an average of 1,125, or 0.6 percent, annually.
Migration TrendsMost residents moving into or out of the area are moving 50 miles or less. The top five counties with migration into and out of the HMA include the adjacent Milwaukee, Kenosha, Waukesha, and Walworth Counties in Wisconsin and Cook County, Illinois. Although Cook County is not adjacent to the HMA, the closest residential areas in the county are less than 50 miles, or a 1-hour drive, away. From 2015 to 2016, net in-migration occurred from Milwaukee, Kenosha, and Cook Counties, whereas net out-migration occurred to Waukesha and Walworth Counties (Figure 7).
Into the HMA
Milwaukee County, WI 2,009
Kenosha County, WI 1,595
Waukesha County, WI 444
Walworth County, WI 357
Cook County, IL 326
Out of the HMA
Milwaukee County, WI 1,503
Kenosha County, WI 1,185
Waukesha County, WI 543
Walworth County, WI 467
Cook County, IL 185
Source: Internal Revenue Service migration data
Figure 7. County-to-County Migration Flows in the Racine HMA: 2015–2016
Age Cohort TrendsThe share of seniors (age 60 and older) living in the HMA increased, whereas the share of all other age cohorts declined or remained steady, from 2010 to 2017 (Figure 8). The fastest growing cohort was residents ages 60 and older, rising from 19 percent of the population in 2010 to 22 percent in 2017. The rising share of seniors partly contributed to the decline in net natural increase during the current decade. The share of residents ages 17 and younger and ages 40 to 59 declined, whereas the share of residents ages 18 to 34 remained relatively unchanged.
Population by GeographyThe population is geographically concentrated in the eastern portion of the HMA. Approximately 70 percent of residents live east of Interstate 94, and the remaining 30 percent live west of I-94, mostly in the far western portion of the HMA, closer to Waukesha and Walworth Counties. Land immediately west of I-94 is mostly agricultural and sparsely populated.
Population and Households 11Racine, Wisconsin Comprehensive Housing Market Analysis as of January 1, 2019
Comprehensive Housing Market Analysis Racine, Wisconsin U.S. Department of Housing and Urban Development, Office of Policy Development and Research
0
RenterOwner
Current20102000
10,000
20,000
30,000
40,000
50,000
60,000
70,000
80,000Homeownership Rate
70.6%
Hou
seho
lds
Hom
eow
ners
hip
Rate
69.9%
68.2%
72.0%
71.5%
71.0%
70.5%
70.0%
69.5%
69.0%
68.5%
68.0%
Figure 9. Households by Tenure and Homeownership Rate in the Racine HMA
Sources: 2000 and 2010—2000 Census and 2010 Census; current—estimates by the analyst
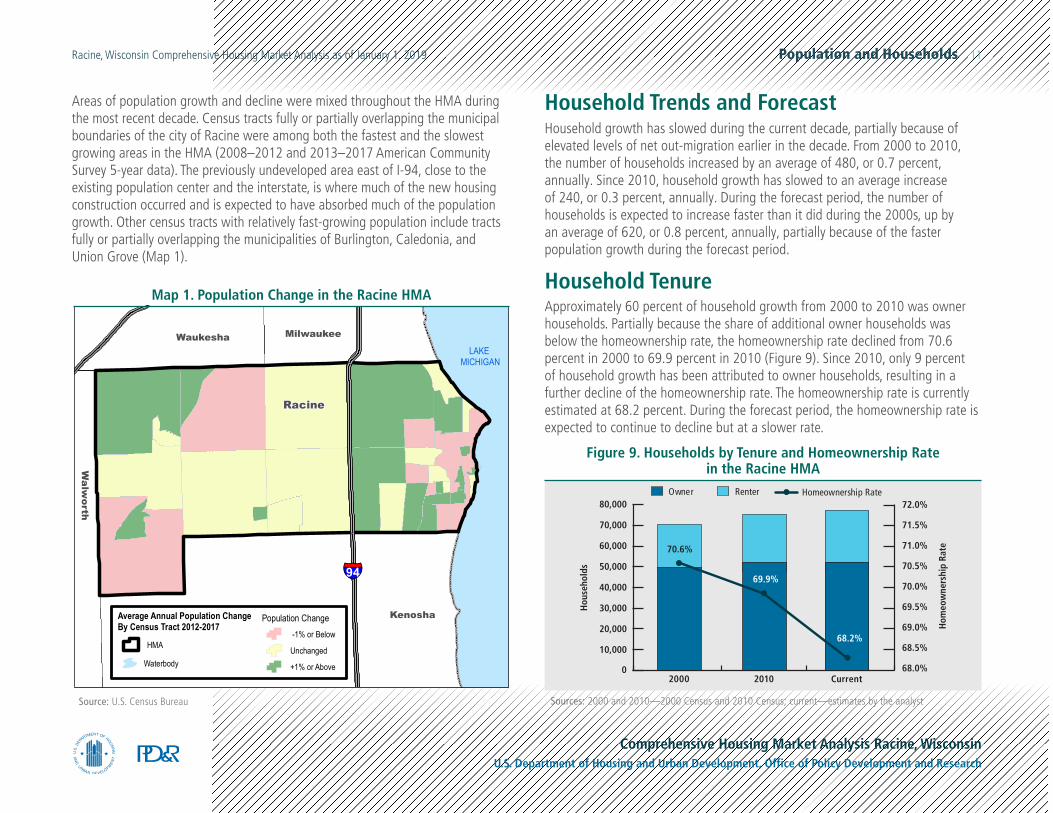
Household Trends and ForecastHousehold growth has slowed during the current decade, partially because of elevated levels of net out-migration earlier in the decade. From 2000 to 2010, the number of households increased by an average of 480, or 0.7 percent, annually. Since 2010, household growth has slowed to an average increase of 240, or 0.3 percent, annually. During the forecast period, the number of households is expected to increase faster than it did during the 2000s, up by an average of 620, or 0.8 percent, annually, partially because of the faster population growth during the forecast period.
§̈¦94
Racine
Kenosha
Waukesha Milwaukee
Walw
orth
LAKE MICHIGAN
Average Annual Population Change By Census Tract 2012-2017
Waterbody
HMA
Population Change -1% or Below
Unchanged
+1% or Above
Source: U.S. Census Bureau
Map 1. Population Change in the Racine HMA
Areas of population growth and decline were mixed throughout the HMA during the most recent decade. Census tracts fully or partially overlapping the municipal boundaries of the city of Racine were among both the fastest and the slowest growing areas in the HMA (2008–2012 and 2013–2017 American Community Survey 5-year data). The previously undeveloped area east of I-94, close to the existing population center and the interstate, is where much of the new housing construction occurred and is expected to have absorbed much of the population growth. Other census tracts with relatively fast-growing population include tracts fully or partially overlapping the municipalities of Burlington, Caledonia, and Union Grove (Map 1).
Household TenureApproximately 60 percent of household growth from 2000 to 2010 was owner households. Partially because the share of additional owner households was below the homeownership rate, the homeownership rate declined from 70.6 percent in 2000 to 69.9 percent in 2010 (Figure 9). Since 2010, only 9 percent of household growth has been attributed to owner households, resulting in a further decline of the homeownership rate. The homeownership rate is currently estimated at 68.2 percent. During the forecast period, the homeownership rate is expected to continue to decline but at a slower rate.

Home Sales Market Conditions 12Racine, Wisconsin Comprehensive Housing Market Analysis as of January 1, 2019
Comprehensive Housing Market Analysis Racine, Wisconsin U.S. Department of Housing and Urban Development, Office of Policy Development and Research
Home Sales Quick Facts
Racine HMA NationVacancy Rate 1.3% NA
Months of Inventory 3.1 3.7
Total Home Sales 3,575 6,007,000
1-Year Change -3.0% 0.2%
Average Price-Existing $183,200 $309,200
1-Year Change 9.2% 4.0%
Average Price-New $283,200 $409,900
1-Year Change 10.3% 0.7%
Mortgage Delinquency Rate 1.5% 1.7%
NA = data not available. Notes: Vacancy rate is as of the current date; home sales and prices are for the 12 months ending December 2018; and months of inventory and mortgage delinquency data are as of December 2018.Sources: Metrostudy, A Hanley Wood Company, with adjustments by the analyst; Wisconsin Realtors® Association; National Association of Realtors®; CoreLogic, Inc.
Table 4. Home Sales Quick Facts in the Racine HMA
Home Sales Market ConditionsMarket Conditions: Balanced
Average home sales prices in the HMA exceeded the 2008 peak for the first time during 2018.
year-over-year gain in more than a decade, supported by expectations of future job growth at the Foxconn manufacturing facility. Total home sales were 3,575, down 3 percent (Table 4) from the 3,675 homes sold during 2017 but well above the low of 2,100 homes sold in 2010. The home sales vacancy rate is currently estimated at 1.3 percent, down from 2.3 percent during 2010.
Despite the recent price gains, home sales prices in the HMA are relatively low compared with those of adjacent counties. During the fourth quarter of 2018, the median home sales price in the HMA was $170,000 (Wisconsin Realtors® Association). Median home sales prices in Kenosha, Walworth, and Waukesha Counties were $5,000, $44,750, and $110,000 higher, respectively, than those in the Racine HMA. The only adjacent county with a lower median home sales price was Milwaukee County, at $157,000.
Existing Home SalesExisting home sales fell during the past year. During 2018, existing home sales totaled 3,500, down 3 percent from the 3,600 homes sold during 2017. Real estate owned (REO) sales constituted 5 percent of total sales during 2018, down from 9 percent in 2017 and a high of 38 percent in 2011 (Figure 10). A decline
Current ConditionsThe home sales market in the Racine HMA is currently balanced, improving from soft conditions in 2010. Limited new home construction compared with that of the previous decade, and recent increases in job and population growth have contributed to improved conditions. The average home sales price, including new and existing homes, has been rising since 2014 and exceeded the prerecessionary high for the first time during 2018. The number of homes sold fell slightly during 2018 but had been trending upward from 2015 through 2017 despite a significant decline in distressed sales. The average home sales price during 2018 was $185,700, up 9 percent from $170,200 a year earlier and 2 percent higher than the previous peak of $182,100 in 2008 (Metrostudy, A Hanley Wood Company, with adjustments by the analyst). The increase in price was the fastest
5,000
4,000
3,000
2,000
1,000
0
REO Sale New SaleRegular Resale
Dec-05
Dec-06
Dec-07
Dec-08
Dec-09
Dec-10
Dec-11
Dec-12
Dec-13
Dec-14
Dec-15
Dec-16
Dec-17
Dec-18
Figure 10. 12-Month Sales Totals by Type in the Racine HMA
Source: Metrostudy, a Hanley Wood Company, with adjustments by the analyst

Home Sales Market Conditions 13Racine, Wisconsin Comprehensive Housing Market Analysis as of January 1, 2019
Comprehensive Housing Market Analysis Racine, Wisconsin U.S. Department of Housing and Urban Development, Office of Policy Development and Research
$300,000
$250,000
$200,000
$150,000
$100,000
$50,000
REO SaleRegular Resale New Sale Existing
Dec-05
Dec-06
Dec-07
Dec-08
Dec-09
Dec-10
Dec-11
Dec-12
Dec-13
Dec-14
Dec-15
Dec-16
Dec-17
Dec-18
Figure 11. 12-Month Average Sales Price by Type of Sale in the Racine HMA
Source: Metrostudy, a Hanley Wood Company, with adjustments by the analyst
1,600
1,400
1,200
1,000
800
600
400
200
0
New SalesExisting Sales
$0 to $100k $101 to $200k $201 to $300k $301 to $400k $401 to $500k $501k and More
Figure 12. Sales by Price Range During 2018 in the Racine HMA
Source: Metrostudy, A Hanley Wood Company
in REO sales and a relatively unchanged number of regular resales contributed to the recent decline in existing sales.
Existing home sales increased by an average of 230, or 9 percent, annually from 2011 through 2017. The overall gain includes a 3-percent decline that occurred during 2014. The historical low of 1,975 homes sold occurred in 2010 after 5 years of year-over-year declines, with an average decline of 430 homes, or 14 percent, annually from 2006 through 2010.
Existing Home Sales PricesSupported by speculation based on recent job announcements and an ongoing decline in REO sales, the average existing home sales price exceeded the prerecessionary peak for the first time during 2018. The average existing home sales price rose 9 percent, to $183,300 in 2018, continuing the fifth year of year-over-year price growth (Figure 11). From 2014 through 2017, the average home sales price increased an average of 4 percent, or $6,350, a year. A decline in the number of REO sales, which had an average price approximately 50 percent below the average regular resale sales price, contributed to the increase in the average existing sales price.
The previous peak in existing home sales prices occurred in 2008, with an average price of $177,500. The average existing home sales prices declined from 2009 through 2011 by an average of $11,650, or 7 percent, annually to the low of $142,500 in 2011. REO sales accounted for 36 percent of all existing sales from 2011 through 2013, with existing home sales prices averaging $143,000.
Approximately two-thirds of all existing homes sold during 2018 were priced at or below $200,000, and only 2 percent of existing home sales were priced at or above $500,000 (Figure 12). Existing homes accounted for 98 percent of all homes sold in the HMA during 2018.
New Home SalesNew home sales accounted for 2 percent of total home sales during 2018, down from 13 percent in 2005. During 2018, there were 85 new homes sold, down 10 percent from the 95 new homes sold during 2017. From 2011 through 2017, new home sales constituted 2 percent of total home sales, averaging 70 new homes sold annually. New home sales peaked in 2005 at 740 and then fell by an average of 95, or 30 percent, annually, to 75 in 2011.

Home Sales Market Conditions 14Racine, Wisconsin Comprehensive Housing Market Analysis as of January 1, 2019
Comprehensive Housing Market Analysis Racine, Wisconsin U.S. Department of Housing and Urban Development, Office of Policy Development and Research
New Home Sales PricesAverage new home sales prices were the first category of home sales to exceed the prerecessionary peak, partially because of rising new home construction costs. During 2018, new home sales prices averaged $283,200, up 10 percent from 2017 and $62,900, or 29 percent, above the previous peak in 2008. New home sales prices peaked at an average of $220,300 in 2008 and then declined by an average of $7,975, or 4 percent, annually to a low of $188,400 in 2012. From 2013 through 2017, new home sales prices increased by an average of 6 percent, or $13,700, annually, exceeding the 2008 high in 2015.
Approximately 80 percent of new home sales during 2018 were priced between $200,000 and $400,000, with approximately 10 percent priced below $200,000 and 10 percent priced above $400,000.
Delinquent MortgagesThe rate of seriously delinquent (90 or more days delinquent or in foreclosure) home loans and REO properties in the HMA peaked below, and remains below, the rate for the nation. During December 2018, the rate was 1.5 percent, down from 1.9 percent a year earlier and down from a peak of 6.5 percent in early 2010 (CoreLogic, Inc.). The rate for the nation was 1.7 percent in December 2018, down from 2.4 percent in December 2017 and a peak of 8.6 percent in early 2010.
Inventory of Homes for Sale by PriceThe supply of homes for sale, as measured by months of unsold inventory, was 3.1 months in December 2018, up from 2.8 months in December 2017 (Wisconsin Realtors® Association). Rising average home sales prices have contributed to an increase in the number of homes for sale. The months of unsold inventory rose but remained at less than 4 months in all price ranges below $300,000 (Figure 13). In the price ranges from $301,000 to $500,000,
months of unsold inventory was approximately 4 months, down from more than 4 months during the same period a year earlier. The price range with the largest gain in months of inventory was homes priced above $501,000, which rose from 6.2 months in December 2017 to 9.2 months in December 2018, partially because of higher listing prices in response to recent job announcements.
Sales Housing Construction ActivitySales housing construction activity, as measured by the number of building permits issued for sales housing, including single-family homes, townhomes, and condominiums, was elevated during the 2000s, reached a low during the beginning of job recovery, and has increased in recent years of the
Source: Wisconsin Realtors® Association
10
9
8
7
6
5
4
3
2
1
0
December 2018December 2017
$0 to $100k $101 to $200k $201 to $300k $301 to $400k $401 to $500k $501k and More
Figure 13. Months of Inventory of Homes for Sale by Price in the Racine HMA

Home Sales Market Conditions 15Racine, Wisconsin Comprehensive Housing Market Analysis as of January 1, 2019
Comprehensive Housing Market Analysis Racine, Wisconsin U.S. Department of Housing and Urban Development, Office of Policy Development and Research
Sources: U.S. Census Bureau, Building Permits Survey; 2000–2017 final data and analyst estimates; 2018 preliminary data and estimates by the analyst
1,000
900
800
700
600
500
400
300
200
100
0
2000
2001
2002
2003
2004
2005
2006
2007
2008
2009
2010
2011
2012
2013
2014
2015
2016
2017
2018
CondominiumSingle Family/Townhome
Figure 14. Annual Average Sales Permitting Activity in the Racine HMAcurrent decade. Despite the increase, construction activity is well below levels from the early 2000s. The number of new homes permitted peaked in 2004, at 960 homes, and then fell by an average of 120 homes a year, to a low of 100 homes in 2011 (Figure 14). The number of homes permitted increased by an average of 25 homes a year from 2012 through 2017, to 250 homes permitted in 2017. In response to low inventory of homes for sale and rising new home sales prices, permitting of sales housing rose 22 percent from 2017 to 2018 (preliminary data, with adjustments by the analyst).
Including a downtown lakefront high-rise condominium built in 2005, condominiums accounted for approximately 4 percent of for-sale homes permitted from 2000 through 2007. Since 2008, condominiums have accounted for less than 2 percent of all sales housing permitted.
New Construction PropertiesHomebuilding is occurring throughout the HMA in unincorporated areas and in cities and towns both east and west of I-94, predominantly in subdivisions platted more than 10 years ago. In Waterford, a community on the far west side of the HMA, Bielinski Homes is finishing a 40-unit duplex condominium development, which began construction in 2007. Prices for recently completed two-bedroom, two-bathroom homes start at $289,900. In the city of Racine, Ravine Bay Estates, a 100-lot subdivision, initially started in 1988, currently has 24 available lots. Prices for recently completed three-bedroom, two-bathroom, single-family homes range from $300,000 to $325,000.
ForecastDuring the 3-year forecast period, demand is expected for an additional 1,575 homes (Table 5). The 75 homes currently under construction are expected to meet a portion of the demand. Demand is expected to rise each year, as payrolls continue to increase, and to be strongest for homes priced less than $400,000.
Table 5. Demand for New Sales Construction Units in the Racine HMA During the Forecast Period
Sales Units
Demand 1,575 Units
Under Construction 75 Units
Source: Estimates by the analyst

Rental Market Conditions 16Racine, Wisconsin Comprehensive Housing Market Analysis as of January 1, 2019
Comprehensive Housing Market Analysis Racine, Wisconsin U.S. Department of Housing and Urban Development, Office of Policy Development and Research
Rental Market
Quick Facts
2010 CurrentRental Vacancy Rate 9.3% 7.5%
Occupied Rental Units by StructureSingle-Family Attached & Detached 35% 34%
Multifamily (2-4 Units) 21% 26%
Multifamily (5+ Units) 44% 39%
Other (Including Mobile Homes) 0% 1%
Apartment Market
Quick Facts
Current YoY ChangeApartment Vacancy Rate 3.3% -0.2
Average Rent $823 4%
Studio $545 4%
One-Bedroom $702 6%
Two-Bedroom $863 4%
Three-Bedroom $961 2%
YoY = year-over-year.Notes: The current date is January 1, 2019. Current data for “rental units by structure” is American Community Survey, 2017 1-year data. Apartment data is RealPage, Inc. Sources: American Community Survey, 1-year data; RealPage, Inc.
$825
$800
$775
$750
$725
$700
4Q11
4Q12
4Q13
4Q14
4Q15
4Q16
4Q17
4Q18
Ave
rage
Mon
thly
Ren
t
Vaca
ncy
Rate
5.0%
4.0%
3.0%
2.0%
1.0%
0.0%
Vacancy RateAverage Monthly Rent
Figure 15. Apartment Rents and Vacancy Rates in the Racine HMA
Source: RealPage, Inc.
Rental Market ConditionsMarket Conditions: Balanced, but tightening
The first market-rate apartment property to be built in the HMA in more than a decade broke ground in 2018.
Current Conditions and Recent TrendsRental market conditions in the Racine HMA are balanced but tightening. The rental market vacancy rate is currently estimated at 7.5 percent, down from 9.3 percent in 2010 (Table 6). With nearly all household growth since 2010 attributed to an increase in renter households and relatively few new rental units built, the rental market has shifted from soft conditions at the beginning of the decade to currently balanced conditions. Since 2010, approximately 360 new rental units have been constructed, nearly all of which were restricted to seniors or low-income households or are in small buildings with fewer than five units. The number of renter households of all ages and incomes increased by an estimated 1,900 since 2010. The majority of the recent renter household growth was accommodated in existing units that have shifted from owner to renter occupancy. Currently, an estimated 60 percent of all renter-occupied housing consists of single-family homes and buildings with fewer than five units, up from 56 percent in 2010.
Apartment Market ConditionsThe market for market-rate apartment properties is slightly tight and has ranged from balanced to tight conditions since 2011. During the fourth quarter of 2018, the vacancy rate for market-rate apartments was 3.3 percent, down from 3.5 percent during the same quarter a year earlier, and has remained below 5 percent since 2011 (Figure 15). The average market-rate apartment rent during the fourth quarter of 2018 was $823, up 4 percent from a year earlier, rising faster than the average rent increase of 2 percent annually from 2012 through 2017. No market-rate apartment properties have been built in the HMA in more than a decade, contributing to the currently tight conditions.
Table 6. Rental and Apartment Market Quick Facts in the Racine HMA

Rental Market Conditions 17Racine, Wisconsin Comprehensive Housing Market Analysis as of January 1, 2019
Comprehensive Housing Market Analysis Racine, Wisconsin U.S. Department of Housing and Urban Development, Office of Policy Development and Research
250
200
150
100
50
02000-2007 2008-2015 2016-2018
Figure 16. Annual Average Rental Permitting Activity in the Racine HMA
Sources: U.S. Census Bureau, Building Permits Survey; 2000–2017 final data and analyst estimates; 2018 preliminary data and estimates by the analyst
Rental Construction ActivityRental construction, as measured by the number of rental units permitted, has increased since 2016 but remains below levels from the early 2000s. From 2000 through 2007, an average of 240 rental units were permitted each year (Figure 16). Coinciding with the Great Recession and declining or stable population in the HMA during the early 2010s, rental permitting averaged 45 units a year from 2008 through 2015. The number of rental units permitted has increased in recent years, with an average of 80 units permitted annually from 2016 through 2018, but remains below levels from the early 2000s.
Recently Completed Rental PropertiesSince 2000, nearly all rental housing built has been age or income restricted. Approximately 58 percent of recently built units were in senior housing properties, including affordable senior housing, and 38 percent were in low-income housing buildings with no age restrictions. The remaining units were market-rate apartments, most of which were built in the early 2000s. With the average cost of operating an apartment unit currently ranging from $600 to $800 (BizTimes Milwaukee, 2019) per month and current average rents only slightly above the cost of operation, construction of market-rate housing may not have been considered profitable by developers. Two apartment buildings built with low-income housing tax credits (LIHTC) in the early 2000s recently completed the initial 15-year compliance period requiring the units to be rented at affordable rates and have begun renting units to new tenants at market rate.
Belle Harbor Lofts in downtown Racine, built in 2002 and recently converted to market-rate units, has asking rents of $850, $900 to $1,050, and $1,150 for one-bedroom, two-bedroom, and three-bedroom units, respectively. In Union Grove, one of the fastest growing communities in the HMA, a 73-unit apartment property broke ground in mid-2018. The first building in the five-building property is expected to open in mid-2019. Rents are $1,150 for a one-bedroom unit and $1,450 to $1,600 for a two-bedroom unit. In anticipation of stronger job and population growth, at least a half-dozen additional apartment properties have been announced but have not yet begun construction.
Table 7. Demand for New Rental Construction Units in the Racine HMA During the Forecast Period
Rental Units
Demand 640 Units
Under Construction 80 Units
Source: Estimates by the analyst
ForecastDuring the next 3 years, demand is expected for an additional 640 rental units (Table 7). The 80 units currently under construction are expected to meet a portion of demand. Demand is expected to increase each year, as job growth continues.

Terminology Definitions and Notes 18Racine, Wisconsin Comprehensive Housing Market Analysis as of January 1, 2019
Comprehensive Housing Market Analysis Racine, Wisconsin U.S. Department of Housing and Urban Development, Office of Policy Development and Research
Terminology Definitions and Notes
A. Definitions
Demand The demand estimates in the analysis are not a forecast of building activity. They are the estimates of the total housing production needed to achieve a balanced market at the end of the 3-year forecast period given conditions on the as-of date of the analysis, growth, losses, and excess vacancies. The estimates do not account for units currently under construction or units in the development pipeline.
Other Vacant Units
In this analysis conducted by the U.S. Department of Housing and Urban Development (HUD), other vacant units include all vacant units that are not available for sale or for rent. The term therefore includes units rented or sold but not occupied; held for seasonal, recreational, or occasional use; used by migrant workers; and the category specified as “other” vacant by the Census Bureau.
Building Permits
Building permits do not necessarily reflect all residential building activity that occurs in an HMA. Some units are constructed or created without a building permit or are issued a different type of building permit. For example, some units classified as commercial structures are not reflected in the residential building permits. As a result, the analyst, through diligent fieldwork, makes an estimate of this additional construction activity. Some of these estimates are included in the discussions of single-family and multifamily building permits.
Distressed Sales Short sales and real estate owned (REO) sales.
Seriously Delinquent Mortgages
Mortgages 90+ days delinquent or in foreclosure.

Terminology Definitions and Notes 19Racine, Wisconsin Comprehensive Housing Market Analysis as of January 1, 2019
Comprehensive Housing Market Analysis Racine, Wisconsin U.S. Department of Housing and Urban Development, Office of Policy Development and Research
Home Sales/Home Sales Prices
Includes single-family, townhome, and condominium sales.
Rental Market/Rental Vacancy Rate
Includes apartments and other rental units such as single-family, multifamily, and mobile homes.
Forecast Period 1/1/2019–1/1/2022—Estimates by the analyst
Net Natural Increase
Resident births minus resident deaths.
Renter-Occupied Housing
Includes apartments and renter-occupied single-family homes, townhomes, condominiums, and mobile homes.
Senior HousingHousing restricted to older adults, typically age 55 and over. Includes but is not limited to market-rate and affordable senior apartments, independent living, and assisted-living facilities.
Low-Income Housing
Housing typically restricted to residents with a household income at or below 60 percent of area median income (AMI). Examples include but are not limited to public housing, Section 8 housing, and low-income housing tax credit (LIHTC) housing.
Months of Unsold Inventory
Ratio of homes for sale to homes sold in a month.

Terminology Definitions and Notes 20Racine, Wisconsin Comprehensive Housing Market Analysis as of January 1, 2019
Comprehensive Housing Market Analysis Racine, Wisconsin U.S. Department of Housing and Urban Development, Office of Policy Development and Research
B. Notes on Geography
1.The metropolitan statistical area definition noted in this report is based on the delineations established by the Office of Management and Budget (OMB) in the OMB Bulletin dated February 28, 2013.
2. Urbanized areas are defined using the U.S. Census Bureau’s 2010 Census Urban and Rural Classification and the Urban Area Criteria.
3. The census tracts referenced in this report are from the 2010 Census.
C. Additional Notes
1.This analysis has been prepared for the assistance and guidance of HUD in its operations. The factual information, findings, and conclusions may also be useful to builders, mortgagees, and others concerned with local housing market conditions and trends. The analysis does not purport to make determinations regarding the acceptability of any mortgage insurance proposals that may be under consideration by the Department.
2.
The factual framework for this analysis follows the guidelines and methods developed by the Economic and Market Analysis Division within HUD. The analysis and findings are as thorough and current as possible based on information available on the as-of date from local and national sources. As such, findings or conclusions may be modified by subsequent developments. HUD expresses its appreciation to those industry sources and state and local government officials who provided data and information on local economic and housing market conditions.
Cover Photo Brad Trick of Btrick Photography

Terminology Definitions and Notes 21Racine, Wisconsin Comprehensive Housing Market Analysis as of January 1, 2019
Comprehensive Housing Market Analysis Racine, Wisconsin U.S. Department of Housing and Urban Development, Office of Policy Development and Research
Contact InformationMarissa Dolin, Economist Chicago HUD Regional Office312–913–[email protected]