comprehensive housing market analysis for newark, new ... · newark, new jersey-pennsylvania ......
TRANSCRIPT

C O M P R E H E N S I V E H O U S I N G M A R K E T A N A L Y S I S
Newark, New Jersey-Pennsylvania
U.S. Department of Housing and Urban Development Office of Policy Development and Research As of August 1, 2015
Pike
Sussex
Morris
Hunterdon
Somerset
Union
Essex
New YorkNew Jersey
Sullivan
Orange
Passaic
Middlesex
Ric
hmon
d
Warren
Monroe
Nor
tham
pton
Bucks
Bergen
Hud
son
Mercer
Wayne
Monmouth
Rockland
Ulster
Kin
gs
Penns
ylva
nia
Housing Market Area
The Newark Housing Market Area (HMA) consists of Essex, Hunterdon, Morris, Somerset, Sussex, and Union Counties in New Jersey and Pike County in Pennsylvania. The HMA is coterminous with the Newark, NJ-PA Metropolitan Division of the New York-Newark-Jersey City, NY-NJ-PA Metropolitan Statistical Area. For purposes of this analysis, the HMA is divided into two submarkets: the Central submarket, which includes the city of Newark, consists of Essex and Union Counties, and the Suburban submarket includes the remaining counties.
Summary
Economy Economic conditions strengthened in the Newark HMA during the past 4 years, and payroll growth accelerated during the past year. During the 12 months ending July 2015, nonfarm payrolls increased by 13,900 jobs, or 1.2 percent, to 1.19 million jobs. By comparison, nonfarm payrolls in - creased an average of 0.7 percent, or by 8,500 jobs, annually during the previous 3 years. Nonfarm payrolls are projected to grow at an average annual rate of 0.9 percent during the 3-year forecast period, with the rate of growth expected to be relatively steady each year. Table DP-1 at the end of this report provides employment data for the HMA.
Sales MarketThe sales housing market in the HMA is currently slightly soft. The estimated sales vacancy rate is 2.0 percent, up from 1.8 percent in 2010. During the next 3 years, demand is estimated for 5,850 new homes (Table 1). The 1,000 homes under construction and some of the estimated 47,300 other vacant units in the HMA that may reenter the market will satisfy a portion of this demand.
Rental MarketThe rental housing market in the HMA is currently slightly soft. The estimated overall rental vacancy rate is 6.9 percent, down from 8.0 percent in 2010. During the forecast period, demand is estimated for approximately 6,720 new market-rate rental units (Table 1). The 4,800 units under construction will satisfy a majority of this demand.
Table 1. Housing Demand in the Newark HMA During the Forecast Period
Newark HMA Central Submarket Suburban Submarket
SalesUnits
RentalUnits
SalesUnits
RentalUnits
SalesUnits
RentalUnits
Total demand 5,850 6,720 5,750 6,250 100 470
Under construction 1,000 4,800 450 3,100 550 1,700
Notes: Total demand represents estimated production necessary to achieve a balanced market at the end of the forecast period. Units under construction as of August 1, 2015. A portion of the estimated 47,300 other vacant units in the HMA will likely satisfy some of the forecast demand. The forecast period is August 1, 2015, to August 1, 2018.Source: Estimates by analyst
Market DetailsEconomic Conditions ...............2
Population and Households .....5
Housing Market Trends ............8
Data Profiles ...........................17

Ne
wa
rk,
NJ
-PA
• C
OM
PR
EH
EN
SIV
E H
OU
SIN
G M
AR
KE
T A
NA
LYS
IS
2Economic Conditions
Within the Newark HMA, the professional and busi-
ness services sector comprises nearly 18 percent of all nonfarm payroll jobs and the wholesale and retail trade, government, and education and health services sectors comprise approximately 15 percent each (Figure 1). The gov - ernment sector includes Newark Inter - national Airport, which is the largest employer in the HMA with 24,000 total employees (Table 2). During 2013 (most recent data available), the com - bined economic impact of the airport on the entire New York/New Jersey region was approximately $31.22 billion (study by The Port Authority of New York and New Jersey). Included in the impact is more than $11 billion in wages and sales resulting from visitors coming to the area. The continued
tourism into the area has resulted in the leisure and hospitality sector in the HMA increasing more than 31 percent since 2000, which was the largest percentage increase of any sector during that period (Figure 2).
From 2002 through 2007, a mix of small-to-moderate job gains and lob losses occurred. During the 6-year period, nonfarm payrolls increased by an average of 2,300 jobs, or 0.2 percent, annually. By comparison, nonfarm payrolls nationwide increased an aver - age of 0.7 percent, annually. Significant gains in the HMA during this period were in the government and the educa - tion and health services sectors, which increased by averages of 3,600 and 2,800 jobs, or 2.1 and 1.8 percent, re - spectively. In the government sector, more than 70 percent of the gains were in the local government sub-sector, which was up an average of 2,600 jobs, or 2.2 percent, annually. These gains were partially attributed to Newark International Airport add - ing an average of more than 200 new employees annually during the period. In the education and health services sector, nearly 40 percent of the addi-tions were in the ambulatory health care services industry, in which payrolls increased by an average of 1,100 jobs, or 2.4 percent, annually. Partially off - setting these gains were significant losses in the manufacturing sector, which decreased at an average of 4,600 jobs, or 4.0 percent, annually. General Motors Company closed a manufacturing plant that produced trucks and sport utility vehicles in 2005 because the Chevrolet Blazers that were produced at the facility were dis-continued. The plant closure resulted in approximately 950 jobs lost.
Figure 1. Current Nonfarm Payroll Jobs in the Newark HMA, by Sector
Note: Based on 12-month averages through July 2015.Source: U.S. Bureau of Labor Statistics
Table 2. Major Employers in the Newark HMA
Name of Employer Nonfarm Payroll Sector Number of Employees
Newark International Airport Government 24,000Verizon Communications Inc. Information 17,000Merck & Company, Inc. Professional & business services 14,000New Jersey Transit Government 11,500Continental Airlines, Inc. Transportation & utilities 11,000Public Services Enterprise Group Transportation & utilities 10,000Novartis Pharmaceuticals Corporation Manufacturing 6,650Gateway Group One Professional & business services 6,250Pfizer, Inc. Manufacturing 5,000Atlantic Health System Education & health services 4,500
Note: Excludes local school districts.Source: Economy.com
Government 15.1%
Leisure & hospitality 7.7%
Other services 4.7%
Education & health services 14.8%
Professional & business services 17.9%
Wholesale & retail trade 15.3%
Manufacturing 6.7%
Mining, logging, & construction 3.7%
Information 2.0%
Transportation & utilities 4.9%
Financial activities 7.0%

Ne
wa
rk,
NJ
-PA
• C
OM
PR
EH
EN
SIV
E H
OU
SIN
G M
AR
KE
T A
NA
LYS
IS
3
Figure 2. Sector Growth in the Newark HMA, Percentage Change, 2000 to Current
Note: Current is based on 12-month averages through July 2015.Source: U.S. Bureau of Labor Statistics
The Great Recession, which occurred nationally from December 2007 to June 2009, also significantly affected the economy of the HMA from 2008 through 2011. During the 4-year period, nonfarm payrolls in the HMA declined by an average of 19,400 jobs, or 1.6 percent, annually. The largest losses were in the manufacturing and the wholesale and retail trade sectors, which decreased at average annual rates of 5,000 and 3,500 jobs, or 5.3 and 1.9 percent, respectively. Within the manufacturing sector, the chemical manufacturing industry was signifi-cantly impacted, decreasing by an average of 2,100 jobs, or 7.1 percent, annually. Along with generally weak local economic conditions, these declines were partially attributed to multiple mergers of pharmaceutical companies, which resulted in numer-ous large-scale layoffs and plant clo-sures as the newly merged companies restructured their organizations. Job losses occurred in both the retail trade and the wholesale trade subsectors,
which declined by averages of 2,100 and 1,500 jobs, or 1.7 and 2.3 percent, respectively, in response to decreased demand for most retail products because of the national recession.
From 2012 through 2014, economic conditions in the HMA improved at a moderate pace. Nonfarm payrolls during this period increased by an average of 9,900 jobs, or 0.9 percent, annually. By comparison, nonfarm payrolls nationwide increased an average of 1.8 percent annually. Dur-ing the 3-year period, the largest gains in the HMA were in the leisure and hospitality and the professional and business services sectors, which were up by average annual rates of 2,600 and 1,900 jobs, or 3.0 and 0.9 percent, respectively. Nearly 85 percent of the additions in the leisure and hospitality sector were in the accommodation and food services industry, which increased by an average of 2,200 jobs, or 3.2 per - cent, in response to increased tourism to the New York metropolitan area.
Economic Conditions Continued
Total nonfarm payroll jobs
Goods-producing sectors
Mining, logging, & construction
Manufacturing
Service-providing sectors
Information
Financial activities
Professional & business services
Education & health services
Government
Other services
Leisure & hospitality
Transportation & utilities
Wholesale & retail trade
– 30 20– 20 10– 10 0– 50 – 40 30 40

Ne
wa
rk,
NJ
-PA
• C
OM
PR
EH
EN
SIV
E H
OU
SIN
G M
AR
KE
T A
NA
LYS
IS
4
In the professional and business ser - vices sector, Panasonic Corporation of North America moved its headquar - ters into the HMA in 2013, resulting in approximately 1,000 new jobs.
Nonfarm payroll growth in the HMA has accelerated during the past year as the economy continued to recover from the recession. During the 12 months ending July 2015, nonfarm payrolls averaged 1.19 million, an in - crease of 13,900 jobs, or 1.2 percent, from the previous 12 months (Table 3). The largest gains were in the mining, logging, and construction and the gov - ernment sectors, which increased by 4,200 and 4,100 jobs, or 10.4 and 2.3
percent, respectively. In the mining, logging, and construction sector, more than 52 percent of the gains were in the specialty trade contractors and the construction of buildings industries, which increased by 1,800 and 400 jobs, or 6.8 and 4.1 percent, respectively, largely stemming from increases in single-family and multifamily construc - tion activity. Gains in the government sector were partially attributed to local governments adding approximately 1,350 educational and health services jobs during 2014 (Quarterly Census of Employment and Wages). Partially offsetting these gains were losses in the information and manufacturing sectors, which declined by 1,100 and 800 jobs, or 4.3 and 1.0 percent, re - spectively. More than 90 percent of the net losses in the information sector were in the telecommunications in-dustry, which declined by 1,000 jobs, or 7.6 percent. In the manufacturing sector, Anheuser-Busch laid off 60 employees at a facility in Newark.
During the 12 months ending July 2015, the unemployment rate in the HMA averaged 6.1 percent. The current rate is down from 7.0 percent during the 12 months ending July 2015 but remains higher than the average rate of 5.2 per - cent from 2001 through 2007. The current rate is lower than the rate in New Jersey, 6.4 percent, but higher than the current national rate of 5.6 percent. The unemployment rate in the Central submarket has typically been higher than in the Suburban submarket because of the higher concentration of workers in the goods-producing sectors in the Central submarket. Since 2000, nonfarm payrolls in goods-producing sectors have decreased 30 percent, while the number of jobs in service-providing sectors has increased 4 per - cent. Figure 3 illustrates trends in the
Table 3. 12-Month Average Nonfarm Payroll Jobs in the Newark HMA, by Sector
12 Months Ending Absolute Change
Percent ChangeJuly 2014 July 2015
Total nonfarm payroll jobs 1,174,300 1,188,200 13,900 1.2Goods-producing sectors 121,100 124,500 3,400 2.8
Mining, logging, & construction 40,300 44,500 4,200 10.4Manufacturing 80,900 80,100 – 800 – 1.0
Service-providing sectors 1,053,200 1,063,700 10,500 1.0Wholesale & retail trade 181,000 182,400 1,400 0.8Transportation & utilities 55,600 57,900 2,300 4.1Information 25,400 24,300 – 1,100 – 4.3Financial activities 82,600 83,600 1,000 1.2Professional & business services 213,600 213,100 – 500 – 0.2Education & health services 174,200 175,800 1,600 0.9Leisure & hospitality 90,400 91,000 600 0.7Other services 54,700 55,800 1,100 2.0Government 175,700 179,800 4,100 2.3
Notes: Numbers may not add to totals because of rounding. Based on 12-month averages through July 2014 and July 2015.Source: U.S. Bureau of Labor Statistics
Figure 3. Trends in Labor Force, Resident Employment, and Unem-ployment Rate in the Newark HMA, 2000 Through 2014
Source: U.S. Bureau of Labor Statistics
Economic Conditions Continued
Une
mpl
oym
ent r
ate
Labo
r fo
rce
and
resi
dent
em
ploy
men
t
1,390,000
1,340,000
1,290,000
1,240,000
1,190,000
1,140,000
1,090,000
1,040,000
2000
2002
2004
Labor force Resident employment Unemployment rate
2006
2001
2003
2005
2007
2009
2010
2008
2012
2013
2014
2011
10.0
8.0
6.0
4.0
2.0
0.0

Ne
wa
rk,
NJ
-PA
• C
OM
PR
EH
EN
SIV
E H
OU
SIN
G M
AR
KE
T A
NA
LYS
IS
5
labor force, resident employment, and the unemployment rate in the HMA from 2000 through 2014.
During the 3-year forecast period, nonfarm payroll growth in the HMA is expected to continue but at a slightly slower pace than during the past year. Nonfarm payrolls are expected to increase by an average of 10,700 jobs, or 0.9 percent, annually and payroll growth is expected to be relatively steady during all 3 years. Gains are expected to be concentrated in service- providing sectors, especially the wholesale and retail trade sector. The construction of a ShopRite
supermarket in Newark is scheduled to be complete in late 2015 and is expected to result in nearly 300 new full- and part-time jobs. In addition, Prudential Financial, Inc., is expected to add 400 new jobs during the forecast period as the company expands its corporate headquarters, which is in the HMA. In the goods-producing sectors, few to no net gains are expected because small gains in the construction industry, which are expected to result from increased residential and nonresi - dential construction activity, will be offset by marginal net losses in the manufacturing sector.
Population and Households
As of August 1, 2015, the estimated population of the
Newark HMA was 2.52 million, an average increase of 8,775, or 0.4 per - cent, annually since April 2010. Popu - lation growth in the HMA was slow from 2003 to 2008 but has accelerated since then. From 2003 to 2008, the population of the HMA increased by an average of 2,375, or 0.1 percent, annually (Census Bureau population estimates as of July 1). During the 5-year period, net natural increase (resident births minus resident deaths) averaged 13,950 people, offsetting strong net out-migration of 11,550 peo - ple annually. The net out-migration was partially attributed to weak job growth in the HMA as compared with growth in the rest of the nation. From 2008 to 2012, population growth increased to an average of 9,875 people, or 0.4 percent, annually because net out-migration decreased to an average of 1,875 annually. The decreased net
out-migration was partially attributed to more people choosing to move into the HMA instead of New York City because of the increased affordability of housing in the HMA relative to New York City since 2000. Average asking rents in New York City were 133 percent greater than in the portion of the HMA covered by Reis, Inc., dur - ing 2000; were 150 percent greater by 2008; and were more than 160 percent greater during the second quarter of 2015. The increased rate of population growth in the HMA from 2008 to 2012 was slightly tempered, however, because net natural increase slowed to an average of 11,750 annually be - cause of an aging population and a decline in the number of births. Since 2012, net out-migration has continued to decline, to an average of 670 people annually, because of improving eco - nomic conditions and continued in - creasing affordability of housing in the HMA relative to New York City.
Economic Conditions Continued

Ne
wa
rk,
NJ
-PA
• C
OM
PR
EH
EN
SIV
E H
OU
SIN
G M
AR
KE
T A
NA
LYS
IS
6
Population growth, however, further slowed to an average of 8,900 people, or 0.4 percent, annually because net natural increase was down to an average of 9,575 people.
During the 3-year forecast period, low levels of net in-migration are expected because of continued job gains. The population is expected to increase by an average 9,325, or 0.4 percent, an - nually and number 2.55 million by August 1, 2018. Figure 4 shows popu-lation and household growth in the HMA, and Figure 5 shows the com - ponents of population change in the HMA, from 2000 to the forecast date.
The Central submarket has been the faster growing submarket during the
past 7 years after the population declined or had minor growth every year from 2002 to 2008. The popula-tion of the submarket is currently estimated at 1.36 million, which ac - counts for 54 percent of the total population of the HMA. From 2002 to 2008, the population of the submar - ket decreased by an average of 2,925, or 0.2 percent, annually because of strong net out-migration, which aver - aged 11,450 people annually (Census Bureau population estimates as of July 1). The net out-migration was partially the result of people not mov - ing into the HMA because of slow economic growth, especially compared with growth in the nation. In addition, people who were moving into the HMA, especially millennials, were electing to move into the suburban areas, so in-migration to the Central submarket was limited. These pre - ferences, however, have changed in recent years, with more millennials choosing to move into urban areas and areas that are closer to New York City. Since 2008, the trend has led to the submarket capturing a larger por - tion of people moving into the HMA for affordability and economic reasons. As a result, the population ages 20 to 29 increased an average of 1.3 percent annually from 2008 to 2013 compared with a decline in the age group of 0.8 percent annually from 2000 to 2008 (2000 Census and American Com-munity Survey). Since 2008, more people have chosen to move into the submarket, which has caused net out- migration to significantly decrease to an average of 730 people annually. As a result, population growth has occurred each year, averaging 7,175 people, or 0.5 percent, annually. The population of the Central submarket is expected to increase by an average
Figure 4. Population and Household Growth in the Newark HMA, 2000 to Forecast
Notes: The current date is August 1, 2015. The forecast date is August 1, 2018.Sources: 2000 and 2010—2000 Census and 2010 Census; current and forecast—estimates by analyst
Figure 5. Components of Population Change in the Newark HMA, 2000 to Forecast
Notes: The current date is August 1, 2015. The forecast date is August 1, 2018.Sources: 2000 and 2010—2000 Census and 2010 Census; current and forecast—estimates by analyst
Population and Households Continued
Net natural change Net migration
2000 to 2010 2010 to current Current to forecast
Ave
rage
ann
ual c
hang
e 15,000
10,000
5,000
0
– 5,000
– 10,000
2000 to 2010 2010 to current Current to forecast
Ave
rage
ann
ual c
hang
e
10,000
9,000
8,000
7,000
6,000
5,000
4,000
3,000
2,000
1,000
0
Population Households
Ne
wa
rk,
NJ
-PA
• C
OM
PR
EH
EN
SIV
E H
OU
SIN
G M
AR
KE
T A
NA
LYS
IS
7
of 7,675 people, or 0.6 percent, annually to 1.38 million during the forecast period. Low levels of net in-migration are expected during the forecast period, but population growth in the submarket will continue to result from net natural increase, which is estimated to account for more than 95 percent of the population growth.
In the Suburban submarket, popula-tion growth slowed in recent years despite increased in-migration to the HMA because more people, especially millennials, chose to move into the Central submarket. This trend resulted in the growth of the population ages 20 to 29 to slow from an average in - crease of 1.4 percent annually from 2000 to 2008 to an average of 0.1 per - cent annually from 2008 to 2013. The population of the submarket currently totals 1.16 million and accounts for 46 percent of the total population in the HMA. From 2000 to 2007, the population of the submarket increased by an average of 8,225, or 0.7 percent, annually and net in-migration aver - aged 2,125 people annually (Census Bureau population estimates as of July 1). From 2007 to 2010, net out- migration occurred each year, aver - aging 1,325 during the 3-year period, in part because people chose to reside in the Central submarket over the Suburban submarket. In addition, a lower number of births and an aging population in the submarket caused net natural increase to decrease from an average of 6,075 from 2000 to 2007 to an average of 4,350 from 2007 to 2010. The net out-migration and lower levels of net natural increase caused population growth to slow to an average of 0.3 percent, or 3,025 people, annually. Since 2011, popula - tion growth has further slowed to an average of 2,100 people, or 0.2 percent,
annually. The slower population growth was because of net natural increase further declining to an average of 2,400 annually, which is partially attributed to fewer millenni-als, who are more likely to have children, moving into the area. Net out-migration has continued during this period but at a slower pace of 270 people annually, because of an in - creased inflow of people in response to improving economic conditions. The population of the Suburban submarket is expected to increase by an average of 1,675, or 0.1 percent, annually to 1.17 million during the forecast period.
The current homeownership rate in the HMA is estimated at 62.4 percent, down from 63.9 percent in 2010, but the rates differ significantly between submarkets. In the Central submarket, the homeownership rate was esti-mated at only 49.6 percent, down from 51.1 percent in 2010. The low percentage of homeowners is attrib - uted to a high renter population in the cities of Newark and Elizabeth, which are the largest cities in the HMA. The low homeownership rate in the Central submarket is by con - trast with an estimated rate in the Suburban submarket of 76.9 percent, down from 78.2 percent in 2010.
An estimated 909,700 households cur - rently reside in the HMA. Figures 6 and 7 show the number of households by tenure in each submarket from 2000 to the current date. Since 2010, similar to the rate of population growth, the number of households in the HMA has increased an average of 0.3 percent annually, or by 2,950 households, down from an average of 0.4 percent, or by 3,350 households, from 2000 to 2010. Since 2010, the
Population and Households Continued

Ne
wa
rk,
NJ
-PA
• C
OM
PR
EH
EN
SIV
E H
OU
SIN
G M
AR
KE
T A
NA
LYS
IS
8
Central submarket has accounted for nearly three-fourths of the total house - hold growth, up significantly from approximately 6 percent of the house - hold growth from 2000 to 2010 be - cause of the changing migration trends between the submarkets. The number of the households in the HMA is
ex pected to grow by 3,300, or 0.4 per- cent, annually during the next 3 years to total 919,600 households. More than 80 percent of the household growth is expected to be in the Central submarket.
An estimated 483,600 households are currently residing in the Central Sub - market. Since 2010, household growth has averaged 2,200, or 0.5 percent, annually compared with average growth of 200, or less than 0.1 percent, annually from 2000 to 2010. The rates of household growth for both time periods have mirrored the rates of population growth in the submarket. During the next 3 years, household growth is expected to average 2,725, or 0.6 percent, annually to reach 491,800 households by August 2018. In the Suburban submarket, the num - ber of households is currently esti - mated at 426,000. Since 2010, similar to the rates of population growth, the number of households has increased by an average of 720, or 0.2 percent, annually. Household growth is down from an average of 3,150, or 0.8 per - cent, from 2000 to 2010 because of slower population growth. The num - ber of the households is expected to grow by 600, or 0.1 percent, annually during the next 3 years to total 427,800 households.
Figure 6. Number of Households by Tenure in the Central Submarket, 2000 to Current
Note: The current date is August 1, 2015.Sources: 2000 and 2010—2000 Census and 2010 Census; current—estimates by analyst
Figure 7. Number of Households by Tenure in the Suburban Submarket, 2000 to Current
Note: The current date is August 1, 2015.Sources: 2000 and 2010—2000 Census and 2010 Census; current—estimates by analyst
Housing Market Trends
Sales Market—Central SubmarketThe sales housing market in the Central submarket is slightly soft but improving. The current vacancy rate is estimated at 1.7 percent, down from 2.2 percent in April 2010 (Table DP-2
at the end of this report). During the 12 months ending May 2015, the submarket had 5.2 months of unsold inventory, up slightly from 5.0 months of inventory during the previous
Population and Households Continued
Renter Owner
2000 2010 Current
250,000
200,000
150,000
100,000
50,000
0
Renter Owner
2000 2010 Current
350,000
300,000
250,000
200,000
150,000
100,000
50,000
0

Ne
wa
rk,
NJ
-PA
• C
OM
PR
EH
EN
SIV
E H
OU
SIN
G M
AR
KE
T A
NA
LYS
IS
9
12-month period (Yahoo!-Zillow Real Estate Network; CoreLogic, Inc.). The increased inventory is because the number of homes for sale increased 8 percent during the past year in response to increased sales activity and prices. Sales market conditions were slightly tight in 2000 but transitioned into soft conditions by 2008 because of a high level of single-family construction activity and strong net out-migration. Condi - tions have improved since the end of 2008, however, because of increased population growth and lower levels of single-family construction activity.
During the 12 months ending May 2015, approximately 11,550 new and existing homes (including single-family homes, townhomes, and condomini-ums) sold, an increase of 280 homes, or 3 percent, from the 12 months end - ing May 2014 (CoreLogic, Inc., with adjustments by the analyst). Sales activ - ity increased an average of 7 percent annually during the past 3 years be - cause of increased population growth and improving economic conditions; sales activity averaged 11,000 homes sold annually during the 3-year period. Current sales activity is up 8 percent compared with the average of 10,750 homes sold annually from 2008 through 2011. Sales activity, however, remains 48 percent below the average of 22,300 homes sold annually from 2003 through 2007. During the 12 months ending May 2015, the average sales price of new and existing homes increased 1 percent from a year ago, to $394,100. Increased sales activity during the past 3 years caused the average months of available inventory to decline by more than 3 months compared with the av - ailable inventory in 2012. As a result, the average sales price increased an average of 4 percent annually during
the past 3 years and the average price is now up 11 percent compared with the average price of $354,000 from 2009 through 2011. The increases to the average sales price during the past 3 years were slightly slowed by real estate owned (REO) sales, which accounted for 7 percent of all sales and sold for an average of $165,900.
Conditions have also been improving in the condominium sales market. During the 12 months ending May 2015, approximately 1,350 new and existing condominium units sold, an increase of 150 units sold, or 12 per - cent, from a year ago (Metrostudy, A Hanley Wood Company). Sales activity has increased an average of 18 percent annually during the past 4 years. By comparison, the number of new and existing condominium units sold decreased an average of 17 percent annually from 2006 through 2011. During the 12 months ending May 2015, the average sales price of new and existing condominium units sold increased 5 percent, to $315,500.
The rate of seriously delinquent loans (loans 90 or more days delinquent or in foreclosure) and REO properties in the submarket reached very high levels during the most recent recession and foreclosure crisis and has remained relatively high compared with the rate in the nation. In July 2015, 11.8 per - cent of home loans in the submarket were seriously delinquent or had transitioned into REO status, down from 13.2 percent in July 2014 (Black Knight Financial Services, Inc.). The rate of seriously delinquent loans was 5.1 percent in January 2008, near the beginning of the most recent reces-sion, and increased to a high of 17.5 percent in March 2013. By contrast, the rate of seriously delinquent loans
Housing Market TrendsSales Market—Central Submarket Continued
Ne
wa
rk,
NJ
-PA
• C
OM
PR
EH
EN
SIV
E H
OU
SIN
G M
AR
KE
T A
NA
LYS
IS
10
nationwide was 4.3 percent in July 2015 and peaked at 9.2 percent in January 2010. The rate of seriously delinquent loans and REO properties has remained elevated in the submar-ket, and in the state of New Jersey, in part because New Jersey is a judicial foreclosure state where the average length of the foreclosure process has been longer than in states where a nonjudicial foreclosure process exists. During the second quarter of 2015, New Jersey had the longest foreclosure timeline in the nation at more than 1,200 days, which was more than twice the national average (RealtyTrac).
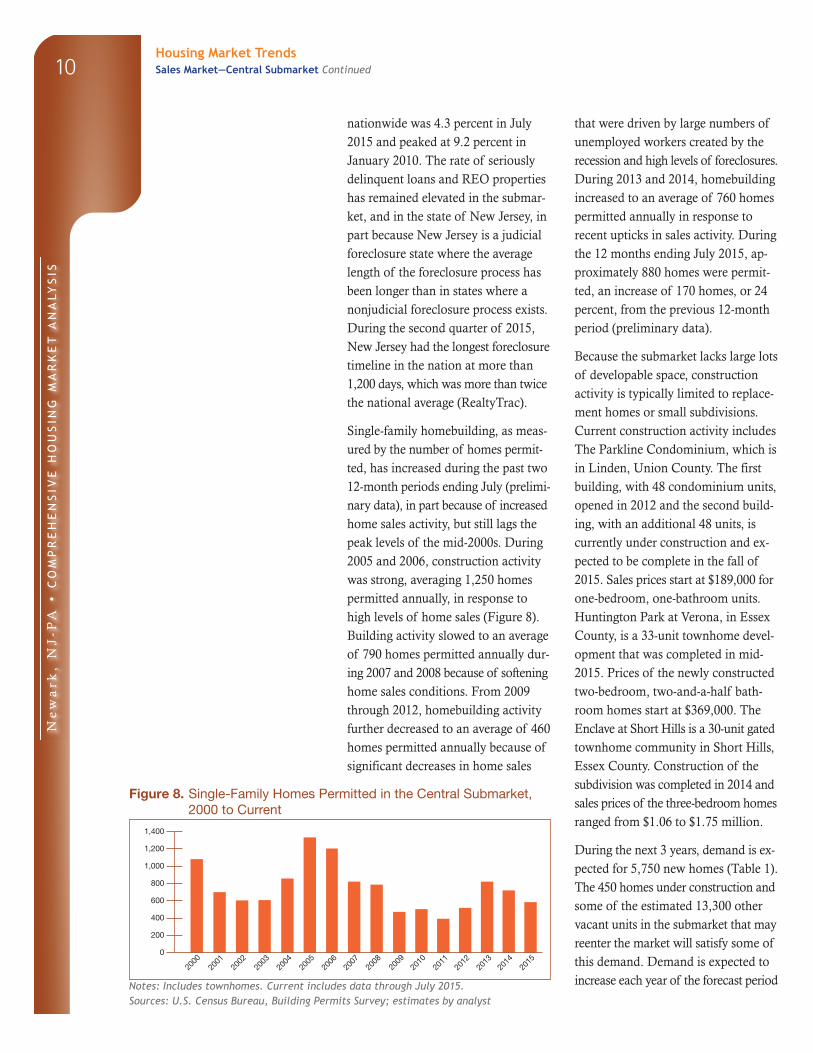
Single-family homebuilding, as meas - ured by the number of homes permit-ted, has increased during the past two 12-month periods ending July (prelim i - nary data), in part because of increased home sales activity, but still lags the peak levels of the mid-2000s. During 2005 and 2006, construction activity was strong, averaging 1,250 homes permitted annually, in response to high levels of home sales (Figure 8). Building activity slowed to an average of 790 homes permitted annually dur - ing 2007 and 2008 because of softening home sales conditions. From 2009 through 2012, homebuilding activity further decreased to an average of 460 homes permitted annually because of significant decreases in home sales
that were driven by large numbers of unemployed workers created by the recession and high levels of foreclosures. During 2013 and 2014, homebuilding increased to an average of 760 homes permitted annually in response to recent upticks in sales activity. During the 12 months ending July 2015, ap - proximately 880 homes were permit-ted, an increase of 170 homes, or 24 percent, from the previous 12-month period (preliminary data).
Because the submarket lacks large lots of developable space, construction activity is typically limited to replace-ment homes or small subdivisions. Current construction activity includes The Parkline Condominium, which is in Linden, Union County. The first building, with 48 condominium units, opened in 2012 and the second build - ing, with an additional 48 units, is currently under construction and ex - pected to be complete in the fall of 2015. Sales prices start at $189,000 for one-bedroom, one-bathroom units. Huntington Park at Verona, in Essex County, is a 33-unit townhome devel - opment that was completed in mid- 2015. Prices of the newly constructed two-bedroom, two-and-a-half bath - room homes start at $369,000. The Enclave at Short Hills is a 30-unit gated townhome community in Short Hills, Essex County. Construction of the subdivision was completed in 2014 and sales prices of the three-bedroom homes ranged from $1.06 to $1.75 million.
During the next 3 years, demand is ex - pected for 5,750 new homes (Table 1). The 450 homes under construction and some of the estimated 13,300 other vacant units in the submarket that may reenter the market will satisfy some of this demand. Demand is expected to increase each year of the forecast period
Figure 8. Single-Family Homes Permitted in the Central Submarket, 2000 to Current
Notes: Includes townhomes. Current includes data through July 2015.Sources: U.S. Census Bureau, Building Permits Survey; estimates by analyst
2000
2001
2002
2003
2004
2005
2006
1,400
1,200
1,000
800
600
400
200
0
2008
2009
2010
2011
2013
2015
2014
2012
2007
Housing Market TrendsSales Market—Central Submarket Continued

Ne
wa
rk,
NJ
-PA
• C
OM
PR
EH
EN
SIV
E H
OU
SIN
G M
AR
KE
T A
NA
LYS
IS
11
Table 4. Estimated Demand for New Market-Rate Sales Housing in the Central Submarket During the Forecast Period
Price Range ($) Units of PercentFrom To Demand of Total
125,000 199,999 290 5.0200,000 399,999 1,150 20.0400,000 599,999 1,450 25.0600,000 799,999 1,150 20.0800,000 999,999 860 15.0
1,000,000 1,999,999 580 10.02,000,000 and higher 290 5.0
Notes: The 450 homes currently under construction and a portion of the estimated 13,300 other vacant units in the submarket will likely satisfy some of the forecast demand. The forecast period is August 1, 2015, to August 1, 2018.Source: Estimates by analyst
because of continued job growth and increased in-migration. New home prices in the submarket are expected to start at $125,000 but significantly differ by type of unit and location. Homes priced between $400,000 and $799,999, however, are expected to constitute 45 percent of the demand (Table 4). Lower prices will be for one-bedroom condominiums in and near the cities of Newark and Eliza - beth. Single-family homes priced at and more than $1 million will be in western portions of the submarket.
Rental Market—Central Submarket
The rental housing market, including apartment units and single-family homes for rent, in the Central submar - ket is currently balanced. The overall rental vacancy rate is 6.8 percent, down from 8.5 percent in 2010 (Figure 9). The submarket contains approximately 53 percent of the total households in the HMA but more than 70 percent of the renter households, in part because of high renter populations in the cities of Newark and Elizabeth. Rental market conditions were slightly tight in 2000 but transitioned into a soft market by the end of 2008 because of strong net out-migration and a larger
portion of residents choosing to buy instead of rent because of lenient bor - rowing requirements for homebuyers. Since the end of 2008, rental market conditions have improved and have been brought into balance. This im - provement was primarily a result of stronger population growth and higher demand for rental units because of elevated foreclosure levels causing households to transition from being homeowners to renters. As of July 1, 2013, approximately 54 percent of all rental units were in structures with four or fewer units (American Com-munity Survey).
Conditions in the apartment market are also currently balanced, and va - cancy rates have declined since 2009. During the second quarter of 2015, the apartment vacancy rate was 4.0 percent, slightly down from 4.2 percent during the second quarter of 2014 and down from a high of 6.3 percent during 2009 (Reis, Inc.). The average asking rent increased 1 percent, to $1,196 during the past year. In addition, since 2010, rents have steadily increased an
Figure 9. Rental Vacancy Rates in the Central Submarket, 2000 to Current
Note: The current date is August 1, 2015.Sources: 2000 and 2010—2000 Census and 2010 Census; current—estimates by analyst
Housing Market TrendsSales Market—Central Submarket Continued
2000 Current2010
4.3
6.8
8.59.0
8.0
7.0
6.0
5.0
4.0
3.0
2.0
1.0
0.0

Ne
wa
rk,
NJ
-PA
• C
OM
PR
EH
EN
SIV
E H
OU
SIN
G M
AR
KE
T A
NA
LYS
IS
12
average of nearly 2 percent annually because of increased demand for apartment units.
Multifamily building activity, as meas - ured by the number of units permitted, has increased since 2012. From 2003 through 2006, construction activity was strong, averaging 3,475 units per - mitted annually, including 3,900 units permitted during 2006 (Figure 10). Multifamily building decreased to an average of 1,750 units permitted an-nually during 2007 and 2008 because of rising apartment vacancy rates and further declined to an average of 930 units permitted annually from 2009 through 2011 because of a lack of financing options available for multi - family builders. From 2012 through 2014, in response to improving apart-ment market conditions, construction activity increased to an average of 2,475 units permitted annually, includ - ing 3,875 units permitted during 2014. During the 12 months ending July 2015, approximately 3,875 units were permitted, an increase of 330 units, or
9 percent, compared with permitting during the previous 12-month period (preliminary data). Since 2010, less than 1 percent of all multifamily units permitted have been for condominiums, down significantly from 12 percent from 2006 through 2009 (analyst estimate).
Recent apartment construction activ - ity in the Central submarket has been spread throughout the submarket. Recent developments include Metro Rahway, a 116-unit apartment com - munity in Union County that was completed in 2014. Rents for efficiency, one-bedroom, and two-bedroom units in the community start at $1,400, $1,650, and $1,975, respectively. The 361 units at Park Lofts, which was completed in 2014 in Bloomfield, Essex County, has rents for efficiency, one-bedroom, and two-bedroom units starting at $1,700, $1,900, and $2,600, respectively.
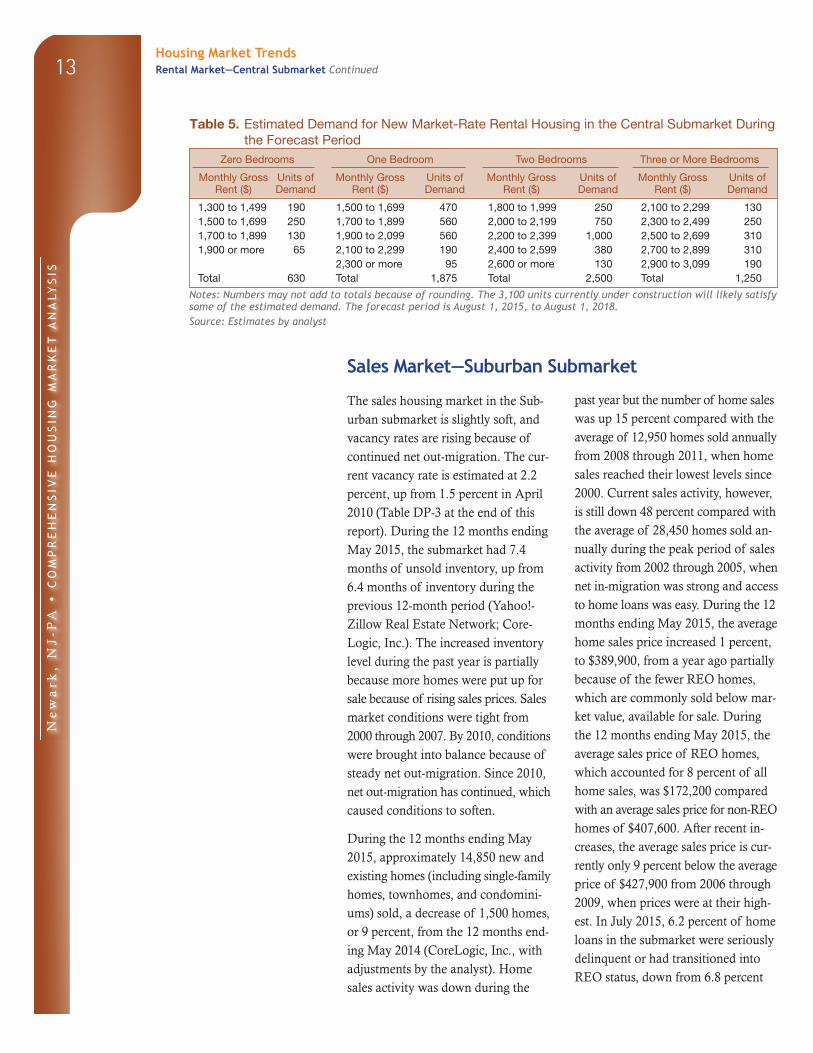
During the 3-year forecast period, demand is expected for 6,250 new market-rate rental units (Table 1). The 3,100 units under construction will satisfy a portion of this demand. Demand is expected to be relatively steady during all 3 years, but new supply should be targeted to come online during the second and third years of the forecast period because the units currently under construction will satisfy all demand during the first year. Table 5 shows the estimated demand, by rent level and number of bedrooms, for new market-rate rental housing in the Central submarket.
Figure 10. Multifamily Units Permitted in the Central Submarket, 2000 to Current
Notes: Excludes townhomes. Current includes data through July 2015.Sources: U.S. Census Bureau, Building Permits Survey; estimates by analyst
Housing Market TrendsRental Market—Central Submarket Continued
2000
2001
2002
2003
2004
2005
2006
4,000
3,500
3,000
2,500
2,000
1,500
1,000
500
0
2008
2009
2010
2011
2013
2015
2014
2012
2007
Ne
wa
rk,
NJ
-PA
• C
OM
PR
EH
EN
SIV
E H
OU
SIN
G M
AR
KE
T A
NA
LYS
IS
13
Table 5. Estimated Demand for New Market-Rate Rental Housing in the Central Submarket During the Forecast Period
Zero Bedrooms One Bedroom Two Bedrooms Three or More Bedrooms
Monthly GrossRent ($)
Units of Demand
Monthly GrossRent ($)
Units of Demand
Monthly Gross Rent ($)
Units of Demand
Monthly Gross Rent ($)
Units of Demand
1,300 to 1,499 190 1,500 to 1,699 470 1,800 to 1,999 250 2,100 to 2,299 1301,500 to 1,699 250 1,700 to 1,899 560 2,000 to 2,199 750 2,300 to 2,499 2501,700 to 1,899 130 1,900 to 2,099 560 2,200 to 2,399 1,000 2,500 to 2,699 3101,900 or more 65 2,100 to 2,299 190 2,400 to 2,599 380 2,700 to 2,899 310
2,300 or more 95 2,600 or more 130 2,900 to 3,099 190Total 630 Total 1,875 Total 2,500 Total 1,250
Notes: Numbers may not add to totals because of rounding. The 3,100 units currently under construction will likely satisfy some of the estimated demand. The forecast period is August 1, 2015, to August 1, 2018.Source: Estimates by analyst
Sales Market—Suburban Submarket
The sales housing market in the Sub - urban submarket is slightly soft, and vacancy rates are rising because of continued net out-migration. The cur - rent vacancy rate is estimated at 2.2 percent, up from 1.5 percent in April 2010 (Table DP-3 at the end of this report). During the 12 months ending May 2015, the submarket had 7.4 months of unsold inventory, up from 6.4 months of inventory during the previous 12-month period (Yahoo!-Zillow Real Estate Network; Core-Logic, Inc.). The increased inventory level during the past year is partially because more homes were put up for sale because of rising sales prices. Sales market conditions were tight from 2000 through 2007. By 2010, conditions were brought into balance because of steady net out-migration. Since 2010, net out-migration has continued, which caused conditions to soften.
During the 12 months ending May 2015, approximately 14,850 new and existing homes (including single-family homes, townhomes, and condomini-ums) sold, a decrease of 1,500 homes, or 9 percent, from the 12 months end - ing May 2014 (CoreLogic, Inc., with adjustments by the analyst). Home sales activity was down during the
past year but the number of home sales was up 15 percent compared with the average of 12,950 homes sold annually from 2008 through 2011, when home sales reached their lowest levels since 2000. Current sales activity, however, is still down 48 percent compared with the average of 28,450 homes sold an - nually during the peak period of sales activity from 2002 through 2005, when net in-migration was strong and access to home loans was easy. During the 12 months ending May 2015, the average home sales price increased 1 percent, to $389,900, from a year ago partially because of the fewer REO homes, which are commonly sold below mar - ket value, available for sale. During the 12 months ending May 2015, the average sales price of REO homes, which accounted for 8 percent of all home sales, was $172,200 compared with an average sales price for non-REO homes of $407,600. After recent in - creases, the average sales price is cur - rently only 9 percent below the average price of $427,900 from 2006 through 2009, when prices were at their high-est. In July 2015, 6.2 percent of home loans in the submarket were seriously delinquent or had transitioned into REO status, down from 6.8 percent
Housing Market TrendsRental Market—Central Submarket Continued

Ne
wa
rk,
NJ
-PA
• C
OM
PR
EH
EN
SIV
E H
OU
SIN
G M
AR
KE
T A
NA
LYS
IS
14
in July 2014 and down from a high of 8.5 percent in March 2013 (Black Knight Financial Services, Inc.).
Single-family homebuilding, as meas - ured by the number of homes permit-ted, has recently increased, but levels remain well below those from early in the 2000s. From 2000 through 2005, construction activity averaged 4,150 homes permitted annually, including 3,900 homes permitted during 2005 (Figure 11). Construction declined by an average of 770 homes permitted annually from 2006 through 2008 and totaled 1,550 homes permitted during 2008. Construction activity further declined to an average of 1,300 homes permitted from 2009 through 2012. The decreases in construction activity resulted from weakened economic conditions during the first 3 years of the period and declining sales activity
caused, in part, by net out-migration. During 2013 and 2014, construction activity slightly increased to an average of 1,650 homes permitted because im - proving economic conditions allowed more people to purchase a home and increasing home sales prices gave more existing homebuyers the option to sell their current home. During the 12 months ending July 2015, approxi-mately 1,600 homes were permitted, a decrease of 100 homes, or 6 percent, from the previous 12-month period (preliminary data).
Unlike in the Central submarket, larger lots of land are available for building in the Suburban submarket, leading to a larger number of new single-family developments. Hillside at Montgomery, a single-family community in Skillman, Somerset County, was completed in 2014. All 89 three- and four-bedroom homes sold and the sales prices ranged from $550,600 to $821,000. Additional construction activity includes Morris Hunt, in Flanders, Morris County. Con - struction at the development started in 2012, and 280 single-family and townhome units are expected after construction is complete during the next 3 to 5 years. Prices of these homes start at over $700,000.
During the next 3 years, demand is expected to be limited because of current slightly soft sales conditions; demand is estimated for 100 new homes (Table 1). The 550 homes under con - struction will more than satisfy all the demand. New home prices in the submarket are expected to start at $225,000, and more than one-half of the demand is expected to be for homes priced between $400,000 and $799,000 (Table 6).
Figure 11. Single-Family Homes Permitted in the Suburban Submarket, 2000 to Current
Notes: Includes townhomes. Current includes data through July 2015.Sources: U.S. Census Bureau, Building Permits Survey; estimates by analyst
Table 6. Estimated Demand for New Market-Rate Sales Housing in the Suburban Submarket During the Forecast Period
Price Range ($) Units of PercentFrom To Demand of Total
225,000 399,999 20 20.0400,000 599,999 30 30.0600,000 799,999 25 25.0800,000 999,999 15 15.0
1,000,000 and higher 10 10.0
Notes: The 550 homes currently under construction and a portion of the estimated 34,000 other vacant units in the sub market will likely satisfy some of the forecast demand. The forecast period is August 1, 2015, to August 1, 2018.Source: Estimates by analyst
Housing Market TrendsSales Market—Suburban Submarket Continued
2000
2001
2002
2003
2004
2005
2006
6,000
5,000
4,000
3,000
2,000
1,000
0
2008
2009
2010
2011
2013
2015
2014
2012
2007

Ne
wa
rk,
NJ
-PA
• C
OM
PR
EH
EN
SIV
E H
OU
SIN
G M
AR
KE
T A
NA
LYS
IS
15
Rental Market—Suburban Submarket
The rental housing market, including apartment units and single-family homes for rent, in the Suburban sub - market is currently slightly soft. The overall rental vacancy rate is 7.0 per - cent, up from 6.7 percent in 2010 (Figure 12). Rental market conditions were tight from 2000 through 2004. Conditions were brought into balance from 2005 through 2007 because of active apartment construction activity during 2005 and 2006. Conditions have softened since the end of 2007, however, because of net out-migration.
Similar to the Central submarket, multi - family building activity, as measured by the number of units permitted, in the Suburban submarket has been active since 2012 after activity was limited from 2009 through 2011. Con - struction activity was strong from 2002 through 2006, when an average of
1,525 units were permitted annually (Figure 13). Multifamily building activ - ity started to slow in 2007, partially because fewer millennials were moving into the submarket. During 2007 and 2008, an average of 970 units were permitted annually. Construction ac - tivity further slowed to an average of 530 units permitted annually from 2009 through 2011 because of poor economic conditions and tightening borrowing standards for builders. In response to improving economic con - ditions and more funds becoming avail - able for builders, multifamily building activity increased to an average of 1,650 units permitted annually from 2012 through 2014. During the 12 months ending July 2015, approxi-mately 2,750 units were permitted, an increase of 1,175 units, or 75 percent, compared with permitting during the previous 12-month period (prelimi-nary data). Since 2011, approximately 3 percent of all multifamily units per - mitted have been for condominiums, down significantly from 40 percent from 2006 through 2010 (analyst estimate).
Recent construction activity has been mostly concentrated in Morris and Somerset Counties, where slight net in-migration has continued in recent years. The 247-unit Avalon Apartments, which is in Wharton, Morris County, was completed in early 2015. Rents for efficiency, one-bedroom, two-bedroom, and three-bedroom units start at $1,550, $1,800, $2,325, and $2,375, respectively. Modera 44 Apartments, a 268-unit apartment community in Morristown, Morris County, was completed in late 2014 and has rents for efficiency, one- bedroom, and two-bedroom units starting at $1,875, $2,025, and $2,775, respectively. Construction activity in
Figure 12. Rental Vacancy Rates in the Suburban Submarket, 2000 to Current
Note: The current date is August 1, 2015.Sources: 2000 and 2010—2000 Census and 2010 Census; current—estimates by analyst
Figure 13. Multifamily Units Permitted in the Suburban Submarket, 2000 to Current
Notes: Excludes townhomes. Current includes data through July 2015.Sources: U.S. Census Bureau, Building Permits Survey; estimates by analyst
Housing Market TrendsSuburban Submarket Continued
2000 Current2010
3.3
7.06.77.0
6.0
5.0
4.0
3.0
2.0
1.0
0.0
2000
2001
2002
2003
2004
2005
2006
2,500
2,000
1,500
1,000
500
0
2008
2009
2010
2011
2013
2015
2014
2012
2007
Ne
wa
rk,
NJ
-PA
• C
OM
PR
EH
EN
SIV
E H
OU
SIN
G M
AR
KE
T A
NA
LYS
IS
16
Somerset County includes the 363 units at Stone Bridge at Raritan, which was completed in 2013. The community includes affordable and market-rate two- and three-bedroom units, with prices of the market-rate units starting at $1,900. Units under construction include 117 units at The Cobalt Apart - ments, in Somerville, Somerset County. Construction is expected to be complete during 2016.
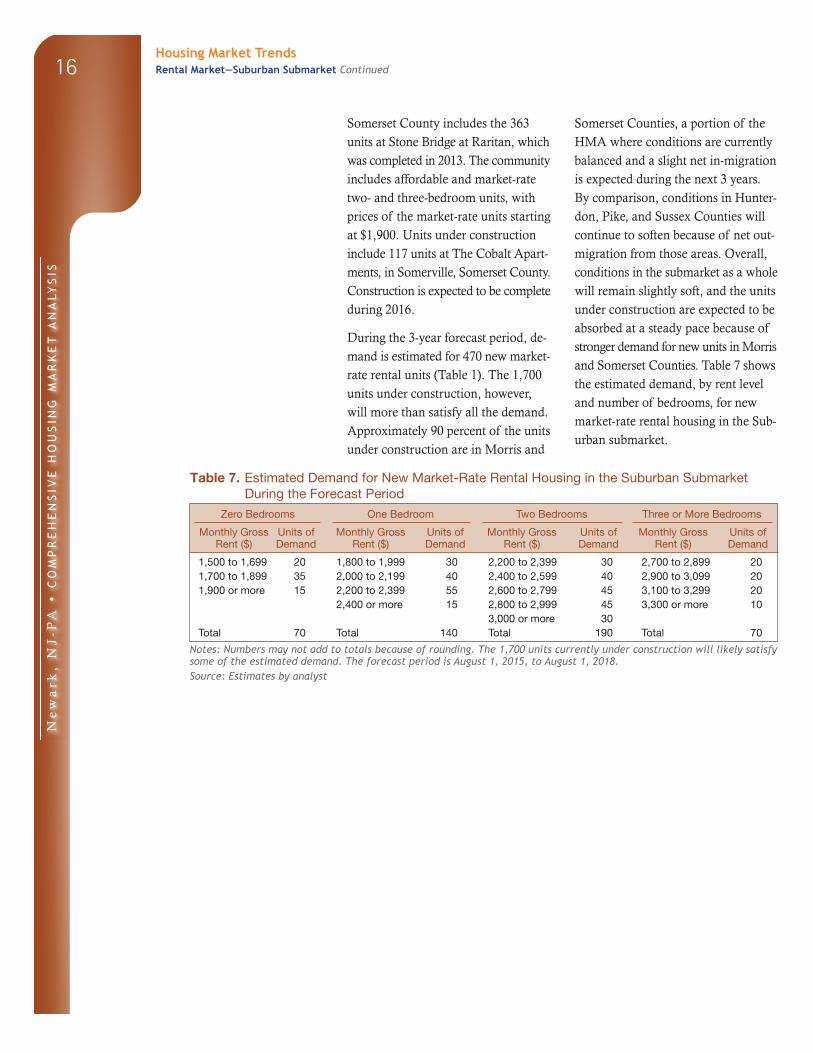
During the 3-year forecast period, de - mand is estimated for 470 new market- rate rental units (Table 1). The 1,700 units under construction, however, will more than satisfy all the demand. Approximately 90 percent of the units under construction are in Morris and
Somerset Counties, a portion of the HMA where conditions are currently balanced and a slight net in-migration is expected during the next 3 years. By comparison, conditions in Hunter - don, Pike, and Sussex Counties will continue to soften because of net out- migration from those areas. Overall, conditions in the submarket as a whole will remain slightly soft, and the units under construction are expected to be absorbed at a steady pace because of stronger demand for new units in Morris and Somerset Counties. Table 7 shows the estimated demand, by rent level and number of bedrooms, for new market-rate rental housing in the Sub - urban submarket.
Table 7. Estimated Demand for New Market-Rate Rental Housing in the Suburban Submarket During the Forecast Period
Zero Bedrooms One Bedroom Two Bedrooms Three or More Bedrooms
Monthly GrossRent ($)
Units of Demand
Monthly GrossRent ($)
Units of Demand
Monthly Gross Rent ($)
Units of Demand
Monthly Gross Rent ($)
Units of Demand
1,500 to 1,699 20 1,800 to 1,999 30 2,200 to 2,399 30 2,700 to 2,899 201,700 to 1,899 35 2,000 to 2,199 40 2,400 to 2,599 40 2,900 to 3,099 201,900 or more 15 2,200 to 2,399 55 2,600 to 2,799 45 3,100 to 3,299 20
2,400 or more 15 2,800 to 2,999 45 3,300 or more 103,000 or more 30
Total 70 Total 140 Total 190 Total 70
Notes: Numbers may not add to totals because of rounding. The 1,700 units currently under construction will likely satisfy some of the estimated demand. The forecast period is August 1, 2015, to August 1, 2018.Source: Estimates by analyst
Housing Market TrendsRental Market—Suburban Submarket Continued

Ne
wa
rk,
NJ
-PA
• C
OM
PR
EH
EN
SIV
E H
OU
SIN
G M
AR
KE
T A
NA
LYS
IS
17Data Profiles
Table DP-1. Newark HMA Data Profile, 2000 to Current
Average Annual Change (%)
2000 2010 Current 2000 to 2010 2010 to Current
Total resident employment 1,181,814 1,161,639 1,191,000 – 0.2 0.5
Unemployment rate 3.5% 9.1% 6.1%
Nonfarm payroll jobs 1,204,900 1,151,300 1,188,000 – 0.5 0.7
Total population 2,396,333 2,471,171 2,518,000 0.3 0.4
Total households 860,497 893,969 909,700 0.4 0.3
Owner households 550,638 571,482 567,600 0.4 – 0.1
Percent owner 64.0% 63.9% 62.4%
Renter households 309,859 322,487 342,100 0.4 1.1
Percent renter 36.0% 36.1% 37.6%
Total housing units 916,599 975,306 993,600 0.6 0.3
Owner vacancy rate 1.0% 1.8% 2.0%
Rental vacancy rate 4.1% 8.0% 6.9%
Median Family Income $67,900 $87,600 $89,100 2.6 0.4
Notes: Numbers may not add to totals because of rounding. Employment data represent annual averages for 2000, 2010, and the 12 months through July 2015. Median Family Incomes are for 1999, 2009, and 2013. The current date is August 1, 2015.Sources: U.S. Census Bureau; U.S. Department of Housing and Urban Development; estimates by analyst
Table DP-2. Central Submarket Data Profile, 2000 to Current
Average Annual Change (%)
2000 2010 Current 2000 to 2010 2010 to Current
Total population 1,316,174 1,320,468 1,357,000 0.0 0.5
Total households 469,860 471,830 483,600 0.0 0.5
Owner households 244,085 241,189 239,700 – 0.1 – 0.1
Percent owner 51.9% 51.1% 49.6%
Rental households 225,775 230,641 243,900 0.2 1.1
Percent renter 48.1% 48.9% 50.4%
Total housing units 493,956 512,443 518,800 0.4 0.2
Owner vacancy rate 1.0% 2.2% 1.7%
Rental vacancy rate 4.3% 8.5% 6.8%
Notes: Numbers may not add to totals because of rounding. The current date is August 1, 2015.
Sources: U.S. Census Bureau; U.S. Department of Housing and Urban Development; estimates by analyst
Table DP-3. Suburban Submarket Data Profile, 2000 to Current
Average Annual Change (%)
2000 2010 Current 2000 to 2010 2010 to Current
Total population 1,080,159 1,150,703 1,161,000 0.6 0.2
Total households 390,637 422,139 426,000 0.8 0.2
Owner households 306,553 330,293 327,800 0.7 – 0.1
Percent owner 78.5 78.2 76.9
Rental households 84,084 91,846 98,200 0.9 1.3
Percent renter 21.5 21.8 23.1
Total housing units 422,643 462,863 474,800 0.9 0.5
Owner vacancy rate 0.9 1.5 2.2
Rental vacancy rate 3.3 6.7 7.0
Notes: Numbers may not add to totals because of rounding. The current date is August 1, 2015.
Sources: U.S. Census Bureau; U.S. Department of Housing and Urban Development; estimates by analyst

Ne
wa
rk,
NJ
-PA
• C
OM
PR
EH
EN
SIV
E H
OU
SIN
G M
AR
KE
T A
NA
LYS
IS
18
Data Definitions and Sources
2000: 4/1/2000—U.S. Decennial Census
2010: 4/1/2010—U.S. Decennial Census
Current date: 8/1/2015—Analyst’s estimates
Forecast period: 8/1/2015–8/1/2018—Analyst’s
estimates
The metropolitan division and metropolitan
statistical area definitions in this report are based
on the delineations established by the Office of
Management and Budget (OMB) in the OMB
Bulletin dated February 28, 2013.
Demand: The demand estimates in the analysis
are not a forecast of building activity. They are
the estimates of the total housing production
needed to achieve a balanced market at the end
of the 3-year forecast period given conditions on
the as-of date of the analysis, growth, losses, and
excess vacancies. The estimates do not account
for units currently under construction or units in
the development pipeline.
Other Vacant Units: In the U.S. Department of
Housing and Urban Development’s (HUD’s)
analysis, other vacant units include all vacant
units that are not available for sale or for rent.
The term therefore includes units rented or sold
but not occupied; held for seasonal, recreational,
or occasional use; used by migrant workers; and
the category specified as “other” vacant by the
Census Bureau.
Building Permits: Building permits do not neces-
sarily reflect all residential building activity that
occurs in an HMA. Some units are constructed
or created without a building permit or are issued
a different type of building permit. For example,
some units classified as commercial structures are
not reflected in the residential building permits.
As a result, the analyst, through diligent fieldwork, makes
an estimate of this additional construction activity. Some
of these estimates are included in the discussions of
single-family and multifamily building permits.
For additional data pertaining to the housing market
for this HMA, go to huduser.gov/publications/pdf/
CMARtables_NewarkNJ-PA_15.pdf.
Contact Information
Joseph Shinn, Economist
Philadelphia HUD Regional Office
215–430–6683
This analysis has been prepared for the assistance and
guidance of HUD in its operations. The factual informa-
tion, findings, and conclusions may also be useful to
builders, mortgagees, and others concerned with local
housing market conditions and trends. The analysis
does not purport to make determinations regarding the
acceptability of any mortgage insurance proposals that
may be under consideration by the Department.
The factual framework for this analysis follows the
guidelines and methods developed by HUD’s Economic
and Market Analysis Division. The analysis and findings
are as thorough and current as possible based on informa -
tion available on the as-of date from local and national
sources. As such, findings or conclusions may be modi-
fied by subsequent developments. HUD expresses its
appreciation to those industry sources and state and local
government officials who provided data and information
on local economic and housing market conditions.
For additional reports on other market areas, please go to huduser.gov/portal/ushmc/chma_archive.html.