comprehensive housing market analysis, albany, new york · comprehensive housing market analysis...
TRANSCRIPT

C O M P R E H E N S I V E H O U S I N G M A R K E T A N A L Y S I S
Albany, New YorkU.S. Department of Housing and Urban Development Office of Policy Development and Research As of July 1, 2014
Fulton
Hamilton
Greene
Warren
Washington
Columbia
Ber
kshi
re
Montgomery
Delaware
Ots
ego
Ben
ning
ton
Rut
land
New
Yor
kV
erm
ont
Mas
sach
uset
ts
Saratoga
AlbanySchoharie
Rensselaer
Schenectady
Housing Market AreaThe Albany Housing Market Area (HMA), which is coterminous with the Albany-Schenectady-Troy, NY Metropolitan Statistical Area, comprises five counties in eastern Upstate New York. For pur-poses of this analysis, the HMA is divided into three submarkets: the Albany County submarket, home to the city of Albany, the state capital; the Saratoga County submarket, the second fastest growing county in Upstate New York; and the Mohawk River submarket, which includes Rens-selaer, Schenectady, and Schoharie Counties.
SummaryEconomy The economy of the Albany HMA expanded more than 1 percent an - nually during 2012 and 2013, but the expansion slowed slightly during the first half of 2014. During the 12 months ending June 2014, nonfarm payrolls increased by 2,000 jobs, or 0.4 percent, led by gains in the edu - cation and health services and the goods-producing sectors. Job growth is expected to increase to 3,125 jobs, or 0.7 percent, annually during the
next 3 years, with the strongest job gains expected in the manufacturing and the leisure and hospitality sectors.
Sales MarketSales housing market conditions in the HMA are slightly soft, with an estimated 1.6-percent vacancy rate, down slightly from 1.7 percent in 2010. During the next 3 years, de - mand is expected for 3,180 new homes (Table 1), with one-half of the demand expected in the Saratoga County sub - market. The 740 homes under con - struction in the HMA and a portion of the 25,400 other vacant units that may reenter the market will satisfy some of the forecast demand.
Rental MarketThe overall rental housing market in the HMA is balanced, with an esti - mated vacancy rate of 7.1 percent. Even with robust multifamily con - struction activity since 2010, the apartment market is slightly tight, with a vacancy rate of 3.8 percent. During the next 3 years, demand is expected for 2,690 new market-rate rental units (Table 1). The 1,450 apartments currently under construc-tion in the HMA will satisfy more than one-half of the forecast demand.
Market DetailsEconomic Conditions ......................... 2
Population and Households ............... 5
Housing Market Trends ...................... 7
Data Profiles ..................................... 17

Alb
an
y,
NY
• C
OM
PR
EH
EN
SIV
E H
OU
SIN
G M
AR
KE
T A
NA
LYS
IS
2
Table 1. Housing Demand in the Albany HMA During the Forecast Period
Albany HMAAlbany County
SubmarketSaratoga County
SubmarketMohawk River
Submarket
SalesUnits
RentalUnits
SalesUnits
RentalUnits
SalesUnits
RentalUnits
SalesUnits
RentalUnits
Total demand 3,180 2,690 880 980 1,500 1,050 800 660
Under construction 740 1,450 250 500 360 410 130 540
Notes: Total demand represents estimated production necessary to achieve a balanced market at the end of the forecast period. Units under construction as of July 1, 2014. A portion of the estimated 25,400 other vacant units in the HMA will likely satisfy some of the forecast demand. The forecast period is July 1, 2014, to July 1, 2017.Source: Estimates by analyst
Economic Conditions
The Albany HMA is part of a 19-county region known as
Tech Valley because of its growing high-technology economy. Economic conditions in the HMA improved dur-ing the past 3 years, with an increase in jobs and a decline in unemploy-ment. The significant growth in jobs related to manufacturing, educational institutions, and healthcare providers defines the economic recovery currently under way in the HMA and illustrates how nonfarm payrolls in the HMA have changed since 2000 with the recent growth in high-technology jobs.
Since 2000, the HMA economy has experienced two contraction cycles and three periods of expansion. Total non - farm payrolls increased by 3,900 jobs,
or 0.9 percent, from the end of 2000 through 2001, the final year of a period of growth that began in 1997. Payrolls declined, however, by an average of 1,300 jobs, or 0.6 percent, annually during 2002 and 2003. Significant losses in the manufacturing sector occurred during this period, including the clo - sures of Garden Way Inc., a lawn-tool maker in the city of Troy, and Guilford Mills, Inc., a textile manufacturer in Schoharie County, each of which employed at least 500 workers. Job growth resumed in 2004 and continued through 2008, with the average annual addition of 2,700 jobs, a 0.6-percent increase. The professional and business services and the education and health services sectors led job growth during this expansion. The effects of the na - tional recession, which began in 2007, reduced the number of jobs in the HMA by an average of 7,300, or 1.6 percent, annually during 2009 and 2010 and raised the average unemployment rate to more than 7.0 percent. By compari-son, the unemployment rate averaged 4.1 percent from 2000 through 2008 (Figure 1). Job declines during 2009 and 2010 occurred in nearly every
Summary Continued
Figure 1. Trends in Labor Force, Resident Employment, and Unemploy-ment Rate in the Albany HMA, 2000 Through 2013
Source: U.S. Bureau of Labor Statistics
Une
mpl
oym
ent r
ate
Labo
r fo
rce
and
resi
dent
em
ploy
men
t 485,000
465,000
445,000
425,000
405,000
385,000
365,000
2000
2002
2004
Labor force Resident employment Unemployment rate
10.0
8.0
6.0
4.0
2.0
0.0
2006
2001
2003
2005
2007
2009
2010
2008
2012
2013
2011
Alb
an
y,
NY
• C
OM
PR
EH
EN
SIV
E H
OU
SIN
G M
AR
KE
T A
NA
LYS
IS
3
sector, with the most significant losses occurring in the professional and business services sector and the retail trade and state government subsectors. The third and current period of job growth occurred from the end of 2010 through the current 12 months, when job growth averaged 0.8 percent an - nually (Table DP-1 at the end of the report). Goods-producing sectors have contributed 47 percent of total job growth since the end of 2010 com - pared with only 2 percent from 2004 through 2008.
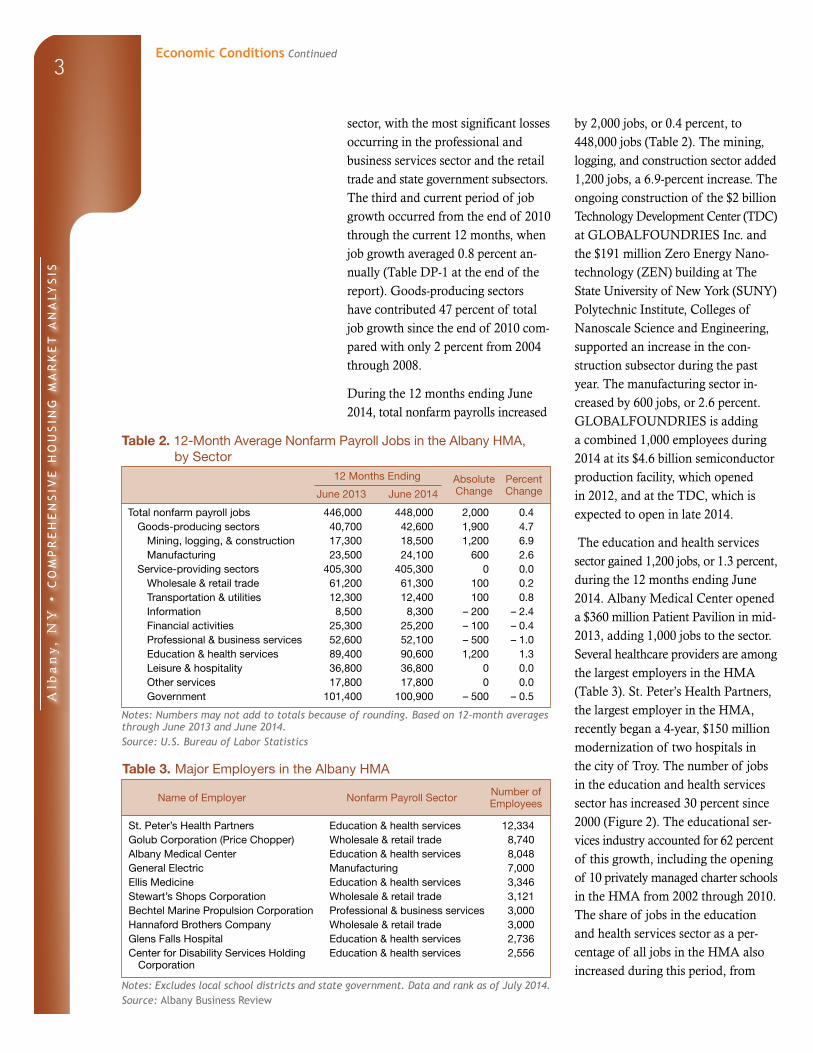
During the 12 months ending June 2014, total nonfarm payrolls increased
by 2,000 jobs, or 0.4 percent, to 448,000 jobs (Table 2). The mining, logging, and construction sector added 1,200 jobs, a 6.9-percent increase. The ongoing construction of the $2 billion Technology Development Center (TDC) at GLOBALFOUNDRIES Inc. and the $191 million Zero Energy Nano - technology (ZEN) building at The State University of New York (SUNY) Polytechnic Institute, Colleges of Nano scale Science and Engineering, supported an increase in the con-struction subsector during the past year. The manufacturing sector in - creased by 600 jobs, or 2.6 percent. GLOBALFOUNDRIES is adding a combined 1,000 employees during 2014 at its $4.6 billion semiconductor production facility, which opened in 2012, and at the TDC, which is expected to open in late 2014.
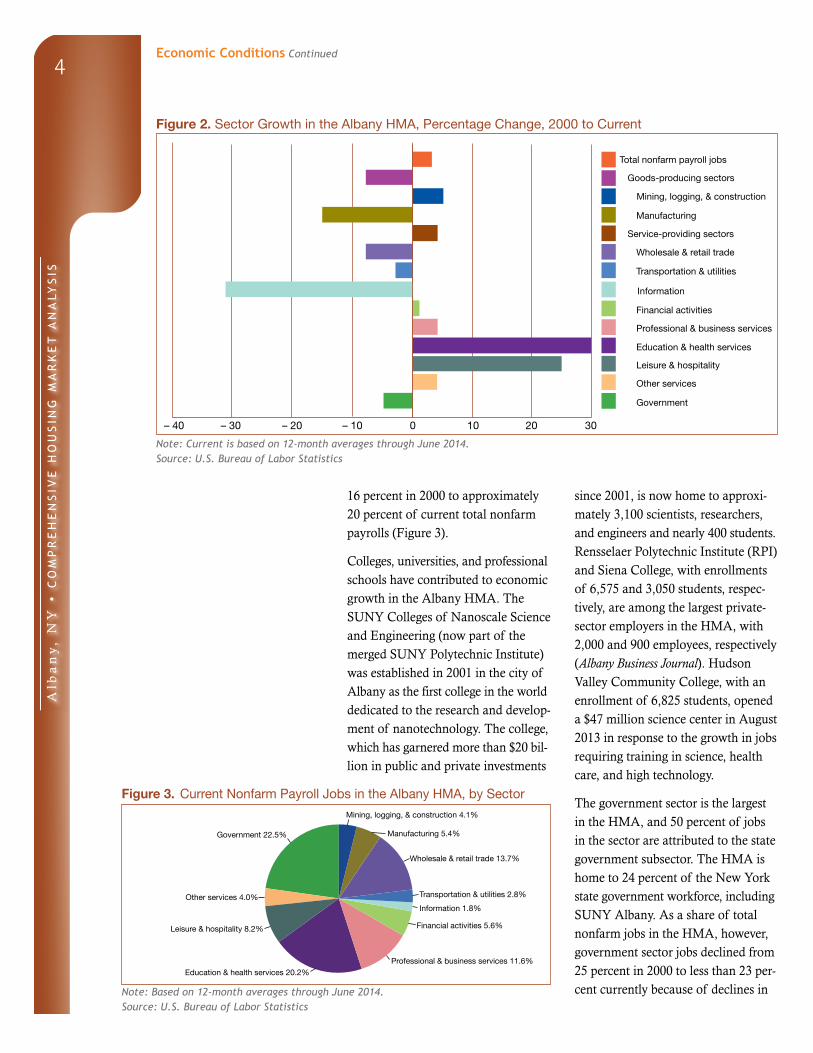
The education and health services sector gained 1,200 jobs, or 1.3 percent, during the 12 months ending June 2014. Albany Medical Center opened a $360 million Patient Pavilion in mid- 2013, adding 1,000 jobs to the sector. Several healthcare providers are among the largest employers in the HMA (Table 3). St. Peter’s Health Partners, the largest employer in the HMA, recently began a 4-year, $150 million modernization of two hospitals in the city of Troy. The number of jobs in the education and health services sector has increased 30 percent since 2000 (Figure 2). The educational ser - vices industry accounted for 62 percent of this growth, including the opening of 10 privately managed charter schools in the HMA from 2002 through 2010. The share of jobs in the education and health services sector as a per-centage of all jobs in the HMA also increased during this period, from
Table 2. 12-Month Average Nonfarm Payroll Jobs in the Albany HMA, by Sector
12 Months Ending Absolute Change
Percent ChangeJune 2013 June 2014
Total nonfarm payroll jobs 446,000 448,000 2,000 0.4Goods-producing sectors 40,700 42,600 1,900 4.7
Mining, logging, & construction 17,300 18,500 1,200 6.9Manufacturing 23,500 24,100 600 2.6
Service-providing sectors 405,300 405,300 0 0.0Wholesale & retail trade 61,200 61,300 100 0.2Transportation & utilities 12,300 12,400 100 0.8Information 8,500 8,300 – 200 – 2.4Financial activities 25,300 25,200 – 100 – 0.4Professional & business services 52,600 52,100 – 500 – 1.0Education & health services 89,400 90,600 1,200 1.3Leisure & hospitality 36,800 36,800 0 0.0Other services 17,800 17,800 0 0.0Government 101,400 100,900 – 500 – 0.5
Notes: Numbers may not add to totals because of rounding. Based on 12-month averages through June 2013 and June 2014.Source: U.S. Bureau of Labor Statistics
Table 3. Major Employers in the Albany HMA
Name of Employer Nonfarm Payroll Sector Number of Employees
St. Peter’s Health Partners Education & health services 12,334Golub Corporation (Price Chopper) Wholesale & retail trade 8,740Albany Medical Center Education & health services 8,048General Electric Manufacturing 7,000Ellis Medicine Education & health services 3,346Stewart’s Shops Corporation Wholesale & retail trade 3,121Bechtel Marine Propulsion Corporation Professional & business services 3,000Hannaford Brothers Company Wholesale & retail trade 3,000Glens Falls Hospital Education & health services 2,736Center for Disability Services Holding
CorporationEducation & health services 2,556
Notes: Excludes local school districts and state government. Data and rank as of July 2014.Source: Albany Business Review
Economic Conditions Continued
Alb
an
y,
NY
• C
OM
PR
EH
EN
SIV
E H
OU
SIN
G M
AR
KE
T A
NA
LYS
IS
4
Figure 2. Sector Growth in the Albany HMA, Percentage Change, 2000 to Current
Note: Current is based on 12-month averages through June 2014.Source: U.S. Bureau of Labor Statistics
16 percent in 2000 to approximately 20 percent of current total nonfarm payrolls (Figure 3).
Colleges, universities, and professional schools have contributed to economic growth in the Albany HMA. The SUNY Colleges of Nanoscale Science and Engineering (now part of the merged SUNY Polytechnic Institute) was established in 2001 in the city of Albany as the first college in the world dedicated to the research and develop - ment of nanotechnology. The college, which has garnered more than $20 bil - lion in public and private investments
since 2001, is now home to approxi-mately 3,100 scientists, researchers, and engineers and nearly 400 students. Rensselaer Polytechnic Institute (RPI) and Siena College, with enrollments of 6,575 and 3,050 students, respec-tively, are among the largest private-sector employers in the HMA, with 2,000 and 900 employees, respectively (Albany Business Journal). Hudson Valley Community College, with an enrollment of 6,825 students, opened a $47 million science center in August 2013 in response to the growth in jobs requiring training in science, health care, and high technology.
The government sector is the largest in the HMA, and 50 percent of jobs in the sector are attributed to the state government subsector. The HMA is home to 24 percent of the New York state government workforce, including SUNY Albany. As a share of total nonfarm jobs in the HMA, however, government sector jobs declined from 25 percent in 2000 to less than 23 per - cent currently because of declines in
Figure 3. Current Nonfarm Payroll Jobs in the Albany HMA, by Sector
Note: Based on 12-month averages through June 2014.Source: U.S. Bureau of Labor Statistics
Economic Conditions Continued
Government 22.5%
Other services 4.0%
Leisure & hospitality 8.2%
Education & health services 20.2%Professional & business services 11.6%
Wholesale & retail trade 13.7%
Manufacturing 5.4%
Mining, logging, & construction 4.1%
Transportation & utilities 2.8%
Financial activities 5.6%
Information 1.8%
Total nonfarm payroll jobs
Goods-producing sectors
Mining, logging, & construction
Manufacturing
Service-providing sectors
Wholesale & retail trade
Information
Financial activities
Professional & business services
Education & health services
Government
Other services
Leisure & hospitality
Transportation & utilities
0– 20– 40 – 30 3010 20– 10

Alb
an
y,
NY
• C
OM
PR
EH
EN
SIV
E H
OU
SIN
G M
AR
KE
T A
NA
LYS
IS
5
the local, state, and federal government subsectors. Mount McGregor Correc - tional Facility, a medium-security prison in Saratoga County, is expected to close in July 2014 because of a statewide decline in inmate populations. The closure will result in the loss of 320 jobs in the state government subsector.
The presence of large, research-intensive employers in the HMA, including General Electric and RPI, along with public and private investment, has attracted and engendered the growth of high-technology companies in the Albany HMA. Quirky, an inventor-assistance company based in New York City and a partner with General Electric, opened a quality assurance lab in the city of Schenectady in May 2014, adding 180 jobs to the profes-sional and business services sector. Apprenda Inc., a software developer founded in 2006 in Saratoga County, is in the process of adding 150 workers and relocating closer to RPI, from where it hires many of its workers (Albany Business Journal). The number of high- technology workers in the HMA, whose salaries are 50 to 130 percent higher than the median salary for all occupations, was estimated at approx - imately 17,300 as of May 2013. High-technology job growth is stimulating
new luxury apartment development in more urbanized areas of the HMA, including the cities of Saratoga Springs, Schenectady, and Troy.
During the next 3 years, nonfarm payroll growth is expected to average 3,125 jobs, or 0.7 percent, annually. The greatest gains are expected in the manufacturing and the leisure and hos - pitality sectors. The ZEN building is expected to add 1,500 high-technology jobs to the manufacturing sector when complete in the fall of 2015. In the lei - sure and hospitality sector, the second highest growth sector in the HMA since 2000, the completion of at least eight hotels throughout the HMA and a convention center in the city of Albany by the end of 2016 is expected to add hundreds of jobs. In addition, the New York State Gaming Commission is expected to issue licenses for four new destination gaming resorts in Upstate New York in the fall of 2014, at least one of which may be awarded to and eventually developed in the HMA. The potential siting, construction, and operation of a casino gaming facility in the HMA is estimated to create 1,700 construction subsector jobs and 740 leisure and hospitality sector jobs by 2017 (New York State Gaming Commission).
Population and Households
The population of the Albany HMA was an estimated 879,800
as of July 1, 2014. Since 2010, popula - tion growth has averaged 2,125 people, or 0.2 percent, annually. During the 2000s, the greatest population gains occurred from 2000 through 2006, at an average of 5,500 people, or
0.7 percent, annually resulting from overall economic expansion from 1997 through 2006 and relatively high levels of homebuilding activity in the early 2000s. From 2006 to 2010, job declines in the HMA halved annual population growth to an average of 2,750 people, or 0.3 percent. With
Economic Conditions Continued

Alb
an
y,
NY
• C
OM
PR
EH
EN
SIV
E H
OU
SIN
G M
AR
KE
T A
NA
LYS
IS
6
expectations for a modest acceleration in job growth, population growth is expected to increase to 2,675 people, or 0.3 percent, annually during the next 3 years (Figure 4).
Net in-migration accounted for 60 percent of the 44,850 people added to the population from 2000 to 2010. Approximately 50 percent of migra-tion into the HMA was from other counties in New York, especially from counties surrounding New York City to the south (U.S. Census Bureau esti - mates). Movement from other U.S. states, led by Massachusetts, Florida, and New Jersey, accounted for another 40 percent. In-migration from outside of the United States accounted for the remaining 10 percent, although
residents born abroad account for only about 7 percent of the popula-tion of the HMA. The growth in high-technology and healthcare jobs attracted an increased number of workers from abroad.
Since 2010, net in-migration has aver-aged 625 people annually, accounting for 30 percent of population growth in the HMA. Despite the growth in jobs since 2010, the economy has not yet regained the total number of jobs lost from the effects of the national recession. Analysts estimate that resi-dents of the HMA, rather than people moving into the HMA, filled most of the jobs created during the current expansion. In addition, a decline in higher education enrollment since 2010 has further restrained in-migration. In the fall of 2000, 44,550 full-time students attended the 26 colleges and universities in the HMA. Enrollment increased to 57,400 by the fall of 2010 but declined to 54,750 as of the fall of 2013 (New York State Education Department). With the decrease in net in-migration, net natural change (resident births minus resident deaths) has represented 70 percent of popu -lation growth since 2010 (Figure 5) compared with 40 percent during the 2000s. Net natural change has declined from an average of 1,800 people an - nually from 2000 to 2010 to 1,500 people annually since 2010 because of a fall in the number of births. During the 3-year forecast period, net natural change is expected to decline further, to an average of 1,450 people annually, accounting for approximately 55 percent of the forecast population growth.
In the Albany County submarket, the population increased by an average of 960, or 0.3 percent, annually from 2000 to 2010. Growth has remained
Figure 4. Population and Household Growth in the Albany HMA, 2000 to Forecast
Notes: The current date is July 1, 2014. The forecast date is July 1, 2017.Sources: 2000 and 2010—2000 Census and 2010 Census; current and forecast—estimates by analyst
Figure 5. Components of Population Change in the Albany HMA, 2000 to Forecast
Notes: The current date is July 1, 2014. The forecast date is July 1, 2017.Sources: 2000 and 2010—2000 Census and 2010 Census; current and forecast—estimates by analyst
Population and Households Continued
Net natural change Net migration
2000 to 2010 2010 to current Current to forecast
Ave
rage
ann
ual c
hang
e
3,000
2,500
2,000
1,500
1,000
500
0
4,500
4,000
3,500
3,000
2,500
2,000
1,500
1,000
500
0
Population Households
2000 to 2010 2010 to current Current to forecast
Ave
rage
ann
ual c
hang
e

Alb
an
y,
NY
• C
OM
PR
EH
EN
SIV
E H
OU
SIN
G M
AR
KE
T A
NA
LYS
IS
7
somewhat consistent at an average gain of 800, or 0.3 percent, since 2010, partially because of job growth of more than 1 percent in the submarket during 2012 and 2013. The population of the Saratoga County submarket increased the most of all submarkets in the Albany HMA, by an average of 1,900, or 0.9 percent, annually from 2000 to 2010. Saratoga County is also one of the fastest growing counties in Upstate New York because of relatively lower property tax rates and strong job growth. Since 2010, population growth in the submarket has remained the highest in the HMA but has declined to an average of 1,250 people, or 0.6 percent, partially because of fewer births and reduced net in-migration. Population growth in the Mohawk River submarket averaged 1,625 people, or 0.5 percent, annually from 2000 to 2010 but has declined to an only slight increase since 2010. A decline in jobs in the submar-ket overall since 2010 has contributed to the fall in population growth, as did population loss in Schoharie County after Hurricane Irene damaged more than 1,100 homes in the county in 2011. During the next 3 years, the populations
of the Albany County and Saratoga County submarkets are expected to increase at rates similar to the rates that have occurred since 2010. In the Mohawk River submarket, the popu - lation is expected to increase by an average of 700, or 0.2 percent, annu - ally, or about 45 percent of the average annual growth recorded during the 2000s.
Since 2010, 1,075 new households have formed in the HMA each year. During the 2000s, household growth averaged 2,500, or 0.7 percent, annu - ally, and owner households constituted 64 percent of new households. Since 2010, one-half of new households have been renter households, resulting in a shift in residential construction activity toward multifamily rental units. In addition, renter household income gains (1.5 percent) were greater than the growth in owner household in - comes (1.0 percent) from 2009 to 2013, leading to rent growth but only modest increases in home prices. During the next 3 years, 1,475 new households are expected to form in the HMA each year, for an annual increase of 0.4 percent.
Housing Market Trends
Sales Market—Albany County Submarket
The sales housing market in the Al-bany County submarket is balanced. Increasing home sales and limited homebuilding activity during 2012 and 2013 resulted in a decrease in the estimated sales vacancy rate from 1.6 percent in 2010 to 1.3 percent currently (Table DP-2 at the end of the report). A 7-month supply of homes was avail - able for sale as of June 2014, down
from a nearly 8-month supply a year earlier (Greater Capital Association of Realtors®).
During the 12 months ending June 2014, sales of new and existing single-family homes, townhomes, and condominiums totaled 3,500, up 9 percent from the previous 12 months (CoreLogic, Inc.). Total home sales
Population and Households Continued

Alb
an
y,
NY
• C
OM
PR
EH
EN
SIV
E H
OU
SIN
G M
AR
KE
T A
NA
LYS
IS
8
peaked in 2004, at 5,350 homes, but declined an average of 9 percent, or by 370 homes, annually from 2005 through 2011. Coincident with improving eco - nomic conditions in the Albany HMA, sales in the submarket increased an average of 11 percent, or 310 homes, annually during 2012 and 2013. The average existing home sales price rose from 2000 through 2007 by an aver-age of 8 percent annually, reaching $201,400, but was mostly unchanged from 2008 through 2013. During the 12 months ending June 2014, the aver - age price for an existing home sold in the submarket was $202,900, down 2 percent from the average price dur - ing the previous 12 months.
Increases in the sale of REO (Real Estate Owned) homes and the number of distressed mortgages have limited home price appreciation since 2007. Sales of foreclosed homes rose from an average of 2 percent of existing homes sold annually from 2000 through 2007 to as much as 8 percent of exist - ing homes sold from 2008 through 2013. The average price for an REO home was 40 to 60 percent less than the average existing home sales price. In addition, 8.2 percent of the home loans in the submarket were 90 or more days delinquent, were in foreclosure, or transitioned into REO status as of June 2014, down from 8.4 percent
a year earlier (Black Knight Financial Services, Inc.) and compared with 3.1 percent in June 2008. By comparison, the percentage of distressed mortgages was less in both New York and the na - tion, at 7.8 and 4.9 percent, respectively.
The average sales price for a new home in the submarket rose only slightly, from $362,600 during 2008 to $370,200 dur - ing 2013, but increased 12 percent, to $379,400, during the 12 months ending June 2014 compared with the average during the previous 12 months. The rise in sales prices coincided with in - creased homebuilding activity in the submarket. Permitting of new single- family homes increased in 2012 and 2013 by an average of 80 homes, or 35 percent, to 340 homes permitted during 2013. This increase, which ended a decline in homebuilding ac -tivity that lasted from 2005 through 2011 (Figure 6), continued into 2014. During the 12 months ending June 2014, 330 single-family homes were permitted in the submarket, up 33 percent compared with the number of homes permitted during the previous 12 months (preliminary data). Sub - divisions under construction in the Albany County submarket include Canterbury Crossing, a seven-phase development comprising 210 quad-style condominiums with prices starting at $236,000. The first phase of 18 con-dominiums has been sold out since breaking ground in 2013. Also under construction is Stone Creek Estates, in New Scotland, with 30 two-bedroom townhomes for residents 55 years of age and older starting at $299,900.
During the next 3 years, demand is expected for 880 new homes in the Albany County submarket, including single-family homes, townhomes, and condominiums (Table 1). Demand
Figure 6. Single-Family Homes Permitted in the Albany County Submarket, 2000 to Current
Notes: Includes townhomes. Current includes data through June 2014.Sources: U.S. Census Bureau, Building Permits Survey; estimates by analyst
Housing Market TrendsSales Market—Albany County Submarket Continued
2000
2001
2002
2003
2004
2005
2006
700
600
500
400
300
200
100
0
2008
2009
2010
2011
2013
2014
2012
2007

Alb
an
y,
NY
• C
OM
PR
EH
EN
SIV
E H
OU
SIN
G M
AR
KE
T A
NA
LYS
IS
9
will result from improving economic conditions and continued growth in owner households. Figure 7 shows the number of households by tenure in 2000, 2010, and the current date. The 250 homes currently under construction
and a portion of the 6,550 other va-cant units in the submarket that may return to the market will satisfy some of the demand. The most demand is expected for new homes priced from $300,000 to $400,000 (Table 4).
Figure 7. Number of Households by Tenure in the Albany County Submarket, 2000 to Current
Note: The current date is July 1, 2014.Sources: 2000 and 2010—2000 Census and 2010 Census; current—estimates by analyst
Table 4. Estimated Demand for New Market-Rate Sales Housing in the Albany County Submarket During the Forecast Period
Price Range ($) Units of Percent
From To Demand of Total
236,000 299,999 170 19.0300,000 349,999 210 24.0350,000 399,999 240 27.0400,000 449,999 130 15.0450,000 499,999 90 10.0500,000 and higher 45 5.0
Notes: The 250 homes currently under construction and a portion of the estimated 6,550 other vacant units in the submarket will likely satisfy some of the forecast demand. The forecast period is July 1, 2014, to July 1, 2017.Source: Estimates by analyst
Rental Market—Albany County Submarket
The rental housing market in the Al-bany County submarket is balanced. Even with an increase in multifamily
construction activity in recent years, strong rental unit absorption in the sub - market helped to keep the estimated overall rental vacancy rate at 6.8 per - cent, only slightly higher than the 6.7 percent rate recorded in 2010 (Figure 8). The apartment market is slightly tight, with a vacancy rate of 4.0 percent as of the second quarter of 2014, up from 2.7 percent a year earlier (MPF Research).
Figure 8. Rental Vacancy Rates in the Albany County Submarket, 2000 to Current
Note: The current date is July 1, 2014.Sources: 2000 and 2010—2000 Census and 2010 Census; current—estimates by analyst
Housing Market TrendsSales Market—Albany County Submarket Continued
80,000
70,000
60,000
50,000
40,000
30,000
20,000
10,000
02000 2010 Current
Renter Owner
2000 2010 Current
6.5 6.7 6.88.0
6.0
4.0
2.0
0.0

Alb
an
y,
NY
• C
OM
PR
EH
EN
SIV
E H
OU
SIN
G M
AR
KE
T A
NA
LYS
IS
10
Rising incomes among renter house-holds in the submarket supported growth in apartment rents. From the second quarter of 2013 to the second quarter of 2014, the average monthly rent in the submarket increased 1 per - cent, to $1,033 (MPF Research). Renter households within the submarket had a median income of $33,050 in 2013, a 3-percent average annual increase since 2009 (2009 and 2013 American Community Survey 1-year data).
Approximately 21,650 students, or about one-half of the students living off campus in the Albany HMA, reside in the Albany County submarket. Al - though not all institutions in the sub-market provide on-campus housing, the larger colleges and universities do. The share of students living on campus varies from 45 percent of
undergraduates at The College of Saint Rose to 81 percent of undergraduates at Siena College. Most college students living off campus live in older single- family homes in the city of Albany (local property management profes-sionals).
Typical asking rents for new apartments in the submarket start at $1,100, $1,500, and $1,800 for one-, two-, and three- bedroom units, respectively (Table 5). The first phase of Shelter Cove Apart-ments opened in June 2014 along the Mohawk River, on the northern border of the Albany County submarket, with 104 apartments with rents start-ing at $1,250, $1,825, and $2,000 for one-, two-, and three-bedroom units, respectively.
Multifamily construction activity, as measured by the number of units permitted, increased to 460 units dur - ing 2013 (Figure 9). This total was more than the average of 350 multi-family units permitted annually from 2010 through 2012 and equal to the number permitted during recent peak years of 2005 and 2006. At least 400 condominium units, less than 10 per-cent of the multifamily units permitted, have been built in the Albany County submarket since 2000. During the 12 months ending June 2014, 120 multi - family units were permitted in the sub market, down from 340 units per-mitted during the previous 12 months (preliminary data). Multifamily units currently under construction include 62 apartments for residents 55 years of age and older at The Spinney at Van Dyke, with one-bedroom units starting at $1,625.
During the next 3 years, demand is expected for 980 new market-rate rental units in the Albany County
Table 5. Estimated Demand for New Market-Rate Rental Housing in the Albany County Submarket During the Forecast Period
One Bedroom Two Bedrooms Three or More Bedrooms
Monthly GrossRent ($)
Units of Demand
Monthly GrossRent ($)
Units of Demand
Monthly GrossRent ($)
Units of Demand
1,100 to 1,299 260 1,500 to 1,699 440 1,800 to 1,999 351,300 or more 85 1,700 to 1,899 90 2,000 or more 10
1,900 or more 60Total 340 Total 590 Total 50
Notes: Numbers may not add to totals because of rounding. The 500 units currently under construction will likely satisfy some of the estimated demand. The forecast period is July 1, 2014, to July 1, 2017.Source: Estimates by analyst
Figure 9. Multifamily Units Permitted in the Albany County Submarket, 2000 to Current
Notes: Excludes townhomes. Current includes data through June 2014.Sources: U.S. Census Bureau, Building Permits Survey; estimates by analyst
Housing Market TrendsRental Market—Albany County Submarket Continued
2000
2001
2002
2003
2004
2005
2006
500
450
400
350
300
250
200
150
100
50
0
2008
2009
2010
2011
2013
2014
2012
2007

Alb
an
y,
NY
• C
OM
PR
EH
EN
SIV
E H
OU
SIN
G M
AR
KE
T A
NA
LYS
IS
11
submarket (Table 1). The 500 apart-ments currently under construction will meet approximately one-half of the forecast demand. An additional 180 units in planning are likely to break ground in the near future and meet an additional portion of
demand. Those units include 138 apartments in the first phase of The Residences at Lexington Hills, which is expected to start construction in July 2014 and may add 300 more units in future phases.
Sales Market—Saratoga County Submarket
The sales housing market in the Sara - toga County submarket is slightly soft. Strong job growth and net in-migration from 2011 through 2013 stimulated home sales and homebuilding activity, but the pace of sales and construction activity declined in 2014. The current owner vacancy rate is estimated at 1.7 percent, unchanged from 2010 (Table DP-3 at the end of the report). A 9-month supply of homes was av - ail able for sale as of June 2014, un-changed from a year earlier (Greater Capital Association of Realtors®).
Sales of new and existing single-family homes, townhomes, and condominiums peaked in 2004, when 5,250 homes sold. Home sales declined an average of 11 percent, or by 470 homes, annu - ally during the next 5 years, reaching a low of 2,900 homes sold during 2009. The construction of the $4.6 billion GLOBALFOUNDRIES semicon-ductor production facility—a 3-year project that began in June 2009 in the southern portion of the submarket that added thousands of construction and manufacturing jobs—resulted in increased home sales in the submar-ket. Total home sales averaged 4,650 during 2011 and 2012. During the 12 months ending June 2014, 3,400 new and existing homes sold, down 11 percent from the previous 12 months (CoreLogic, Inc.), mostly because of a 13-percent decline in existing home sales.
The number of distressed mortgages in the Saratoga County submarket is lower than in the other submarkets in the Albany HMA and in the state of New York as a whole. Of the home loans in the submarket, 5.6 percent were 90 or more days delinquent, were in foreclosure, or transitioned into REO status as of June 2014, down from 6.1 percent a year earlier (Black Knight Financial Services, Inc.). For the state as a whole, the percentage was 7.8 percent as of June 2014.
The average existing home sales price increased an average of 10 percent, to $237,000, from 2000 through 2007 but rose less than 1 percent annually from 2008 through 2013. During the 12 months ending June 2014, the av - erage price for an existing home sold in the submarket was $251,700, up 3 percent compared with the average price during the previous 12 months. The average sales price for new homes increased 9 percent annually, from $205,500 to $379,600, from 2000 through 2007 but was unchanged overall from 2008 through 2013. Al - though new home sales prices were stable, the average size of a new single- family home sold in the submarket de - creased 10 percent, from 2,525 square feet in 2007 to 2,275 square feet in 2013 (Metrostudy, A Hanley Wood Company). During the 12 months ending June 2014, the average new
Housing Market TrendsRental Market—Albany County Submarket Continued

Alb
an
y,
NY
• C
OM
PR
EH
EN
SIV
E H
OU
SIN
G M
AR
KE
T A
NA
LYS
IS
12
home sales price declined 1 percent, to $363,800, compared with the aver-age during the previous 12 months.
Condominium construction activity in the HMA since 2000 has been most prevalent in the Saratoga County submarket. Condominiums consti-tuted 18 percent of multifamily units permitted in the submarket during the 2000s. Most units were built in the city of Saratoga Springs, including The Lofts at 18 Division Street, where 28 condominiums with prices starting at approximately $316,000 were completed in 2007. Condominium construction has slowed since 2010, representing less than 2 percent of multifamily units permitted in the submarket, partially because of restrictive lending standards.
Approximately one-half of all single-family homes permitted in the HMA
since 2000 have been in the Saratoga County submarket. Homebuilding activity increased in the submarket during 2012 and 2013 to an average of 640 single-family homes permitted annually, reversing a decline in con-struction activity from 2004 through 2011 (Figure 10). More recently, the decline in new and existing home sales reduced construction activity. During the 12 months ending June 2014, 430 single-family homes were permitted in the submarket, down 10 percent compared with the number permitted during the previous 12 months (preliminary data). Lakeview Landing, with plans for 162 homes near Saratoga Lake in the center of the submarket, offers two-bedroom homes starting at $347,500, three-bedroom homes starting at $372,800, and four-bedroom homes starting at $509,000. At Lakeview Landing, 9 homes have been built since con - struction began in 2013 and 14 are currently under construction. At The Mill at Smith Bridge, 9 of the planned 63 single-family homes have sold since the development broke ground in late 2013. Prices for these homes range from $330,000 to $440,000.
During the next 3 years, demand is expected for 1,500 new single-family homes, townhomes, and condomini-ums in the Saratoga County sub-market (Table 1). The 360 homes currently under construction and a portion of the 7,825 other vacant homes in the submarket that may come back on the market will likely satisfy part of the forecast demand. The most demand is expected for homes priced from $300,000 to $400,000 (Table 6). Figure 11 shows the number of households by tenure in the submarket in 2000, 2010, and the current date.
Figure 10. Single-Family Homes Permitted in the Saratoga County Submarket, 2000 to Current
Notes: Includes townhomes. Current includes data through June 2014.Sources: U.S. Census Bureau, Building Permits Survey; estimates by analyst
Table 6. Estimated Demand for New Market-Rate Sales Housing in the Saratoga County Submarket During the Forecast Period
Price Range ($) Units of Percent
From To Demand of Total
225,000 299,999 320 21.0300,000 349,999 470 31.0350,000 399,999 390 26.0400,000 449,999 140 9.0450,000 499,999 60 4.0500,000 and higher 140 9.0
Notes: The 360 homes currently under construction and a portion of the estimated 7,825 other vacant units in the submarket will likely satisfy some of the forecast demand. The forecast period is July 1, 2014, to July 1, 2017.Source: Estimates by analyst
2000
2001
2002
2003
2004
2005
2006
1,400
1,200
1,000
800
600
400
200
0
2008
2009
2010
2011
2013
2014
2012
2007
Housing Market TrendsSales Market—Saratoga County Submarket Continued

Alb
an
y,
NY
• C
OM
PR
EH
EN
SIV
E H
OU
SIN
G M
AR
KE
T A
NA
LYS
IS
13
Figure 11. Number of Households by Tenure in the Saratoga County Submarket, 2000 to Current
Note: The current date is July 1, 2014.Sources: 2000 and 2010—2000 Census and 2010 Census; current—estimates by analyst
Rental Market—Saratoga County Submarket
The rental housing market in the Sara - toga County submarket is balanced, with an overall vacancy rate currently estimated at 7.2 percent, up from 7.0 percent in 2010 (Figure 12). The sub - market was formerly a bedroom com - munity for surrounding counties, but it has transitioned in recent years into a live-work location with new garden apartment communities in southern portions of the submarket and midrise
rental options in the urbanizing city of Saratoga Springs. Single-family homes comprise approximately 20 percent of the rental market (2007–2012 American Community Survey 5-year data). The apartment market is tight, with a va - cancy rate of 3.3 percent as of the sec - ond quarter of 2014, down from 5.1 percent a year earlier (MPF Research).
During the second quarter of 2014, the average monthly apartment rent in the submarket was $1,097, up more than 1 percent from a year earlier (MPF Research). The apartment rent increased partially because of a rela - tively strong growth in the median income of renter households, which averaged 7 percent annually from 2009 through 2013, reaching $46,350 in 2013 (2009 and 2013 American Community Survey 1-year data). Typical asking rents for new market-rate apartments built in the submarket start at $1,025, $1,325, and $1,625 for one-, two, and three-bedroom apartments (Table 7). Starting rents are typically higher in the city of Saratoga Springs, located in the center of the submarket, because of its proximity to entertainment and shopping destinations.
Figure 12. Rental Vacancy Rates in the Saratoga County Submarket, 2000 to Current
Note: The current date is July 1, 2014.Sources: 2000 and 2010—2000 Census and 2010 Census; current—estimates by analyst
Table 7. Estimated Demand for New Market-Rate Rental Housing in the Saratoga County Submarket During the Forecast Period
One Bedroom Two Bedrooms Three or More Bedrooms
Monthly GrossRent ($)
Units of Demand
Monthly GrossRent ($)
Units of Demand
Monthly GrossRent ($)
Units of Demand
1,025 to 1,224 240 1,325 to 1,524 270 1,625 to 1,824 201,225 to 1,424 45 1,525 to 1,724 200 1,825 to 2,024 101,425 or more 30 1,725 to 1,924 140 2,025 to 2,224 10
1,925 or more 70 2,225 or more 10Total 320 Total 680 Total 55
Notes: Numbers may not add to totals because of rounding. The 410 units currently under construction will likely satisfy some of the estimated demand. The forecast period is July 1, 2014, to July 1, 2017.Source: Estimates by analyst
Housing Market TrendsSales Market—Saratoga County Submarket Continued
70,000
60,000
50,000
40,000
30,000
20,000
10,000
02000 2010 Current
Renter Owner
2000 2010 Current
6.17.0 7.28.0
6.0
4.0
2.0
0.0

Alb
an
y,
NY
• C
OM
PR
EH
EN
SIV
E H
OU
SIN
G M
AR
KE
T A
NA
LYS
IS
14
Multifamily construction activity in the submarket increased significantly starting in 2007. The number of multi - family units permitted for new con - struction averaged 180 annually from 2000 through 2006 but subsequently increased nearly 200 percent, to an average of 530 units permitted annually, from 2007 through 2013 (Figure 13). Some of the largest apartment
communities in the Albany HMA began construction in the Saratoga County submarket in 2007 and have since added units in phases. The Paddocks of Saratoga completed 336 apartments in 2008 and added 84 apartments in 2012. Winner’s Circle at Saratoga completed its first 100 apartments in 2009, with later phases adding 120 units each in 2012 and 2013. Park Place at Saratoga, with 57 apartments under construction in the city of Sara toga Springs, offers one- and two-bedroom units starting at $1,600 and $1,700, respectively.
During the 3-year forecast period, demand is expected for 1,050 new market-rate rental units in the Sara - toga County submarket (Table 1). The 410 apartments under construction and an additional 60 units likely to break ground in 2015 are expected to satisfy a portion of the forecast demand.
Figure 13. Multifamily Units Permitted in the Saratoga County Submarket, 2000 to Current
Notes: Excludes townhomes. Current includes data through June 2014.Sources: U.S. Census Bureau, Building Permits Survey; estimates by analyst
Sales Market—Mohawk River Submarket
The sales housing market in the Mohawk River submarket is soft. The current owner vacancy rate is esti-mated at 1.7 percent, down slightly from 1.8 percent in 2010 (Table DP-4 at the end of the report). The inven-tory of homes available for sale as of June 2014 ranged from approximately a 10-month supply in Rensselaer and Schenectady Counties to a 21-month supply in Schoharie County (Greater Capital Association of Realtors®).
Sales of new and existing single-family homes, townhomes, and condomini-ums in the Mohawk River submarket peaked in 2005, at 6,925 homes, before declining an average of 12 percent, or by 610 homes, annually from 2006 through 2011 (CoreLogic, Inc.). Home
sales increased an average of 10 per - cent, or by 340 homes, annually from 2012 through 2013 and were up 7 per - cent from the previous 12 months during the 12 months ending June 2014, to 4,000 homes. The average existing home sales price rose an aver-age of 8 percent from 2000 through 2008, reaching $158,200 in 2008, but decreased an average of 1 percent annually from 2009 through 2013. Existing home sales prices during the 12 months ending June 2014 averaged $147,900, down 1 percent compared with the average during the previous 12 months. The average existing home sales prices during this period for Rensselaer, Schenectady, and Schoha-rie Counties were $160,800, $149,300, and $96,500, respectively.
Housing Market TrendsRental Market—Saratoga County Submarket Continued
2000
2001
2002
2003
2004
2005
2006
900
800
700
600
500
400
300
200
100
0
2008
2009
2010
2011
2013
2014
2012
2007

Alb
an
y,
NY
• C
OM
PR
EH
EN
SIV
E H
OU
SIN
G M
AR
KE
T A
NA
LYS
IS
15
The average new home sales price in - creased an average of 8 percent from 2000 through 2007, to $292,800, but was unchanged overall from 2008 through 2013. Sales prices for new homes in the submarket during the 12 months ending June 2014 averaged $280,300, down 1 percent compared with the average during the previous 12 months.
Homebuilding activity declined in the Mohawk River submarket from a peak of 860 single-family homes permitted during 2004 to 240 homes permitted during 2013 (Figure 14). New homes under construction in the submarket include those at Country Gardens of Niskayuna, in Schenectady County, with 52 condominium town-homes starting at $254,900. Since the project broke ground in 2012, 15 town - homes have been built; another 13 are under construction. A decline in jobs in the submarket from 2010 through 2013 and a relatively high rate of distressed mortgages have restrained household growth and homebuilding activity in recent years. During the 12 months ending June 2014, 80 single- family homes were permitted, down from nearly 90 homes during the previ-ous 12 months (preliminary data). As of June 2014, 10.3 percent of home loans in the submarket were 90 or more days delinquent, were in foreclosure, or transitioned into REO status, down from 10.6 percent a year earlier (Black Knight Financial Services, Inc.).
During the next 3 years, demand is expected for 800 new single-family homes, townhomes, and condomini-ums in the Mohawk River submarket (Table 1). The 130 homes currently under construction and a portion of the 11,000 other vacant homes in the submarket that may come back on the market will likely satisfy part of the forecast demand. New home sales prices are expected to start at $150,000, with one-half of the demand estimated for homes priced from $250,000 to $350,000 (Table 8). Figure 15 shows the number of households by tenure in the submarket in 2000, 2010, and the current date.
Figure 14. Single-Family Homes Permitted in the Mohawk River Submarket, 2000 to Current
Notes: Includes townhomes. Current includes data through June 2014.Sources: U.S. Census Bureau, Building Permits Survey; estimates by analyst
Table 8. Estimated Demand for New Market-Rate Sales Housing in the Mohawk River Submarket During the Forecast Period
Price Range ($) Units of Percent
From To Demand of Total
150,000 199,999 40 5.0200,000 249,999 80 10.0250,000 299,999 200 25.0300,000 349,999 200 25.0350,000 399,999 120 15.0400,000 and higher 160 20.0
Notes: The 130 homes currently under construction and a portion of the estimated 11,000 other vacant units in the submarket will likely satisfy some of the forecast demand. The forecast period is July 1, 2014, to July 1, 2017.Source: Estimates by analyst
Figure 15. Number of Households by Tenure in the Mohawk River Submarket, 2000 to Current
Note: The current date is July 1, 2014.Sources: 2000 and 2010—2000 Census and 2010 Census; current—estimates by analyst
Housing Market TrendsSales Market—Mohawk River Submarket Continued
2000
2001
2002
2003
2004
2005
2006
1,000
800
600
400
200
0
2008
2009
2010
2011
2013
2014
2012
2007
100,000
90,000
80,000
70,000
60,000
50,000
40,000
30,000
20,000
10,000
02000 2010 Current
Renter Owner

Alb
an
y,
NY
• C
OM
PR
EH
EN
SIV
E H
OU
SIN
G M
AR
KE
T A
NA
LYS
IS
16
Rental Market—Mohawk River Submarket
The rental housing market in the Mohawk River submarket is slightly soft, although conditions have improved since 2010. The overall rental vacancy rate is estimated at 7.4 percent, down from 7.6 percent in 2010 (Figure 16). Single-family homes constitute approx - imately 17 percent of renter-occupied housing units in the submarket (2007– 2012 American Community Survey 5-year data). Apartment market condi - tions, however, are slightly tight. The apartment vacancy rate in Rensselaer County was 4.4 percent during the second quarter of 2014, up slightly from 3.6 percent a year earlier (MPF Research). In Schenectady County, the apartment vacancy rate decreased from 3.3 to 3.0 percent during the same period.
As of the second quarter of 2014, the average monthly rents in Rensselaer and Schenectady Counties were $968 and $886, respectively, an increase
of approximately 2 percent in each county (MPF Research). Market-rate apartment development is uncommon in Schoharie County, where approxi - mately 60 percent of renter households live in structures with four or fewer units. Starting rents for new apartments in the submarket are typically lower than minimum rents elsewhere in the HMA because renter household incomes are also slightly lower. In 2013, the median incomes for renter households were $33,500 in Rensselaer County and $25,250 in Schenectady County (2013 American Community Survey 1-year data). Rents for new apartments dur - ing the next 3 years are expected to start at $900, $1,100, and $1,350 for one-, two-, and three-bedroom units, respectively (Table 9). Apartments completed during the past year include the 206-unit Stoneledge Terrace Apart - ments in the city of Troy, in Rensselaer County, with rents starting at $1,270 and $1,530 for one- and two-bedroom apartments, respectively.
Developers responded to tightening apartment market conditions during the past year by increasing production. During 2013, 620 multifamily units were permitted in the Mohawk River submarket, nearly twice the number of units permitted in 2012 (Figure 17). From 2000 through 2007, population and job growth in the submarket were relatively high, and an average of 400 multifamily units were permitted an - nually. In addition to new construction, adaptive reuse developments in the cities of Troy and Schenectady have added at least 140 units to the multi-family inventory since 2000, although those properties were typically 30 units or less. Apartments currently under
Figure 16. Rental Vacancy Rates in the Mohawk River Submarket, 2000 to Current
Note: The current date is July 1, 2014.Sources: 2000 and 2010—2000 Census and 2010 Census; current—estimates by analyst
Table 9. Estimated Demand for New Market-Rate Rental Housing in the Mohawk River Submarket During the Forecast Period
One Bedroom Two Bedrooms Three or More Bedrooms
Monthly GrossRent ($)
Units of Demand
Monthly GrossRent ($)
Units of Demand
Monthly GrossRent ($)
Units of Demand
900 to 1,099 120 1,100 to 1,299 180 1,350 to 1,549 251,100 or more 40 1,300 to 1,499 140 1,550 or more 10
1,500 to 1,699 901,700 or more 45
Total 170 Total 460 Total 35
Notes: Numbers may not add to totals because of rounding. The 540 units currently under construction will likely satisfy some of the estimated demand. The forecast period is July 1, 2014, to July 1, 2017.Source: Estimates by analyst
Housing Market TrendsMohawk River Submarket Continued
2000 2010 Current
8.0 7.6 7.48.0
6.0
4.0
2.0
0.0

Alb
an
y,
NY
• C
OM
PR
EH
EN
SIV
E H
OU
SIN
G M
AR
KE
T A
NA
LYS
IS
17
Figure 17. Multifamily Units Permitted in the Mohawk River Submarket, 2000 to Current
Notes: Excludes townhomes. Current includes data through June 2014.Sources: U.S. Census Bureau, Building Permits Survey; estimates by analyst
construction include Patriot Square, in Schenectady County, with 156 units expected to be complete by late 2014.
The recent increase in multifamily permitting in the submarket resulted in a level of construction activity that is expected to satisfy most of the estimated demand for 660 new
market-rate rental units during the next 3 years (Table 1). In addition to the 540 apartments currently under construction or being converted from nonresidential buildings, an additional 320 apartments are likely to begin con - struction by the end of 2014, which is expected to satisfy the remaining demand in the submarket.
Data Profiles
Table DP-1. Albany HMA Data Profile, 2000 to Current
Average Annual Change (%)
2000 2010 Current 2000 to 2010 2010 to Current
Total resident employment 419,620 415,957 416,900 – 0.1 0.1
Unemployment rate 3.4% 7.4% 5.8%
Nonfarm payroll jobs 435,500 435,700 448,000 0.0 0.8
Total population 825,875 870,716 879,800 0.5 0.2
Total households 330,246 355,301 359,900 0.7 0.3
Owner households 212,760 228,741 231,200 0.7 0.3
Percent owner 64.4% 64.4% 64.2%
Renter households 117,486 126,560 128,700 0.7 0.4
Percent renter 35.6% 35.6% 35.8%
Total housing units 363,740 393,297 398,900 0.8 0.3
Owner vacancy rate 1.8% 1.7% 1.6%
Rental vacancy rate 7.0% 7.1% 7.1%
Median Family Income $55,308 $74,100 $77,700 3.0 1.2
Notes: Numbers may not add to totals because of rounding. Employment data represent annual averages for 2000, 2010, and the 12 months through June 2014. Median Family Incomes are for 1999, 2009, and 2013. The current date is July 1, 2014.Sources: U.S. Census Bureau; U.S. Department of Housing and Urban Development; estimates by analyst
Housing Market TrendsRental Market—Mohawk River Submarket Continued
2000
2001
2002
2003
2004
2005
2006
700
600
500
400
300
200
100
0
2008
2009
2010
2011
2013
2014
2012
2007

Alb
an
y,
NY
• C
OM
PR
EH
EN
SIV
E H
OU
SIN
G M
AR
KE
T A
NA
LYS
IS
18
Table DP-2. Albany County Submarket Data Profile, 2000 to Current
Average Annual Change (%)
2000 2010 Current 2000 to 2010 2010 to Current
Total population 294,565 304,204 307,600 0.3 0.3
Total households 120,512 126,251 127,300 0.5 0.2
Owner households 69,534 72,577 73,400 0.4 0.3
Percent owner 57.7% 57.5% 57.7%
Rental households 50,978 53,674 53,900 0.5 0.1
Percent renter 42.3% 42.5% 42.3%
Total housing units 129,972 137,739 138,700 0.6 0.2
Owner vacancy rate 1.8% 1.6% 1.3%
Rental vacancy rate 6.5% 6.7% 6.8%
Notes: Numbers may not add to totals because of rounding. The current date is July 1, 2014.Sources: U.S. Census Bureau; U.S. Department of Housing and Urban Development; estimates by analyst
Table DP-3. Saratoga County Submarket Data Profile, 2000 to Current
Average Annual Change (%)
2000 2010 Current 2000 to 2010 2010 to Current
Total population 200,635 219,607 224,900 0.9 0.6
Total households 78,165 88,296 91,650 1.2 0.9
Owner households 56,316 64,205 65,850 1.3 0.6
Percent owner 72.0% 72.7% 71.8%
Rental households 21,849 24,091 25,800 1.0 1.6
Percent renter 28.0% 27.3% 28.2%
Total housing units 86,701 98,656 102,600 1.3 0.9
Owner vacancy rate 1.4% 1.7% 1.7%
Rental vacancy rate 6.1% 7.0% 7.2%
Notes: Numbers may not add to totals because of rounding. The current date is July 1, 2014.Sources: U.S. Census Bureau; U.S. Department of Housing and Urban Development; estimates by analyst
Table DP-4. Mohawk River Submarket Data Profile, 2000 to Current
Average Annual Change (%)
2000 2010 Current 2000 to 2010 2010 to Current
Total population 330,675 346,905 347,300 0.5 0.0
Total households 131,569 140,754 140,950 0.7 0.0
Owner households 86,910 91,959 91,950 0.6 0.0
Percent owner 66.1% 65.3% 65.2%
Rental households 44,659 48,795 49,000 0.9 0.1
Percent renter 33.9% 34.7% 34.8%
Total housing units 147,067 156,902 157,500 0.6 0.1
Owner vacancy rate 2.1% 1.8% 1.7%
Rental vacancy rate 8.0% 7.6% 7.4%
Notes: Numbers may not add to totals because of rounding. The current date is July 1, 2014.Sources: U.S. Census Bureau; U.S. Department of Housing and Urban Development; estimates by analyst
Data Profiles Continued

Alb
an
y,
NY
• C
OM
PR
EH
EN
SIV
E H
OU
SIN
G M
AR
KE
T A
NA
LYS
IS
19
Data Definitions and Sources
2000: 4/1/2000—U.S. Decennial Census
2010: 4/1/2010—U.S. Decennial Census
Current date: 7/1/2014—Analyst’s estimates
Forecast period: 7/1/2014—7/1/2017—
Analyst’s estimates
The Albany-Schenectady-Troy, NY Metropolitan
Statistical Area, as defined in this report, is based
on the delineations established by the Office of
Management and Budget (OMB) in the OMB
Bulletin dated February 28, 2013.
Demand: The demand estimates in the analysis
are not a forecast of building activity. They are
the estimates of the total housing production
needed to achieve a balanced market at the end
of the 3-year forecast period given conditions on
the as-of date of the analysis, growth, losses, and
excess vacancies. The estimates do not account
for units currently under construction or units in
the development pipeline.
Other Vacant Units: In the U.S. Department of
Housing and Urban Development’s (HUD’s)
analysis, other vacant units include all vacant
units that are not available for sale or for rent.
The term therefore includes units rented or sold
but not occupied; held for seasonal, recreational,
or occasional use; used by migrant workers; and
the category specified as “other” vacant by the
Census Bureau.
Building Permits: Building permits do not neces-
sarily reflect all residential building activity that
occurs in an HMA. Some units are constructed
or created without a building permit or are issued
a different type of building permit. For example,
some units classified as commercial structures are
not reflected in the residential building permits.
As a result, the analyst, through diligent fieldwork,
makes an estimate of this additional construction
activity. Some of these estimates are included in the
discussions of single-family and multifamily building
permits.
For additional data pertaining to the housing market for
this HMA, go to http://www.huduser.org/publications/
pdf/CMARtables_AlbanyNY_15.pdf.
Contact Information
Benjamin Houck, Economist
Philadelphia HUD Regional Office
215–430–6678
This analysis has been prepared for the assistance and
guidance of HUD in its operations. The factual informa-
tion, findings, and conclusions may also be useful to
builders, mortgagees, and others concerned with local
housing market conditions and trends. The analysis
does not purport to make determinations regarding the
acceptability of any mortgage insurance proposals that
may be under consideration by the Department.
The factual framework for this analysis follows the
guidelines and methods developed by HUD’s Economic
and Market Analysis Division. The analysis and findings
are as thorough and current as possible based on informa -
tion available on the as-of date from local and national
sources. As such, findings or conclusions may be modi-
fied by subsequent developments. HUD expresses its ap-
preciation to those industry sources and state and local
government officials who provided data and information
on local economic and housing market conditions.
For additional reports on other market areas, please go to www.huduser.org/portal/ushmc/chma_archive.html.