for albany, ny 12205 new york state energy research and
TRANSCRIPT

FLEXTECH
ENERGY EFFICIENT INDOOR AIR QUALITY STUDY
For
100 Great Oaks Boulevard Albany, NY 12205
New York State Energy Research and Development Authority
17 Columbia Circle Albany, New York 12203-6399
Date: July 8, 2021

For questions regarding this report, please contact [email protected]. We hope the findings of this report will assist you in making decisions about energy efficient indoor air quality improvements in your facility. Thank you for your participation in this program.
NOTICE
This report was prepared pursuant to the Flexible Technical Assistance Program’s Energy Efficient Indoor
Air Quality Pilot (Hereinafter “IAQ Study”) administered by the New York State Energy Research and
Development Authority (hereinafter “NYSERDA”).
This IAQ Study investigated the annual energy and cost impacts of two scenarios: (1) adherence to the
American Society of Heating, Refrigeration, and Air-Conditioning Engineers Epidemic Task Force
(Hereinafter “ASHRAE ETF”) guidance documents that were in place when the IAQ Study commenced on
July 1, 2020 (listed below), and (2) energy efficient solutions that provide a comparable risk reduction to
the ASHRAE ETF guidance solutions given the introduction of Ultraviolet Germicidal Irradiation
(Hereinafter “UVGI”) technology. The impacts of the ASHRAE ETF scenario (1) are presented in relation
to the building energy use prior to the COVID-19 pandemic. The impacts of the Energy Efficient scenario
(2) are presented in relation to the building energy use prior to the COVID-19 pandemic while also
considering the impacts of the ASHRAE ETF scenario (1). The evaluated solutions and the associated
impacts presented in both scenarios (1) and (2) may not necessarily reflect the current operation of the
building(s) in the IAQ Study or the potential long-term changes to building use or operation as a result of
COVID-19. The focus of the IAQ Study is on airside HVAC systems that may impact COVID-19
transmission in indoor spaces, such as ventilation systems, filtration systems, and operational controls.
Major mechanical capital improvements, energy efficiency measures not associated with airside HVAC
systems, and emerging technologies, such as bi-polar ionization, are outside the scope of the IAQ Study.
The opinions expressed in this report do not necessarily reflect those of NYSERDA or the State of New
York. Neither NYSERDA nor its consultants are responsible for assuring that the design, engineering, or
installation of any recommendation if the IAQ Study is proper or complies with any particular laws
(including patent laws), codes, or industry standards. Overall, NYSERDA does not make any
representations of any kind regarding the results to be achieved or the adequacy or safety of any
recommendation. NYSERDA and the State of New York do not endorse, guarantee, or warrant any
particular manufacturer or product, and NYSERDA provides no warranties, expressed or implied for any
product of service. NYSERDA and the State of New York assume no responsibility for any loss, injury, or
damage resulting from, or occurring in connection with, the use of information contained, described,
disclosed, or referred to in this report.
ASHRAE Epidemic Task Force Guidance Document version dates in place at the commencement of the
IAQ Study:
• Building Readiness v.5-21-2020
• Commercial v.4-20-2020
• Schools & Universities v. 5-5-2020
• Healthcare v. 6-17-2020
• Filtration & Disinfection v. 5-27-2020
• ERV Practical Guide v. 6-9-2020
State of New York
Andrew Cuomo, Governor
New York State Energy Research and Development Authority

NYSERDA Energy Efficient Indoor Quality (IAQ) Analysis

100 Great Oaks Boulevard
2
Rosenblum Companies (“Rosenblum” or “Landlord”) has partnered with LaBella Associates, on behalf of the New York State Research and Development Authority (NYSERDA), to perform an Indoor Air Quality Study at 100 Great Oaks Boulevard, where Rosenblum is the landlord, identifying potential changes to equipment and controls that will improve safe building operations during and after the COVID-19 pandemic. As part of this study, the existing HVAC system, equipment, and controls were analyzed to identify ways to mitigate spread of pathogens through the building’s HVAC system as well as opportunities for energy conservation. The analysis focuses on determining feasible indoor air quality measures according to industry guidance along with their impact on energy consumption, maintenance costs, and capital costs.
The proposed measures were separated into two packages. The “ASHRAE Recommendations Package” and the “Energy Efficiency Package” as described after the table. Note that the energy savings for the energy efficiency package are relative the ASHRAE recommendations package and the ASHRAE recommendations package is in relation to the pre-COVID baseline.
Filtration MERV-8 MERV-13 MERV-13
OA Ventilation Rate 5% 30% 15%
Pre/Post-Occupancy Purge X ✔ ✔
Cooling Coil UVGI X X ✔
Upper-Room UVGI X X X
Portable HEPA Filtration X X X
Humidity Control X X X
Mode of Operation Normal Pandemic Mode Pandemic Mode
Net Upfront Installation Costs - $10,200 $27,359
Electric Usage (kWh) 474,924 612,415 533,588
Electric Demand (kW) 1,724 1,727 1,660
Natural Gas Usage (MMBtu) 201 3,665 1,561
Annual Electricity Cost Savings (less Demand) - ($9,049) $5,188
Annual Electric Demand Cost Savings - ($31) $711
Annual Natural Gas Cost Savings - ($28,692) $17,428
Annual Maintenance Cost Savings - ($4,990) ($3,524)
Net Cost Savings Per Year - ($42,763) $19,803
Net Present Value (NPV) - ($792,201) $407,346
Payback Period (years) - -0.2 1.4
Notes:
NPV rate of 3%
Upper-room UVGI not included due to the high operating costs associated with the required intensity for the space, relative to other measures.
Portable HEPA filtration was not included due to high cost of incorporating measure to each room.
The current HVAC system does not have the capacity to incorporate humidity control without significant capital upgrades.
The reduction in OA from 30% to 15% is the inverse fo the energy penalty associated with increasing the OA rate from 15% to 30%.
Upfront Costs
Energy Impact
Recurring Costs
Economic Analysis

100 Great Oaks Boulevard
3
The scope of work for the ASHRAE Recommendations Package includes the following:
Upgrade to MERV-13 filtration Increase OA ventilation percentage to 30% Incorporate Pre/Post-Occupancy Purges
The scope of work for the Energy Efficiency Package includes the following:
Upgrade to MERV-13 filtration Reduce OA ventilation percentage from 30% to 15% Incorporate Pre/Post-Occupancy Purges Install UVGI in return ductwork
Both options include upgrading the building management system (BMS) so that the economizer setting can be remotely adjusted for all rooftop units as well as air filter upgrades. The Energy Efficiency Package includes installation of UVGI lighting which permits the outside air setting to be reduced, thus saving energy.
As part of the recommendations listed above, it is recommended that the BMS incorporates a “Pandemic Mode” of operation that employs the recommended measures above for future instances where this mode of operation would need to be quickly implemented.
Cost estimates were developed with vendors for each option in order to quantify the capital cost required for these upgrades. In addition, energy calculations were developed for all options presented. Per NYSERDA policy, all incentives/rebates associated with the proposed equipment have been omitted from this report.

100 Great Oaks Boulevard
4
Definitions
Source Energy Energy measured at the source of generation
Site Energy Energy measured at the site of consumption
Energy Utilization Index Measure of energy consumption density per square foot. (kBtu/SF)
Commonly-Used Acronyms & Abbreviations
AHU Air Handling Unit ASHRAE American Society of Heating, Refrigeration, & Air-Conditioning Engineers AQM Air Quality Measure BTU British Thermal Unit CBECS Commercial Building Energy Consumption Survey CO2 Carbon Dioxide COVID-19 COrona VIrus Disease (also referred to as SARS-CoV-2) DCV Demand Control Ventilation DHW Domestic Hot Water DX Direct Expansion ECiP Epidemic Conditions In-Place ECM Energy Conservation Measure EUI Energy Utilization Index HVAC Heating, Ventilation, and Air Conditioning IAQ Indoor Air Quality IRR Internal Rate of Return kBtu kilo-British Thermal Unit (1,000 BTU) kW kilo-Watt (1,000 W) kWh Kilo-Watt hours MBH One thousand British Thermal Units MERV Minimum Efficiency Reporting Value MMBtu One million British Thermal Units NPV Net Present Value NYSERDA New York State Energy Research & Development Authority OA Outdoor Air P-ECiP Post-Epidemic Conditions In-Place PV Photovoltaic RH Relative Humidity RNA Ribonucleic Acid RTU Rooftop Unit SARS Severe Acute Respiratory Syndrome SF Square Foot UV Ultraviolet UVGI Ultraviolet Germicidal Irradiation VFD Variable Frequency Drive WHO World Health Organization

100 Great Oaks Boulevard
5
Executive Summary ............................................................................................................................................................................................................. 2
Definitions & Acronyms..................................................................................................................................................................................................... 4
Table of Contents .................................................................................................................................................................................................................. 5
Facility Description................................................................................................................................................................................................................ 6
Facility Overview .............................................................................................................................................................................................................. 6
HVAC System and Controls.................................................................................................................................................................................... 6
Utility Analysis & Benchmarking ............................................................................................................................................................................... 8
Industry Guidance ............................................................................................................................................................................................................... 10
Recommendations ............................................................................................................................................................................................................. 16
Ventilation Analysis ...................................................................................................................................................................................................... 17
ASHRAE Recommendations Package ........................................................................................................................................................ 18
Increased Filtration ................................................................................................................................................................................................. 18
Purge Mode .................................................................................................................................................................................................................. 19
Pandemic Mode....................................................................................................................................................................................................... 20
BMS Changes and Recommendations ................................................................................................................................................ 20
Energy Efficiency Package .................................................................................................................................................................................... 21
Discussion of Measures ............................................................................................................................................................................................ 21
Decreased Ventilation ......................................................................................................................................................................................... 21
Increased Filtration ................................................................................................................................................................................................. 22
UVGI Installation .......................................................................................................................................................................................................23
BMS Changes and Recommendations ................................................................................................................................................ 24
Purge Mode ................................................................................................................................................................................................................. 24
Pandemic Mode....................................................................................................................................................................................................... 25
Future Use of DCV ................................................................................................................................................................................................. 25
References ............................................................................................................................................................................................................................... 26
Appendices .............................................................................................................................................................................................................................. 27
Appendix A – Zone Summary ............................................................................................................................................................................ 27
Appendix B – Floor Plans ....................................................................................................................................................................................... 27
Appendix C – Calculations .................................................................................................................................................................................... 27
Appendix D – Cost Estimates ............................................................................................................................................................................. 27
Appendix E – Utility Data ........................................................................................................................................................................................ 27
Appendix F– Project Summary Sheet ......................................................................................................................................................... 27

100 Great Oaks Boulevard
6
Facility Overview
100 Great Oaks Boulevard is a 90,000 square foot, multi-tenant building located off Western Avenue in Albany, New York. The building was built in 1991 and has three stories with no basement. The building has about 25 separate tenants including some medical offices and a variety of other commercial office tenants. Tenant spaces range from about 700 square feet to over 9,000 square feet. Primary operating hours are Monday through Friday from 8 a.m. to 6 p.m. with some tenants working Saturdays. Tenants do retain access to the building 24/7. During full operation, the building is estimated to have approximately 200 full time occupants. Current natural gas and electrical services are provided by National Grid via single main meters.
HVAC System and Controls
The building is conditioned with (5) 17.5 ton and (5) 15 ton Carrier Centurion rooftop units. The HVAC system is a variable volume temperature (VVT) system. With a VVT system, the rooftop units operate in either in heating mode, cooling mode, or a neutral fan-only mode. There are no reheat coils. Space temperatures are controlled by controlling air flow with zone dampers.
The air handling units on site are generally in good working condition and are not in need of replacement. This report includes recommended controls modifications to enable the units to better control the conditions in the spaces. The AHUs are in operation when the spaces are occupied- which is Monday through Friday, 8AM – 6PM, with additional occupancy on Saturdays depending on the tenant.
One of the disadvantages of a VVT system is that if a minority of zones are calling for heating, while the majority of zones are calling for cooling, the RTU will spend most of the time in cooling mode and the heating zones may not be conditioned properly. The control system attempts to solve this problem two ways:
It will close the damper to the minimum position in zones that need heating. It will alternate the supply air temperature between heating and cooling in an effort
to satisfy all zones.
Since temperature control is always a compromise when there are conflicting zone calls, contractors often set the minimum damper position to zero. This has the inadvertent effect of shutting off all air flow, including ventilation air, during times when the zone call is opposite the RTU mode.
The building has a Carrier I-vu BMS that can controls schedules and setpoints and global RTU functions. However RTU-specific parameters are controlled independently and cannot be accessed from the I-vu system. Economizer damper positions are controlled at the RTU level and cannot be accessed or overriden by the I-vu system under the current setup.

100 Great Oaks Boulevard
7
Each RTU has a demand control ventilation (DCV) sequence with a single CO2 sensor located in the main return duct. If the average return air CO2 concentration exceeds the setpoint, the economizer damper (fresh air damper) opens to provide more outside air.
Since, there is only one CO2 sensor on each unit, the fresh air dampers respond to the average of the CO2 level of the return air from all spaces. Technically, this does not comply with the ASHRAE 621 standard for DCV systems and can create the following situation:
If only one area served by the RTU (say a small conference room) is heavily occupied but the rest of the areas served by the RTU are not, there may be only a small change in the average CO2 level returning to the RTU. In this situation, the CO2 level in the heavily occupied space my increase to very high levels, while the position of the outside air dampers remains unchanged. Therefore the heavily occupied space may be under-ventilated.
The RTU’s also have powered exhaust fans. When the economizer damper position is more than 50% open (which happens when free cooling is available), the powered exhaust fan will run to relieve air from the building and permit the uptake of more outside air.
It was observed that the accessible units in the space currently have OA dampers open at 5% open. It is assumed that the inaccessible units have airflow rates consistent with these readings. There is no current means of controlling humidity in the spaces.
A table of the tenants and zones served by each RTU is included in Appendix A. Note that most RTU’s served more than one tenant. All the RTU’s do serve only one floor.
Floor plans showing current tenants and the net square footage occupied by each tenant are shown in Appendix B. The landlord does not possess duct drawings for the tenant spaces.
The building during the early time of the COVID pandemic was mostly vacant. Currently, workers have been returning to their offices and the building is 90% occupied, with all workers wearing masks while in common areas. Signs in the lobbies encourage occupants to use the elevators one person at a time.
Existing Filtration Methods
The RTUs have 2” filter racks with MERV 8 filters. Filters are changed every three months by the landlord. There are no filter pressure gauges installed on the units. Filter banks are not tightly sealed to prevent leakage around the filters.
Airflow Patterns in Spaces
The system utilizes ducted supply and ducted returns. All supplies and returns are ceiling- mounted. The system uses standard 2’ x 2’ multi-cone supply diffusers and perforated return grills. Returns are located in mostly in office lobby and hallway areas. Many of the smaller offices do not have return grills.
1 ASHRAE 62-2019 – Ventilation for Acceptable Indoor Air Quality

100 Great Oaks Boulevard
8
100 Great Oaks is served by a single electric meter and a single gas meter. Utility costs are prorated by lease area (plus a percentage of common space) and passed on to the tenants. Natural gas and electric bills were provided for the period from January 2018 – April 2020. A summary of utility information is shown below.
The EUI for 100 Great Oaks is 20.3 kBtu/sq. ft. This is a very low value. The national average EUI for commercial office buildings is 52.9 kBtu/sq ft according to the 2012 Department of Energy Commercial Buildings Energy Consumption Survey. The building envelope is tightly sealed and the building appears to be quite energy efficient.
Annual Totals CO2 EmissionsAnnual Electric Usage 476,381 kWh = 1,625,412 MBtu 64 Metric TonsPeak Electric Demand 198.4 kW
Annual Totals CO2 EmissionsAnnual Natural Gas Usage 200 MMBtu = 199,850 MBtu 11 Metric TonsAnnual Propane Usage 0 gal = 0 MBtu 0 Metric TonsAnnual #2 Fuel Oil Usage 0 gal = 0 MBtu 0 Metric TonsAnnual Gasoline Usage 0 gal = 0 MBtu 0 Metric TonsANNUAL TOTALS 1,825,262 MBtu 74.4 Metric TonsEnery Use Index (EUI in kBtu/sq ft) 20.3
Total Annual Electric Costs 52,007$ Blended Electric Rate ($/kWh) 0.104$ Total Annual Natural Gas Costs 1,691$ Electric Demand Rate ($/kW) 10.643$
Total Annual Propane Costs 0$ Incremental Electric Usage Rate ($/kWh) 0.066$ Total Annual #2 Fuel Oil Costs 0$ Natural Gas Rate ($/MMBtu) 8.283$
Total Annual Gasoline Costs 0$ TOTAL UTILITY COSTS 53,698$
Annual Natural Gas
Usage11%
Annual Electric Usage89%
11
58
60
62
64
66
68
70
72
74
76
An
nu
al C
arb
on
Em
issi
on
s (M
etr
ic T
on
s)
Gasoline
#2 Fuel Oil
Propane
Natural Gas
Electricity
Table 1

100 Great Oaks Boulevard
9
The graphs below outline the monthly utility consumption from 2018, 2019, and 2020. In April of 2020, electric consumption and demand decreased – likely due to reduced occupancy during the pandemic. Subsequent data was not provided when this report was prepared. The baselines used for the calculations in this study do not include months effected by the pandemic.

100 Great Oaks Boulevard
10
Defined as a biological agent that causes disease or illness to its host, pathogens can be transmitted from one body to another in a number of ways through direct and indirect methods of exposure. A number of viruses, bacteria, and microorganisms fall under this classification such as influenza, the common cold, and more lethal strains such as the SARS outbreak in 2003 and the ongoing COVID-19 pandemic in 2020. Despite their varying in severity and infectiousness, a number of strategies exist that can be used to help mitigate the spread of pathogens through both direct and indirect exposure.
The SARS-CoV-2 virus, short for severe acute respiratory syndrome coronavirus 2, is a RNA virus with a lipid envelope with a size of approximately 120 nm. Common symptoms include fever, coughing, fatigue, shortness of breath, and loss of taste and smell. Studies have indicated that the virus is capable of surviving hours in the air and up to days on surfaces. The World Health Organization and other research institutions are still researching the virus shedding rate and infectious dosage, as that is not known at this time.
Transmission Modes & Non-HVAC Mitigation
Common transmission modes according to the World Health Organization includes direct or indirect contact with an infected person, through food or water, insect or animal vector, fomite- meaning intermediate surfaces, or through airborne particles such as large droplets or aerosols. For the purpose of this study, methods of mitigating the spread of pathogens, specifically SARS-CoV-2, can be separated into “HVAC” methods of mitigation and “Non-HVAC” methods of mitigation. Both categories play an essential role in maintaining a safe environment for occupants in buildings.
The graphic shown on the right highlights common non-HVAC methods of mitigating the spread of pathogens and are paramount to the stop of the spread of the virus. These measures help limit direct exposure between occupants and helps maintain clean surfaces to limit fomite transmission.
HVAC Mitigation
In addition to limiting direct exposure between occupants, there are several ways in which the operation of buildings plays a critical role in limiting the spread of contaminants from one occupant to another. Indoor air quality control is a key element in controlling transmission, specifically impacting aerosol and fomite transmission.
The flowchart below outlines the three main objectives of the building systems within its role in pathogen mitigation and a variety of means to accomplish these goals. The two primary

100 Great Oaks Boulevard
11
objectives are to supply clean air to occupants while containing and/or exhausting contaminated air out of the occupied spaces. The third objective, after taking appropriate safety precautions, is to mitigate excess energy consumption in a way that does not negatively impact building safety.
A number of variables impact the feasibility of these indoor air quality strategies that are unique to each facility. In general, current industry guidance states that it is recommended to ventilate as much outdoor air as possible, with a MERV-13 filter or higher, while incorporating ultraviolet germicidal irradiation (UVGI) to disinfect surfaces in the airstream. The following sections take a closer look at each of the recommended strategies to pathogen mitigation with respect to the HVAC system as well as potential limiting factors in existing facilities and possible alternatives.
Filtration
Filtration plays a key role in limiting the spread of the virus through the HVAC system. Most commonly located centrally in the HVAC system, mechanical filters are evaluated by the minimum efficiency reporting value (MERV), which is based on a scale is 1-16. The higher the MERV rating, the better the filter is able to remove particles in the air ranging in sizes from 0.3 microns to up to 10 microns.
ASHRAE recommends that the mechanical filter efficiency has a minimum MERV rating of 13, and preferably higher to better limit the spread of the virus. Since many existing systems were designed with a MERV rating of 6-8, the unit’s fan power and capacity must be taken into consideration to ensure it is still able to effectively meet indoor temperature and humidity requirements.
•MERV-13 or higher filterRecommended Action
•Supply fan power great enought to overcome ∆P
Limiting Factors
100 Great Oaks Boulevard
12
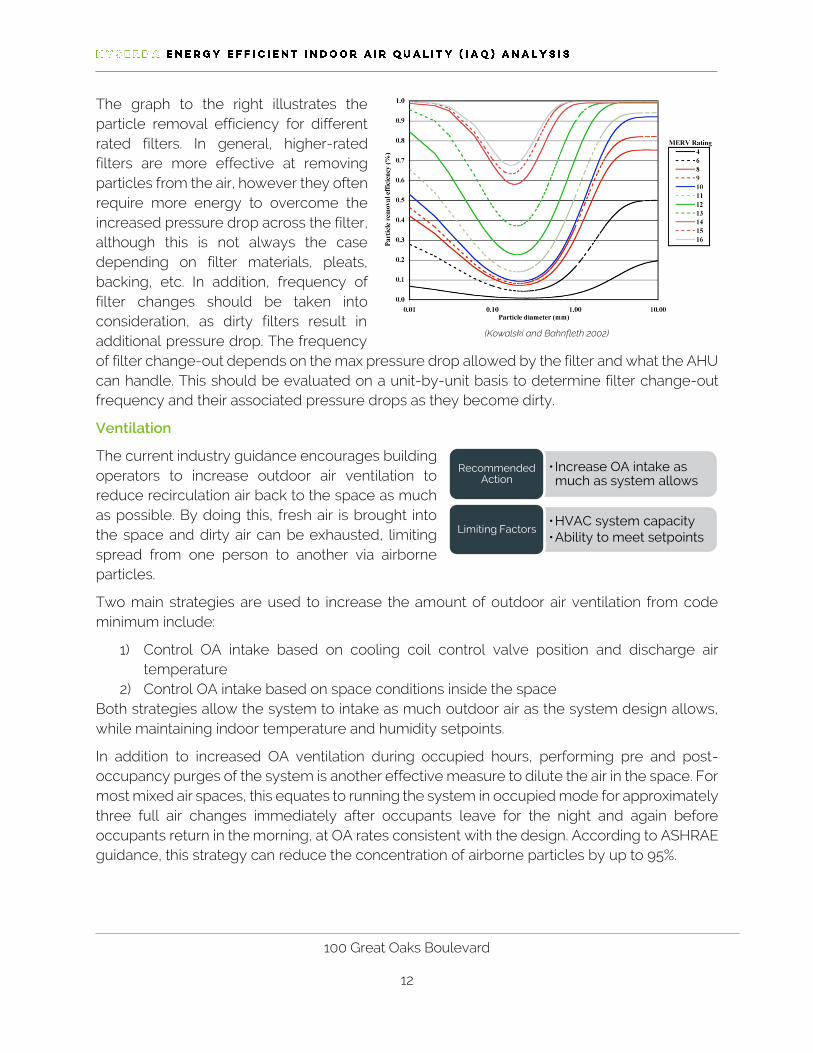
The graph to the right illustrates the particle removal efficiency for different rated filters. In general, higher-rated filters are more effective at removing particles from the air, however they often require more energy to overcome the increased pressure drop across the filter, although this is not always the case depending on filter materials, pleats, backing, etc. In addition, frequency of filter changes should be taken into consideration, as dirty filters result in additional pressure drop. The frequency of filter change-out depends on the max pressure drop allowed by the filter and what the AHU can handle. This should be evaluated on a unit-by-unit basis to determine filter change-out frequency and their associated pressure drops as they become dirty.
Ventilation
The current industry guidance encourages building operators to increase outdoor air ventilation to reduce recirculation air back to the space as much as possible. By doing this, fresh air is brought into the space and dirty air can be exhausted, limiting spread from one person to another via airborne particles.
Two main strategies are used to increase the amount of outdoor air ventilation from code minimum include:
1) Control OA intake based on cooling coil control valve position and discharge air temperature
2) Control OA intake based on space conditions inside the space Both strategies allow the system to intake as much outdoor air as the system design allows, while maintaining indoor temperature and humidity setpoints.
In addition to increased OA ventilation during occupied hours, performing pre and post-occupancy purges of the system is another effective measure to dilute the air in the space. For most mixed air spaces, this equates to running the system in occupied mode for approximately three full air changes immediately after occupants leave for the night and again before occupants return in the morning, at OA rates consistent with the design. According to ASHRAE guidance, this strategy can reduce the concentration of airborne particles by up to 95%.
• Increase OA intake as much as system allows
Recommended Action
•HVAC system capacity•Ability to meet setpoints
Limiting Factors
(Kowalski and Bahnfleth 2002)
100 Great Oaks Boulevard
13
Ultraviolet Germicidal Irradiation
Ultraviolet Germicidal Irradiation (UVGI) is defined as the use of UV lighting to kill or inactivate viral, bacterial, and fungal species. Current industry guidance recommends UVC lighting (200-280 nm wavelength) used on the cooling coil, upper-room, and lower in-room applications, depending on the application.
Industry best practices indicate that in-duct UVGI downstream of the cooling coil is the most effective application of UVGI to reduce or eliminate microbial growth on the cooling coil and drain pan. While the exact mounting location of the lamps is dependent on the AHU design and lamps used, the UV lamps are typically mounted within 3 feet of the coil and are generally on 24/7.
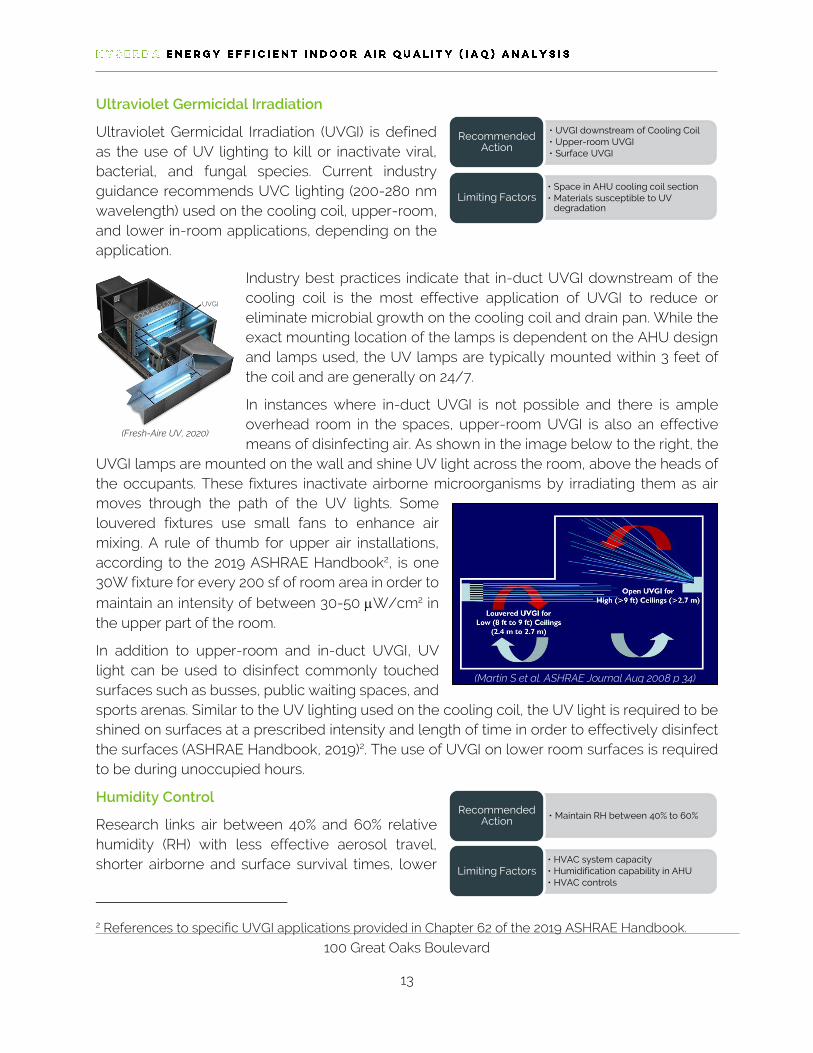
In instances where in-duct UVGI is not possible and there is ample overhead room in the spaces, upper-room UVGI is also an effective means of disinfecting air. As shown in the image below to the right, the
UVGI lamps are mounted on the wall and shine UV light across the room, above the heads of the occupants. These fixtures inactivate airborne microorganisms by irradiating them as air moves through the path of the UV lights. Some louvered fixtures use small fans to enhance air mixing. A rule of thumb for upper air installations, according to the 2019 ASHRAE Handbook2, is one 30W fixture for every 200 sf of room area in order to maintain an intensity of between 30-50 W/cm2 in the upper part of the room.
In addition to upper-room and in-duct UVGI, UV light can be used to disinfect commonly touched surfaces such as busses, public waiting spaces, and sports arenas. Similar to the UV lighting used on the cooling coil, the UV light is required to be shined on surfaces at a prescribed intensity and length of time in order to effectively disinfect the surfaces (ASHRAE Handbook, 2019)2. The use of UVGI on lower room surfaces is required to be during unoccupied hours.
Humidity Control
Research links air between 40% and 60% relative humidity (RH) with less effective aerosol travel, shorter airborne and surface survival times, lower
2 References to specific UVGI applications provided in Chapter 62 of the 2019 ASHRAE Handbook.
• Maintain RH between 40% to 60%Recommended Action
• HVAC system capacity• Humidification capability in AHU• HVAC controls
Limiting Factors
• UVGI downstream of Cooling Coil• Upper-room UVGI• Surface UVGI
Recommended Action
• Space in AHU cooling coil section• Materials susceptible to UV
degradationLimiting Factors
UVGI
(Fresh-Aire UV, 2020)
(Martin S et al. ASHRAE Journal Aug 2008 p 34)

100 Great Oaks Boulevard
14
transmission rates, and more effective patient lung repair functions. It is recommended that the HVAC system is controlled to maintain the indoor temperature setpoints as well as the relative humidity between 40% and 60%, if possible. Potential limiting factors include insufficient cooling capacity in the HVAC system, building envelope, no humidification inside the HVAC unit, or inadequate controls that are not capable of monitoring humidity within the spaces.
Additional Considerations
In-room airflow should be directed away from occupants in order to limit instances where contaminated air is being blown across other occupants. These airflow strategies are typically most effective when incorporated into the HVAC system design.
Differential Room Pressurization can be an effective way of mitigating spread from one room to another by creating a positive or negative room pressure to prohibit airflow in or out of a room. This is typically applied in healthcare or educational settings. Limiting airflow between one room and another helps discourage the spread of contaminated air.
Energy Conservation Measures
In addition to maximizing the health and safety of the building occupants, there are ways of incorporating energy conservation strategies into the building’s operation while maintaining a safe environment. Commonly found opportunities for building systems are listed below.
Replace standard filters with high-efficiency filters with reduced pressure drop Retrofit standard AHU fan with variable frequency drive Increased economizer operating ranges
In addition to the common energy conservation measures listed above, another method of energy conservation while operating in pandemic mode is to incorporate UVGI to the HVAC system and reduce other safety measures such as increased filtration or increased OA ventilation. The incorporation of UVGI makes the system more effective at capturing or killing pathogens - which results in an increased equivalent air changes through the system. By evaluating this on a case-by-case approach, other ASHRAE-recommended measures can be reverted back to normal operation while maintaining an equivalent level of safety.
The methods used to quantify this calculates the filter effectiveness of range 2 particles (1-3 m) per ASHRAE Standard 52.2 (2017), UVGI effectiveness calculated by intensity and time of exposure per 2019 ASHRAE Handbook guidance, and the HVAC system’s outdoor air percentage. By quantifying the individual effectiveness of each option, the net system effectiveness for each air change can be calculated and equated to other combinations of filtration, OA levels, and UVGI kill rates. The comparison of equivalent air changes can be used as a basis for quantifying the equivalent “safety” of different combinations of technologies.

100 Great Oaks Boulevard
15
Modes of Building Operation
The intent of this study is to identify operational strategies to mitigate the spread of pathogens during normal operation as well as during pandemics. ASHRAE recommends the following operational settings for the building management system:
The Epidemic Conditions in Place (ECiP) setting includes all of the pathogen mitigation measures listed above – with pre-programmed settings accounting for varying levels of occupancy and building closure. In addition to mitigating the spread of the SARS-CoV-2 virus, this will allow the systems to have an already built-in epidemic mode in the event of future epidemic/pandemic events.
The Post-Epidemic Conditions in Place (P-ECiP) measure includes a normal building operation setting as well as a post-epidemic, pre-occupancy setting or protocol is in-place to ensure all systems are in good working condition, all necessary filters and maintenance supplies are confirmed for delivery, and all safety measure protocols are in-place.
Epidemic Conditions in Place (ECiP)
•Occupied at pre-epidemic capacity
•Occupied at reduced capacity
•Unoccupied temporarily
•Unoccupied for indefinite period
Post-Epidemic Conditions in Place (P-ECiP)
•Prior to occupancy
•Occupied

100 Great Oaks Boulevard
16
This section details the existing conditions, proposed conditions, energy impact, and economic impact of the two recommendation packages. These are summarized in the table below. .
Further, the table below breaks down the calculated energy impact of each individual measure, which are subcomponents of the packages presented in the table above.
Filtration MERV-8 MERV-13 MERV-13
OA Ventilation Rate 5% 30% 15%
Pre/Post-Occupancy Purge X ✔ ✔
Cooling Coil UVGI X X ✔
Upper-Room UVGI X X X
Portable HEPA Filtration X X X
Humidity Control X X X
Mode of Operation Normal Pandemic Mode Pandemic Mode
Net Upfront Installation Costs - $10,200 $27,359
Electric Usage (kWh) 474,924 612,415 533,588
Electric Demand (kW) 1,724 1,727 1,660
Natural Gas Usage (MMBtu) 201 3,665 1,561
Annual Electricity Cost Savings (less Demand) - ($9,049) $5,188
Annual Electric Demand Cost Savings - ($31) $711
Annual Natural Gas Cost Savings - ($28,692) $17,428
Annual Maintenance Cost Savings - ($4,990) ($3,524)
Net Cost Savings Per Year - ($42,763) $19,803
Net Present Value (NPV) - ($792,201) $407,346
Payback Period (years) - -0.2 1.4
Notes:
NPV rate of 3%
Upper-room UVGI not included due to the high operating costs associated with the required intensity for the space, relative to other measures.
Portable HEPA filtration was not included due to high cost of incorporating measure to each room.
The current HVAC system does not have the capacity to incorporate humidity control without significant capital upgrades.
The reduction in OA from 30% to 15% is the inverse fo the energy penalty associated with increasing the OA rate from 15% to 30%.
Upfront Costs
Energy Impact
Recurring Costs
Economic Analysis
Energy Impact - Summary TableAnnual Electric Usage
Savings (kWh)
Annual Electric Demand Savings
(kW)
Annual Gas
Savings (MMBtu)
Estimated Annual Maintenance
SavingsAnnual Cost
Savings
Estimated Installation
Costs
-3,744 -1.0 0 1,466$ (389)$ 17,159$
-18,769 0.0 -1,342 -$ (16,762)$ 10,200$
-28,153 0.0 -2,012 -$ (25,143)$ 1,200$
-9,269 -2.95 0 (4,990)$ (964)$ -$
-26,883 0.00 -18 -$ (1,921)$ -$
-81,301 0.00 -110 -$ (6,264)$ -$
Both ventilation options include a $1,200 fee for TAB.
Building Purge (EEP)
Building Purge (ASHRAE)
Measure
UVGI
Increased Ventilation (5% to 15%)
Increased Ventilation (15% - 30%)
Increased Filtration
Table 2
Table 3

100 Great Oaks Boulevard
17
Ventilation Analysis
The table below provides ventilation calculations for the building based on code occupancy levels (per Table 403.3.1.1 of the 2020 NYS Mechanical Code). Under the code, the average occupant density varies based on the space type (office, conference room, lobby, reception, etc.) Since detailed information was not available at the time of this study, a composite occupant density of 7 persons per 1,000 SF was assumed. These values are based off of the code requirement for space types and may vary with actual occupancy levels.
Note that the original 5% minimum position used previously is very close to the “space” component of the ventilation requirement. The current code requirement for a fixed ventilation rate would be about 12%.
For the purposes of the recommended ventilation rates in this report, a 3% safety factor was added to the estimated code-required OA% to account for potential deviation from the assumed occupant density used in these calculations. The recommended code-minimum OA rate including this safety factor is 15%.
UnitFloors Served
Nominal Tons
CFM
Approximate Occupied
Square Footage
Average CFM/SF
Code Occupancy
Space Ventilation
Occpuant Ventilation
Total Ventilation
Percent OA to Meet
Code
Percent OA to meet Space
Req't
RTU-1 3 15 6,000 6,436 0.93 45 386 225 764 12% 6.4%
RTU-2 3 17.5 7,000 6,847 1.02 48 411 240 813 12% 5.9%
RTU-3 2 15 6,000 6,556 0.92 46 393 229 779 12% 6.6%
RTU-4 1 15 6,000 7,513 0.80 53 451 263 892 12% 7.5%
RTU-5 2 15 6,000 4,508 1.33 32 270 158 535 12% 4.5%
RTU-6 2 17.5 7,000 6,205 1.13 43 372 217 737 12% 5.3%
RTU-7 3 17.5 7,000 4,475 1.56 31 269 157 531 12% 3.8%
RTU-8 2 15 6,000 8,018 0.75 56 481 281 952 12% 8.0%
RTU-9 3 17.5 7,000 6,847 1.02 48 411 240 813 12% 5.9%
RTU-10 3 17.5 7,000 7,398 0.95 52 444 259 879 12% 6.3%
Totals 65,000 64,803 454 3888 2268 7695 12% 6.0%
Average Occupant Density 7 PPL/1000 sf
Ventilation Effectiveness 0.8
Ventilation Calculations
100 Great Oaks Bouldvard
Table 4
100 Great Oaks Boulevard
18
ASHRAE Recommendations Package
Based on current industry guidance outlined in the Industry Guidance section of this report, the following are items that facilities can easily upgrade to in a “Pandemic Mode” without capital upgrades:
Increase ventilation to maximum feasible level Increase filtration to MERV-13 Filters Incorporate Pre/Post-Occupancy Purge
The ASHRAE Recommendation package would involve increasing the ventilation to the maximum practical rate. Based on operator experience, it is estimated that the maximum practical OA rates to utilize on a year round basis would be 30%. This conclusion is based off of the building’s inability to meet space setpoints beyond that rate of ventilation. According to the Energy Impact table above, the cost of going from a minimum position of 5% to a 30% OA airflow rate on an annual basis would increase energy costs by $41,905. As shown in the tables in Appendix C, most of this increase would be in natural gas costs. In addition, it is recommended that an air balancer is hired to measure and adjust airflow rates.
The ASHRAE package also includes increasing filter efficiency to MERV 13. Based on the increased filter pressure drop, this would increase operating costs by $964 per year (see Appendix C). However, these filters are more expensive, so the increased material cost would be $4,990 per year (see Appendix D).
While the minimum economizer position can be set at each individual RTU controller, such adjustments would be far more efficient if the controller were tied into the I-vu BMS. Therefore, this case also includes upgrading the BMS so that the economizer position can be controlled form a central location. The cost of this upgrade is $9,000 according to an estimate from James. D. Warren (see Appendix D).
In addition, a pre/post purge cycle is recommended. This involves operating the system before and after occupancy in order to cycle the air through the filters in the AHUs to clean the air. Appendix C outlines the approximate purge runtimes per unit based on the space volume and unit capacities.
Implementation of the ASHRAE Package would increase operating costs so it does not have a positive cash flow or payback periods.
Increased Filtration
All RTUs contain 2” MERV 8 filters. Both models use nine, 16”x25” filters. The filters are currently changed every three months. MERV 8 filters are typical for commercial facilities but fail to capture particles of 5 microns or less effectively and will not reduce the circulation of bacteria or viruses transported on these particles. Based on the size of the systems we estimate that the system total static pressure is 0.8 in. WC. The RTUs can accommodate 2”, MERV 13 filters which are readily available.

100 Great Oaks Boulevard
19
In both cases, it is recommended that MERV-13 be installed instead of MERV 8 filters. Covid-19 virus particles are reported to be about 0.12 microns in diameter (Mayo Clinic). Note from the graph that air filters perform the worst in the range from 0.1 to 0.5 microns. A MERV 8 removes less than 10% of particles in this size range while a MERV 13 removes 35 – 40% of particles. Higher MERV ratings are generally not practical in RTUs due to the increased static pressure. This could compromise air flow which would impact the performance of the conditioning system.
Since the filter changes are frequent (every 3 months) we expect that it can remain the same with MERV 13 filters. Our calculations assume that the final total static pressure with MERV 1`3 filters is 1.7 versus 1.5 for MERV 8 filters. The existing fans should be able to handle this increase with only a slight drop in air flow.
It is recommended that an air balancer be brought to check clean and dirty pressure drops and air flows with both MERV 8 and MERV 13 filters on one 15 ton unit and one 17.5 ton unit. This information will make it possible to fine tune recommendations concerning filter change schedule and the impact of MERV 13 filters. Maintenance staff could also take pressure drop measurements themselves through purchase of a portable micro-manometer and take periodic readings to assess the need for filter changes. These are available for $200 and up. Test ports would have to be drilled in the sides of the RTUs to take measurements. They would likely discover that the required filter change frequency would change depending on the time of year.
Because of the frequent filter changes at the facility, the additional electrical cost for running the units with MERV 13 filters versus MERV 8 is quite low and estimated at $964 per year. MERV 8 filters are estimated to cost $2,840 per year for four filter changes. MERV 13 filters are estimated to cost $7,830 per year. Labor costs for both options are the same so the added cost of the MERV 13 filters is $4,990.
The total added cost for both energy and materials for this measure is $5,954.
Purge Mode
ASHRAE is recommending pre- and post-occupancy purge modes sufficient to reduce the concentration of airborne particles by 95%. This generally requires 3 total air changes. Calculations are presented in Appendix C of the purge time required to achieve 3 air changes at a 30% dampers position. The times range from 60 to 120 minutes depending on the RTU and the office area served.
Easy implementation of this measure would require the I-vu upgrades discussed at the beginning of this section.
100 Great Oaks Boulevard
20
Pandemic Mode
The ASHRAE pandemic Mode recommendation includes increasing the outside air to the maximum possible. It is estimated that this is about 30% which we estimate would be the limit for year round operation of RTUs. This mode could be comfortably used during moderate weather conditions without causing excessive use of energy and without compromising indoor conditions. Easy implementation of this measure would require the I-vu upgrades discussed above.
The proposed control strategy is based on meeting indoor space setpoint conditions. The outdoor air damper and return air dampers should modulate based on the current space temperatures and humidity. This strategy will allow the system to increase outdoor air ventilation without exceeding the space comfort conditions.
BMS Changes and Recommendations
Modifications to the I-vu system that would permit the minimum economizer positions of all units to be adjusted remotely from the BMS workstation is strongly recommended. Currently, the setting can only be modified by opening up the control panel of each RTU, plugging in a laptop, and changing the setting. This is time consuming and not even possible under certain weather conditions. The cost of this upgrade was estimated by James D. Warren and Co. to be $9,000.
It should be noted that in response to the COVID-19 pandemic (around September 2020), the landlord increased all of the economizer minimum positions to 15% and disabled the DCV system. The fresh air economizer was left in operation for free cooling.
LaBella believes that the DCV function could be left active without significant negative impacts on the facility’s safety, but it will not likely be activated very often unless the occupancy of the building is unusually high. The DCV control sequencing would keep the average CO2 levels from exceeding 800 ppm at any time. However, even with the DCV on the higher minimum position should be maintained. For the purpose of this report, it is recommended that DCV remains disabled when the building is in pandemic mode.
In order to verify ventilation adequacy it is recommended that Rosenblum maintain trends of CO2 levels for each air handler and review them periodically to make sure that the building is being properly ventilated. Based on the current DCV system’s setpoint, the CO2 levels should not exceed 800 ppm.

100 Great Oaks Boulevard
21
Energy Efficiency Package
Based on current industry guidance outlined in the Industry Guidance section, the following package of items provides additional protection for occupants but with lower energy use and operating costs than the first package.
UVGI in Rooftop Units Increase Filtration to MERV-13 Filters Decrease Outdoor Air Rate to 15% (reduced from 30% in ASHRAE Recommendations
Package) Pre/Post-Occupancy Purge
Installation of UVGI lamps permits the ventilation rate to be returned to code-minimum levels due to the increased equivalent air changes added by incorporating UVGI into the AHU ductwork. In this case, the cost of space conditioning is $18,985 less than the 30% case. The additional cost of operating the UVGI lamps is $389 per year but the additional maintenance cost is $1,232 for lamp replacement is per year. Installation costs are estimated at $4,737 for the UVGI system. This package also includes keeping MERV 13 filters and the $9,000 cost of the BMS upgrade. Savings analysis and cost estimates are found in Appendices C and D.
The Economic Analysis for this measure shown above is in comparison to the ASHRAE Recommendation Package, so the savings are positive and the package has a positive payback.
Discussion of Measures
Additional discussion of the measures included in the two packages is provided below.
Decreased Ventilation
As previously calculated the minimum percent OA required to meet current code is 15%, depending on the building’s actual occupancy. It is recommended that for the energy efficiency package, the building’s outdoor air rate is maintained at least at 15%.
If UVGI is implemented in the rooftop units, resulting in an increase in equivalent air changes in the unit, this allows for the buildings OA ventilation rate to be reduced from 30% (as recommended in the ASHRAE Recommendations Package) to 15% with the equivalent effectiveness. This will present energy saving by reducing the amount of outside air required to be conditioned.
As stated above in the previous section, efficient control of ventilation settings would require modifications to the I-vu system that would permit the minimum economizer positions of all units to be adjusted remotely from the BMS workstation. Once this is done, changes can be easily made for each RTU without going up to the roof and opening up each RTU control panel. The cost of this upgrade was estimated by James D. Warren and Co. to be $9,000.
In association with increased ventilation, it is recommend that indoor RH levels be trended and reviewed. Increased ventilation air is likely to decrease levels in the winter. If levels drop below

100 Great Oaks Boulevard
22
20%, or if there are complaints about excessive dryness, Rosenblum may want to or consider installing humidification or drop the ventilation level to the code minimum.
In the summer, the cooling should be capable of handling the additional outside air and managing the indoor RH levels. If levels increase over 60% on a regular basis, occupants will likely complain and printers may start to jamb more frequently. If this occurs, the economizer position can be dropped to the minimum code position based on the actual occupancy. This would permit the air to be overcooled to remove humidity and then reheated to maintain comfort. This is not generally recommended since it uses additional energy, but it does permit more precise control of humidity levels in the summer. Code implications would also have to be reviewed. Since the building obtains much of its electricity from roof-mounted solar, this measure may be more palatable.
As recommended in ASHRAE’s Building Readiness Guide, economizer operation can be controlled using OA quantity reset instead of supply air temperature reset. This control strategy uses enthalpy instead of dry bulb temperature and may be a more effective means of increasing OA intake while maintaining desired RH levels in the space.
Increased Filtration
All RTUs contain 2” MERV 8 filters. Both models use nine, 16”x25” filters. The filters are currently changed every three months. MERV 8 filters are typical for commercial facilities but fail to capture particles of 5 microns or less effectively and will not reduce the circulation of bacteria or viruses transported on these particles. Based on the size of the systems we estimate that the system total static pressure is 0.8 in. WC. The RTUs can accommodate 2”, MERV 13 filters which are readily available.
In both cases, it is recommended that MERV-13 is installed instead of MERV 8 filters. Covid-19 virus particles are reported to be about 0.12 microns in diameter (Mayo Clinic). Note from the graph that air filters perform the worst in the range from 0.1 to 0.5 microns. A MERV 8 removes less than 10% of particles in this size range while a MERV 13 removes 35 – 40% of particles. Higher MERV ratings are generally not practical in RTUs due to the increased static pressure. This could compromise air flow which would impact the performance of the conditioning system.
Since the filter changes are frequent (every 3 months) we expect that it can remain the same with MERV 13 filters. Our calculations assume that the final total static pressure with MERV 1`3 filters is 1.7 versus 1.5 for MERV 8 filters. The existing fans should be able to handle this increase with only a slight drop in air flow.
100 Great Oaks Boulevard
23
We recommend that an air balancer be brought to check clean and dirty pressure drops and air flows with both MERV 8 and MERV 13 filters on one 15 ton unit and one 17.5 ton unit. This information will make it possible to fine tune recommendations concerning filter change schedule and the impact of MERV 13 filters. Maintenance staff could also take pressure drop measurements themselves through purchase of a portable micro-manometer and take periodic readings to assess the need for filter changes. These are available for $200 and up. Test ports would have to be drilled in the sides of the RTUs to take measurements. They would likely discover that the required filter change frequency would change depending on the time of year.
Because of the frequent filter changes at the facility, the additional electrical cost for running the units with MERV 13 filters versus MERV 8 is quite low and estimated at $964 per year. MERV 8 filters are estimated to cost $2,840 per year for four filter changes. MERV 13 filters are estimated to cost $7,830 per year. Labor costs for both options are the same so the added cost of the MERV 13 filters is $4,990.
The total added cost for both energy and materials for this measure is $5,954.
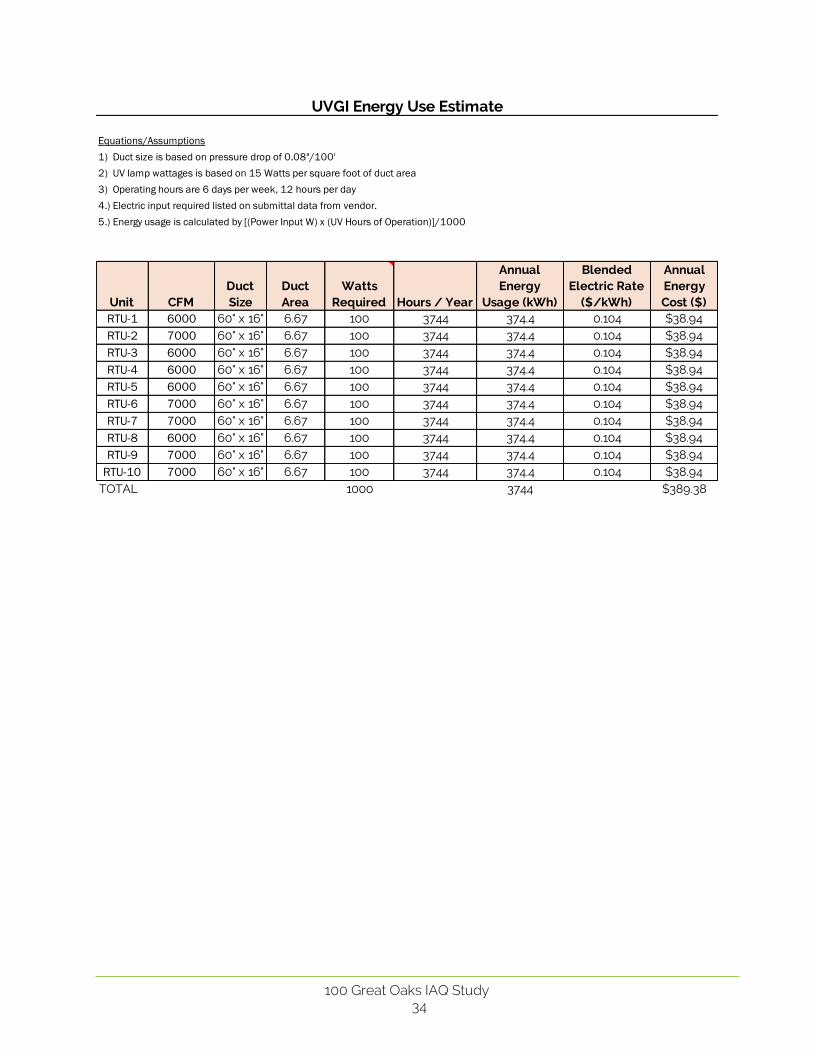
UVGI Installation
The building HVAC system is comprised of ten (10) RTUs. In the Carrier Centurion, the return air filter is immediately upstream of the cooling coil and the supply fan is immediately downstream of the cooling coil. Installation of UVGI inside the unit is not feasible.
It is recommend that UVGI is installed in the main return duct to each RTU. Based on site inspections, there appears to be ample space above the ceiling and fairly long runs of return duct to install UVGI lamps that would be accessible for maintenance and would also be completely hidden from view of building occupants.
The lamps should be switched off during unoccupied periods when the RTUs are not running. At this location, they will provide no benefit when there is no air flow. Since the lamps have a useful life of about 9,000 hours and the systems run under 4,000 per years, the lamps would have to be changed about every two years.
Bianco et al. (June, 2020) proves the virucidal effectiveness of UV-C lighting on the SARS-CoV-2 virus. The results from this study are consistent with similar viruses used to develop ASHRAE guidance, and indicate a 3-log inactivation at an irradiance of 3.7 mJ/cm2 and complete inhibition at an irradiance of 16.9 mJ/cm2. From the 2019 ASHRAE Handbook (Ch. 62) it is stated that the UV effectiveness is dependent on dose, which is a direct function of irradiance
2) and time of exposure. Combining the ASHRAE guidance and knowledge of UV’s effectiveness on the covid-19 virus, it is reasonable to conclude that the previous ASHRAE guidance on UVGI systems is applicable in this case.
According to the vendor-specified dose and time of exposure, it is estimated that the UV system’s effectiveness is 99% per pass through, although this claim is not backed by a third party independent study. The output of the specified UV system is > 420 W/cm2 at 1 meter with 360 degrees of distribution. Assuming an air speed of 500 fpm, the exposure time for this
100 Great Oaks Boulevard
24
application is 0.79 seconds. This information calculates the effectiveness of 99% assuming UV susceptibility with an inactivation rate constant of 0.014 cm2/J, which aligns with viruses of similar susceptibility.
Based on RTU operating hours of 3744 hours per year, the UV system would cost about $400 per year to run. Calculations are provided in Appendix C.
The installation cost is estimated at $17,159 as shown in Appendix D. This estimate is based on one set of lamps per RTU (10 total). If additional locations are needed to cover all return air paths, the cost could be higher.
Installation of UVGI lamps provides energy savings by permitting operation at lower than maximum ventilation levels, while still providing safety for occupants.
BMS Changes and Recommendations
Modifications to the I-vu system that would permit the minimum economizer positions of all units to be adjusted remotely from the BMS workstation is strongly recommended. Currently, the setting can only be modified by opening up the control panel of each RTU, plugging in a laptop, and changing the setting. This is time consuming and not even possible under certain weather conditions. The cost of this upgrade was estimated by James D. Warren and Co. to be $9,000.
It should be noted that in response to the COVID-19 pandemic (around September 2020), the landlord increased all of the economizer minimum positions to 15% and disabled the DCV system. The fresh air economizer was left in operation for free cooling.
LaBella believes that the DCV function could be left active without significant negative impacts on the facility’s safety, but it will not likely be activated very often unless the occupancy of the building is unusually high. The DCV would keep the average CO2 levels from exceeding 800 ppm at any time. However, even with the DCV on the higher minimum position should be maintained. For the purpose of this report, it is recommended that DCV remains disabled when the building is in pandemic mode.
In order to verify ventilation adequacy LaBella recommends that during post-pandemic operation, Rosenblum maintain trends of CO2 levels for each air handler and review them periodically to make sure that the building is being properly ventilated. The CO2 levels in the space verify proper ventilation rates.
Purge Mode
ASHRAE is recommending pre- and post-occupancy purge modes sufficient to reduce the concentration of airborne particles by 95%. This generally requires 3 total air changes. Calculations are presented in Appendix C of the purge time required to achieve 1 air change at a 15% damper position.
Easy implementation of this measure would require the I-vu upgrades discussed at the beginning of this section.

100 Great Oaks Boulevard
25
Pandemic Mode
The ASHRAE pandemic Mode recommendation includes increasing the outside air to the maximum possible. It is estimated that this is about 30% which we estimate would be the limit for year round operation of RTUs. This mode could be comfortably used during moderate weather conditions without causing excessive use of energy and without compromising indoor conditions. Easy implementation of this measure would require the I-vu upgrades discussed above.
Future Use of DCV
Rosenblum should not return the minimum dampers position to 5% without installing additional CO2 sensors in order to comply with current code requirements. There are two options to consider:
One CO2 sensor per tenant space One CO2 sensor per VVT zone
Only the second option would be close to being code compliant. The cost for this measure would be high – about $2,000 per zone. Since there are 61 zones, this would cost about $120,000. We estimate that the energy savings versus straight code ventilation would be under $10,000 per year, so the cost would be long – in excess of 12 years.

100 Great Oaks Boulevard
26
ASHRAE. (2017). ANSI/ASHRAE Standard 52.2 Method of Testing General Ventilation Air-Cleaning Devices for Removal Efficiency by Particle Size.
ASHRAE. (2019). ASHRAE Handbook, Chapter 62.
ASHRAE. (2020, 4 14). ASHRAE Position Document on Infectious Aerosols.
ASHRAE. (2020, 10 20). Building Readiness Guide.
Renat Manassypov, P. P. (July 2020). Evaluating Virus Containmnet Efficiency of Air-Handling Systems. ASHRAE Journal, 17-23.
Hugo L. David. (May 1971). Ultraviolet Light Inactivation and Photoreactivation in the Mycobacteria
Andrea Bianco, Italian National Institute for Astrophysics. (2020). UV-C irradiation is highly effective in inactivating SARS-CoV-2 replication.
Mousavi, E. (2020). Performance analysis of portable HEPA filters and temporary plastic anterooms on the spread of surrogate coronavirus.
Office of Research and Development National Homeland Security Research Center. (2006). Biological Inactivation Efficiency by HVAC In-Duct Untraviolet Light Systems.
100 Great Oaks Boulevard
27
Appendix A – Zone Summary
Appendix B – Floor Plans
Appendix C – Calculations
Appendix D – Cost Estimates
Appendix E – Utility Data
Appendix F– Project Summary Sheet


100 Great Oaks IAQ Study 27
Floor RTU Zone Suite Tenant CFM
1 4 1 105 CapCare 4535
1 4 2 105 CapCare
1 4 3 105 CapCare
1 4 6 105 CapCare
1 4 4 106 Bloom 1324
1 4 5 109 ACOG 1654
RTU 4 Totals 7,513
1 8 5 101 Gable
1 8 7 101 Gable
1 8 8 101 Gable
1 8 3 103 Pediatrics
1 8 4 103 Pediatrics
1 8 1 104 NYS Problem Gambling
1 8 2 104 NYS Problem Gambling
1 8 6 Lounge
RTU 8 Totals 8,018
2 3 2 112 GO Oral Surgery
2 3 5 112 GO Oral Surgery
2 3 6 112 GO Oral Surgery
2 3 1 114 Prime
2 3 3 114 Prime
2 3 4 114 Prime
RTU 3 Totals 6,556
2 5 3 110 Cordell
2 5 6 110 Cordell
2 5 7 110 Cordell
2 5 8 110 Cordell
2 5 2 111 Brown 605
2 5 1 113 Rosenblum 747
5 4 common common
RTU 5 Totals 4,508
1,911
3,565
2,991
3,156
3,491
2,616

100 Great Oaks IAQ Study 28
Floor AHU Zone Suite Tenant CFM
2 6 5 114 Prime 997
2 6 1 116 Stored Tech
2 6 2 116 Stored Tech
2 6 6 117 Manpower 1,293
2 6 3 118 VHB 743
2 6 4 117A LPS Lighting 1,029
RTU 6 Totals 6205
2 7 1 115 Westshore 747
2 7 3 118 VHB
2 7 4 118 VHB
2 7 5 118 VHB
2 7 6 118 VHB
2 7 2 119 EV Group 754
RTU 7 Totals 4,475
3 1 1 120 CGI
3 1 2 120 CGI
3 1 3 120 CGI
3 1 4 120 CGI
3 1 5 120 CGI
3 1 6 120 CGI
RTU 1 Totals 6,061
3 2 4 120 CGI 1,012
3 2 5 120 CGI 2,024
3 2 1 126 SNC 970
3 2 3 127 Feeny Centi 1,010
3 2 6 128 SDT 1,420
RTU 2 Totals 6,436
3 9 1 120 CGI 1012
3 9 2 121 Buckley
3 9 3 121 Buckley
3 9 4 123 Powers
3 9 5 123 Powers
3 9 6 123 Powers
RTU 9 Totals 6,847
3 10 6 122 Tabak 1524
3 10 1 123 Powers
3 10 2 123 Powers
3 10 3 124 Alliant
3 10 4 124 Alliant
3 10 5 124 Alliant
RTU 10 Totals 7,398
2,143
2,166
3,708
3,249
2,974
6,061
2,586

100 Great Oaks IAQ Study 29

100 Great Oaks IAQ Study 30

100 Great Oaks IAQ Study 31

100 Great Oaks IAQ Study 32

100 Great Oaks IAQ Study 33
100 Great Oaks IAQ Study 34
Equations/Assumptions
1) Duct size is based on pressure drop of 0.08"/100'
2) UV lamp wattages is based on 15 Watts per square foot of duct area
3) Operating hours are 6 days per week, 12 hours per day
4.) Electric input required listed on submittal data from vendor.
5.) Energy usage is calculated by [(Power Input W) x (UV Hours of Operation)]/1000
Unit CFMDuct Size
Duct Area
Watts Required Hours / Year
Annual Energy
Usage (kWh)
Blended Electric Rate
($/kWh)
Annual Energy Cost ($)
RTU-1 6000 60" x 16" 6.67 100 3744 374.4 0.104 $38.94RTU-2 7000 60" x 16" 6.67 100 3744 374.4 0.104 $38.94RTU-3 6000 60" x 16" 6.67 100 3744 374.4 0.104 $38.94RTU-4 6000 60" x 16" 6.67 100 3744 374.4 0.104 $38.94RTU-5 6000 60" x 16" 6.67 100 3744 374.4 0.104 $38.94RTU-6 7000 60" x 16" 6.67 100 3744 374.4 0.104 $38.94RTU-7 7000 60" x 16" 6.67 100 3744 374.4 0.104 $38.94RTU-8 6000 60" x 16" 6.67 100 3744 374.4 0.104 $38.94RTU-9 7000 60" x 16" 6.67 100 3744 374.4 0.104 $38.94
RTU-10 7000 60" x 16" 6.67 100 3744 374.4 0.104 $38.94TOTAL 1000 3744 $389.38
UVGI Energy Use Estimate

100 Great Oaks IAQ Study 35
Assumptions
0.104$ Blended Electric Rate ($/kWh)
10.62$ Electric Demand Rate ($/kW):
8.28$ Natural Gas Rate ($/MMBtu)
5% Pre-Pandemic Minimum Position OA %
15% Proposed Code OA % with no DCV
65,000 Total CFM
70 Occupied Winter Indoor Air Temperature Setpoint
50% Assumed Indoor RH setpoint58 Cooling Coil Leaving DB56 Cooling Coil Leaving WB
23.8 Cooling Coil Leaving Enthalpy
75% Assumed Heating Efficiency
13.20 Cooling Efficiency (IPLV)
Equations
Heating Required (BTUh) = (Air volume cfm)*(1.08)*(Supply Air Temperature-Ambient Temperature)/(Heating Efficiency)
Heating Required (MMBtu) = (Heating Btuh of Fuel Required)*(Total Conditioned Hours)/(1,000,000 Btu/mmBtu)
Cooling Required (BTUh) = (Air Volume cfm)*(4.5)*(Ambient Temperature Enthalpy-Space Temperature Enthalpy)
Increased OA Volume (CFM) = (total CFM) * (Proposed OA % - Existing % OA)
Temp BIN
OA Enthalpy
Btu/lbOccupied
HoursUnoccupied
Hours
Total Hours
per BIN
Increased OA
Volume
Additional Heating
Required (BTUh)
Additional Heating
Required (MMBtu)
Additional Cooling
Required (BTUh)
Additional Cooling
Required (Btu)97.5 41.1 5 0 5 6,500 - - 506,025 2,530,125
92.5 40.2 13 0 13 6,500 - - 479,700 6,236,100
87.5 36.2 59 2 61 6,500 - - 362,700 21,399,300
82.5 33.5 235 39 274 6,500 - - 283,725 66,675,375
77.5 31.1 279 141 420 6,500 - - 213,525 59,573,475
72.5 29.8 278 219 497 6,500 - - 175,500 48,789,000
67.5 27.4 312 370 682 6,500 - - 105,300 32,853,600
62.5 24.6 414 529 943 6,500 23,400 9,687,600
57.5 21.8 289 502 791 6,500 87,750 69
52.5 19 296 427 723 6,500 122,850 89
47.5 16.9 307 266 573 6,500 157,950 91 -
42.5 14.8 217 333 550 6,500 193,050 106 -
37.5 12.6 329 391 720 6,500 228,150 164 -
32.5 10.7 265 389 654 6,500 263,250 172 -
27.5 8.9 232 305 537 6,500 298,350 160 -
22.5 7.3 211 287 498 6,500 333,450 166 -
17.5 5.7 169 266 435 6,500 368,550 160 -
12.5 4.1 83 123 206 6,500 403,650 83 -
7.5 2.7 36 91 127 6,500 438,750 56 -
2.5 1.3 18 18 36 6,500 473,850 17 -
-2.5 -0.1 9 6 15 6,500 508,950 8 -
TOTALS 3,878,550 1,342 2,149,875 247,744,575
Additional Heating Cost = Additional Heating Required * Natural Gas Rate / Heating Efficiency = 14,810$ Additional Cooling Energy (kWh) = Cooling MMBtu / (IPLV*1000) = 18,769 Additional Cooling Cost ($) = Additional Cooling kWh * Blended Rate = 1,952$
Total Increased Cost 16,762$
Increased OA - Impact on Cooling & Heating LoadRaising Outside Air from 5% to 15%

100 Great Oaks IAQ Study 36
Assumptions 0.104$ Blended Electric Rate ($/kWh)10.62$ Electric Demand Rate ($/kW):8.28$ Natural Gas Rate ($/MMBtu)
15% Pre-Pandemic Minimum Position OA %30% Proposed Code OA % with no DCV
65,000 Total CFM70 Occupied Indoor Air Temperature Setpoint
50% Assumed Indoor RH setpoint58 Cooling Coil Leaving DB56 Cooling Coil Leaving WB
23.8 Cooling Coil Leaving Enthalpy75% Assumed Heating Efficiency13.20 Cooling Efficiency (IPLV)
EquationsHeating Required (BTUh) = (Air volume cfm)*(1.08)*(Supply Air Temperature-Ambient Temperature)/(Heating Efficiency)Heating Required (MMBtu) = (Heating Btuh of Fuel Required)*(Total Conditioned Hours)/(1,000,000 Btu/mmBtu)Cooling Required (BTUh) = (Air Volume cfm)*(4.5)*(Ambient Temperature Enthalpy-Space Temperature Enthalpy)Increased OA Volume (CFM) = (total CFM) * (Proposed OA % - Existing % OA)
Temp BIN
OA Enthalpy
Btu/lbOccupied
HoursUnoccupied
Hours
Total Hours
per BIN
Increased OA
Volume
Additional Heating Required (BTU/hr)
Additional Heating Required (MMBtu)
Additional Cooling Load
(BTU/hr)
Additional Cooling Required
(Btu)
97.5 41.1 5 0 5 9,750 - - 759,038 3,795,188 92.5 40.2 13 0 13 9,750 - - 719,550 9,354,150 87.5 36.2 59 2 61 9,750 - - 544,050 32,098,950 82.5 33.5 235 39 274 9,750 - - 425,588 100,013,063 77.5 31.1 279 141 420 9,750 - - 320,288 89,360,213 72.5 29.8 278 219 497 9,750 - - 263,250 73,183,500 67.5 27.4 312 370 682 9,750 - - 157,950 49,280,400 62.5 24.6 414 529 943 9,750 35,100 14,531,400 57.5 21.8 289 502 791 9,750 131,625 10452.5 19 296 427 723 9,750 184,275 13347.5 16.9 307 266 573 9,750 236,925 136 -42.5 14.8 217 333 550 9,750 289,575 159 -37.5 12.6 329 391 720 9,750 342,225 246 -32.5 10.7 265 389 654 9,750 394,875 258 -27.5 8.9 232 305 537 9,750 447,525 240 -22.5 7.3 211 287 498 9,750 500,175 249 -17.5 5.7 169 266 435 9,750 552,825 240 -12.5 4.1 83 123 206 9,750 605,475 125 -7.5 2.7 36 91 127 9,750 658,125 84 -2.5 1.3 18 18 36 9,750 710,775 26 --2.5 -0.1 9 6 15 9,750 763,425 11 -
5,817,825 2,012 3,224,813 371,616,863
Additional Heating Cost = Additional Heating Required * Natural Gas Rate / Heating Efficiency = 22,215$
Additional Cooling Energy (kWh) = Cooling Btu / IPLV /1000 = 28,153
Additional Cooling Cost ($) = Additional Cooling kWh * Blended Rate = 2,928$
Total Increased Cost 25,143$
Increased OA - Impact on Cooling & Heating LoadRaising Outside Air from 15% to 30%

Building Purge Calculations
UnitCombined
CFM
Design System
Total Input Power (kW)
OA at 15% OA
OA at 30% OA
Approximate Occupied
Square Footage
Room Volume
EEP Purge Time for 1
ACH (minutes)
ASHRAE Purge Time
for 3 ACH (minutes)
Annual kWh (1ach)
Annual kWh (3 ach)
Heating Energy Consumption
(1ach) (MMBtu)
Heating Energy Consumption
(3ach) (MMBtu)
Cooling Energy Consumption (1ach) (kWh)
Cooling Energy Consumption (3ach) (kWh)
RTU-1 6,000 63.3 900 1,800 6,436 57,924 10 29 2,648 7,945 1.82 10.95 21.6 129.7
RTU-2 7,000 73.9 1,050 2,100 6,847 61,623 9 26 2,817 8,452 1.94 11.65 23.0 138.0
RTU-3 6,000 63.3 900 1,800 6,556 59,004 10 30 2,698 8,093 1.86 11.15 22.0 132.1
RTU-4 6,000 63.3 900 1,800 7,513 67,617 11 34 3,091 9,274 2.13 12.78 25.2 151.4
RTU-5 6,000 63.3 900 1,800 4,508 40,572 7 20 1,855 5,565 1.28 7.67 15.1 90.8
RTU-6 7,000 73.9 1,050 2,100 6,205 55,845 8 24 2,553 7,660 1.76 10.55 20.8 125.0
RTU-7 7,000 73.9 1,050 2,100 4,475 40,275 6 17 1,841 5,524 1.27 7.61 15.0 90.2
RTU-8 6,000 63.3 900 1,800 8,018 72,162 12 36 3,299 9,898 2.27 13.64 26.9 161.6
RTU-9 7,000 73.9 1,050 2,100 6,847 61,623 9 26 2,817 8,452 1.94 11.65 23.0 138.0
RTU-10 7,000 73.9 1,050 2,100 7,398 66,582 10 29 3,044 9,132 2.10 12.58 24.8 149.1
OA levels are shown at code-min levels to show standalone impact of measure compared to pre-COVID baseline. 26,665 79,995 18.37 110.23 217.6 1,305.8
9 feet Room Height (EEP) (ASHRAE) (EEP) (ASHRAE) (EEP) (ASHRAE)
260 Assumed days of operation per year
According to equivalent air change calculations, the effectivness of 1 ach with 15% OA, UVGI, and a MERV-13 filter is 99.8%, which satifies the 95% effectiveness requirement for building purges per ASHRAE
The ASHRAE package shows the time required for 3 ach assuming 30% OA and MERV-13 filters.
Heating energy consumption = (1.08 * (OA CFM)(Indoor Space Temp - Weighted avg winter temp)/(heating efficiency))*(time for designated air changes in minutes/60 minutes per hour)(days of operation per year)/1000
Cooling energy consumption = (1.08 * (OA CFM)(Indoor Space Temp - Weighted avg winter temp)/(IPLV))*(time for designated air changes in minutes/60 minutes per hour)(days of operation per year)/1000
Weighted average temperatures calculated as the sum of (BIN occupied hours * BIN temperature) divided by the total unoccupied hours.
33.86 Weighted average winter temperature from unoccupied BIN data ASHRAE - Annual Electric Savings (kWh) (81,300.71)
85% Assumed Heating Efficiency ASHRAE - Annual Gas Savings (MMBtu) (110.23)
64.98 Weighted average summer temperature from unoccupied BIN data EEP - Annual Electric Savings (kWh) (26,882.60)
13.20 Assumed Cooling Efficiency (IPLV) EEP - Annual Gas Savings (MMBtu) (18.37)

Equivalent Air Changes Calculation99.00% Assumed UVGI Effectiveness %
20.00% Assumed M8 Filter Effectiveness based on ASHRAE 52.2
85.00% Assumed M13 Filter Effectiveness based on ASHRAE 52.2
5% Previous OA%
15% Baseline OA%
30% Proposed OA%
24.0000000% Percent of Particles Captured 1 ach No UVGI MERV-8 Filter 5% OA Baseline
42.2400000% Percent of Particles Captured 2 ach No UVGI MERV-8 Filter 5% OA Baseline
56.1024000% Percent of Particles Captured 3 ach No UVGI MERV-8 Filter 5% OA Baseline
74.6447462% Percent of Particles Captured 4 ach No UVGI MERV-8 Filter 5% OA Baseline
88.8696521% Percent of Particles Captured 5 ach No UVGI MERV-8 Filter 5% OA Baseline
89.5000000% Percent of Particles Captured 1 ach No UVGI MERV-13 Filter 30% OA ASHRAE Package
98.8975000% Percent of Particles Captured 2 ach No UVGI MERV-13 Filter 30% OA ASHRAE Package
99.884237500% Percent of Particles Captured 3 ach No UVGI MERV-13 Filter 30% OA ASHRAE Package
99.998723718438% Percent of Particles Captured 4 ach No UVGI MERV-13 Filter 30% OA ASHRAE Package
99.8725000% Percent of Particles Captured 1 ach UVGI MERV-13 Filter 15% OA EEP
99.9998374% Percent of Particles Captured 2 ach UVGI MERV-13 Filter 15% OA EEP
99.999999793% Percent of Particles Captured 3 ach UVGI MERV-13 Filter 15% OA EEP
100.000000000000% Percent of Particles Captured 4 ach UVGI MERV-13 Filter 15% OA EEP
Note: Manufacturer's claim of 99% UV effectiveness is based off of third party test results for similar viruses (Office of Research and Development National Homeland Security
Research Center, 2006). It is assumed that SARS-CoV-2 has a similar UV susceptibility in the application due to test results from the Italian National Institute for Astrophysics (2020).
Effectiveness calculation derived from communtative properties of multiplication and rated effectiveness of each individual component. For instance, if a unit has a filter that is 90%
effective and UVGI component that is 90% effective, the theoretical amount of contaminants not captured by the system is 10 percent of 10 percent, equating to 1% of particles
passing throught the system (99% effective).

100 Great Oaks IAQ Study 27

100 Great Oaks IAQ Study 28
100 Great Oaks IAQ Study 29
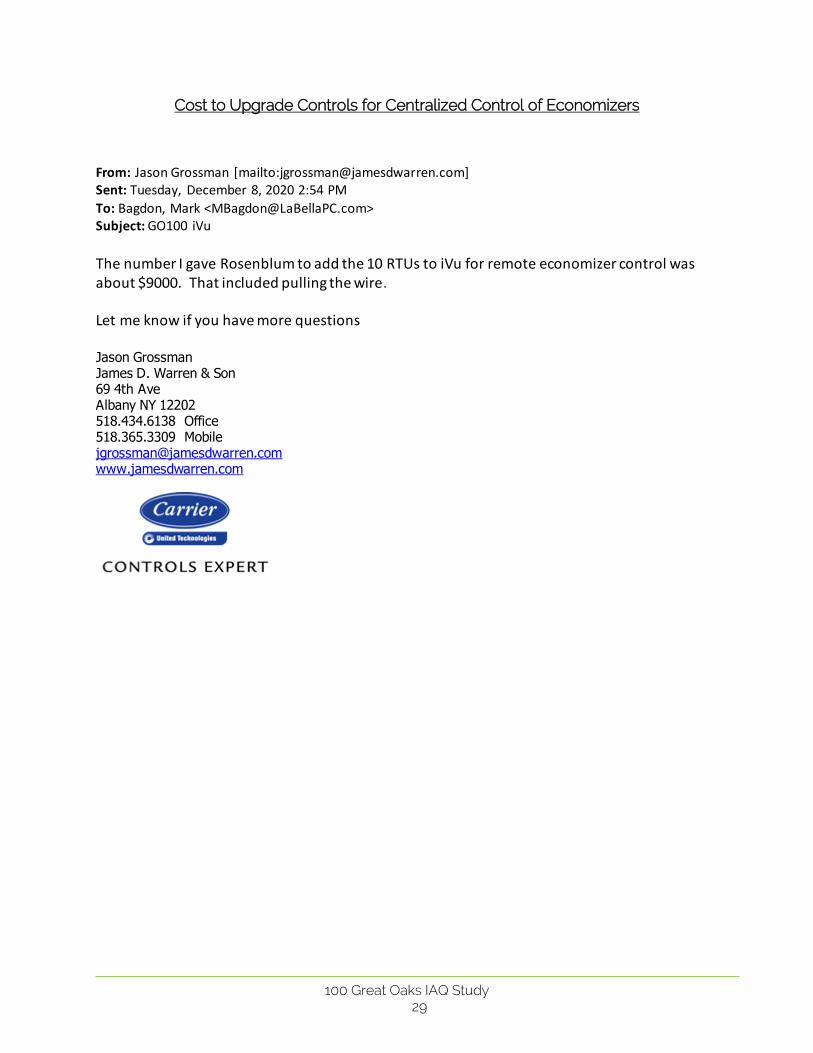
Cost to Upgrade Controls for Centralized Control of Economizers
From: Jason Grossman [mailto:[email protected]] Sent: Tuesday, December 8, 2020 2:54 PM
To: Bagdon, Mark <[email protected]> Subject: GO100 iVu
The number I gave Rosenblum to add the 10 RTUs to iVu for remote economizer control was about $9000. That included pulling the wire.
Let me know if you have more questions
Jason Grossman James D. Warren & Son 69 4th Ave Albany NY 12202 518.434.6138 Office 518.365.3309 Mobile [email protected] www.jamesdwarren.com
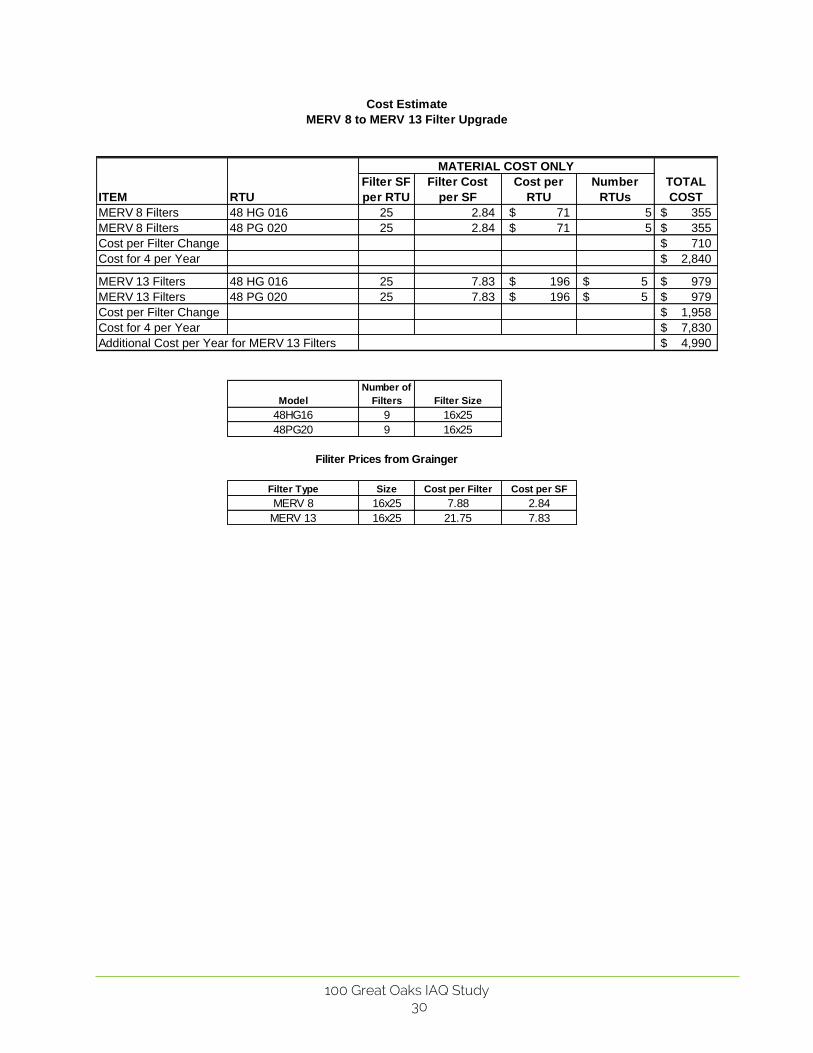
100 Great Oaks IAQ Study 30
MATERIAL COST ONLY
ITEM RTU
Filter SF
per RTU
Filter Cost
per SF
Cost per
RTU
Number
RTUs
MERV 8 Filters 48 HG 016 25 2.84 71$ 5 355$
MERV 8 Filters 48 PG 020 25 2.84 71$ 5 355$
Cost per Filter Change 710$
Cost for 4 per Year 2,840$
MERV 13 Filters 48 HG 016 25 7.83 196$ 5$ 979$
MERV 13 Filters 48 PG 020 25 7.83 196$ 5$ 979$
Cost per Filter Change 1,958$
Cost for 4 per Year 7,830$
Additional Cost per Year for MERV 13 Filters 4,990$
Model
Number of
Filters Filter Size
48HG16 9 16x25
48PG20 9 16x25
Filiter Prices from Grainger
Filter Type Size Cost per Filter Cost per SF
MERV 8 16x25 7.88 2.84
MERV 13 16x25 21.75 7.83
Cost Estimate
MERV 8 to MERV 13 Filter Upgrade
TOTAL
COST
100 Great Oaks IAQ Study 31

100 Great Oaks IAQ Study 32
Month- Year Days
Natural Gas Usage
(MMBtu)Propane
Usage (gal)#2 Fuel Oil Usage (gal)
Gasoline Usage (gal)
Natural Gas Costs
Propane Costs
#2 Fuel Oil Costs
Gasoline Costs
Fiscal Year 2019Jan-18 32 51 0 0 0 $331 $0 $0 $0
Feb-18 32 33 0 0 0 $267 $0 $0 $0
Mar-18 32 28 0 0 0 $259 $0 $0 $0
Apr-18 29 22 0 0 0 $190 $0 $0 $0
May-18 30 7 0 0 0 $81 $0 $0 $0
Jun-18 31 1 0 0 0 $37 $0 $0 $0
Jul-18 30 0.2 0 0 0 $27 $0 $0 $0
Aug-18 30 0 0 0 0 $26 $0 $0 $0
Sep-18 31 0.3 0 0 0 $27 $0 $0 $0
Oct-18 29 4 0 0 0 $51 $0 $0 $0
Nov-18 30 18 0 0 0 $138 $0 $0 $0
Dec-18 29 35 0 0 0 $284 $0 $0 $0
199 0 0 0 $1,718 $0 $0 $0
Jan-19 32 39 0 0 0 $346 $0 $0 $0
Feb-19 32 42 0 0 0 $316 $0 $0 $0
Mar-19 32 36 0 0 0 $251 $0 $0 $0
Apr-19 29 18 0 0 0 $148 $0 $0 $0
May-19 30 9 0 0 0 $82 $0 $0 $0
Jun-19 31 2 0 0 0 $38 $0 $0 $0
Jul-19 30 0.1 0 0 0 $26 $0 $0 $0
Aug-19 30 0.1 0 0 0 $26 $0 $0 $0
Sep-19 31 0.5 0 0 0 $28 $0 $0 $0
Oct-19 29 4 0 0 0 $50 $0 $0 $0
Nov-19 30 17 0 0 0 $124 $0 $0 $0
Dec-19 29 33 0 0 0 $229 $0 $0 $0
201 0 0 0 $1,664 $0 $0 $0
Jan-20 32 35 0 0 0 $262 $0 $0 $0
Feb-20 32 42 0 0 0 $292 $0 $0 $0
Mar-20 32 27 0 0 0 $203 $0 $0 $0
Apr-20 29 23 0 0 0 $158 $0 $0 $0
May-20 30 13 0 0 0 $88 $0 $0 $0
Jun-20 31 2 0 0 0 $35 $0 $0 $0
142 0 0 0 $1,038 $0 $0 $0
0
10
20
30
40
50
60
Jan Feb Mar Apr May Jun Jul Aug Sep Oct Nov Dec
MM
Btu
Natural Gas 2018 Natural Gas 2019 Natural Gas 2020

100 Great Oaks IAQ Study 33
Month- Year Days
Usage (kWh)
Peak Demand
(kW)Demand
Cost
Demand Rate
($/kW)Commodity
CostDelivery
Cost Total CostBlended
RateFiscal Year 2019
Jan-18 32 40,480 113.6 $1,146 $10.08 $5,768 $1,844 $7,612 $0.188
Feb-18 32 39,360 128.0 $1,285 $10.04 $2,777 $1,861 $4,638 $0.118
Mar-18 32 41,280 129.6 $1,298 $10.02 $1,738 $1,937 $3,674 $0.089
Apr-18 29 30,880 132.8 $1,349 $10.16 $1,064 $2,062 $3,126 $0.101
May-18 30 29,440 112.0 $1,148 $10.25 $1,304 $1,820 $3,123 $0.106
Jun-18 31 34,240 153.6 $1,574 $10.25 $1,651 $2,294 $3,945 $0.115
Jul-18 30 41,760 193.6 $1,984 $10.25 $2,742 $2,788 $5,531 $0.132
Aug-18 30 44,000 180.8 $1,853 $10.25 $2,996 $1,624 $4,620 $0.105
Sep-18 31 49,600 184.0 $1,886 $10.25 $3,287 $1,420 $4,707 $0.095
Oct-18 29 41,120 198.4 $2,034 $10.25 $2,464 $2,786 $5,249 $0.128
Nov-18 30 44,379 132.0 $1,353 $10.25 $1,673 $2,106 $3,780 $0.085
Dec-18 29 41,299 124.0 $1,271 $10.25 $2,431 $1,972 $4,403 $0.107
477,838 1,782.4 $18,180 $10.20 $29,894 $24,514 $54,408 $0.114
Jan-19 32 44,656 128.0 $1,311 $10.24 $2,721 $1,935 $4,655 $0.104
Feb-19 32 39,024 124.0 $1,270 $10.24 $2,466 $1,829 $4,296 $0.110
Mar-19 32 35,869 120.0 $1,229 $10.24 $1,884 $1,832 $3,716 $0.104
Apr-19 29 34,947 124.0 $1,313 $10.59 $1,285 $2,050 $3,335 $0.095
May-19 30 35,101 140.0 $1,508 $10.77 $1,476 $2,277 $3,753 $0.107
Jun-19 31 35,100 140.0 $1,508 $10.77 $1,272 $2,278 $3,550 $0.101
Jul-19 30 48,031 172.0 $1,852 $10.77 $2,296 $2,887 $5,182 $0.108
Aug-19 30 44,025 180.0 $1,939 $10.77 $2,147 $2,990 $5,137 $0.117
Sep-19 31 37,533 148.0 $1,594 $10.77 $1,699 $2,442 $4,141 $0.110
Oct-19 29 40,349 176.0 $1,896 $10.77 $1,076 $2,773 $3,849 $0.095
Nov-19 30 38,113 148.0 $1,594 $10.77 $1,414 $2,555 $3,969 $0.104
Dec-19 29 42,176 124.0 $1,335 $10.77 $1,683 $2,337 $4,021 $0.095
474,924 1,724.0 $18,348 $10.64 $21,420 $28,185 $49,605 $0.104
Jan-20 32 45,516 120.0 $1,297 $10.81 $1,917 $2,300 $4,216 $0.093
Feb-20 32 32,319 136.0 $1,473 $10.83 $939 $2,413 $3,352 $0.104
Mar-20 32 32,319 136.0 $1,473 $10.83 $939 $2,413 $3,352 $0.104
Apr-20 29 24,860 84.0 $912 $10.86 $629 $1,635 $2,264 $0.091
135,014 476.0 $5,155 $10.83 $4,424 $8,761 $13,185 $0.098
0
50
100
150
200
250
0
10,000
20,000
30,000
40,000
50,000
60,000
Jan Feb Mar Apr May Jun Jul Aug Sep Oct Nov Dec
Ele
ctri
c D
em
and
(kW
)
Ele
ctri
c U
sag
e (
kWh
)
2018 Usage (kWh) 2019 Usage (kWh)2020 Usage (kWh) 2018 Demand (kW)2019 Demand (kW) 2020 Demand (kW)

100 Great Oaks IAQ Study 34

100 Great Oaks IAQ Study 35
Electric
(kWh)
Natural Gas
(therms)
#2 Oil
(gallons)
#4 Oil
(gallons)
#6 Oil
(gallons)
Steam
(lbs.)
Propane
(gallons)
Coal
(tons)
Other
(MMBtu)
Baseline Energy Use 476,381.0 2,000.0
Average Utility Rate $0.10 $0.85
Baseline Annual Cost $52,007 $1,691
Supply
Savings
(kWh)
Demand
Savings
(kW)
R -3,744.0 -1.0 0.0 -0.7% -$1,855 -3.5% $17,159 -9.3
RME 28,153.0 0.0 2,012.0 115.5% $25,143 46.8% $1,200 0.0
ME -46,922.0 0.0 -3,354.0 -192.5% -$41,905 -78.0% $10,200 -0.2
R -9,269.0 -3.0 0.0 -1.7% -$5,954 -11.1% $0 0.0
ME -53,329.9 0.0 -0.3 -10.0% -$3,520 -6.6% $0 0.0
RME 26,665.0 0.0 0.2 5.0% $1,760 3.3% $0 0.0
-58,447 -4 -1,342 -84.4% -$26,331 -49.0% $28,559 -1.1
41,805 -4 2,012 118.0% $19,094 35.6% $18,359 1.0
TOTAL (All):
TOTAL (Recommended Only):
Purge (EEP)
Project
Cost
Simple
Payback
(Years)
UVGI in Duct Return (EEP)
Fuel
Savings
(MMBtu)
Energy
Savings
to Total
Baseline
Use (%) 3
Increased Ventilation (5% to 30%) (ASHRAE)
Increased Filtration (ASHRAE, EEP)
Purge (ASHRAE)
ENERGY SAVINGS SUMMARY
BASELINE ENERGY SUMMARY
Total Baseline Use
(MMBtu)
1,825.4Total Annual Cost
($)$53,698
Increased Ventilation (30% to 15%) (EEP)
Measure DescriptionMeasure
Status 1
Fuel
Savings
Type 2
ElectricAnnual
Cost
Savings
Cost
Savings
to Total
Annual
Cost (%) 4
I Implemented Elec Electric Btu 1,000,000
R Recommended NGas Natural Gas kWh 0.003412
RS Further Study Recommended Oil2 #2 Oil therms 0.1
NR Not Recommended Oil4 #4 Oil #2 gallon 0.139
RME Recommeded Mutually Exclusive Oil6 #6 Oil #4 gallon 0.1467
ME Mutually Exclusive to Recommended Option Steam District Steam #6 gallon 0.15
RNE Recommended Non-Energy LPG Propane Steam lbs. 0.0012
Coal Coal LPG gallon 0.0915
Other Other Coal tons 24
Fuel Saved MMBtu Conversion FactorsMeasure Status1 Notes:
Instructions:
* Unhide row s to enter more measures, as necessary
2 Fuel Savings Type: Indicate the reported MMBtu savings fuel type. Select the predominant fuel type if there are MMBtu
savings from multiple fuel sources3 Energy Savings to Total Fuel Baseline Use is a comparison of the total electric & fuel savings to the total baseline energy use4 Cost Savings to Total Annual Cost is a comparison of the total annual cost savings to the total baseline annual energy cost
* Energy savings must be presented as savings at the customer’s utility meter(s), not at the individual building or tenant space
* Fill in the light blue cells, as appropriate. White cells w ill auto-calculate.
* Update the baseline energy use conversion factors in the 'References' tab, as necessary