comprehensive feasibility study for a heat · pdf file16.12.2013 · comprehensive...
TRANSCRIPT

COMPREHENSIVE FEASIBILITY
STUDY FOR A HEAT AND/OR POWER
BIOMASS FACILITY AND EXPANDED
FOREST PRODUCTS UTILIZATION
IN MONO COUNTY, CALIFORNIA
Prepared for:
Mono County Community Development Department
Mammoth Lakes, California
Prepared by:
TSS Consultants
Rancho Cordova, California
December 16, 2013

Acknowledgments The authors wish to thank several individuals and organizations for their significant efforts in support of this project, specifically, the Eastside Biomass Project Team, a collaborative group of representatives from the Mammoth Lakes area:
• Wendy Sugimura, Mono County Community Development Department • Dan Lyster, Mono County Community Development Department • Brent Harper, Mammoth Lakes Fire Department • Byng Hunt, Mono County Supervisor • Dan Brady, Southern California Edison • Tedi Duree, Southern California Edison • Elissa Brown, Sierra Nevada Conservancy • Greg Cook, GC Forest Products • Jan Sudomier, Great Basin Unified Air Pollution Control District • Lara Kirkner, The Sheet News • Larry Johnston, Mono County Supervisor • Peter Bernasconi, Town of Mammoth Lakes • Scott Kusumoto, U.S. Forest Service, Inyo National Forest • Steve McCabe, Mammoth Mountain Ski Area
TSS would also like to thank the following individuals for their time and contributions:
• Tony Dublino, Mono County Solid Waste Department • Dale Johnson, Bureau of Land Management • Steve Nelson, Bureau of Land Management • Lois Klein, Mammoth Union School District • Annamaria Echeverria, U.S. Forest Service, Bridgeport Ranger District • Mandy Brinnand, U.S. Forest Service, Bridgeport Ranger District • Brian Adkins, Bishop Paiute Tribe • Paul McCahon, June Lake Fire District • Gary Myers, Mammoth Hospital • Deanna Campbell, Mammoth Community College • Danna Stroud, Sierra Nevada Conservancy
The TSS Consultants feasibility study team included:
• Tad Mason, Forester and CEO, Project Manager • Frederick Tornatore, Chief Technical Officer • Matt Hart, Renewable Energy Specialist

Table of Contents EXECUTIVE SUMMARY ............................................................................................................ 1
Background ................................................................................................................................. 1
Site Review and Analysis ........................................................................................................... 1
Biomass Feedstock Availability and Cost Analysis ................................................................... 1
Economic and Financial Feasibility Analysis ............................................................................. 2
Renewable Energy Technology Selection Process ..................................................................... 3
Permitting Plan............................................................................................................................ 3
Outreach and Communications Plan ........................................................................................... 3
Recommendations and Next Steps.............................................................................................. 4
SITE REVIEW AND ANALYSIS ................................................................................................. 5
Siting Filters ................................................................................................................................ 5
Critical Constraints ................................................................................................................. 5
Secondary Considerations ....................................................................................................... 6
Findings....................................................................................................................................... 6
BIOMASS FEEDSTOCK AVAILABILITY AND COST ANALYSIS........................................ 9
Feedstock Study Area ................................................................................................................. 9
Vegetation Cover and Land Ownership/Jurisdiction ................................................................ 10
Forest-Sourced Biomass ........................................................................................................... 17
Timber Harvest Residuals ..................................................................................................... 17
Fuels Treatment/Forest Restoration ...................................................................................... 21
Forest Products Manufacturing Residuals ................................................................................ 22
Urban-Sourced Biomass ........................................................................................................... 22
Agricultural Byproducts............................................................................................................ 24
Biomass Feedstock Competition Analysis ............................................................................... 24
Current Competition ............................................................................................................. 24
Potential Competition ........................................................................................................... 24
Biomass Feedstock Availability – Current Forecast ................................................................. 24
Costs to Collect, Process and Transport Biomass Material ...................................................... 25
Biomass Feedstock Supply Risks and Future Sources ............................................................. 25
Feedstock Supply Competition Risk Mitigation ................................................................... 25
Time of Year Availability ..................................................................................................... 26
Transport Cost ....................................................................................................................... 26
Feasibility Study for a Biomass Facility and Expanded Forest Products in Mono County i TSS Consultants

Housing and Construction..................................................................................................... 27
State and Federal Policies ..................................................................................................... 27
Potential Value-Added Market Opportunities for Biomass Feedstock ..................................... 28
Fuel Pellets as Biomass Feedstock ........................................................................................... 28
Five-Year Biomass Feedstock Pricing Forecast ....................................................................... 28
Findings..................................................................................................................................... 29
ECONOMIC AND FINANCIAL FEASIBILITY ANALYSIS ................................................... 30
Upfront Costs ............................................................................................................................ 30
Maintenance .............................................................................................................................. 32
Daily Inspections and Tasks ................................................................................................. 32
Annual Inspection and Tasks ................................................................................................ 32
Market Feasibility: Avoided Fossil Fuel Costs ......................................................................... 33
Mammoth Mountain Ski Resort: Garage .................................................................................. 33
Non-Profit Institutions .............................................................................................................. 34
Cash Flow Projections .............................................................................................................. 35
Incentive Programs ................................................................................................................... 37
Employment and Job Creation .................................................................................................. 37
Personnel Requirements........................................................................................................ 37
Training Requirements.......................................................................................................... 38
Findings..................................................................................................................................... 39
TECHNOLOGY REVIEW AND SELECTION PROCESS ........................................................ 40
Technology Overview ............................................................................................................... 40
Project Greenhouse Gas Impacts .............................................................................................. 40
Technology Vendors and Developers ....................................................................................... 41
Technology Selection Process .................................................................................................. 42
PERMITTING PLAN ................................................................................................................... 45
Air Quality Permitting .............................................................................................................. 45
Application Process .............................................................................................................. 45
Toxic Risk Assessment Policy .............................................................................................. 46
Permitting Schedule .............................................................................................................. 48
Findings..................................................................................................................................... 48
OUTREACH AND COMMUNICATIONS PLAN...................................................................... 49
RECOMMENDATIONS AND NEXT STEPS ............................................................................ 50
Feasibility Study for a Biomass Facility and Expanded Forest Products in Mono County ii TSS Consultants
List of Figures
Figure 1. Feedstock Study Area ..................................................................................................... 9 Figure 2. Vegetation Cover as a Percentage of Total Cover within the FSA .............................. 10 Figure 3. Vegetation Cover within the FSA ................................................................................ 11 Figure 4. Land Ownership/Jurisdiction within the FSA .............................................................. 13 Figure 5. Core Feedstock Study Area Vegetation Cover ............................................................. 15 Figure 6. Core Feedstock Study Area Ownership Map ............................................................... 16 Figure 7. California On-Highway Diesel Prices, 2007 to 2013 ................................................... 27 Figure 8. Project Timeline: Mammoth Mountain Ski Resort ...................................................... 50
List of Tables Table 1. Biomass Feedstock Material Practically Available by Source ........................................ 2 Table 2. Biomass Feedstock Material Delivered Costs ................................................................. 2 Table 3. Biomass Thermal Financial Analysis Findings ............................................................... 2 Table 4. Combined Heat and Power Siting Analysis ..................................................................... 7 Table 5. Thermal Only Siting Analysis ......................................................................................... 8 Table 6. Vegetation Cover Summary within the FSA ................................................................. 12 Table 7. Vegetation Cover Summary within the CFSA .............................................................. 17 Table 8. Land Ownership/Jurisdiction Forest Vegetation Cover within the CFSA .................... 17 Table 9. Timber Harvest Volume Produced within the CFSA as Reported by the California
Board of Equalization, 2008 to 2012 ................................................................................ 18 Table 10. Inyo National Forest Timber Harvest Volume, 2008 to 2012 ..................................... 19 Table 11. Wood Waste Receipts for Benton Crossing Landfill................................................... 23 Table 12. Biomass Feedstock Material Practically Available by Source, 2013 .......................... 24 Table 13. Biomass Feedstock Material Delivery Costs to Mammoth Lakes ............................... 25 Table 14. Biomass Feedstock Material Blend for a Thermal Energy Facility ............................. 28 Table 15. Five-Year Feedstock Pricing Forecast, 2013 to 2017 .................................................. 29 Table 16. Total Project Costs ....................................................................................................... 30 Table 17. Project Cost Breakdown .............................................................................................. 31 Table 18. Project Cost Breakdown Statistical Findings............................................................... 31 Table 19. Energy Cost Comparison ............................................................................................. 33 Table 20. Sensitivity Analysis for Mammoth Mountain Ski Resort Garage ............................... 34 Table 21. Sensitivity Analysis for Non-Profit Institution Installation ......................................... 34 Table 22. Annual Projected Cash Flow ....................................................................................... 35 Table 23. Projected Annual Cash Flow: 36 Months .................................................................... 36 Table 24. Greenhouse Gas Accounting for Biomass Thermal Projects....................................... 41 Table 25. Biomass Thermal Technology Providers and Developers ........................................... 42 Table 26. Selection Criteria ......................................................................................................... 42 Table 27. Project Criteria Pollutant Emissions: 2.0 MMBtu/hr Biomass Boilers ....................... 46 Table 28. Air Permitting Fee Schedule ........................................................................................ 48
Feasibility Study for a Biomass Facility and Expanded Forest Products in Mono County iii TSS Consultants

List of Appendices
Appendix A. TSS Comments on the Inyo National Forest Land Resource Management Plan Revisions Appendix B. Request for Proposals Template Appendix C. Authority to Construct Application Appendix D. Fuel Burning Equipment Form Appendix E. Great Basin Unified Air Pollution Control District’s Toxic Air Assessment Policy Appendix F. Frequently Asked Questions
Feasibility Study for a Biomass Facility and Expanded Forest Products in Mono County iv TSS Consultants

Abbreviations
Organizations ARB Air Resource Board BLM Bureau of Land Management BOE Board of Equalization EBPT Eastside Biomass Project Team EPA Environmental Protection Agency GBUAPCD Great Basin Unified Air Pollution Control District NDF Nevada Division of Forestry TSS TSS Consultants USDA United States Department of Agriculture USFS United States Forest Service
Other Terms ADC Alternative Daily Cover ATC Authority to Construct BDT Bone Dry Ton BTU, MMBTU British Thermal Unit, Million BTU C+D Construction and Demolition CCF Hundred Cubic Feet CEQA California Environmental Quality Act CFSA Core Feedstock Study Area CHP Combined Heat and Power CO Carbon Monoxide CO2 Carbon Dioxide CO2e Carbon Dioxide Equivalent CWPP Community Wildfire Protection Plan FPD Fire Protection District FSA Feedstock Study Area HVAC Heating Ventilation and Air Conditioning IOU Investor Owned Utility LRMP Land Resource Management Plan MBF Thousand Board Feet NF National Forest NOx Nitrogen Oxides O&M Operations and Maintenance PM, PM10, PM2.5 Particulate Matter, PM (<10 micrometers), PM (<2.5 micrometers) RFP Request for Proposals SB 1122 California State Senate Bill 1122 SB 32 California State Senate Bill 32 SO2 Sulfur Dioxide U.S. United States VOC Volatile Organic Compounds WBUG Woody Biomass Utilization Grant WUI Wildland Urban Interface
Feasibility Study for a Biomass Facility and Expanded Forest Products in Mono County v TSS Consultants

EXECUTIVE SUMMARY
Background
The Eastside Biomass Project Team (EBPT) is evaluating the feasibility of a community-scale bioenergy facility (thermal only, combined heat and power, or electricity only) using local sustainably-available forest biomass waste, utilizing local labor, and supporting the regional economy. The EBPT consists of representatives from the Inyo National Forest, Town of Mammoth Lakes, Mammoth Lakes Fire Protection District, Mono County, GC Forest Products, Inc., Sierra Nevada Conservancy and the Mammoth Mountain Ski Area. Southern California Edison and the Great Basin Unified Air Pollution Control District participate regularly and provide technical assistance. The EBPT retained TSS Consultants (TSS) to conduct a comprehensive feasibility study to ascertain the opportunity to site a bioenergy facility within the central Mono County and Mammoth Lakes area. The feasibility study focuses on the utilization of sustainably-available forest biomass sourced as a byproduct of forest management and fuels treatment programs.
Site Review and Analysis
Seven sites for locating a biomass combined heat and power (CHP) facility and seven additional sites for locating a biomass thermal project were reviewed in the Mammoth Lakes area. TSS found that several locations could be suitable for a biomass CHP facility using the high-level screens of accessibility, site size, potential for heat load, and zoning. As an initial evaluation, electrical interconnection potential was not considered. The most significant challenge facing CHP project development was found to be that projects with the potential for a heat offtake did not have sufficient size for winter feedstock storage and projects with sufficient acreage did not have a heat load. Both heat offtake potential and onsite storage are critical factors that influence a project’s economic performance. Of the seven sites reviewed for a biomass thermal facility, five of the seven had sufficient heat demand and proper infrastructure for the installation of a biomass boiler to displace fossil fuel consumption. The preferred sites include the Mammoth Ski Resort, the Mammoth Hospital, and the Mammoth Middle School (part of the Mammoth Unified School District).
Biomass Feedstock Availability and Cost Analysis
Sustainably-available biomass feedstock is limited in the Mammoth Lakes area because of the challenges accessing feedstock in the eastern half of the feedstock study area and limited annual forest harvest activities on federally managed lands (the major land management entity in the area). Table 1 summarizes (by feedstock source) the volumes of sustainably available feedstocks.
Feasibility Study for a Biomass Facility and Expanded Forest Products in Mono County 1 TSS Consultants

Table 1. Biomass Feedstock Material Practically Available by Source
BIOMASS MATERIAL SOURCE AVAILABILITY
(BDT/YR) Timber Harvest Residuals 2,864 Fuels Treatment Activity Residuals 225 Forest Products Manufacturing Residuals 285 Urban Wood Waste 1,945
TOTAL 5,319 Additional feedstock may be available in any given year based on episodic events such as wind events, wildfire, and insect kill; however, TSS does not consider these sources to be sustainable over the 20-year service life of a bioenergy project. This feedstock availably limits the potential for bioenergy development to a thermal project, as a 0.5 MW CHP project would require a minimum of 8,000 BDT per year to meet the recommended 2:1 feedstock coverage ratio. Feedstock pricing is illustrated in Table 2.
Table 2. Biomass Feedstock Material Delivered Costs
BIOMASS MATERIAL SOURCE LOW RANGE
($/BDT) HIGH RANGE
($/BDT) Timber Harvest Residuals $45 $60 Fuels Treatment Activity Residuals $25 $30 Forest Products Manufacturing Residuals $20 $25 Urban Wood Waste $25 $30
Economic and Financial Feasibility Analysis
The economic and financial feasibility analysis utilized publically available data from the U.S. Department of Agriculture (USDA) Forest Service (USFS) Fuels for Schools and Beyond Program. Fuels for Schools is a program focused on developing small-scale biomass thermal projects at schools across Washington, Oregon, Idaho, Montana, Nevada, and Alaska. Utilizing actual financial costs (averages and ranges) from these projects and the biomass feedstock availability and cost analysis, TSS developed a financial pro forma to review the potential for a 2 MMBtu per hour biomass thermal project. Findings are displayed in Table 3.
Table 3. Biomass Thermal Financial Analysis Findings
SCENARIO 1 SCENARIO 2 SCENARIO 3 SCENARIO 4 Total Project Cost ($) $353,488 $548,396 $548,396 $700,000 Propane Displaced (gal/yr) 53,188 45,209 45,209 39,891 Cost of Propane ($/gal) 3.38 3.38 2.15 2.15 Price of Biomass ($/BDT) $25 $30 $30 $35 Additional O&M Personnel Costs ($/yr) $4,745 $9,490 $9,490 $14,235 Additional O&M Equipment Costs ($/yr) $1,000 $4,500 $4,500 $7,000 IRR 46.6% 23.4% 12.8% 6.1% Simple Payback Period (yr) 2.1 4.2 7.4 12.7
Feasibility Study for a Biomass Facility and Expanded Forest Products in Mono County 2 TSS Consultants

The financial feasibility of biomass thermal projects depends on the cost of the displaced fossil fuel (comparing scenarios 2 and 3) and the capital cost of the project (comparing scenarios 1 and 2 and scenarios 3 and 4). A financial assessment of each individual project should be conducted to better understand the viability of a specific project with a focus on the annual heat demand, capital cost, avoided fossil fuel costs, and the needs of the collocated enterprise. Due to the relatively small feedstock demand and the low operational requirements, one biomass thermal installation is not expected to generate additional jobs in the local area in either the forestry sector or with the organization with which the unit is located; however, the installation is expected to support existing jobs and if scaled to multiple units in the region could create additional employment opportunity.
Renewable Energy Technology Selection Process
TSS recommends that any organization planning to install a biomass boiler select their preferred technology based on a competitive bid process. The feasibility report provides a list of technology vendors and developers that operate in the range appropriate for thermal applications in the Mammoth Lakes regions (Table 25). As with any capital investment, there are more factors that influence technology selection than strictly cost, and each organization should review and prioritize specific selection criteria (Table 26) before selecting a developer. TSS has developed a request for proposals template that can be used to initiate the competitive bid process (Appendix B).
Permitting Plan
The installation of a biomass thermal system to replace an existing heating system does not require any additional land use entitlements. Thus, it has been determined that the only environmental permit required for a biomass thermal system would be an air quality permit from the GBUAPCD. It is expected that a biomass-fueled boiler systems in the Mammoth Lakes area and at the preferred sites previously identified will have very low air pollutant emissions due to the relatively small size. The direct combustion of woody biomass in a thermal boiler system will result in the potential release of toxic air contaminants. The release of toxic air contaminants is governed by GBUAPCD policy, which will present challenges to the siting of biomass thermal units at certain sites within the Mammoth Lakes area, particularly those near residential dwelling units. The Mammoth Mountain Ski Resort Maintenance building is remote enough from sensitive receptors that the GBUAPCD Toxic Risk Assessment Policy has relatively small effect on siting a biomass thermal unit at that location.
Outreach and Communications Plan
Biomass thermal projects do not require the same level of community outreach as is recommended for a biomass CHP development project. The replacement and retrofit of a heating system does not trigger a California Environmental Quality Act (CEQA) review and
Feasibility Study for a Biomass Facility and Expanded Forest Products in Mono County 3 TSS Consultants

therefore does not open the project to public comment. However, TSS recommends that educational documentation be provided to stakeholders to provide information to those who are interested (Appendix F).
Recommendations and Next Steps
This feasibility study found that a small-scale biomass thermal facility, co-located at the Mammoth Mountain Resort maintenance facility, is a financially viable option to augment an existing propane fired boiler. Locally available biomass feedstocks are readily available, the project can be permitted, the biomass conversion technology is available, and the Mammoth Lakes community appears to be supportive. Critical next steps include beginning discussion with feedstock supply contractors and the Benton Crossing landfill, commencing the technology selection process (using RFP provided by TSS as a template), and strengthening outreach to others to identify options for additional use of thermal energy.
Feasibility Study for a Biomass Facility and Expanded Forest Products in Mono County 4 TSS Consultants

SITE REVIEW AND ANALYSIS Site selection for a community-scale biomass facility requires in-depth analysis of a site and its attributes to determine the benefits and challenges that each unique site offers. To identify preferred sites, TSS utilized coarse filters to focus the search and to select a targeted list of preferred sites. Preliminary screens include three critical constraints and five secondary considerations that can be potentially mitigated. TSS reviewed potential sites for biomass CHP and biomass thermal application. Sites were identified by the EBPT and through satellite imagery of Mammoth Lakes.
Siting Filters
Critical Constraints 1) Land Use: Land use refers to the designation of the potential site as determined by the
2013 Mono County General Plan. Land use designations identify the allowable uses for a particular site and indicate the appropriate steps to comply with the area’s intended use. Based on the 2013 Land Use Designations, the designation types listed below would allow a biomass conversion facility with a Conditional Use Permit. Any other designation would require amendment to the General Plan, which can be a time-intensive and often costly endeavor.
a. Allowable Designations: Industrial. b. Potential Designations: Resource Extraction, Industrial Park, Public and Quasi-
Public Facilities, Agriculture, Specific Plan.
2) Space: Due to seasonal availability of biomass feedstocks (weather constraints), biomass availability will be limited during parts of the year due primarily to inclement weather. To allow for the facility’s footprint and feedstock storage, TSS recommends a minimum size of two acres for a site located in the Mammoth Lakes Region. For sites larger than two acres, TSS will further evaluate the location to identify a facility’s maximum capacity based on technology type and feedstock storage requirements.
3) Access: Biomass facilities, at any scale, must allow for access by chip van to deliver feedstock. Chip vans are typically classified as California Legal Truck Tractor – Semitrailers and adhere to the STAA1 Truck Tractor classifications. In the Mono Lakes Region, U.S. Highway 395, State Highway 182 and 167, and State Highway 120 west of U.S. Highway 395 are built to allow for all California Legal Truck Tractor – Semitrailers. State Highway 120 east of U.S. Highway 395 is a California Legal Advisory Route and has posted restrictions based on weight and length. Proximity to these major transportation networks is critical for feedstock delivery.
1 Surface Transportation Assistance Act, 1982.
Feasibility Study for a Biomass Facility and Expanded Forest Products in Mono County 5 TSS Consultants

Secondary Considerations
1) Heat Load: The production of thermal energy using biomass material as a primary feedstock can be very cost effective. Displacing fossil fuel consumption can greatly enhance the economics of any biomass conversion project. Considerations include:
a. How high is the current heat demand? b. What is the demand profile (the heat demand over time)? c. How far away (from the proposed biomass conversion facility) is the heat load?
2) Power: The availability of onsite load displacement will determine the net metering or
excess power sales potential which may enhance the economics of biopower production. For projects that plan to export power, the existing utility infrastructure is important. Online tools are available for a cursory analysis of the local electric grid.
3) Sensitive Receptors: Nearby residential dwellings and businesses can be regarded as sensitive receptors and must be considered when examining the impacts of a biomass project.
4) Water Availability: What is the accessibility of water? If water is not available onsite, what are the options for bringing water to the site? Note that not all technologies require water, although all sites will require a domestic water supply.
5) Water Discharge: What are the options for domestic and industrial wastewater discharge? Note that some technologies produce minimal quantities of wastewater that can be trucked to an appropriate water treatment facility when necessary.
Findings
The Mammoth Lakes area has the potential to site a biomass CHP facility; however, siting will be challenging, as there are no sites that offer appropriate space, sufficient heat loads, and proper zoning. Of the sites reviewed, many provided two of these three major criteria with the trade-off typically consisting of sufficient space without a heat load or a heat load without sufficient space. Heat load and space are critical to a project’s economic outlook because a heat load offers a market for waste heat and sufficient space (for onsite feedstock storage) allows the feedstock to be handled only once. The potential for siting a biomass thermal facility is favorable in the Mammoth Lakes area where the temperature profile may require heating of buildings throughout the majority of the year. The EBPT and TSS identified seven potential sites for thermal applications and found that six of these sites have appropriate infrastructure for thermal energy retrofit. The findings from the site analysis are shown in Table 4 and Table 5.
Feasibility Study for a Biomass Facility and Expanded Forest Products in Mono County 6 TSS Consultants

Table 4. Combined Heat and Power Siting Analysis
LOCATION AERIAL IMAGE ZONING SPACE INFRASTRUCTURE OTHER
McFlex Parcels/ Mammoth Hospital
General Plan: Institutional Public Zoning: Public and Quasi Public
This site would require off-site feedstock storage.
None The site is near several sensitive receptors including the hospital, schools, and a residential area.
Mammoth Unified School District
General Plan: Institutional Public Zoning: Public and Quasi Public
This site would allow for onsite feedstock storage.
Would need to identify an appropriate vehicle access route.
The site is near several potential sensitive receptors including the hospital, schools, residential area, and RV park. This site may have restricted use based on the ownership structure.
Sierra Business Park
General Plan: Industrial Zoning: Industrial
This site would allow for onsite feedstock storage.
None There is limited potential for heat demand.
Old Sheriff Substation
General Plan: Public and Quasi Public Zoning: Public and Quasi Public
This site would allow for onsite feedstock storage.
None There is no potential for heat demand.
Mammoth Disposal/Transfer Station
General Plan: Institutional Public Zoning: Industrial
This site would require off-site feedstock storage.
None The site is currently occupied by tenants and there is not public support for further development of the site.
South Gateway Facilities
General Plan: Institutional Public Zoning: Public and Quasi Public
This site would allow for onsite feedstock storage.
None
There are already conceptual development plans for this site from the Community College. Additionally, a public biking and hiking path is nearby which may create public opposition.
Mammoth Ski Area
Operated under a Special Use Permit by the USFS
This site would allow for onsite feedstock storage.
None
The USFS requires that private sites be evaluated for this type of project before consideration for development on public lands.
Feasibility Study for a Biomass Facility and Expanded Forest Products in Mono County 7 TSS Consultants

Table 5. Thermal Only Siting Analysis
LOCATION EXISTING SYSTEM CURRENT FUEL DEMAND
AND PRICE POTENTIAL CONSTRAINTS
Mammoth Hospital Two 1.6 MMBtu/hr units and two 4.0 MMBtu/hr units.
Some residential propane HVAC system while diesel boilers are the primary heat source. 122,000 gal/yr of diesel at $3.38/gal (~$412,000/yr).
Space constraints for adequate woodchip storage and for delivery truck traffic may be challenging. There may be additional criteria for air permitting as the hospital is considered a sensitive receptor.
Mammoth Unified School District: Elementary School
Two 850,000 Btu/hr boilers and one 660,000 Btu/hr boiler generating hot water.
The propane usage was an aggregated number for the district (~$286,000/yr) at $3.66/gal.
Space constraints for adequate woodchip storage and for delivery truck traffic may be challenging. There may be additional criteria for air permitting as the school is considered a sensitive receptor.
Mammoth Unified School District: Middle School
Two 2.05MMBtu/hr boilers generating hot water.
The propane usage was an aggregated number for the district (~$286,000/yr) at $3.66/gal.
Space constraints for adequate woodchip storage and for delivery truck traffic may be challenging. There may be additional criteria for air permitting as the school is considered a sensitive receptor.
Mammoth Unified School District: High School
Does not use a centralized boiler system. N/A N/A
Cerro Coso Community College: Mammoth Campus
Two Units: 630,000 Btu/hr to generate hot water.
The propane usage was approximately 8,900 gal/yr at $1.70-$3.55/gal (~$24,000/yr)
There are potential space constraints at the community college campus. Additionally, the boilers only service the college and not the surrounding student residences.
Mammoth Ski Area: Canyon Lodge
2 MMBtu/hr used for snowmelt.
The propane usage was approximately 20,000 gal/yr at $2.15/gal (~$43,000)
Space limitations at the lodge due to high customer traffic. Road access to the garage in the winter could be challenging with the increased snow loads compared to the town. Steep grade on the incoming roadway may be challenging.
Mammoth Ski Area: Garage
Two Units: 2.5 MMBtu/hr to generate hot water.
The propane usage was approximately 50,000-60,000 gal/yr at $2.15/gal (~$118,250/yr)
Road access to the garage in the winter could be challenging with the increased snow loads compared to the town. Steep grade on the incoming roadway may be challenging.
Feasibility Study for a Biomass Facility and Expanded Forest Products in Mono County 8 TSS Consultants
BIOMASS FEEDSTOCK AVAILABILITY AND COST ANALYSIS The site review indicated the potential for CHP or thermal-only biomass development in the Mammoth Lakes region. The Biomass Feedstock Availability and Cost Analysis addresses the potential for sourcing biomass feedstock in areas tributary to Mammoth Lakes. Woody biomass material sources considered in this analysis include a range of forest and wood waste management activities:
• Timber harvest residuals – limbs and treetops generated during commercial timber harvest activities;
• Fuels reduction and forest restoration residuals – ladder fuels such as limbs, brush, and small stems removed as a result of forest fuels reduction activities;
• Forest products manufacturing residuals – bark, sawdust, chips; and • Urban or agricultural-sourced biomass potentially available for the proposed facility.
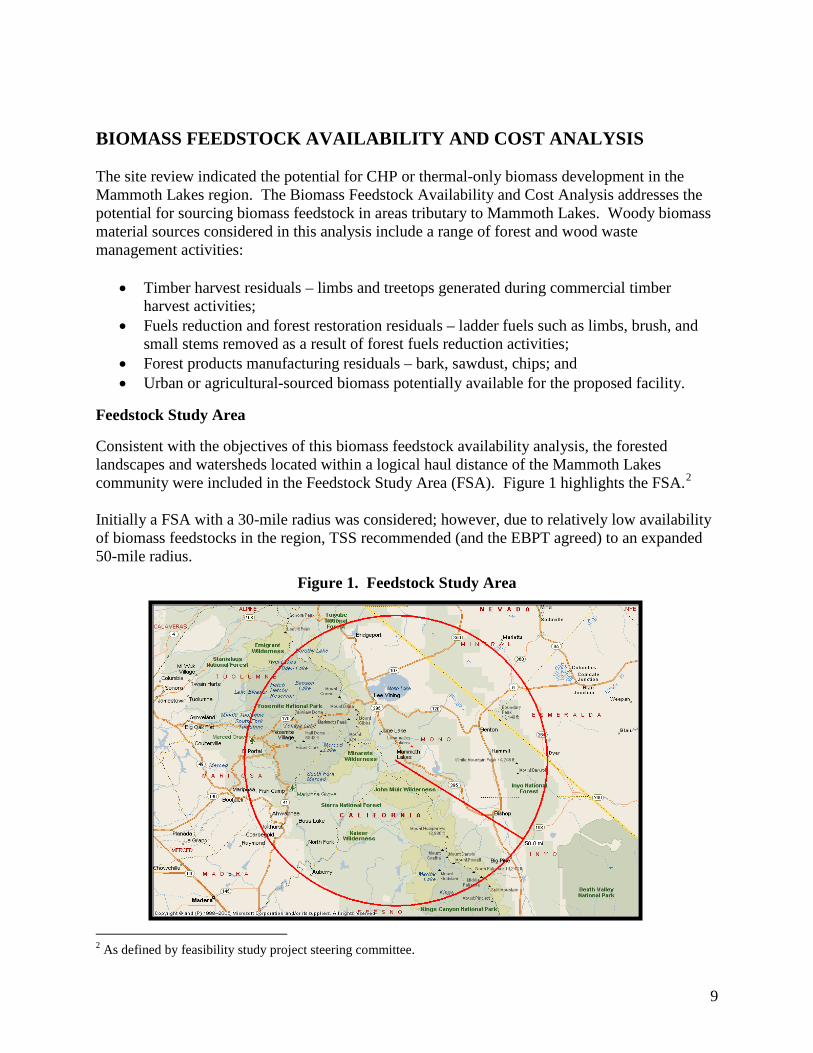
Feedstock Study Area
Consistent with the objectives of this biomass feedstock availability analysis, the forested landscapes and watersheds located within a logical haul distance of the Mammoth Lakes community were included in the Feedstock Study Area (FSA). Figure 1 highlights the FSA.2 Initially a FSA with a 30-mile radius was considered; however, due to relatively low availability of biomass feedstocks in the region, TSS recommended (and the EBPT agreed) to an expanded 50-mile radius.
Figure 1. Feedstock Study Area
2 As defined by feasibility study project steering committee.
9

Vegetation Cover and Land Ownership/Jurisdiction
Woody biomass availability for any given region is heavily dependent on vegetation cover, land management objectives, and land ownership. Vegetation cover within the Mammoth Lakes FSA is predominantly shrub and non-forested (primarily desert) at 51%, coniferous at 25%, and pinyon juniper at about 10% of the landscape. The predominant vegetation cover types with the FSA are shown graphically in Figure 2 and in a map in Figure 3.
Figure 2. Vegetation Cover as a Percentage of Total Cover within the FSA
Aspen, 4.3%
Conifer, 24.6%
Nonforested, 20.9%
Other Forest Type, 8.3%
Pinyon-Juniper, 9.4%
Shrub, 30.6%
Water, 1.9%
10

Figure 3. Vegetation Cover within the FSA
11

Vegetation cover types significantly influence woody biomass availability. Depending on management objectives, certain cover types could generate significant volumes of woody biomass material for use as feedstocks for value-added utilization. Table 6 summarizes vegetation cover by category within the FSA.
Table 6. Vegetation Cover Summary within the FSA
COVER CATEGORIES ACRES
PERCENT OF TOTAL
Aspen 216,657 4.3% Conifer 1,237,034 24.6% Non-Forested 1,052,187 20.9% Other Forest Type 415,924 8.4% Pinyon Juniper 473,883 9.4% Shrub 1,537,747 30.6% Water 93,766 1.9%
TOTALS 5,027,198 100.0% Land ownership influences vegetation management objectives and within the FSA, the USFS is the prevalent land manager with responsibility for approximately 57% of the landscape. Private land makes up about 7% and the Bureau of Land Management (BLM) makes up 14%. Federal land management agencies (USFS and BLM) together manage approximately 67% of the landscape. Federal jurisdiction and management objectives have a significant influence regarding woody biomass material availability within the FSA. Figure 4 highlights the locations of the various ownerships and jurisdictions.
12

Figure 4. Land Ownership/Jurisdiction within the FSA
13

Due to transport logistics (e.g., topography, road systems) associated with the crest of the Sierra Nevada Range, much of the FSA is not economically accessible for the recovery and transport of woody biomass material. In addition, certain jurisidictions such as State Parks, National Parks and USFS wilderness areas will not be generating sustainable volumes of forest biomass material due to the fact that management objectives for these jurisdictions do not include active vegetation management. Adjustments were made to the FSA base map (50-mile radius of Mammoth Lakes) to develop a Core Feedstock Study Area (CFSA) map and database:
• Only include those counties that are within economic haul distance of Mammoth Lakes (Mono, Inyo, Mineral, Esmeralda); and
• Remove State Parks, National Parks and USFS wilderness areas. TSS developed a CFSA map and corresponding vegetation (Figure 5) and land ownership (Figure 6) data. Table 7 and Table 8 summarize land ownership and jurisdiction within the CFSA.
14

Figure 5. Core Feedstock Study Area Vegetation Cover
15

Figure 6. Core Feedstock Study Area Ownership Map
16

Table 7. Vegetation Cover Summary within the CFSA
COVER CATEGORIES ACRES
PERCENT OF TOTAL
Aspen 64,094 2.4% Conifer 182,610 6.8% Non-Forested 448,882 16.8% Other Forest Type 78,784 2.9% Pinyon Juniper 470,874 17.6% Shrub 1,370,369 51.2% Water 63,305 2.3%
TOTALS 2,678,918 100.0%
Table 8. Land Ownership/Jurisdiction Forest Vegetation Cover within the CFSA
LAND OWNER/MANAGER
FORESTED ACRES
PERCENT OF TOTAL
BLM 84,677 10.6% Humboldt-Toiyabe NF 201,286 25.3% Inyo NF 462,895 58.1% Other Public 13,677 1.7% Private 33,826 4.3%
TOTALS 796,362 100.0%
Forest-Sourced Biomass
Timber Harvest Residuals Timber harvest residuals can provide significant volumes of woody biomass material. Typically available as limbs, tops, and unmerchantable logs, these residuals are byproducts of commercial timber harvesting operations. As such, these residuals have no merchantable value but can be a relatively economic raw material feedstock supply for value-added woody biomass utilization. Once collected and processed using portable chippers or grinders, this material is an excellent biomass feedstock source for fuel or feedstock for compost/mulch. Small, nonmerchantable logs that do not meet sawlog or firewood specifications could also be recovered from timber harvest operations. In some cases the larger logs (e.g., 6” and larger diameter measured small end inside bark) command a higher market value, which could leave the smaller logs available (e.g., under 6” diameter) for value-added utilization. These smaller logs could be diverted to value-added uses such as post/poles or as raw material feedstock for animal bedding, compost or landscape cover. Commercial timber harvest activity within the State of California is monitored by the State Board of Equalization (BOE). The BOE levies timber harvest taxes based on annual timber harvest levels. A review of the 2008 through 2012 timber harvest data was conducted to confirm historic timber harvest activities within the CFSA. Table 9 provides the results.
17

Table 9. Timber Harvest Volume Produced within the CFSA as Reported by the California Board of Equalization, 2008 to 2012
COUNTY 2008
(MBF/YR) 3 2009
(MBF/YR) 2010
(MBF/YR) 2011
(MBF/YR) 2012
(MBF/YR) Inyo 0 0 0 0 0 Mono 0 13 0 30 2,349 TOTALS 0 13 0 30 2,349
Results of the historic timber harvest figures from the BOE confirm that commercial sawlog harvest levels over the last five years have only been conducted on public lands and have been minimal. Discussions with Inyo National Forest (NF) staff4 confirmed that there have been very few sawlog removals from the Inyo NF in recent years. The BOE reporting of 2,349 MBF in 2012 is as a result of a wind event timber salvage project known as the Red Devil Stewardship Project. Wind storms are an episodic event and do not represent an historic trend that can be used to forecast forest biomass availability. The primary market driver influencing active timber management for any given region typically is demand for sawlogs. Interviews with timber sale purchasers5 active in the region (Inyo NF and Humboldt-Toiyabe NF) confirmed that sawlog markets are currently non-existent. Proximity to forest products manufacturing facilities is a major influence on sawlog pricing, and the closest sawmill to the Mammoth Lakes region is Sierra Forest Products at Terra Bella, California (300 road miles from Mammoth Lakes). As noted in Table 3, the Inyo NF manages 58% of the forested vegetation within the CFSA. Interviews with USFS staff6 and BLM staff7 confirmed that all of the timber sale and harvest activities within the CFSA are concentrated on the Inyo NF. These interviews also confirmed that almost all of the logs removed during the implementation phase of forest management activities on the Inyo NF were utilized for firewood (both commercial use and personal use firewood). This helps to explain why the California BOE has been reporting such low commercial sawlog harvest figures. USFS staff provided historic data regarding total log harvest trends for the last five years on the Inyo NF. Table 10 summarizes data provided.
3 MBF = thousand board foot measure. One board foot is nominally 12” long by 12” wide and 1” thick. 4 Scott Kusumoto, Inyo NF, BLM Interagency Vegetation Management Team. 5 Greg Cook, owner, Greg Cook Forest Products. Dave Noble, owner, South Bay Timber. 6 Scott Kusumoto, Inyo NF, BLM Interagency Vegetation Management Team. 7 Dale Johnson, BLM,Supervisory Natural Resources Specialist.
18
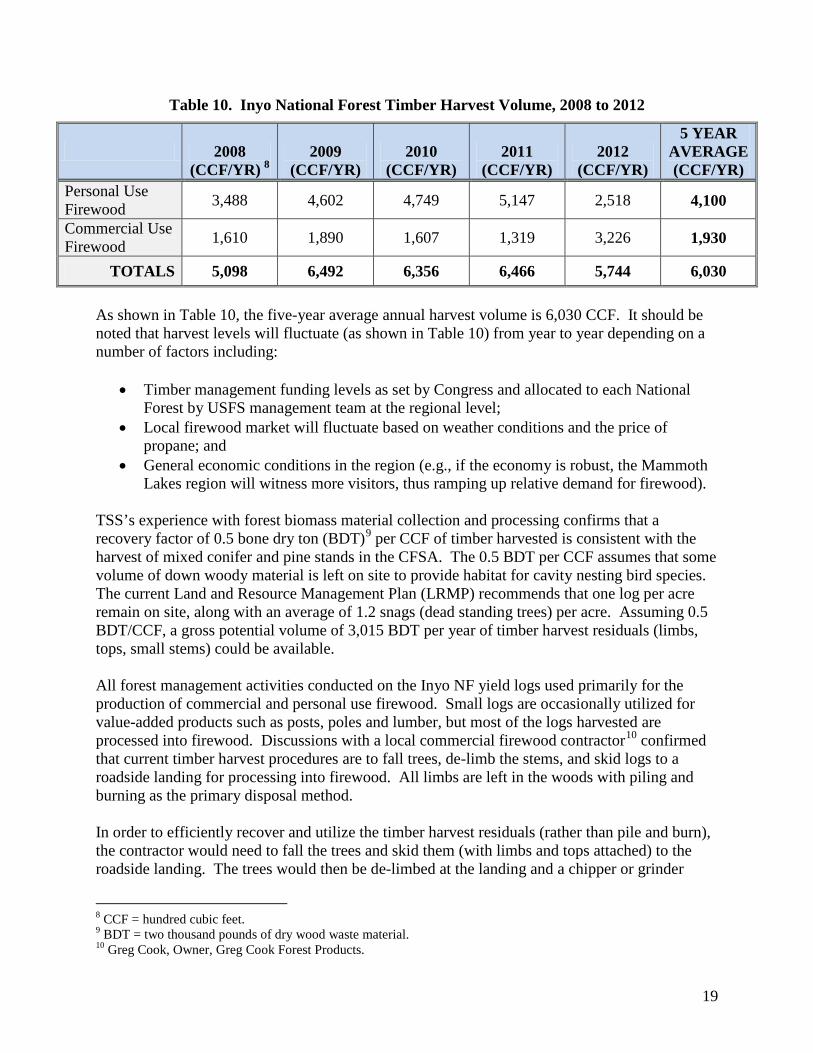
Table 10. Inyo National Forest Timber Harvest Volume, 2008 to 2012
2008 (CCF/YR) 8
2009 (CCF/YR)
2010 (CCF/YR)
2011 (CCF/YR)
2012 (CCF/YR)
5 YEAR AVERAGE (CCF/YR)
Personal Use Firewood 3,488 4,602 4,749 5,147 2,518 4,100
Commercial Use Firewood 1,610 1,890 1,607 1,319 3,226 1,930
TOTALS 5,098 6,492 6,356 6,466 5,744 6,030 As shown in Table 10, the five-year average annual harvest volume is 6,030 CCF. It should be noted that harvest levels will fluctuate (as shown in Table 10) from year to year depending on a number of factors including:
• Timber management funding levels as set by Congress and allocated to each National Forest by USFS management team at the regional level;
• Local firewood market will fluctuate based on weather conditions and the price of propane; and
• General economic conditions in the region (e.g., if the economy is robust, the Mammoth Lakes region will witness more visitors, thus ramping up relative demand for firewood).
TSS’s experience with forest biomass material collection and processing confirms that a recovery factor of 0.5 bone dry ton (BDT)9 per CCF of timber harvested is consistent with the harvest of mixed conifer and pine stands in the CFSA. The 0.5 BDT per CCF assumes that some volume of down woody material is left on site to provide habitat for cavity nesting bird species. The current Land and Resource Management Plan (LRMP) recommends that one log per acre remain on site, along with an average of 1.2 snags (dead standing trees) per acre. Assuming 0.5 BDT/CCF, a gross potential volume of 3,015 BDT per year of timber harvest residuals (limbs, tops, small stems) could be available. All forest management activities conducted on the Inyo NF yield logs used primarily for the production of commercial and personal use firewood. Small logs are occasionally utilized for value-added products such as posts, poles and lumber, but most of the logs harvested are processed into firewood. Discussions with a local commercial firewood contractor10 confirmed that current timber harvest procedures are to fall trees, de-limb the stems, and skid logs to a roadside landing for processing into firewood. All limbs are left in the woods with piling and burning as the primary disposal method. In order to efficiently recover and utilize the timber harvest residuals (rather than pile and burn), the contractor would need to fall the trees and skid them (with limbs and tops attached) to the roadside landing. The trees would then be de-limbed at the landing and a chipper or grinder
8 CCF = hundred cubic feet. 9 BDT = two thousand pounds of dry wood waste material. 10 Greg Cook, Owner, Greg Cook Forest Products.
19

could then efficiently and cost-effectively process the accumulated limbs, tops, and small stems into chips. As the residuals are processed, they are blown into a chip van for delivery to an end-use facility (e.g., bioenergy facility or compost operation). The Inyo NF also provides local residents with the opportunity to source logs for personal use firewood. The Inyo NF arranges to have trees felled and de-limbed so that the public can process firewood on site (in the forest). Like the commercial firewood operations, harvest residuals in the form of limbs and tops remain on site where the trees are felled, with pile and burning as the primary disposal method. In order for these residuals to be efficiently recovered, the trees would need to be felled and skidded with limbs attached to a roadside landing where the stems could be de-limbed and the residuals processed into chips (very similar to the biomass sourcing method for commercial firewood operations described above). The Inyo NF is currently in the process of updating its LRMP. Per the request of the EBPT, TSS provided comments (see Appendix A) on the LRMP revision. Inyo NF staff11 confirmed that not all topography or road systems will accommodate biomass collection, processing and transport operations. For the purposes of this feedstock forecast, it is assumed that 95% of the timber harvest operations within the CFSA are located on topography and road systems that will support biomass recovery. Using this assumption then, approximately 2,864 BDT per year are projected to be practically available as timber harvest residuals from forested acres within the CFSA. In addition to the Inyo NF, the Humboldt-Toiyabe NF also has an active timber sale program. Discussions with Humboldt-Toiyabe staff12 confirmed that the forest is conducting timber sales that yield primarily logs for commercial firewood operations. In addition, the forest is conducting sage grouse habitat restoration treatments in pinyon-juniper vegetation cover areas. Some removal of pinyon-juniper trees is being carried out in overly dense stands with most of the material being felled and left on site. In addition, some hazardous fuels treatments are being conducted in the pinyon-juniper13 vegetation cover areas. Most of the pinyon-juniper treatment areas are located on acreage with very limited road access and sensitive soils, so recovery of biomass material is not considered practical. Discussions with a timber sale purchaser14 that has operated on the Humboldt-Toiyabe NF confirmed that projects on this forest are located too far from Mammoth Lakes to be considered economical. He also confirmed that sawlogs and firewood logs removed on the forest are typically transported north to markets in the Reno/Sparks region (firewood logs) and farther north into Oregon (sawlogs) using backhauls (empty lumber trucks returning to Oregon). Discussions with the Nevada Division of Forestry (NDF) staff15 confirmed that NDF has an active forest fuels reduction program in the Lake Tahoe, Reno and Carson City areas.
11 Scott Kusumoto, Inyo NF, BLM Interagency Vegetation Management Team. 12 Mandy Brinnard, Forest Silviculturist, Humboldt-Toiyabe NF. 13 Discussions with Annamaria Echeverria, District Fuels Specialist, Bridgeport RD. 14 Dave Noble, Owner, South Bay Timber. 15 Eric Roussel, Forester, Nevada Division of Forestry.
20

NDF is managing forest fuels reduction projects using a chipper, a Kohler yarder (steep terrain log transport system) and five roll-off bins. Currently chips produced are being transported using the roll-off bins and are utilized for landscape cover, compost, and erosion control. All logs removed are currently being processed into firewood. None of the NDF projects are located within economical haul distance of Mammoth Lakes.
Fuels Treatment/Forest Restoration The Mammoth Lakes region is home to several communities with residential neighborhoods situated within the wildland urban interface (WUI). Due to high fire danger conditions within the WUI, there are concerted efforts across all forest ownerships (public and private) to proactively reduce hazardous forest fuels in support of wildfire defensible communities. Both Inyo County and Mono County have Community Wildfire Protection Plans (CWPP) (completed in April and May, 2009)16 that provide recommendations regarding strategic hazardous fuels reduction activities that could mitigate wildfire behavior. There are eight Fire Safe Councils and six Fire Protection Districts (FPD) active in Mono and Inyo counties.17 Several of these entities have received grant funding to facilitate removal of hazardous fuels (typically brush and small tree removal) within the WUI. For example, the Mammoth Lakes Fire Protection District is managing a WUI fuels management program (funding provided by the USFS)18 that provides 75% cost share (private landowners must provide 25% match) towards the cost of fuels reduction near homes. All material is chipped with most of the chips being utilized at the Mammoth Mountain Resort for landscape cover and erosion control. Fire District staff19 estimate that approximately 100 cubic yards (about 15 BDT equivalents) are generated annually. The June Lake Fire Protection District FPD has recently received a grant similar to the Mammoth Lakes FPD. Discussions with the June Lake FPD fuels coordinator20 indicated that the June Lake Privatelands Fuels Reduction project will facilitate fuels treatment activities across 374 acres of private lands in the June Lake WUI. The project has a five-year implementation plan commencing in May 2013. The June Lake FPD is using the Mammoth Lakes FPD fuels treatment protocols and prescriptions, and is currently conducting an environmental review consistent with CEQA. Many of the treatment prescriptions call for the removal of brush and the pruning of trees (to reduce ladder fuels). Very few trees are targeted for removal. Homeowners will be hiring fuels treatment contractors directly and will decide the ultimate destination for the biomass material removed. Much of the material removed may be transported to the local landfill located about 10 miles from June Lake (Mono County Landfill at Benton). Very little (if any) biomass material will be available for utilization at Mammoth Lakes. The Inyo NF implements fuels treatment activities in concert with timber sales and personal use firewood removal. In addition, the forest utilizes broadcast burning techniques to conduct landscape level fuels treatment and re-introduce fire as an ecological tool.
16 Inyo County CWPP, April 2009, Mono County CWPP, May 2009. Anchor Point Group, Boulder, Colorado. 17 Discussions with Brent Harper, Chief, Mammoth Lakes Fire Protection District. 18 Ibid. 19 Ibid. 20 Paul McCahon, Fuels Coordinator, June Lakes Fire Protection District.
21

The Pauite Tribe maintains a tribal enterprise that employs enrolled tribal members to conduct fuels treatment and forest restoration on the Reservation and on federally managed lands. In past years, the Tribe has worked with the Bureau of Indian Affairs and the USFS to complete fuels treatment projects, sometimes using stewardship contracts. Discussions with tribal staff21 confirm a strong interest for the tribal enterprise to collect, process, and transport forest biomass to a biomass utilization facility in Mammoth Lakes. At this time, there are no projects under contract, but the Tribe is applying for grant funding to support ongoing fuels treatment in the greater Bishop/Mammoth Lakes area. Due to ongoing plans (Mono County and Inyo County CWPPs) to conduct fuels treatment projects in the WUI, it is assumed that some volume of forest biomass residuals generated as a byproduct will be sustainably available as feedstock on an annual basis. For the purpose of this biomass feedstock availability analysis, TSS finds that approximately 300 BDT per year of forest biomass material are practically available as a byproduct of fuels treatment projects in the WUI.
Forest Products Manufacturing Residuals
Forest products manufacturing residuals in the form of sawdust, bark, and chips represent a traditionally cost effective source of quality feedstock. Currently there are very few commercial forest products manufacturing operations in Mono County or Inyo County. The only facilities in the region that appear to be in consistent operation are a small sawmill and post/pole operation managed by GC Forest Products. Interviews with the owner of GC Forest Products confirmed that approximately 90 to 100 cubic yards (about 15 BDT) of manufacturing residuals (primarily sawdust, bark, slabs, post/pole peelings) are generated weekly between May and October. Some of this material is sold as landscape cover and some is transported to the Benton Crossing landfill for disposal. For the purpose of this biomass feedstock availability analysis, TSS finds that approximately 360 BDT per year of forest manufacturing residuals are practically available.
Urban-Sourced Biomass
Tree service companies, local residents, and businesses in the Mammoth Lakes area regularly generate wood waste in the form of tree trimmings, construction wood, and woody debris from demolition projects. Much of this wood waste is currently deposited at the Benton Crossing Landfill. Mono County Solid Waste Division manages Benton Crossing. Discussions with Solid Waste Division staff22 indicated that the landfill receives significant volumes of wood waste. In addition to Benton Crossing, the department manages six other transfer stations and landfills. Only Benton Crossing is considered to be located tributary (12-mile haul distance) to Mammoth Lakes. Table 11 provides historic data regarding quarterly deliveries of wood waste material into the Benton Crossing landfill.
21 Brian Adkins, Director, Environmental Management Office, Pauite Tribe. 22 Tony Dublino, Supervisor, Solid Waste Department, Mono County.
22

Table 11. Wood Waste Receipts for Benton Crossing Landfill
WASTE TYPE Q3 2011
(BDT) Q4 2011 (BDT)
Q1 2012 (BDT)
Q2 2012 (BDT)
Q3 2012 (BDT)
Q4 2012 (BDT)
Q1 2013 (BDT)
Q2 2013 (BDT)
AVERAGE (BDT/YR)
Construction + Demolition Wood 2,129 1,910 578 1,778 2,007 1,082 701 1,312 5,748
Alternative Wood Sources 441 250 33 206 364 143 29 194 830
TOTALS 2,570 2,159 611 1,985 2,371 1,225 731 1,506 6,578
Benton Crossing Landfill monitors incoming waste material through the use of a gatekeeper that inspects deliveries and records material received at the landfill. Woody material is separated into two streams: organics (items that do not require processing such as sawdust, pine needles, and grass clippings) and clean wood waste (items including tree trimmings, logs, dimensional lumber, shrubs, twigs, plywood, composite panels, and painted wood). Another source of wood waste is dimensional lumber and other clean wood that is delivered to the landfill as part of construction and demolition (C+D) waste. This wood waste would require separation from the existing C+D waste stream if used as feedstock. The landfill is currently utilizing a grinder to process sorted C+D and wood into wood chips for use as alternative daily cover (ADC), landscape cover, and compost. Landfills traditionally utilize ADC as top cover material that is applied daily over the active landfill cell. ADC is helpful to control odor, dust (fugitive emissions), and vermin. Solid Waste Division staff23 confirmed that other waste material could be utilized as ADC if there were a value-added market (e.g., biomass fuel) for the C+D and wood waste material. Approximately 90% of the wood chips produced is used as ADC, with the balance (10%) used as landscape cover/compost material and made available to the public. A number of biomass power generation facilities utilize urban wood waste as fuel due to the fact that it is relatively dry (25% moisture content), is available year round, and is typically very cost effective (tip fees charged by the landfill pay for sorting and processing). Not all of the C+D and wood waste material is recoverable for use as biomass fuel. Incompatible constituents such as wall board, paint, composite panels, resins, and metal debris (nails/hinges) will render some of the wood waste unusable as feedstock material. TSS experience and discussions with Solid Waste Division staff24 confirm that only about 30% of the C+D material is considered recoverable, with about 70% of the general wood waste category being recoverable. Using these recovery factors, approximately 2,305 BDT of the C+D and wood waste is considered practically available per year. Subtracting the sawmill residuals at 360 BDT per year (to eliminate double counting) equates to 1,945 BDT/year.
23 Ibid. 24 Ibid.
23
The Benton Crossing Landfill is scheduled for closure by 2023. Solid Waste Division staff25 confirmed that various sites (also tributary to Mammoth Lakes) are currently being considered for future waste processing services (including wood waste processing) to serve the region.
Agricultural Byproducts
As noted in the vegetation cover analysis, there is no landscape acreage dedicated to commercial agricultural operations. No agricultural byproducts are available for use as feedstock within the CFSA.
Biomass Feedstock Competition Analysis
Current Competition There are very limited existing markets for forest biomass, sawmill residuals, and urban wood waste material generated within the CFSA. Currently, some sawmill residuals are sold to local residents for use as landscape cover or soil amendment. The fuels treatment biomass residuals are occasionally utilized at Mammoth Mountain Resort for landscape cover and erosion control. For the purposes of this analysis, TSS assumes that approximately five truckloads (75 BDT) of sawmill residuals and five truckloads (75 BDT) of fuels treatment residuals are utilized annually as soil amendment or landscape cover.
Potential Competition TSS is not aware of any new forest biomass processing or utilization facilities planned for locations within the CFSA. Discussions with NDF indicated some interest in the use of forest biomass for the Fuels for Schools program, but there are no planned projects that are tributary to the CFSA. For the purposes of this analysis, TSS assumes that there are currently no new facilities planned that might utilize woody biomass material sourced from the CFSA.
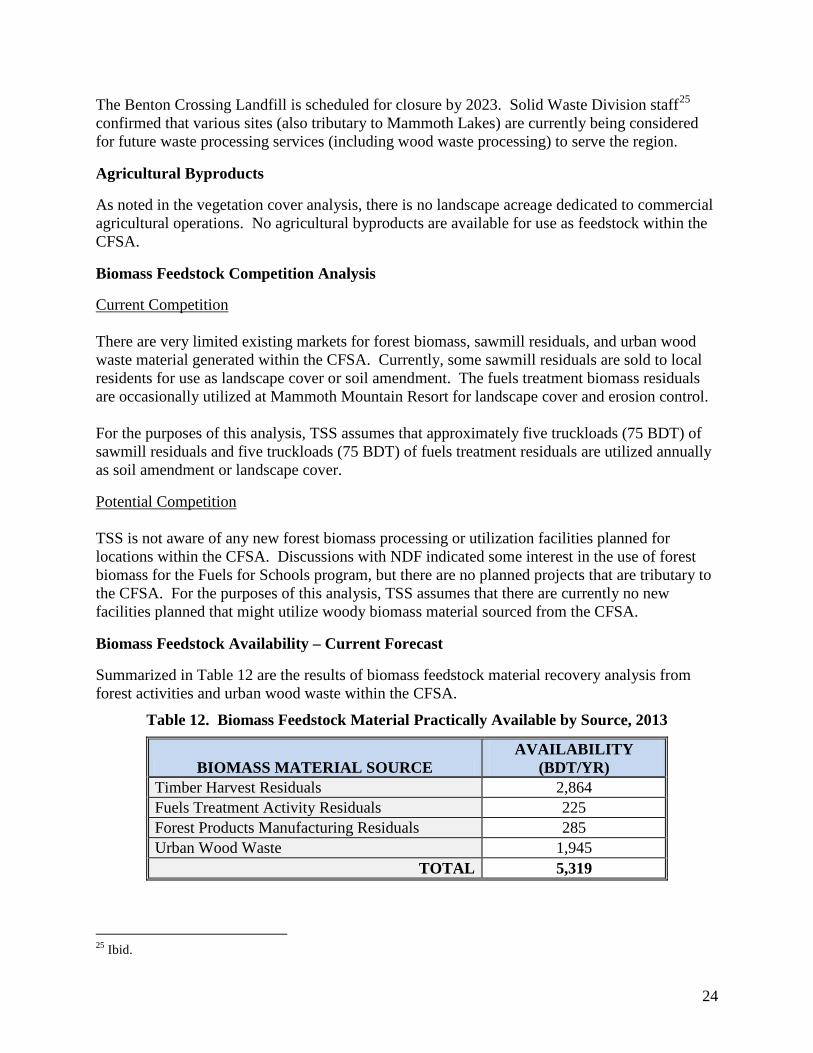
Biomass Feedstock Availability – Current Forecast
Summarized in Table 12 are the results of biomass feedstock material recovery analysis from forest activities and urban wood waste within the CFSA.
Table 12. Biomass Feedstock Material Practically Available by Source, 2013
BIOMASS MATERIAL SOURCE AVAILABILITY
(BDT/YR) Timber Harvest Residuals 2,864 Fuels Treatment Activity Residuals 225 Forest Products Manufacturing Residuals 285 Urban Wood Waste 1,945
TOTAL 5,319
25 Ibid.
24
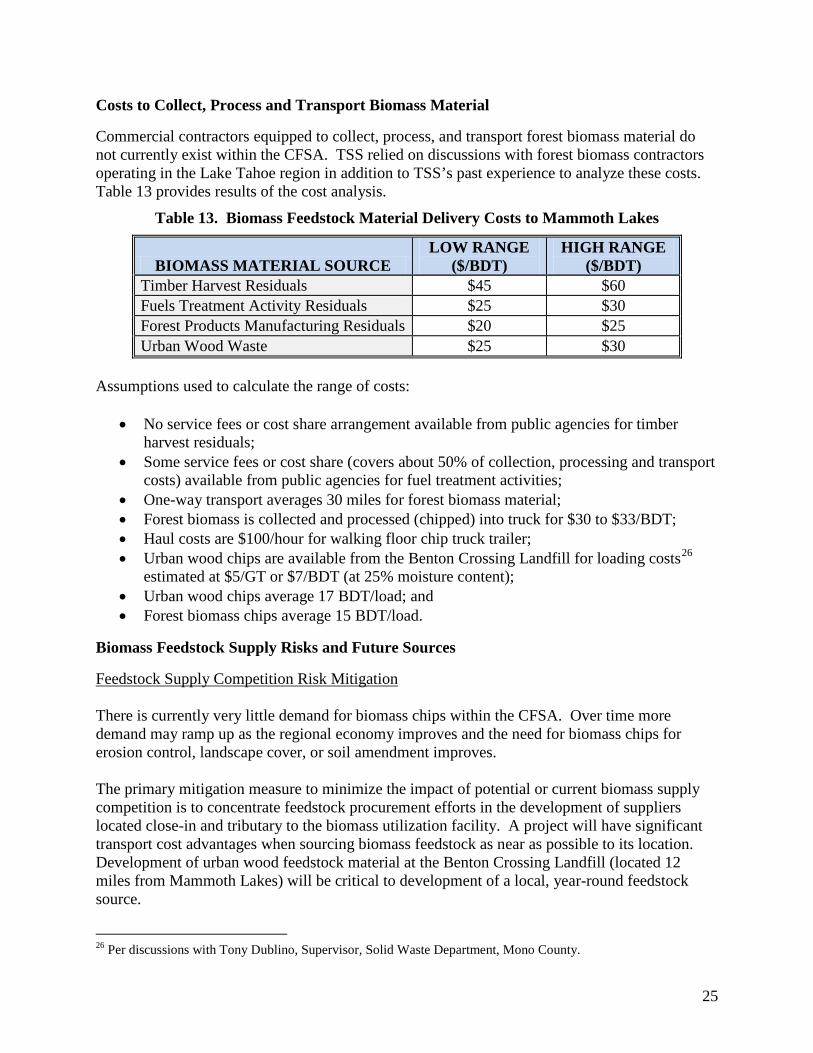
Costs to Collect, Process and Transport Biomass Material
Commercial contractors equipped to collect, process, and transport forest biomass material do not currently exist within the CFSA. TSS relied on discussions with forest biomass contractors operating in the Lake Tahoe region in addition to TSS’s past experience to analyze these costs. Table 13 provides results of the cost analysis.
Table 13. Biomass Feedstock Material Delivery Costs to Mammoth Lakes
BIOMASS MATERIAL SOURCE LOW RANGE
($/BDT) HIGH RANGE
($/BDT) Timber Harvest Residuals $45 $60 Fuels Treatment Activity Residuals $25 $30 Forest Products Manufacturing Residuals $20 $25 Urban Wood Waste $25 $30
Assumptions used to calculate the range of costs:
• No service fees or cost share arrangement available from public agencies for timber harvest residuals;
• Some service fees or cost share (covers about 50% of collection, processing and transport costs) available from public agencies for fuel treatment activities;
• One-way transport averages 30 miles for forest biomass material; • Forest biomass is collected and processed (chipped) into truck for $30 to $33/BDT; • Haul costs are $100/hour for walking floor chip truck trailer; • Urban wood chips are available from the Benton Crossing Landfill for loading costs26
estimated at $5/GT or $7/BDT (at 25% moisture content); • Urban wood chips average 17 BDT/load; and • Forest biomass chips average 15 BDT/load.
Biomass Feedstock Supply Risks and Future Sources
Feedstock Supply Competition Risk Mitigation There is currently very little demand for biomass chips within the CFSA. Over time more demand may ramp up as the regional economy improves and the need for biomass chips for erosion control, landscape cover, or soil amendment improves. The primary mitigation measure to minimize the impact of potential or current biomass supply competition is to concentrate feedstock procurement efforts in the development of suppliers located close-in and tributary to the biomass utilization facility. A project will have significant transport cost advantages when sourcing biomass feedstock as near as possible to its location. Development of urban wood feedstock material at the Benton Crossing Landfill (located 12 miles from Mammoth Lakes) will be critical to development of a local, year-round feedstock source.
26 Per discussions with Tony Dublino, Supervisor, Solid Waste Department, Mono County.
25

Time of Year Availability Discussions with local foresters indicate that the typical season for field operations is May through October. A variety of factors impact this, including snow depth and wet soil conditions (e.g., concerns regarding potential negative impacts to soil resources). Processed forest biomass (chips) used as feedstock may need to be stockpiled for winter delivery to a bioenergy project in Mammoth Lakes. Discussions with Solid Waste Department staff indicated potential availability of storage space at the Benton Crossing Landfill. This could be a key opportunity to provide winter storage for timber harvest and forest fuels treatment residuals. Urban wood waste is typically generated year round with some seasonal fluctuation (downturn) during the winter (January through March) as shown in Table 11.
Transport Cost The cost of transporting biomass feedstock represents the single most significant expense when procuring biomass. Variables such as diesel fuel cost (currently at $4.25/gallon),27 workers compensation expense, and maintaining a workforce (locating qualified drivers) are all factors that significantly impact the cost to transport commodities such as biomass feedstock. Interviews with commercial transport companies indicate the current cost to transport a bulk commodity such as biomass feedstock is $2.00 to $2.20 per running mile, or $85 to $100 per hour. The $100 per hour rate addresses the cost of owning and operating self-unloading trailers which will be required to deliver feedstock to a site in Mammoth Lakes. At this time, diesel fuel costs are the most significant variable impacting transport costs. Diesel fuel price escalation has had a major impact on biomass feedstock prices throughout the U.S. in recent years. Based on TSS’s experience, the average forest-sourced biomass feedstock requires approximately 1.75 to 2 gallons of diesel to produce and transport a green ton of forest-sourced feedstock with an average round-trip haul distance of 60 to 90 miles. Therefore, a $1.00/gallon increase in diesel fuel equates to a $1.75 to $2.00 per green ton increase in the cost to produce and transport forest-sourced biomass feedstock. Assuming that forest-sourced feedstock has a moisture content of 50%, the $1.00/gallon increase in diesel fuel pricing equates to a $3.50 to $4.00 per BDT cost increase. Any significant increase in the price of diesel fuel presents a risk to the overall economics of producing forest-sourced biomass. Diesel fuel pricing volatility is primarily driven by the cost of crude oil. Figure 7 shows the volatility of diesel prices during the January 2007 through mid-September 2013 period.28
27 California Diesel Prices; http://www.eia.gov/petroleum/gasdiesel/ 28 Ibid.
26

Figure 7. California On-Highway Diesel Prices, 2007 to 2013
Figure 7 shows a seven-year trend of increasing prices with short-term volatility. Fluctuations in diesel prices have the potential to be the single most significant factor impacting delivered feedstock prices.
Housing and Construction Improvements in the housing and construction sectors will result in an increase in volumes of urban wood from construction and demolition projects. Discussions with Solid Waste Department staff29 confirmed that as local residential and industrial construction projects ramp up due to improved regional economic conditions, there will be a concomitant increase in C+D and wood waste deliveries to the Benton Crossing Landfill.
State and Federal Policies Public policy can be a source of risk or can provide opportunity. An example of a potential risk includes possible changes in land management policies and regulations that could reduce fuel treatment and forest restoration activities on both private and public lands. However, public policy can also provide opportunity, as is the case with state Senate Bill 32 (SB 32) and state Senate Bill 1122 (SB 1122). These bills significantly improved the power sales opportunities for community-scale renewable energy projects strategically located within Investor Owned Utility service territories (Pacific Gas & Electric, Southern California Edison, and San Diego Gas & Electric).
29 Ibid.
27

Potential Value-Added Market Opportunities for Biomass Feedstock
Due to the relatively low volume of biomass feedstock found to be available within the CFSA, there are limited opportunities to install commercial-scale value-added processing (e.g., soil amendment, compost, animal bedding, post/pole). In addition, due to the relatively low population in the region (Mono County population30 is 14,350), there are very limited opportunities to grow the value-added markets locally. Current forest products manufacturing, post and pole, and firewood operations are meeting local demand.
Fuel Pellets as Biomass Feedstock
Some thermal energy facilities utilize wood fuel pellets as feedstock. There are several advantages when using pellets, including consistency of feedstock sizing, moisture content, and heating value. Due to consistent sizing, this feedstock has very good material handling and storage characteristics. The primary downside to fuel pellets is the delivered cost. The closest fuel pellet manufacturing facility is located in John Day, Oregon. Delivered cost is around $200/BDT.31 This price is quite prohibitive and not financially attractive when considering the delivered cost of more locally sourced biomass feedstocks (see next section). Sourcing fuel pellets from John Day would be counter to the project objectives of sourcing locally available feedstocks.
Five-Year Biomass Feedstock Pricing Forecast
A thermal energy facility sited at the Mammoth Mountain Ski Area maintenance garage will likely utilize a combination of biomass feedstocks to supply the 250 to 400 BDT per year annual feedstock usage. TSS recommends a diverse blend of feedstocks be considered for this facility. The recommended feedstock blend meets the EBPT’s objectives of diverting forest biomass away from current pile and burn disposal techniques while utilizing a blend of underutilized biomass material. Table 14 summarizes a feedstock blend that includes a diversified range of feedstocks.
Table 14. Biomass Feedstock Material Blend for a Thermal Energy Facility
BIOMASS MATERIAL SOURCE
DELIVERED COST
($/BDT)
PERCENT OF
TOTAL
TOTAL VOLUME (BDT/YR)
Timber Harvest Residuals $45 40% 120 Fuels Treatment Activity Residuals $25 5% 15 Forest Products Manufacturing Residuals $25 10% 30 Urban Wood Waste $26 45% 135
TOTALS 100% 300 Table 15 provides a five-year biomass feedstock pricing forecast for a thermal energy facility that utilizes 300 BDT of biomass feedstock sourced from the Mammoth Lakes CFSA. The base
30 US Census Bureau data (http://quickfacts.census.gov/qfd/states/06/06051.html). 31 Discussions with John Rowell, pellet sales manager, Malhuer Lumber Company.
28

price of $33.45 per BDT is calculated using the optimized feedstock blend and delivered prices shown in Table 14.
Table 15. Five-Year Feedstock Pricing Forecast, 2013 to 2017
2013 2014 2015 2016 2017 Feedstock Price Delivered to the City
of Mammoth Lakes $33.45 $33.95 $34.46 $34.98 $35.50
The feedstock price forecast presented in Table 15 is based on the following assumptions:
• Feedstock supply chain is fully developed with feedstock available from forest-based operations fuels treatment activities and the Benton Crossing Landfill;
• Diesel fuel prices remain near $4.25/gallon through 2013, then escalate slightly; • Labor rates remain stable through 2013, then escalate slightly; and • Biomass feedstock prices escalate at 1.5% annual rate due to increased diesel fuel and
labor costs from 2014 through 2017.
Findings
The biomass feedstock availability and cost analysis indicates that there is not sufficient biomass sustainably available for a CHP or electricity-only bioenergy facility. A 0.5 MW bioenergy facility would require a minimum of 4,000 BDT annually. While 5,319 BDT per year are projected to be available, most financial institutions require a feedstock supply ratio of 2:1, indicating that there is twice as much biomass available as there is demand at a facility. Due to the feedstock constraints, TSS recommends that the EBPT focus on thermal applications in the Mammoth Lakes region to promote the sustainable utilization of wood waste. TSS acknowledges that for short time periods, additional feedstock will be available due to wildfires, high winds, and infestations such as beetle kill; however, TSS does not consider these sources to be sustainable over the 20 year life of a bioenergy facility.
29

ECONOMIC AND FINANCIAL FEASIBILITY ANALYSIS A complete project budget includes anticipated costs associated with every aspect of the project. The largest components of the budget are the equipment capital costs, installation costs, operations costs, and maintenance costs. For this analysis, TSS has utilized published information from the Fuels for Schools and Beyond Program,32 a USFS initiative to facilitate the removal of hazardous fuels from local forests and promote the use of woody biomass as a renewable natural resource and as an energy source for heating systems in public and private buildings. This analysis reviews data and experience gained from 13 demonstration projects in Oregon, Montana, Alaska, Idaho, and Nevada.
Upfront Costs
Upfront costs include all of the costs associated with the development of the project that are not associated with recurring operations and maintenance. This includes capital cost of equipment, design and engineering, infrastructure upgrades, installation and integration, permitting, commissioning, and operator training. The average upfront costs for projects ranging from 1 MMBtu per hour to 4 MMBtu per hour are shown in Table 16. Projects that utilized performance contracts or pellets as their primary fuel source are excluded from Table 16. The average project costs are $274,198 per MMBtu per hour.
Table 16. Total Project Costs
PROJECT LOCATION
BOILER SIZE (MMBtu/hr)
TOTAL PROJECT COST
AVERAGE PROJECT COST
($/MMBtu/hr) Thompson Falls, MT 1.6 $455,000 $284,375 Victor, MT 2.6 $615,000 $236,538 Philipsburg, MT 3.87 $684,000 $176,744 Darby, MT 3 $970,000 $323,333 Craig, AK 4 $1,400,000 $350,000
AVERAGE: $274,198 The total project cost information can be split into five major categories: wood boiler system including feedstock storage and conveyance; boiler building; mechanical/electrical system within the boiler room; mechanical integration; fees, permits and other non-capital costs. This breakdown is shown in Table 17. The total project statistics are shown in Table 18.
32 http://www.fuelsforschools.info/pdf/Final_Report_Biomass_Boiler_Market_Assessment.pdf
30

Table 17. Project Cost Breakdown
THOMPSON
FALLS VICTOR PHILIPSBURG DARBY CRAIG AVERAGE
SIZE (MMBtu/hr) 1.6 2.6 3.87 3 4 ($/MMBtu/hr) (%)
Wood Boiler System $136,000 30% $240,000 39% $264,000 39% $261,000 27% $319,000 23% $82,455 31%
Building $170,000 37% $200,000 33% $172,000 25% $150,000 15% $240,000 17% $67,524 26%
Mechanical/Electrical $100,000 22% $134,000 22% $100,000 15% $100,000 10% $200,000 14% $44,642 17%
Mechanical Integration $15,000 3% $5,000 1% $100,000 15% $324,000 33% $586,000 42% $58,328 19%
Fees, Permits, Etc. $34,000 7% $36,000 6% $48,000 7% $135,000 14% $55,000 4% $21,250 8%
TOTALS $455,000 100% $615,000 100% $684,000 100% $970,000 100% $1,400,000 100% $274,198 100%
Table 18. Project Cost Breakdown Statistical Findings
MINIMUM
($/MMBtu/hr) AVERAGE
($/MMBtu/hr) MAXIMUM
($/MMBtu/hr) Wood Boiler System $68,217 $82,455 $92,308
Building $44,444 $67,524 $106,250
Mechanical/Electrical $25,840 $44,642 $62,500
Mechanical Integration $1,923 $58,328 $146,500
Fees, Permits, Etc. $12,403 $21,250 $45,000
TOTALS33 $176,744 $274,198 $350,000
33 Note that the “Totals” row does not equal the sum of the cells above, but instead displays the minimum, average, and maximum statistics for total project costs. 31

Maintenance
Wood biomass boilers require more maintenance than traditional fossil-fuel fired boilers. It is important to understand the personnel requirements to better estimate operations and maintenance costs and to confirm if existing staff can manage the additional workload.
Daily Inspections and Tasks
• Clean boiler room; • Inspect fuel inventory and water chemicals; • Be attentive to odd sounds, smells, or vibrations during operations; • Dispose of ash; • Note water pressure and temperature; • Blow down steam boilers and compressors (steam system); and • Note feedwater temperature (steam system).
Tasks specific to steam boilers are clearly indicated above. Daily maintenance is focused on maintaining a clean boiler room and a visual inspection of the equipment. Ash removal can be manual or automated depending on the operator’s preference. Daily maintenance is expected to take between half an hour and one hour. Some technology vendors offer remote operations and monitoring to ensure that the system is operating properly. This type of monitoring helps to minimize the risk of onsite operator error and provides a check for visual inspections. Note that weekly feedstock delivery should be expected depending on the size of the boiler and the size of feedstock storage. Feedstock delivery into an automated system should be expected to take approximately half an hour of supervision.
Annual Inspection and Tasks
• Thorough inspection of the equipment; • Each time the boiler is open for an internal inspection, clean buildup on any surface,
including the boiler and the heat exchangers; • Align and tension belt drives; • Check gearbox lubrication levels; • Lubricate bearings; • Inspect seals, refractory, and conveyors; and • Replace gaskets.
Annual maintenance can be done in house by trained staff or can be contracted to local boiler service companies. Performance contracts usually include annual maintenance as part of the package. Parts for typical annual maintenance average approximately $4,500 per year with TSS experience indicating ranges between $1,000 and $7,000 per year. Using a fully loaded rate of $26 per hour, the personnel costs for maintenance are expected to be $9,490 per year (for 1 hour per day) with a range of $4,745 to $14,235 per year (0.5 to 1.5 hours per day).
32

Market Feasibility: Avoided Fossil Fuel Costs
The market driver for biomass thermal energy is the cost of the alternative fuel. In the Mammoth Lakes area, propane is the primary fuel source for heating along with the occasional utilization of diesel fuel oil. To understand the potential annual savings from switching to biomass, the price of these fuel sources are illustrated in Table 19, which shows the energy source as a price per unit of energy delivered. This metric accounts for different system efficiencies. Boiler derating due to altitude does not affect the efficiency of the boiler but can affect the overall capital cost of a project because of the need to utilize larger boilers.
Table 19. Energy Cost Comparison
ENERGY SOURCE
UNIT PRICE
ENERGY CONTENT
CONVERSION EFFICIENCY
PRICE OF DELIVERED
ENERGY Electricity (SCE) $0.085/kWh 3,412 Btu/kWh 100% $24.91/MMBtu Propane $3.50/gal 91,500 Btu/gal 80% $47.81/MMBtu Propane $2.15/gal 91,500 Btu/gal 80% $29.37/MMBtu Diesel Fuel Oil $3.38/gal 140,000 Btu/gal 80% $30.18/MMBtu Wood Chips $45/BDT 8,500 Btu/lb 70% $2.65/MMBtu Wood Chips $25/BDT 8,500 Btu/lb 70% $1.47/MMBtu Table 19 indicates that fuel savings of a factor of 9.4 to 32.1 are possible by utilizing biomass energy. Therefore, a facility utilizing a 2 MMBtu per hour boiler at a 15% capacity factor could provide between $58,500 per year and $121,700 per year in fuel savings. The system payback therefore is dependent upon the current cost of fuel, the annual heat utilization (capacity factor), and the additional cost of a system. The system payback can change drastically if the incremental capital cost is the entire system or just the marginal cost of the biomass boiler. The distinction here is based on whether a new fossil fuel boiler is expected to be purchased or if the investment in a biomass boiler represents a completely new investment. To be conservative, TSS will analyze the financial feasibility of a biomass boiler assuming that it is a completely new purchase that will increase the heating system’s total redundancy.
Mammoth Mountain Ski Resort: Garage
Using these factors, the TSS financial analysis model indicates the findings below (Table 20). Note that this does not include the benefits from depreciation of the equipment and assumes that the money saved from avoided propane use is utilized elsewhere by the Mammoth Mountain Ski Resort and is therefore not considered taxable income. The financial analysis is performed on a 2.0 MMBtu per hour facility with the expectation that the propane boilers would remain in place for use during high demand (peak use periods only). The analysis assumes that the project is financed without debt.
33

Table 20. Sensitivity Analysis for Mammoth Mountain Ski Resort Garage
LOW
SENSITIVITY BASELINE
SENSITIVITY HIGH
SENSITIVITY Total Project Cost ($) $353,488 $548,396 $700,000 Propane Displaced (gal/yr) 53,188 45,209 39,891 Cost of Propane ($/gal) $2.15 $2.15 $2.15 Price of Biomass ($/BDT) $25 $30 $35 Additional O&M Personnel Costs ($/yr) $4,745 $9,490 $14,235 Additional O&M Equipment Costs ($/yr) $1,000 $4,500 $7,000 Average EBIDTA Cash Flow ($/yr) $95,837 $69,442 $49,645 IRR 28.0% 12.8% 6.1% Simple Payback Period (yr) 3.5 7.4 12.7 The findings in Table 20 show a best case (low sensitivity) and a worst case (high sensitivity) scenario, indicating that the payback is expected to be between 3.5 and 12.7 years, depending on project specific criteria. Most of these factors can be controlled through feedstock contracts and a competitive request for proposals (RFP) process (targeting equipment vendors). Through these processes, an institution will be able to generate an expectation for financial return before committing funds.
Non-Profit Institutions
The previous analysis reviews the financial model for a private institution planning to self finance. Based on the Site Selection Matrix, the majority of the alternative sites were non-profit organizations including schools and hospitals. This analysis is focused on a non-profit organization (without tax liability) and paying higher rates for propane than the Mammoth Mountain Ski Resort. The analysis results in Table 21 are also for a 2 MMBtu per hour boiler system.
Table 21. Sensitivity Analysis for Non-Profit Institution Installation
LOW
SENSITIVITY BASELINE
SENSITIVITY HIGH
SENSITIVITY Total Project Cost $353,488 $548,396 $700,000 Propane Displaced 53,188 gal/yr 45,209 gal/yr 39,891 gal/yr Cost of Propane $3.38/gal $3.38/gal $3.38/gal Price of Biomass $25/BDT $30/BDT $35/BDT Additional O&M Personnel Costs $4,745/yr $9,490/yr $14,235/yr Additional O&M Equipment Costs $1,000/yr $4,500/yr $7,000/yr Average EBIDTA Cash Flow $161,258 $125,050 $98,710 IRR 46.6% 23.4% 14.3% Simple Payback Period 2.1 yr 4.2 yr 6.7 yr The findings in Table 21 show a best case (low sensitivity) and a worst case (high sensitivity) scenario, indicating that the payback is expected to be between 2.1 and 6.7 years, depending on
34

project specific criteria. The difference between these analyses findings is primarily due to the difference in propane pricing with the Ski Resort having significantly lower propane costs.
Cash Flow Projections
Cash flow projections will vary monthly based on thermal demand. Understanding cash flow is particularly important when using debt to finance a project, as monthly payments traditionally do not change annually, while energy savings will be concentrated during the winter months. Table 23 shows a projected annual cash flow based on the heat demand at the Mammoth Ski Resort maintenance garage between 2011 and 2013. TSS utilized this data because it was readily available; however, TSS acknowledges that the operating schedule for the maintenance garage will be different than other potential biomass thermal applications (e.g., the Mammoth Unified School District). The cash flow analysis anticipates that 80% of the total heat demand will be supplied by the biomass boiler reserving the additional 20% heat load for the propane boiler during start-up, peaking, and in the summer for low heat demand applications. A two MMBtu per hour boiler with this demand would be operating at an 18% capacity factor. Table 23 includes the following assumptions:
• The fossil fuel boiler is fired on propane with a 1.0% annual inflation rate; • Energy content of propane is 91,500 Btu per gallon; • Woodchip feedstock costs of $33.45 with a 1.5% annual inflation rate (Table 15); • Energy content of wood chips are 8,500 Btu per dry pound; • Personnel time demand of 7 hours per week when operating the biomass boiler with a
wage rate of $20 per hour with a 30% burden; • Maintenance costs are concentrated in the summer months when the biomass boiler is not
operational; and • Debt financing accounts for 75% of the capital cost of $548,396 (Table 16) with a debt
term of 10 years and an interest rate of 6%. The EBITDA and net cash flow on an annual basis are shown in Table 22. Annually, the projected cash flow is expected to be positive, although the summer months’ expenditures will exceed savings as the biomass boiler is not operating; however, maintenance and debt payment will still occur. Table 22 and Table 23 reflect the historical seasonal variation in heat demand.
Table 22. Annual Projected Cash Flow
PROPANE PRICING $2.15/gal $3.50/gal
EBITDA ($/yr)
Year 1 $94,617 $167,484 Year 2 $77,521 $138,452 Year 3 $76,388 $136,472
Average $82,842 $147,469
Net Cash Flow ($/yr)
Year 1 $38,735 $111,602 Year 2 $21,639 $82,570 Year 3 $20,506 $80,590
Average $26,960 $91,587
35
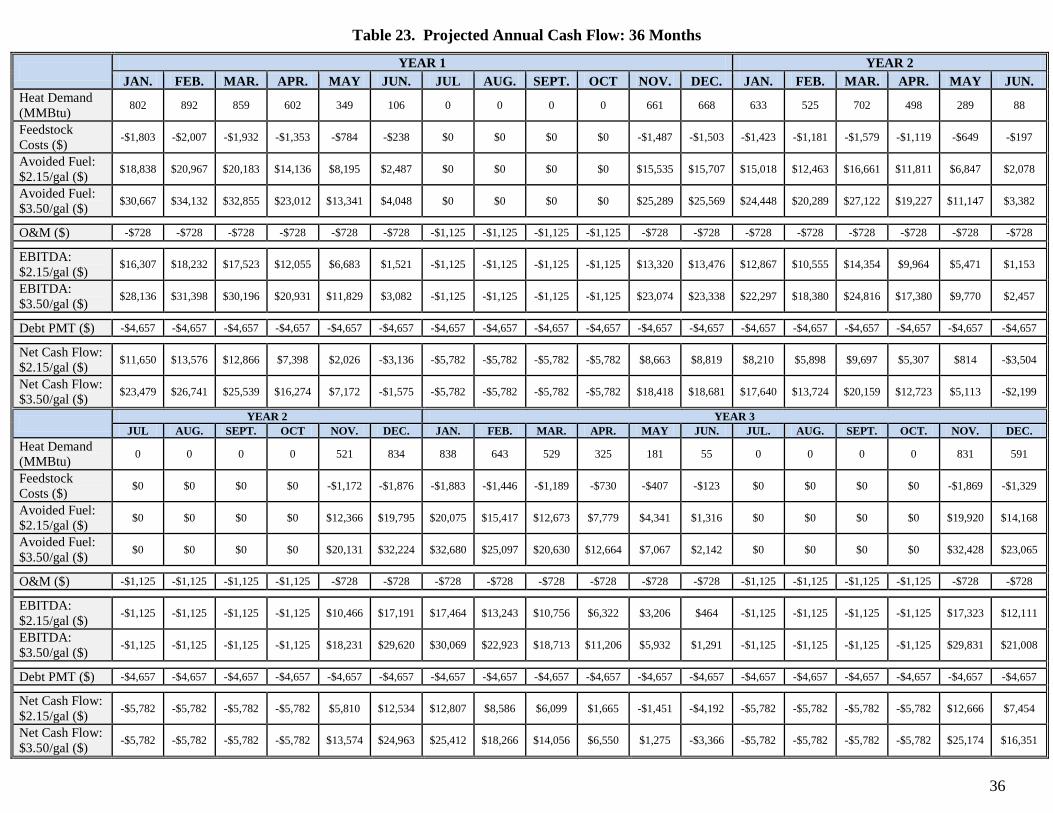
Table 23. Projected Annual Cash Flow: 36 Months
YEAR 1 YEAR 2 JAN. FEB. MAR. APR. MAY JUN. JUL AUG. SEPT. OCT NOV. DEC. JAN. FEB. MAR. APR. MAY JUN.
Heat Demand (MMBtu) 802 892 859 602 349 106 0 0 0 0 661 668 633 525 702 498 289 88
Feedstock Costs ($) -$1,803 -$2,007 -$1,932 -$1,353 -$784 -$238 $0 $0 $0 $0 -$1,487 -$1,503 -$1,423 -$1,181 -$1,579 -$1,119 -$649 -$197
Avoided Fuel: $2.15/gal ($) $18,838 $20,967 $20,183 $14,136 $8,195 $2,487 $0 $0 $0 $0 $15,535 $15,707 $15,018 $12,463 $16,661 $11,811 $6,847 $2,078
Avoided Fuel: $3.50/gal ($) $30,667 $34,132 $32,855 $23,012 $13,341 $4,048 $0 $0 $0 $0 $25,289 $25,569 $24,448 $20,289 $27,122 $19,227 $11,147 $3,382
O&M ($) -$728 -$728 -$728 -$728 -$728 -$728 -$1,125 -$1,125 -$1,125 -$1,125 -$728 -$728 -$728 -$728 -$728 -$728 -$728 -$728
EBITDA: $2.15/gal ($) $16,307 $18,232 $17,523 $12,055 $6,683 $1,521 -$1,125 -$1,125 -$1,125 -$1,125 $13,320 $13,476 $12,867 $10,555 $14,354 $9,964 $5,471 $1,153
EBITDA: $3.50/gal ($) $28,136 $31,398 $30,196 $20,931 $11,829 $3,082 -$1,125 -$1,125 -$1,125 -$1,125 $23,074 $23,338 $22,297 $18,380 $24,816 $17,380 $9,770 $2,457
Debt PMT ($) -$4,657 -$4,657 -$4,657 -$4,657 -$4,657 -$4,657 -$4,657 -$4,657 -$4,657 -$4,657 -$4,657 -$4,657 -$4,657 -$4,657 -$4,657 -$4,657 -$4,657 -$4,657
Net Cash Flow: $2.15/gal ($) $11,650 $13,576 $12,866 $7,398 $2,026 -$3,136 -$5,782 -$5,782 -$5,782 -$5,782 $8,663 $8,819 $8,210 $5,898 $9,697 $5,307 $814 -$3,504
Net Cash Flow: $3.50/gal ($) $23,479 $26,741 $25,539 $16,274 $7,172 -$1,575 -$5,782 -$5,782 -$5,782 -$5,782 $18,418 $18,681 $17,640 $13,724 $20,159 $12,723 $5,113 -$2,199
YEAR 2 YEAR 3 JUL AUG. SEPT. OCT NOV. DEC. JAN. FEB. MAR. APR. MAY JUN. JUL. AUG. SEPT. OCT. NOV. DEC.
Heat Demand (MMBtu) 0 0 0 0 521 834 838 643 529 325 181 55 0 0 0 0 831 591
Feedstock Costs ($) $0 $0 $0 $0 -$1,172 -$1,876 -$1,883 -$1,446 -$1,189 -$730 -$407 -$123 $0 $0 $0 $0 -$1,869 -$1,329
Avoided Fuel: $2.15/gal ($) $0 $0 $0 $0 $12,366 $19,795 $20,075 $15,417 $12,673 $7,779 $4,341 $1,316 $0 $0 $0 $0 $19,920 $14,168
Avoided Fuel: $3.50/gal ($) $0 $0 $0 $0 $20,131 $32,224 $32,680 $25,097 $20,630 $12,664 $7,067 $2,142 $0 $0 $0 $0 $32,428 $23,065
O&M ($) -$1,125 -$1,125 -$1,125 -$1,125 -$728 -$728 -$728 -$728 -$728 -$728 -$728 -$728 -$1,125 -$1,125 -$1,125 -$1,125 -$728 -$728
EBITDA: $2.15/gal ($) -$1,125 -$1,125 -$1,125 -$1,125 $10,466 $17,191 $17,464 $13,243 $10,756 $6,322 $3,206 $464 -$1,125 -$1,125 -$1,125 -$1,125 $17,323 $12,111
EBITDA: $3.50/gal ($) -$1,125 -$1,125 -$1,125 -$1,125 $18,231 $29,620 $30,069 $22,923 $18,713 $11,206 $5,932 $1,291 -$1,125 -$1,125 -$1,125 -$1,125 $29,831 $21,008
Debt PMT ($) -$4,657 -$4,657 -$4,657 -$4,657 -$4,657 -$4,657 -$4,657 -$4,657 -$4,657 -$4,657 -$4,657 -$4,657 -$4,657 -$4,657 -$4,657 -$4,657 -$4,657 -$4,657
Net Cash Flow: $2.15/gal ($) -$5,782 -$5,782 -$5,782 -$5,782 $5,810 $12,534 $12,807 $8,586 $6,099 $1,665 -$1,451 -$4,192 -$5,782 -$5,782 -$5,782 -$5,782 $12,666 $7,454
Net Cash Flow: $3.50/gal ($) -$5,782 -$5,782 -$5,782 -$5,782 $13,574 $24,963 $25,412 $18,266 $14,056 $6,550 $1,275 -$3,366 -$5,782 -$5,782 -$5,782 -$5,782 $25,174 $16,351
36
Incentive Programs
Incentive programs for biomass thermal development are limited due to the maturity of the industry, favorable payback periods when appropriately sited, and the relatively low capital cost compared to biomass electricity production. Alternative funding sources are largely targeted at low-income areas in the form of USDA Rural Business Enterprise Grants and Economic Adjustment Funding. Mammoth Lakes does not qualify as a low-income area. The USFS Woody Biomass Utilization Grant (WBUG) program is available for design and engineering assistance for projects utilizing forest-sourced biomass. The WBUG program can fund up to $250,000 of design and engineering work including civil, mechanical, and electrical engineering design. The WBUG program is an annual solicitation. Applications are typically due between February and April (depending on the date set by the USFS). Renewable energy sources are eligible for a Modified Accelerated Cost Recovery System (MACRS) seven-year depreciation schedule, which can provide tax incentives for enterprises with a sufficient tax appetite to utilize this incentive. TSS did not incorporate MACRS tax credits in the financial analysis.
Employment and Job Creation
Biomass thermal applications will not create additional onsite employment. While there is additional work associated with operating a biomass boiler instead of a fossil fuel boiler, the time requirements do not necessitate additional labor and that work is expected to be performed by existing operations and maintenance staff. Due to the relatively low feedstock demand, additional jobs within the forest are not expected to be generated from the addition of one biomass boiler. However, the additional demand for forest-sourced material will help support existing jobs. Additional boiler installations may ultimately generate more jobs in the forest-sector.
Personnel Requirements A biomass boiler requires more staff oversight than a fossil fuel boiler because of the feedstock conveyance system. It is recommended that the principal operator of the biomass boiler have experience managing and operating fossil fuel boilers. The water or steam side of a biomass boiler is no different than that of a fossil fuel boiler. Properly managing the water or steam temperature and pressure, the chemical cleaning and softening agents, and top off water are all necessary for both a biomass boiler and a liquid-fueled boiler. An experienced boiler operator will be able to identify these operations and maintenance issues and can focus on learning the particulars that distinguish a biomass boiler from a traditional boiler. A biomass boiler operator does not need prior experience working with wood chips. However, experience and familiarity with mechanical systems like motors or heating, ventilation, and air conditioning (HVAC) systems are recommended. In addition to the primary operator(s), personnel are recommended to help monitor the conveyance system and the feedstock delivery. It is recommended that these positions be filled by personnel
37

who have experience with mechanical systems. Experience handling wood products or experience operating a boiler is not required. Experience shows that challenges in the biomass boiler operations are largely due to the feedstock conveyance system; the boiler itself is predictable and stable. It is important that there is one trained staff person available during all times of operation to be able to respond to any conveyance system impediments. Staff schedules will determine the number of personnel required to cover the typical operating hours for the unit. Lastly, a protocol should be developed and staff personnel should be assigned the role of accepting and inspecting feedstock delivery to ensure feedstock quality. There are no prerequisites for this position.
Training Requirements Operator training is one of the most crucial elements of implementing a successful biomass thermal energy project. Traditionally, facilities developing biomass boilers are switching from a fossil fuel boiler to a biomass boiler for both economic, environmental, and/or sustainability reasons. While there are many advantages to utilizing a biomass boiler, ease of operations can be challenging when compared to fossil fuel boilers. Fossil fuels are simple to deploy because they are easy to transport and convey. For the existing fossil fuel boilers, the fuel is delivered to the site and stored in tanks. The pressure differential developed by the boiler, when in operation, pulls the fuel through the in-feed system. Fossil fuel is efficiently combusted by specialized delivery systems optimized to ensure the proper air to fuel ratio to maximize energy production and minimize emissions. A biomass boiler utilizes solid feedstock as fuel. Solid feedstocks are more challenging than fossil fuels because of their inability to conform to containers and their inability to easily alter physical geometry. Just as with fossil fuels, biomass boilers are more efficient with a uniform feedstock size because the in-feed system can be optimized for that particular geometry (e.g., chip size). An operator must know how to monitor the system to react to changes in feedstock sizing and quality (e.g., wood species, moisture content). Since fossil fuel boilers are always able to generate uniform in-feed characteristics, changing feedstock quality is not a challenge that boiler operators are accustomed to addressing. Additionally, the conveyance of solid feedstocks are mechanized and are therefore prone to more challenges than the passive in-feed system of a liquid fuel boiler that is driven by the unit’s operational vacuum. For each of these challenges, the common thread is feedstock size and quality. A detailed review of feedstock providers and their ability to consistently meet feedstock specifications is important to minimize the downtime from feedstock conveyance and maximize the combustion efficiency. However, the feedstock quality is not always within the control of the operator, and typical fuel contracts allow for tolerances with feedstock sizes and moisture content. It is therefore the operator’s role to be able to manage and identify potential obstacles and proactively respond to minimize the impact of feedstock quality on the operation of the system. For a new biomass boiler operator, the challenges facing the operations and maintenance staff are not particularly difficult, but it is important that operators are educated about the challenges before commencing operation of the unit. A proper training regime (e.g., technology vendor will provide
38

hands-on training) allows one-on-one time for each potential operator or maintenance staff member to ensure that they understand the system and the common challenges. The training regimen outlined in this section provides goals for each stage of the program. While a biomass boiler is not difficult to operate, it is important to understand the mechanics of the system to be able to properly react to any situation.
Findings
A biomass thermal facility in the Mammoth Lakes regions is economically viable based on current prices for propane. The most significant challenges facing the deployment of biomass thermal installations are uncertainty surrounding feedstock and capital equipment cost. The feedstock assessment indicates that there are sufficient feedstock sources in the area within the price ranges analyzed in this analysis. A competitive bid process for selecting the technology vendor will help ensure cost effective technology selection. While project financials are more attractive for non-profit institutions based on the findings in Table 21, the Mammoth Mountain Ski Resort case study also indicates that a biomass option may remain attractive for institutions that have advantageous propane prices.
39

TECHNOLOGY REVIEW AND SELECTION PROCESS
Technology Overview
There are several biomass thermal equipment providers that are active throughout the United States. Historically, biomass thermal providers are strategically located in areas with limited natural gas access and abundant forest resources. In recent years, biomass thermal technology providers have continued to expand throughout the U.S., particularly with the increased participation of European manufacturers that have recently entered into the U.S. market. There are numerous biomass thermal technology types including underfeed, reciprocating grate, chain grate, and pneumatic grate systems, stoker and fluidized bed boiler configurations, and pellet and wood chip orientations. Boiler configurations are typically structured to fit different size and feedstock demands. Stoker boilers are the most simple boiler type with feedstock combustion occurring in one location in the boilers with various grate configurations to optimize air flow through the combustion zone. Fluidized bed boilers utilize a sand bed to allow feedstock to flow through the boiler. The sand is engineered to retain and distribute heat throughout the reaction vessel to increase the efficiency of combustion. Fluidized bed boilers are economically viable for large-scale applications and are rarely deployed with smaller commercial-scale boilers. Underfeed, reciprocating grate, and chain grate are all different stoker boiler configurations to induce proper airflow throughout the feedstock. The underfeed system is the most basic system using air blowers to optimize air flow patterns. Reciprocating grate and chain grate move the feedstock within the combustion chamber and are typically used in large commercial and in industrial applications. The capital cost of reciprocating grate and chain grate systems is often economically prohibitive in small stoker boilers, such as those under review for the Mammoth Lakes area. Biomass thermal facilities may utilize pellets or wood chips. Pellets are used for their ease of conveyance and their energy dense properties. Feedstock conveyance is particularly important with small systems, as loading is required to be more precise in the small units. However, pellets are often significantly more expensive due to the pellet manufacturing process and this cost is further increased by transportation distance from the pellet facility. The biomass availability and cost analysis indicated wholesale pellet prices to cost approximately five times the price of delivered wood chips in the Mammoth Lakes area due to the high transportation costs from the nearest pellet facility (located in John Day, Oregon). Biomass thermal technology that utilizes wood chips is very limited for applications under one MMBtu per hour due to the challenges of conveying chipped material.
Project Greenhouse Gas Impacts
Biomass thermal projects contribute to the reduction of greenhouse gas emissions by displacing fossil fuel and avoiding landfill and pile and burn disposal methods for wood waste. While biomass thermal units are traditionally less efficient than fossil fuel alternatives (due to low energy density fuel), the savings from avoided business-as-usual practices and the long-term benefits of biogenic
40

carbon indicate the biomass thermal energy production is beneficial to greenhouse gas reduction goals. Greenhouse gas accounting is shown in Table 24.
Table 24. Greenhouse Gas Accounting for Biomass Thermal Projects
EMISSIONS SOURCE CO2 EMISSIONS (lb/MMBtuDelivered)
CH4 EMISSIONS (lb/MMBtuDelivered)
CO2e EMISSIONS (lb/MMBtuDelivered)
Biomass Boiler34 279 0.03 280 Biomass Processing and Transport35 5.3 0.003 5.4
Propane Boiler36 -171 -0.003 -171 Pile and Burn Avoided Emissions37 -133 -2 -189
Net Emissions -19.7 -2.0 -74.6 Assumptions used in Table 24 include:
• 70% efficiency for biomass boilers; • 80% efficiency for propane boilers; • 8,500 Btu per dry pound (high heat value) for wood; • 25 pounds of CO2e for one pound of methane emissions; • No carbon offset from future carbon uptake; • No emissions associated with urban biomass feedstock sourced from the landfill; • No emissions associated with the collection, processing, and transportation of propane; and • Pile and burn avoided emissions reflect the feedstock blend of 45% urban wood and 55%
forest wood as indicated in Table 14. Total greenhouse gas emissions will vary slightly by technology; however, the most important means of reducing greenhouse gas emissions is average moisture content of the biomass feedstock. The higher the moisture content, the more energy must be utilized to evaporate the water and the less energy is delivered to heat the building.
Technology Vendors and Developers
TSS recommends that any technology selection take place through a competitive bid process. TSS has gathered a list of manufacturers and service providers that have developed biomass thermal projects sized at a 2 MMBtu per hour (Table 25). TSS believes that these enterprises have the
34 EPA AP-42 Table 1.6-3 35 Springsteen, B., Christofk, T., Eubanks, S., Mason, T., Clavin, C., Storey, B. Emissions Reductions from Woody Biomass Waste for Energy as an Alternative to Open Burning. Journal of the Air and Waste Management Association, 2011. 36 EPA AP-42 Table 1.5-1. 37 Lee, C., Erickson, P., Lazarus, M., Smith, G. Greenhouse Gas and Air Pollutant Emissions of Alternatives for Woody Biomass Residues. Stockholm Environmental Institute. 2010.
41

experience and ability to successfully develop a biomass thermal project in the Mammoth Lakes area.
Table 25. Biomass Thermal Technology Providers and Developers
VENDOR LOCATION UNIT SIZES A3 Energy Partners www.a3energypartners.com Portland, OR Distributor of Viessmann
Systems Advanced Recycling Equipment www.advancedrecyclingequip.com St. Mary’s, PA 0.75 – 60 MMBtu/hr
Alternative Energy Solutions International (UniConfort Boiler) www.aesintl.net
Wichita, KS 0.3 – 20 MMBtu/hr
AFS Energy Systems www.asfenergy.com Harrisburg, PA 1.2 – 40 MMBtu/hr
Chiptec www.chiptec.com Williston, VT 1.5 – 60 MMBtu/hr
Decton Iron Works www.decton.com Butler, WI 0.33 – 4 MMBtu/hr
Fink Machine www.finkmachine.com Enderby, BC, CAN Distributor of Viessmann
Systems Hurst www.hurstboiler.com Coolidge, GA 1.2 – 20 MMBtu/hr
Viessmann (KÖB Boiler Line) www.viessmann-us.com Warwick, RI 0.25 – 8.5 MMBtu/hr
McKinstry www.mckinstry.com Portland, OR Technology Agnostic
Project Developer Messersmith www.burnchips.com Bark River, MI 2 – 20 MMBtu/hr
Precision Energy Service www.pes-world.com Hayden, ID Technology Agnostic
Project Developer Pro-Fab Industries www.profab.org Arborg, MB, CAN 0.75 – 2.5 MMBtu/hr
SolaGen www.solageninc.info St. Helens, OR 0.5 – 200 MMBtu/hr
Wood Master www.woodmaster.com Red Lake Falls, MN 0.5 – 6.8 MMBtu/hr
Technology Selection Process
When conducting a competitive bid process, TSS finds it beneficial for an organization to prioritize critical selection criteria before receiving bids in order to better compare technology types and proposals. Table 26 outlines several critical considerations when selecting a technology provider. The list in Table 26 is shown in alphabetical order and is not prioritized.
Table 26. Selection Criteria
42

CRITERIA CONSIDERATIONS
Company and Equipment Track Record
As with any contractor, company history is an important criterion that is an indicator of track record. This criterion is often best
understood through interviews and discussions with references and focuses on the personal connection that a company makes with its
clients.
Company Longevity and Total
Installations
Company longevity is a surrogate measure for performance. The longer a company has been around, the more challenges it has faced and the more unexpected issues it has resolved. While each project is unique, company experience can be an important factor in project
development.
Ease of Maintenance and O&M
Time Requirements
Biomass thermal units require more operations and maintenance (O&M) and thus are more time intensive than natural gas, propane,
fuel oil, or electric substitutes. Managing a solid fuel supply requires some additional oversight to ensure proper function.
Options and add-ons such as automatic ash removal and remote monitoring can reduce O&M time and can ease the transition from
fossil fuel to renewables.
Air Emissions
Small biomass thermal units typically do not run into air emissions challenges, but each air district is different. It is important to
identify the emission criteria and permitting thresholds for your air district and ensure that any developer can meet those limits.
Feedstock Flexibility
Many small biomass units are designed to utilize pellets. While larger biomass units are typically more flexible with wood chips,
small biomass units can require very specific feedstock sizing. It is important to understand the available wood feedstock
characteristics in the area and the wood processing equipment constraints and ensure that there is a good match.
Local Installations Local installation and local knowledge are important in project
development. Biomass thermal units are not commonplace, making replacement parts and service an important consideration.
Low O&M Costs
Low O&M costs are important and are often overlooked through a bid process. O&M costs are typically dictated by the quality of the equipment and the availability of parts in the local area. In many
cases, increased O&M costs and subsequent problems from challenging or frequent O&M issues do not outweigh the reduction
in capital costs often associated with cheaper parts.
Price Capital cost may vary significantly between manufacturers and all bids will not be equal in price or in quality. Managing costs and
features is important to truly understand the best options.
Unit Size
While vendors may be able to provide equipment solutions, identifying a company’s typical project size and their number of
installations in a specific size range is important to understanding a company’s experience.
43

TSS recommends that organizations review and prioritize these criteria based on the specific project goals. There are many factors involved in the selection of a technology vendor, and developer proposals may change depending on workload, seasonal constraints, geographic constraints, or business policy. TSS believes it is important to solicit bids from multiple vendors. Appendix B includes an RFP template that may be used for developing biomass thermal facilities in Mammoth Lakes. In addition to a proposal, TSS strongly recommends communication with project client references. Project references can provide critical insight into the challenges that arise during the installation and operation of a biomass thermal facility. Additionally, client references can provide insight from the perspective of an organization new to bioenergy. This perspective can be very valuable before initiating the first biomass thermal installation. TSS has found that client references often stress the importance of staff training. Biomass thermal systems, while relatively easy to use, still require more work than fossil fuel boilers. There is always a transition period for operations and maintenance staff, and dedication to proper training is important to ease this transition. Note that several manufacturers offer remote monitoring which allows representatives from the technology vendor to monitor the performance of the boiler and address potential issues.
44

PERMITTING PLAN The permitting plan identifies environmental and land use permits required (if any), provides key agency input, presents expected fees, and includes a recommended implementation schedule to secure permits. The permitting plan is based on application forms, prior experience of the project’s consulting team, and communication with representatives from permitting agencies. Per the findings in the Site Review and Analysis and the Biomass Feedstock Availability and Cost Analysis, biomass thermal systems are appropriate for the biomass resource in the Mammoth Lakes area. The installation of a biomass thermal system to replace an existing heating system does not require any additional land use entitlements or water permits. Thus, it has been determined that the only environmental permit required for a biomass thermal system would be an air quality permit from the Great Basin Unified Air Pollution Control District (GBAPCD).
Air Quality Permitting
Air quality permitting in the Mammoth Lakes region is under the jurisdiction of the GBUAPCD. The GBUAPCD enforces Federal, State, and local air quality regulations and to ensure that the federal and state air quality standards are met. In consultation with the GBUAPCD, it has been determined that biomass thermal units operating within the District will require an air quality permit. There is an exemption in the GBUAPCD rules for steam generators, steam superheaters, water boilers, water heaters, and closed heat transfer systems that have a maximum heat input rate of less than 15 MMBtu per hour.38 However, these units must be fired exclusively with natural gas or liquefied petroleum gas or any combination thereof. Thermal units utilizing woody biomass must apply for, and obtain, an air quality permit. There is no minimal size level in the GBUAPCD regulations.
Application Process The GBUAPCD requires that before an air pollutant emitting system is installed within the district, an Authority to Construct (ATC) permit must be obtained.39 The application process for a biomass fueled boiler system includes:
• Prepare GBUAPCD Authority to Construction Application – General Information Form (APCD – 004, see Appendix C) and the Fuel Burning Equipment Form (APCD – 008, see Appendix D) These application forms will require the following information:
- Permittee information and location of project; - Type of application – a biomass boiler system at any location would be considered a
new facility; - Detailed description of the facility and type of biomass fuel burning equipment; and - Description of process, configuration, emissions control equipment, and maximum air
emissions quantity (such as PM, CO, VOCs, NOx, and SOx).
38 GBUAPCD Rule 201 F 39 GBUAPCD Rule 200
45

• The GBUAPCD will review application for completeness and either issue applicant a determination letter or request additional information.
• Upon application completeness determination, GBUAPCD will prepare an engineering evaluation and draft permit.
• The draft permit will be circulated for a 30-day public review.
• Comments will be addressed and permit will be issued.
It is expected that a biomass-fueled boiler systems located at the sites identified in the Site Review and Analysis will have very low air pollutant emissions due to the relatively small size. Table 27 shows the projected emissions form a 2.0 MMBtu per hour boiler operating at 70% efficiency and at an 18% capacity factor.
Table 27. Project Criteria Pollutant Emissions: 2.0 MMBtu/hr Biomass Boilers
CO NOx SO2 PM* PM10* PM2.5* LEAD VOC Biomass Boiler40 (lb/MMBtu) 0.6 0.22 0.025 0.22 0.20 0.12 0.00005 0.017
Annual Emissions (TPY) 1.69 0.62 0.07 0.62 0.56 0.34 0.00014 0.05
*Emissions factor based on the use of a mechanical collector (e.g., multiclone) to reduce PM The emissions levels in Table 27 would typically result in relatively easy air quality permitting; however, the air toxics policy of the GBUAPCD adds challenges to permitting even small biomass-fueled boiler systems.
Toxic Risk Assessment Policy The GBUAPCD adopted a Toxic Risk Assessment Policy in 1987. That policy guides how the GBUAPCD deals with air quality permit issuance when the proposed source emits Toxic Air Contaminants, as defined and listed by the California Air Resources Board and the U.S. EPA. The Toxic Risk Assessment Policy () states:
1. Sources that emit Toxic Air Contaminants, as listed by the Air Resources Board or EPA must apply for a permit.
2. A screening risk assessment will be performed by the district. If the lifetime carcinogenic risk to the maximum exposed individual is less than or equal to one-in-one-million (1 x 10⁻⁶), a permit will be granted. If the risk is greater than 1 x 10⁻⁶, the proponent will be required to do a formal risk assessment and an Environmental Impact Report.
3. Proposed sources which result in a carcinogenic risk of greater than 10 x 10-6 would be denied permits. Proposed sources which result in a carcinogenic risk between 1 x 10⁻⁶ and 10 x 10-6 may be issued a permit if appropriate mitigations are incorporated into the project.
The direct combustion of woody biomass in a thermal boiler system will result in the potential release of toxic air contaminants (e.g., volatile and semi-volatile organic compounds such as benzene, acrolein, and naphthalene). To assess this potential, the GBUAPCD prepared a preliminary toxic risk assessment spreadsheet, which TSS has applied to the preferred sites in the Mammoth
40 Environmental Protection Agency, AP-42: Chapter 1, Section 6.
46

Lakes area where a biomass boiler system could be installed. The district’s preliminary toxic risk assessment spreadsheet calculates the chronic and acute risk due to emissions of a selected number of organic compounds considered by the California Air Resources Board and the California Office of Environmental Health Hazard Assessment (list of these compounds can be found in Appendix E). The purpose of this spreadsheet is to make a preliminary determination of what the carcinogenic risk to a maximum-exposed individual person might be. Distance to the receptor (typically a residence), size of the biomass boiler system, and emission factors for the organic compounds (referenced from EPA’s AP-42 emission factors for wood combustion) are all factors used together to determine the potential carcinogenic risk. TSS employed this preliminary risk assessment spreadsheet to the various preferred sites as indicated above. The results pose challenges in acquiring the air permits given the GBUPACD Toxic Risk Policy. Examples include:
• At the Mammoth Mountain Resort Maintenance building the biomass boiler would have to accept an air permit, which would place a limit on the number of hours it could operate. The hour limitation calculated would be higher than the biomass boiler is calculated to run on an annual hour basis (approximately 50% capacity factor).
• At potential sites in the town of Mammoth Lakes, such as the school and hospital, the immediate proximity of residences results in carcinogenic risk factor exceeding 10 x 10-6
even with low operating hours. It would likely be necessary to install an expensive emissions control system to lower the subject organic compounds concentration levels to below the 10 x 10-6 level. And, unless the emission control system was able to lower the risk level to below the 1 x 10⁻⁶ GBUAPCD policy would require an Environmental Impact Report to be prepared. This would significantly increase the cost to installing the biomass boiler system.
Air Permitting Fees Rule 301, Permit Fee Schedule 2 - Fuel Burning Equipment Schedule: Any article, machine, equipment or other contrivance in which fuel is burned, with the exception of incinerators which are covered in Schedule 4, shall be assessed a permit fee based upon the design fuel consumption of the article, machine, equipment or other contrivance expressed in thousands of BTUs per hour, using gross heating values of the fuel, in accordance with the following schedule in Table 28.
47

Table 28. Air Permitting Fee Schedule41
UNIT SIZE (BTU/HR)
INITIAL ATC PERMIT FEE
ANNUAL ATC PERMIT FEE
Up to and including 150,000 $80.00 $65.00 Greater than 150,000 but less than 400,000 $157.00 $129.00 400,000 or greater but less than 650,000 $320.00 $129.00 650,000 or greater but less than 1.5 MM $805.00 $383.00 1.5 MM or greater but less than 5 MM $1,273.00 $517.00 5 MM or greater but less than 15 MM $1,687.00 $779.00
Permitting Schedule Once an ATC application is submitted to the GBUAPCD, the district has 30 days to determine if the application is complete (all of the necessary information for the district to conduct an engineering evaluation is contained in the application package). If not, the district will request additional information to make their completeness determination. This additional information request will restart a 30-day review period. Once the application is deemed complete, the district has up to 180 days to issue the permit. However, the time to actually conduct the engineering evaluation and prepare the permit for issuance can be much less than 210 days.
Findings
The installation of a biomass thermal system to replace an existing heating system does not require any additional land use entitlements. Thus, it has been determined that the only environmental permit required for a biomass thermal system would be an air quality permit from the GBUAPCD. It is expected that a biomass-fueled boiler systems in the Mammoth Lakes area and at the preferred sites previously identified will have very low air pollutant emissions due to the relatively small size. The direct combustion of woody biomass in a thermal boiler system will result in the potential release of toxic air contaminants. The release of toxic air contaminants is governed by GBUAPCD policy, which will present challenges to the siting of biomass thermal units at certain sites within the Mammoth Lakes area, particularly those near residential dwelling units. The Mammoth Mountain Ski Resort Maintenance building is remote enough from sensitive receptors that the GBUAPCD Toxic Risk Assessment Policy has relatively small effect on siting a biomass thermal unit at that location.
41 This fee schedule only includes units not exceeding 15 MMBtu per hour, as no single system in the Mammoth Lakes area is expected to exceed that size.
48

OUTREACH AND COMMUNICATIONS PLAN The outreach and communications necessary for the development of a biomass thermal facility are significantly reduced compared to the development of a biomass CHP facility. Analogous to fossil fuel development, the installation of a propane boiler at one facility does not require the same community outreach as the development of a one MW propane-fired power plant. TSS does not recommend broad community outreach and communications for the installation of a biomass thermal facility. However, outreach and communication may be important to immediate stakeholders (e.g., individuals and organizations that utilize the facility). Without the need for a land use entitlement or CEQA review for small-scale thermal applications, there is no period for public involvement with the project. TSS does recommend the promotion of this renewable energy development through informational material that can be used to inform stakeholders of the benefits of biomass thermal facilities. TSS has developed a frequently asked questions (FAQ) document (Appendix F) that can be utilized by an organization to provide material to interested parties. Additionally, TSS recommends that the EBPT conduct outreach to community members who are in a position to influence development decisions of their organization towards renewable energy. The findings of this feasibility analysis will provide valuable information to any organization in the Mammoth Lakes area that currently utilizes a fuel oil or propane boiler to provide heat to their facilities.
49

RECOMMENDATIONS AND NEXT STEPS This feasibility study found that a small-scale biomass thermal facility, co-located at the Mammoth Mountain Resort maintenance facility, is a financially viable option to augment an existing propane fired boiler. Locally available biomass feedstocks are readily available, the project can be permitted, the biomass conversion technology is available, and the Mammoth Lakes community appears to be supportive. TSS recommends that the Mammoth Mountain Ski Resort and the EBPT consider proceeding with next steps as presented below. For the Mammoth Mountain Ski Resort
• Present study findings to the key stakeholders (e.g., Mammoth Mountain Resort management) and review plans for next steps. (TSS is planning to present findings to the EBPT).
• With assistance from the EBPT, develop and implement a strategic plan to source grants/loan guarantees from targeted private foundations, federal and state agencies (e.g., USFS sponsored Woody Biomass Utilization Grant, CARB sponsored AB 32 Cap and Trade Revenue Investment Plan).
• Begin discussion with feedstock supply contractors and the Benton Crossing landfill. • Commence technology selection process (using RFP provided by TSS as a template). • Issue Request for Quotes from select engineering and construction firms. • Update internal financial analysis based on latest data. • Select and contract with technology/engineering and construction firm. • Engineer, construct, and start up.
Figure 8. Project Timeline: Mammoth Mountain Ski Resort
SCHEDULE (MONTH) 1 2 3 4 5 6 7 8 9 10 11 12
Present Findings Strategic Funding Feedstock Procurement Technology Selection Engineering and Construction RFQ Update Financial Pro Forma Select Technology & EAPC Engineering Construction Commissioning
50

For the Eastside Biomass Project Team
• Present findings to the key stakeholders (Mono County Board of Supervisors, USFS, Mammoth Mountain Resort management staff) and other stakeholders as well as review plans for next steps. (TSS is planning to present findings to the EBPT).
• Continue to post key project and technology related documents on the Mono County Renewable Energy Project web page.
• Continue outreach to others to identify options for additional use of thermal energy (e.g., greenhouse for native plants, food drying processes, etc.).
• Support Mammoth Mountain Ski Resort through the initial process and document lessons learned for utilization with subsequent projects.
51

Appendix A. TSS Comments on the Inyo National Forest Land Resource Management Plan Revisions

Inyo National Forest Plan Revision
TSS Consultants
1
Suggested Comments Regarding the Inyo NF Forest Plan
Revision Assessment
The Inyo NF has extended the public review period and is accepting comments regarding
the Forest Plan Revision Assessment through September 1, 2013. The Forest has issued
several topic papers that provide an overview of key topics that will be addressed in the
Forest Plan Revision. The Eastside Biomass Project Team requested that TSS provide
draft comments that the Team can consider for possible delivery to the Inyo NF.
Outlined below are observations/recommendations:
The Carbon Stocks topic paper confirms the importance of healthy forests and
their contribution to carbon pools in support of GHG reduction. In addition the
topic paper confirms the influence of forest thinning on tree growth and improved
carbon stocks. Healthy, fire resilient forests provide defensible space for
communities and for fire suppression personnel while mitigating fire behavior.
Reduction in acres impacted by wildfire mitigates GHG emissions generated
during a wildfire event. In order to support GHG reduction and improved forest
carbon stocks the Inyo NF should:
o Minimize the amount of pile and burn activities. Wherever
practical consider removal of forest biomass for value-added uses
(compost, chips for thermal energy, landscape cover) as an
alternative to business as usual pile and burn activities. A 2008
research project completed by the Placer County Air Pollution
Control District confirmed the net air emissions benefits of forest
biomass diversion for use as fuel for bioenergy (see attached).
o Minimizing pile and burn activities will improve air quality and
reduce regional haze. The Mammoth Lakes region’s economic
base is anchored in outdoor recreational activities. As such, good
air quality is a key factor influencing the visitor’s experience when
recreating in the area.
Wildfire is of major concern to communities located along the eastern slope of the
Sierra Nevada. Ramping up strategic forest thinning and harvest activities will
mitigate wildfire behavior and help these communities survive catastrophic
wildfire events. Recommendations:
o Ramp up forest health and restoration treatments (acres treated) to
pre-1999 levels.
The Timber topic paper notes (see Table 1. - Volume Growth, Mortality and
Timber Harvest Activity for the Inyo National Forest, on Page 4) that planned

Inyo National Forest Plan Revision
TSS Consultants
2
average annual timber sale volume is 24% of net annual growth (minus annual
mortality). This planned level of timber sale (6,500 CCF/year) is not adequate to
address the current backlog of overstocked conditions on the Forest, let alone
address current annual growth. Recommendations:
o The Forest should consider timber management activities that
approach past harvest levels (pre-1999 as suggested earlier) that
are closer to actual forest growth.
o Consider the use of more Stewardship Contracts that are three to
ten years in duration. Local contractors cannot make capital
improvements or investments to utilize excess forest biomass
without assurances of sustained work.
o Timber sales contracts (including Stewardship Contracts) should
include provisions for optional removal of excess biomass
material. If biomass material is removed and not left for pile/burn
disposal, the timber sale purchaser should be able to recover slash
deposits (aka burn deposits).
The Renewable Energy topic paper provides a brief description of biomass power
but does not expand on recent state policies that provide significant incentives for
the development of new community-scale bioenergy projects:
o Senate Bill 1122 - directs the CA Public Utilities Commission to
implement a feed-in tariff program targeting 250 MW of small-
scale (1 to 3 MW output capacity) bioenergy projects.
o California Interagency Bioenergy Action Plan sets specific goals
for strategic deployment of small-scale bioenergy projects.

Appendix B. Request for Proposals Template

WOODY BIOMASS-FIRED THERMAL HEAT PROJECT IN MAMMOTH LAKES, CALIFORNIA
[Organization Name]
Request for Proposal
Based on an economic and technical feasibility evaluation performed by TSS Consultants, the
[Organization Name] has determined that a woody biomass-fired heating system may be appropriate for
the [Project Location] in Mammoth Lakes, CA. The project is a strategic step to reduce heating costs, and
adhere to the [Organization]’s mission of sustainability. [Project Developer] has been selected as a
preferred candidate to receive this Request for Proposals (RFP).
Feedstock Parameters: Woody biomass feedstock will be locally sourced from forest operations and the
local landfill. The proposed system must be sufficiently robust to utilize ground and chipped woody
biomass as the primary feedstock. Pellets are not economically available in the Mammoth Lakes area.
Woody biomass material will range from ¼” to 4” in particle size. Feedstock may be delivered with
moisture contents ranging from 30% - 50% (wet basis). Heat content of the fuel is expected to be 8,000 –
8,500 Btu/lb (dry basis). Feedstock samples may be sent upon request via standard USPS shipping.
Project Timeline: RFP responses are due electronically by [Date]. After a review period of up to
[Number of] days, the top ranked technology and project development team will enter into negotiations to
determine the path forward for the completion of the project and will be offered an memorandum of
understanding that the project will proceed forward exclusively with the selected bidder. [Organization
Name] is not required to accept or select any bids.
Technology Requirement: The proposed technology should be capable of generating [Unit Size]
MMBtu/hr of [Hot water or steam specifications of the existing system]. The proposed system must be
able to convey and utilize the feedstock as specified by the feedstock parameters (as noted above) and
meet any regulations outlined in this RFP.
Air Emissions: As the proposed system will be located in Mammoth Lakes, air quality permitting will
be subject to the Great Basin Unified Air Pollution Control District’s regulations. Responses should
include appropriate emissions factors to be used for the project’s air permit application including carbon
monoxide (CO), nitrogen oxides (NOx), particulate matter (PM), and volatile organic compounds (VOCs).
Emissions source tests or successful permit application documents for comparably sized units would be
appreciated where possible.
Selection Criteria: Responses will be evaluated based on the following criteria: (1) Ability to produce
[hot water or steam] with the specified biomass feedstock; (2) Ability to meet air quality permit
requirements; (3) Facility size (footprint) without fuel storage; (4) Fuel consumption rates per unit of
output (net heat rate); and (5) Estimated capital, training, installation, freight, and expected O&M costs
and time requirements for the entire system.
Contents of Response Submittal: All responses should include the following information. Responses
should be organized in the following format:
1) A technical description of the entire proposed system including feedstock handling, ash removal,
and emissions controls.
2) Identify required resources including footprint and estimated system efficiency.

3) Company profile and statement of qualifications of manufacturer, including experience with
woody biomass fuels, relevant projects, contact information for references (operators of
comparably-sized systems utilizing chipped woody feedstock are preferred).
4) Cost estimates including equipment capital costs, freight, training, installation (not including
interconnection to the existing system), commissioning, expected maintenance costs and
timeframe, and service contract options.
5) Operating requirements of on-site personnel, training, and maintenance schedule.
6) Supplementary information (at the discretion of the candidate).
Deadline for Responses: Electronic replies are due by close of the [Date]. Reponses are to be submitted
to [Electronic Contact Information] unless other arrangements are requested in advance. Please limit your
responses to no more than 20 pages. Candidate’s responses should be delivered in digital format (no need
to send hardcopies).
Contact: All communications should be directed to [Contact Information]
[Company Logo]

Appendix C. Authority to Construct Application

Great Basin Unified Air Pollution Control District
APCD – 004 (Section A-1, Page 1 of 2)
Section A-1 Authority To Construct / Permit To Operate Application General Information
Reason for Application (Check one) New Source Modification to Existing Source Change of Ownership
A. Section A-1, pages 1 & 2 must be filled out COMPLETELY for EACH article, machine, equipment, contrivance or secondary source requiring a permit.
B. A FILING FEE of $100.00 paid by check, or money order must accompany EACH application. 1. Permit to be issued to:
2a. Mailing Address:
Street or PO Box City or Town State Zip Code 2b. Billing Address, if different from mailing address:
Street or PO Box City or Town State Zip Code 3. Type of Organization:
Corporation Individual Owner Partnership Government Agency
4. Person to Contact on Air Pollution Matters:
Name Title Telephone Number Email address 5 Exact Source Location – Include Name and Location (County or City):
6. Pursuant to the provisions of the Health and Safety Code of the State of California and the Rules and Regulations of the Great
Basin Unified APCD, application is hereby made for and AUTHORITY TO CONSTRUCT/PERMIT TO OPERATE the following article, machine, equipment, contrivance or secondary source:
7. Owner or Certified Official:
Name Title Telephone Number Email address
8. Signature: Date:
DO NOT WRITE BELOW (APCD USE ONLY) Date Received Stamp Application Number Filing Receipt Fee Schedule Received By

Great Basin Unified Air Pollution Control District
APCD – 004 (Section A-1) Page 2 of 2
Section A-1 Authority To Construct / Permit To Operate Application General Information9. Person Completing Form:
Date: Email address:
10. List the Products Manufactured and/or Services Performed at this Facility:
11. Complete the dates applicable to your planned project, estimating dates as closely as possible.
MILESTONES
STARTING DATE
COMPLETION DATE
Site Selection
Design and Specs
Construction Contract Let
New Source Construction
Modification of Existing Equip.
Final Source Emission Testing
Transfer of Location
Transfer of Ownership

Appendix D. Fuel Burning Equipment Form
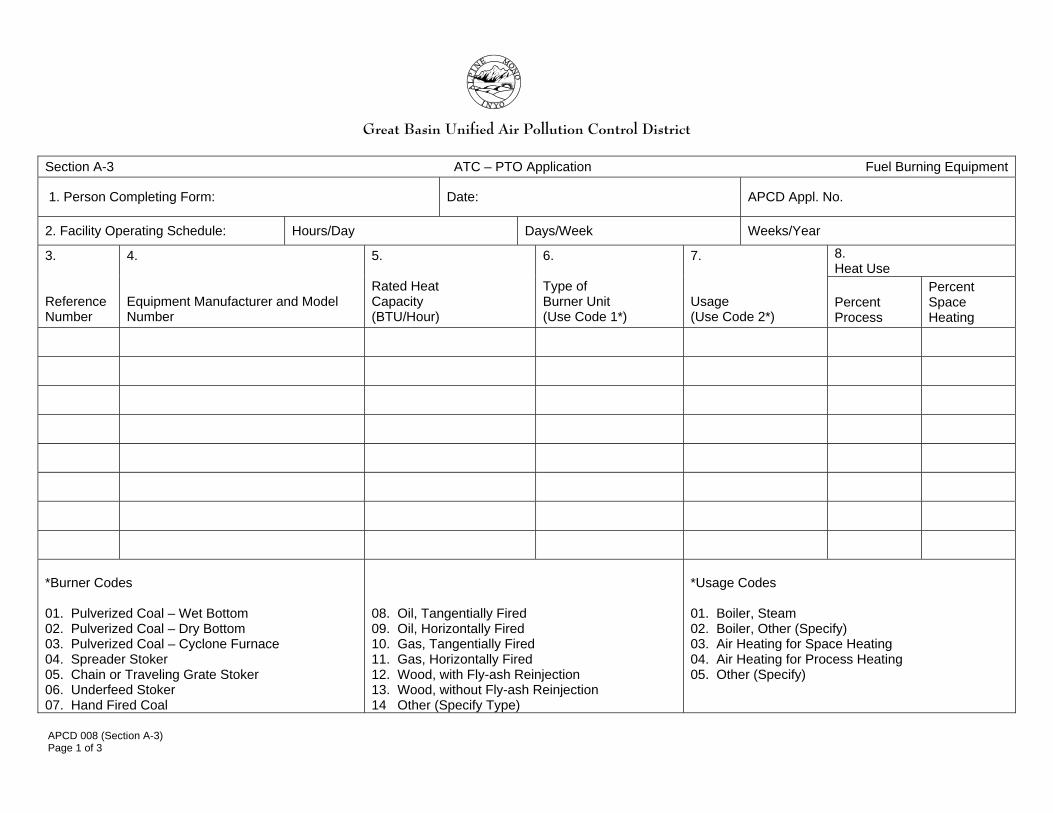
Great Basin Unified Air Pollution Control District
APCD 008 (Section A-3) Page 1 of 3
Section A-3 ATC – PTO Application Fuel Burning Equipment
1. Person Completing Form: Date: APCD Appl. No.
2. Facility Operating Schedule: Hours/Day Days/Week Weeks/Year
8. Heat Use
3. Reference Number
4. Equipment Manufacturer and Model Number
5. Rated Heat Capacity (BTU/Hour)
6. Type of Burner Unit (Use Code 1*)
7. Usage (Use Code 2*)
Percent Process
Percent Space Heating
*Burner Codes
01. Pulverized Coal – Wet Bottom 02. Pulverized Coal – Dry Bottom 03. Pulverized Coal – Cyclone Furnace 04. Spreader Stoker 05. Chain or Traveling Grate Stoker 06. Underfeed Stoker 07. Hand Fired Coal
08. Oil, Tangentially Fired 09. Oil, Horizontally Fired 10. Gas, Tangentially Fired 11. Gas, Horizontally Fired 12. Wood, with Fly-ash Reinjection 13. Wood, without Fly-ash Reinjection 14 Other (Specify Type)
*Usage Codes 01. Boiler, Steam 02. Boiler, Other (Specify) 03. Air Heating for Space Heating 04. Air Heating for Process Heating 05. Other (Specify)

Great Basin Unified Air Pollution Control District
APCD 008 (Section A-3) Page 2 of 3
Section A-3 ATC – PTO Application Fuel Burning Equipment - Continued
9. Person Completing Form: Date: APCD Appl. No.
11. Stack or Exhaust Data 12. Fuel(s) Data 10. Reference Number
Stack Height (Feet)
Exit Diameter
(Feet)
Exit Gas Velocity
(Feet/Min.)
Exit Gas Volume (ACFM*)
Max. Amount Burned/Hour
(Specify Units)
Amount Per Year
(Specify Units)
Heat Content BTU Gal., etc. (Specify Units)
%
Sulfur
%
Ash
Fuel Supplier Data Reference: Number Type of Fuel Supplier Name and Address
*ACFM – Actual Cubic Feet per Minute

Great Basin Unified Air Pollution Control District
APCD 008 (Section A-3) Page 3 of 3
Section A-3 ATC – PTO Application Fuel Burning Equipment - Continued
13. Person Completing Form: Date: APCD Appl. No.
15. Air Pollution Control Equipment 16. Emission Rates Efficiency (Give in Units of Tons per Year)
14. Reference Number
Manufacturer And Model Number
Type (Use Codes)*
Design Percent
Actual
Percent
Particulates
Sulfur Oxides
Carbon
Monoxide
Volatile Organic
Compounds
Nitrogen Oxides
Basis For
Emission Est.
*Air Pollution Control Equipment Codes 01 Settling Chamber 02. Cyclone 03. Multicyclone 04. Cyclone Scrubber 05. Orifice Scrubber 06. Mechanical Scrubber 07. Ventural Scrubber
08. Mist Eliminator 09. Electrostatic Precipitator 10. Baghouse (Fabric Filter) 11. Catalytic Afterburner 12. Direct Flame Afterburner 13. Packed Tower 14. Other (Specify)
For Wet Scrubbers, List Gallons per Minute Water Flow and Inches Water Pressure Drop Across Scrubber if Known.

Appendix E. Great Basin Unified Air Pollution Control District’s Toxic Air Assessment Policy
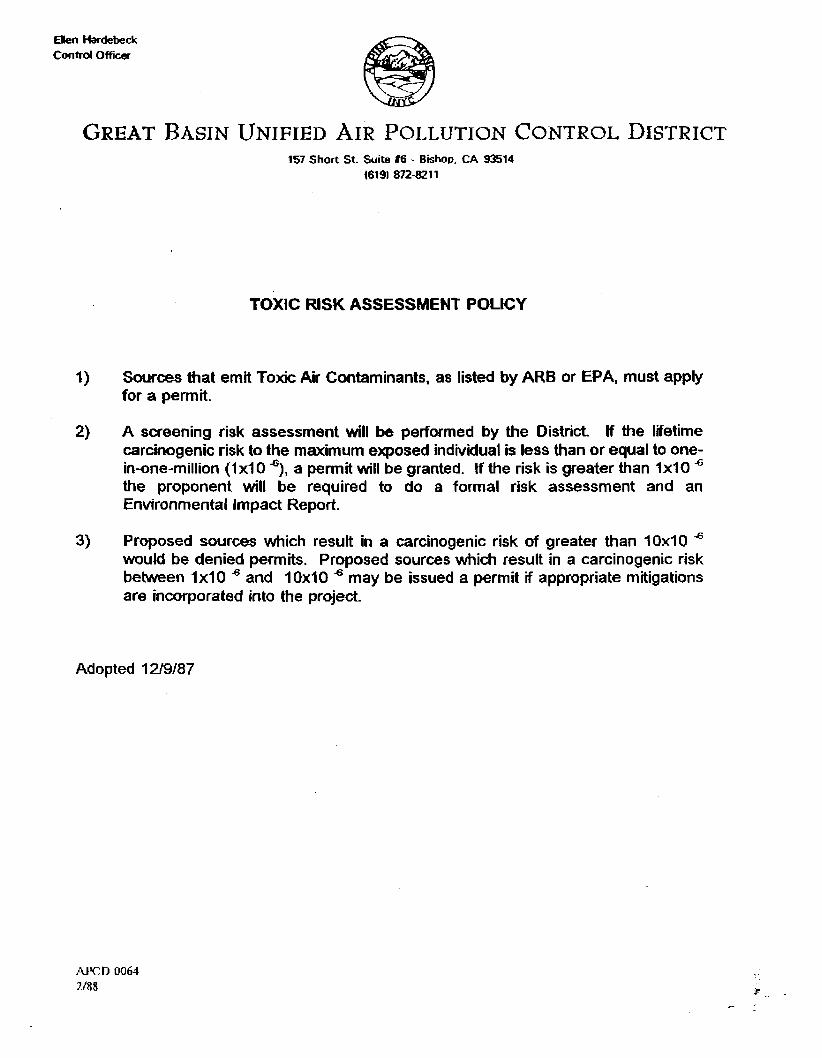
Elen Hadzbzck contrd Officer
I!57 short St. Suite #6 - Bishop, CA 93514 16191 872-821 1
TOXIC RISK ASSESSMENT POUCY
I) Sources that emit Toxic Air contaminants, as listed by AR8 or EPA, must apply for a permit.
2) A screening risk assessment will be performed by the District. If the lifetime carcinogenic risk to the maximum exposed individual is less than or equal to one- in-one-million (1 XI 0 a permit will be granted. !f the risk is greater than 1 xlO &
the proponent will be required to do a formal risk assessment and an Environmental Impact Report.
3) Proposed sources which result in a carcinogenic risk of greater than 10x10 " would be denied permits. Proposed sources wfiich result in a carcinogenic risk between 1x10 " and 10x10 " may be issued a permit if appropriate mitigations are incorporated into the project.
Adopted 1219187

Appendix F. Frequently Asked Questions
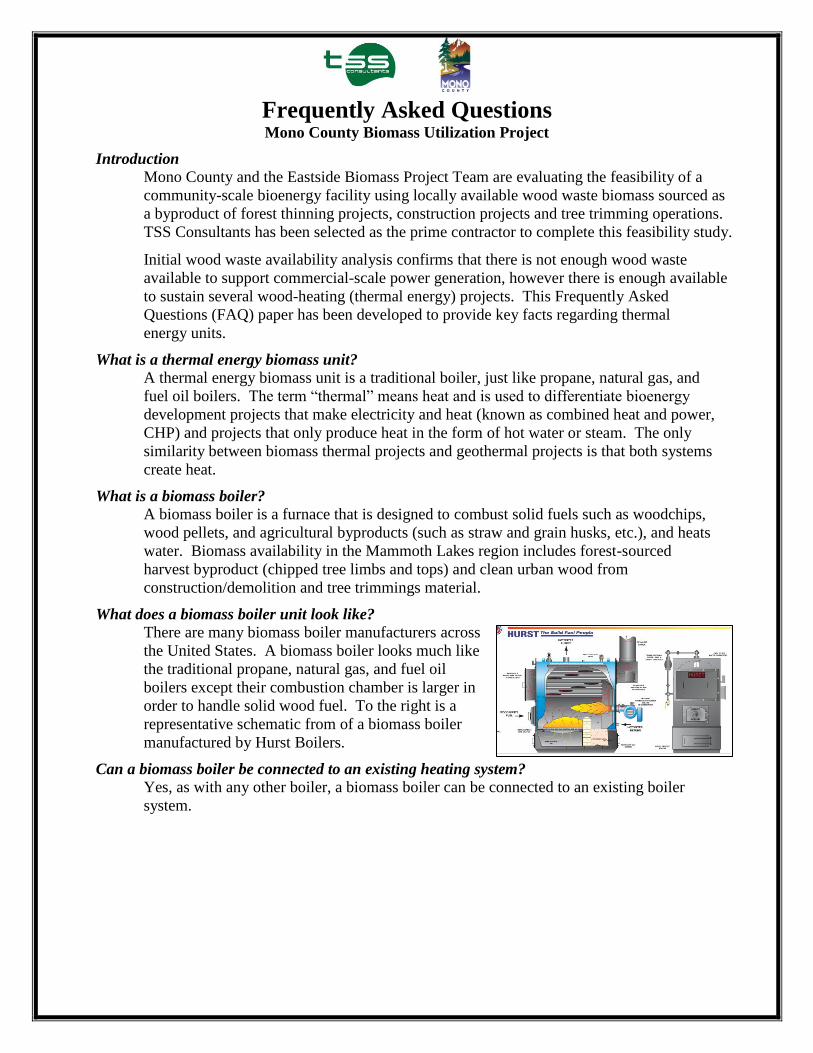
Frequently Asked Questions Mono County Biomass Utilization Project
Introduction
Mono County and the Eastside Biomass Project Team are evaluating the feasibility of a
community-scale bioenergy facility using locally available wood waste biomass sourced as
a byproduct of forest thinning projects, construction projects and tree trimming operations.
TSS Consultants has been selected as the prime contractor to complete this feasibility study.
Initial wood waste availability analysis confirms that there is not enough wood waste
available to support commercial-scale power generation, however there is enough available
to sustain several wood-heating (thermal energy) projects. This Frequently Asked
Questions (FAQ) paper has been developed to provide key facts regarding thermal
energy units.
What is a thermal energy biomass unit?
A thermal energy biomass unit is a traditional boiler, just like propane, natural gas, and
fuel oil boilers. The term “thermal” means heat and is used to differentiate bioenergy
development projects that make electricity and heat (known as combined heat and power,
CHP) and projects that only produce heat in the form of hot water or steam. The only
similarity between biomass thermal projects and geothermal projects is that both systems
create heat.
What is a biomass boiler?
A biomass boiler is a furnace that is designed to combust solid fuels such as woodchips,
wood pellets, and agricultural byproducts (such as straw and grain husks, etc.), and heats
water. Biomass availability in the Mammoth Lakes region includes forest-sourced
harvest byproduct (chipped tree limbs and tops) and clean urban wood from
construction/demolition and tree trimmings material.
What does a biomass boiler unit look like?
There are many biomass boiler manufacturers across
the United States. A biomass boiler looks much like
the traditional propane, natural gas, and fuel oil
boilers except their combustion chamber is larger in
order to handle solid wood fuel. To the right is a
representative schematic from of a biomass boiler
manufactured by Hurst Boilers.
Can a biomass boiler be connected to an existing heating system?
Yes, as with any other boiler, a biomass boiler can be connected to an existing boiler
system.

Will truck traffic increase significantly?
No. Wood fuel deliveries will be made using commercial trucks (55 to 65 feet in length)
that carry approximately 25 tons of wood chips. Deliveries may amount to two to three
truckloads per week during the coldest winter months. In the summer, maybe one
truckload per week will be needed.
Will the thermal biomass unit be noisy when operating?
No. The only additional noise generated will be the occasional truck traffic for the
delivery of wood chips.
How are chips stored?
Chips are stored in a concrete bunker and are fed automatically from the storage area into
the biomass boiler. The storage should be covered in a facility to avoid exposure to
inclement weather (rain, snow) with sufficient space heating to avoid chips freezing
together and clogging the conveyance system.
How much does a biomass boiler cost?
While the cost of a biomass boiler itself is comparable to fossil fuel boilers, the additional
costs from engineering work associated with feedstock storage and conveyance can
increase the cost of installation when compared to a traditional fossil-fuel boiler.
Installation costs will vary significantly from site to site.
What maintenance does a biomass boiler require?
Biomass boilers require more attention than fossil fuel boilers. Biomass boilers can
operate unattended, but weekly inspection visits are required to carry out a visual
inspection of the boiler and the feed system, to check the lubrication of bearings, and
dispose of the ash. If the boiler is not fitted with automatic flue cleaning, regular
cleaning of the flue tubes is required using a flue brush.
Are the air emissions generated similar to a wood burning fireplace or stove?
Unlike the standard residential fireplace and most wood stoves, the biomass boiler will be
equipped with appropriate air emissions control equipment as determined during the air
quality permitting process. At minimum, emissions control will be installed to eliminate
particulate matter emissions (the source of visible smoke).
Are air permits necessary for biomass boilers?
Air quality permits in Mammoth Lakes are administered by the Great Basin Air Pollution
Control District. Biomass boilers are required to apply for and obtain air permits, and
must meet the applicable limits for toxins and particulate matter emissions. Emissions
controls may be required to meet these standards, and no visible smoke will be emitted
from the boiler system.
How is the ash disposed?
Ash produced from biomass boilers can be used as soil amendment in agricultural or
residential settings. If insufficient quantities are produced to utilize on rangeland,
farmland or home gardens, the ash may be disposed of at the local landfill.
Information for the FAQ has been compiled by TSS Consultants from many sources with significant information
provided by the Biomass Energy Centre, UK. For more information, contact Dan Lyster, Mono County, at
[email protected], or Tad Mason, TSS Consultants, at [email protected].
Release date: 11.13.13