comprehensive cost management ccm - c.ymcdn.com · –ccm unit cost development case study...
TRANSCRIPT

page 1
M
Comprehensive Cost Management
CCInstitute – 2016

page 2
•Business Performance Management Model
•Developing & Administering an CCM Information Database
–CCM Responsibility Center Classifications
–CCM Cost Distribution Techniques for Integrated Profitability
–CCM Unit Cost Development Techniques
–CCM Unit Cost Development Case Study
Comprehensive Cost Management Agenda
Session I
Session II
•Cost Deployment – Integrated Resource Management–CCM Unit Cost Deployment Case Study
•Cost Deployment – Integrated Profitability Measurement
•Establishing Business Performance Management Targets
•Strategic Analyses and Pricing

page 3
Business Performance Management
(BPM) Model
Fostering the dialogue between
Service Provider and Service Receiver

page 4
Phase 1 - Budgeting and Responsibility Center Reporting
Phase 2 - Expense Pooling and Allocations
Phase 3 – Organization/Line of Business Profitability
Phase 4 - Product and Customer Value Estimates
Phase 5 - Comprehensive Cost Management
Phase 7 - Integration – Resource Mgmt. and Profitability Measurement
Business
Information
Value
Business Information Requirements
Financial Information
directly linked to
Business Events
and Customer
Interactions
Accounting
Integration
Performance Measurement Continuum
Phase 10 - Strategic Management
Phase 8 – Integrated and InformedPlanning and Forecasting
Phase 6 - Integration – Financial and Non-Financial Performance Metrics
Phase 9 – Strategic Business Analysis
Business Performance Management

page 5
• Business Performance Analyses & Strategies
– Analyze current Performance and Financial Operating Results (Trend Analyses, Internal Benchmarks, External Benchmarks, Business Performance Indicators, etc.)
• Set Performance Targets - Management Commitment
– Set Performance Metrics and establish Forecasts and Key Performance Indicator (KPI) Targets
• Measure Actual Realization - Management Accountability
– Measure Actual Results against Forecasts and Target KPIs
• Acknowledgement
– Acknowledge Meeting Targets and Performance
Improvements
Business Performance Management

page 6
Comprehensive Cost Management (CCM) Background:
•CCM includes the Activity-Based Costing methodology
(Capacity- Based and Allocation-Based Unit Costing), in
addition to other costing methodologies where appropriate, to
account for 100% of Non-Interest expenses.
•CCM also includes cost distribution rules and techniques, as
well as cost deployment criteria.
•CCM provides a linkage to non-financial performance metrics.
•CCM promotes the comprehensive performance aspects of
the Management Accounting processes.
•CCM provides for Integrated Profitability and Integrated
Resource Management.
Business Performance Management

page 7
Integrated
Resource
Management
Scorecard
Integrated Performance
Measurement Architecture
Strategic Management
Strategic
Analyses,
Pricing &
Forecasting
Integrated
Profitability
Measurement
Scorecard
Analyze Performance Results
Set Performance Targets
Measure Actual PerformanceResults vs. Targets
Acknowledge PerformanceImprovements
Integrated CCM
InformationDatabase
Business Performance Management
page 8
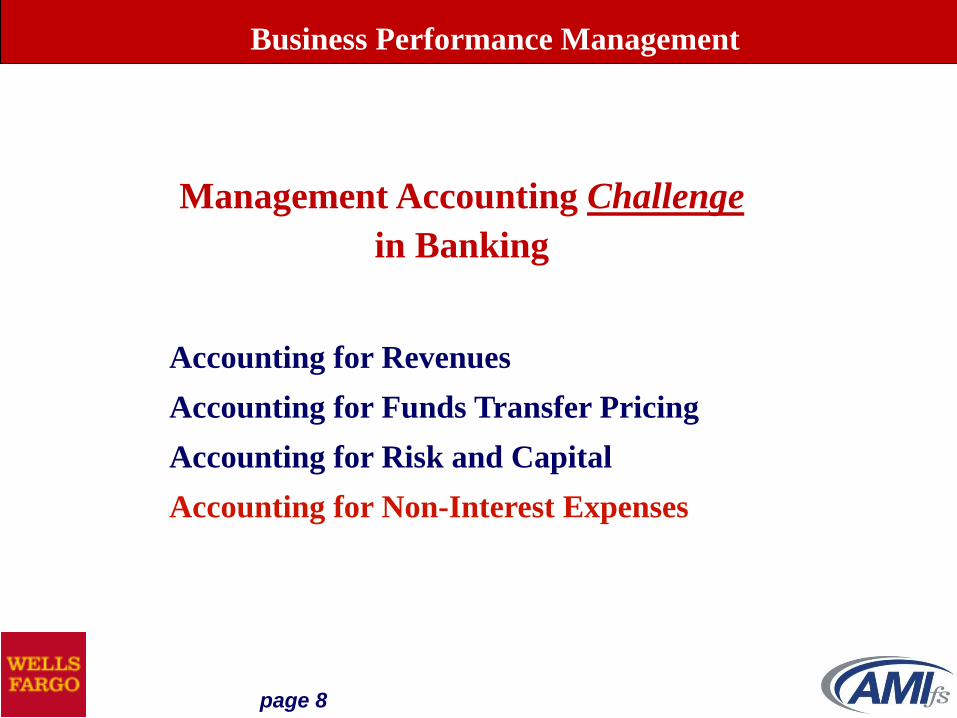
Accounting for Revenues
Accounting for Funds Transfer Pricing
Accounting for Risk and Capital
Accounting for Non-Interest Expenses
Management Accounting Challenge
in Banking
Business Performance Management

page 9
Business Performance Management
Activity Based Costing - Benchmarking Common Practices IISponsored by ALG Software, September 21, 2004 11:00 AM EST
# Questions and Answewrs # %
1 What is the current stage of ABC at your organization?
Exploratory - evaluation and review of the concept and it's potential need and impact 1 9%
Infancy - beginning cost studies to collect information and training staff 1 9%
Intermediate - continuing cost studies starting some maintenance and determining how to use 8 72%
Mature - Moved from ABC to ABM - maintaining and using data to support organizational decisions 1 9%
8 What BEST describes how your organization uses ABC?
Not currently implementing any cost allocations or other 0 0%
Using to evaluate organizational product & customer profitability 11 84%
Using it as a tool for cost control and cost management 1 7%
Using it for Budgeting and planning 0 0%
Using it for Incentive Compensation 0 0%
All of the above except for A 1 7%
8B What is your next planned use of ABC?
Not currently implementing any cost allocations or other 0 0%
Using to evaluate organizational product & customer profitability 1 9%
Using it as a tool for cost control and cost management 7 63%
Using it for Budgeting and planning 2 18%
Using it for Incentive Compensation 1 9%
All of the above except for A 0 0%

page 10
Integrated Profitability Measurement:
•Customer by Product
•Organization or LOB by Product
•Product by Organization
Integrated Resource Management:
•Delivery Channel by Resource Group
•Resource Group by Delivery Channel
•Business Process
Management Accounting Scorecards
Business Performance Management

page 11
Financial Accounting
vs.
Management Accounting
Expenses vs. Costs
Business Performance Management

page 12
Expenses (Incurred)
– to become liable for or subject to, within
an accounting period (i.e. month/quarter)
Costs (Derived)
– an outlay (i.e. $/effort) made to achieve
an object or unit of measure
Expenses vs. Costs
Business Performance Management

page 13
Product
Revenues
Expenses
Incurred
Net
Income
Top of the Institution
Financial Accounting View
Business Performance Management

page 14
Product
RevenuesProcessing
Credits
Distributed
Costs
Expenses
Incurred
Cost
Recovery
Residual
Management Accounting View
Product
Margins
Business Performance Management
(Customer, Product and LOB Profitability/Integrated Resource Management)

page 15
Product
Revenues
Cost
Recovery
Distributed
Costs
Expenses
Incurred
Product
Margins
Cost
Recovery
Residual
Recovery
Residual
Product
Revenues
DistributedCosts
Product
Margins
Net
Income
Expenses
Incurred
Management Accounting View Reconciliation
Business Performance Management

page 16
Linking
Integrated Profitability
and
Integrated Resource Management
Information
Business Performance Management

page 17
Product Cost
Drivers (PCDs)
Integrated Resource
Management
Integrated ProfitabilityMeasurement
Integrated
CCM
Information
DatabaseResource Cost
Drivers (RCDs)
Unit Costs for Integrated Profitability
and Integrated Resource Management
(e.g. Item Capture
in Check Processing)
(e.g. Deposit less Cash -
Basic Checking for
Customer X at Branch Y)
(Product, Customer,
Line of Business)
(Business Process,Delivery Channel,Resource Group)
Business Performance Management

page 18
Product
Revenues
Product
Margin
Analyses
Processing
Credits
Expenses
Incurred
CostRecoveryResidualAnalyses
Actual vs. Plan
Actual vs. Forecast
Forecast vs. Plan
Processing
Charges
Integrated
Profitability
IntegratedResource
Management
$ D
imen
sion
-Product
-Customer
-LOB/Org.
Business Performance Management
RCDs
PCDs
-Resource Group
-Delivery Channel
-Business Process

page 19
BRANCH
e.g. Customer Deposits
Costs and Usage along Processing Path – End-to-End View
COURIER
Operations
CHECK
PROC.
Automation
IT
POSTINGTOTAL
Branch Banking
ATM Banking
Internet Banking
Smart Phone Banking
XXXX
XXXX
XXXX
XXXX
XXXX
XXXX
XXXX
XXXX
XXXX
XXXX
e.g. Virtual Capture
PCDs
RCDs
XXXX
XXXXXXXX
XXXX
XXXX
Product Transaction View
Delivery Channel View, Integrated by Resource Group
Business Performance Management
page 20
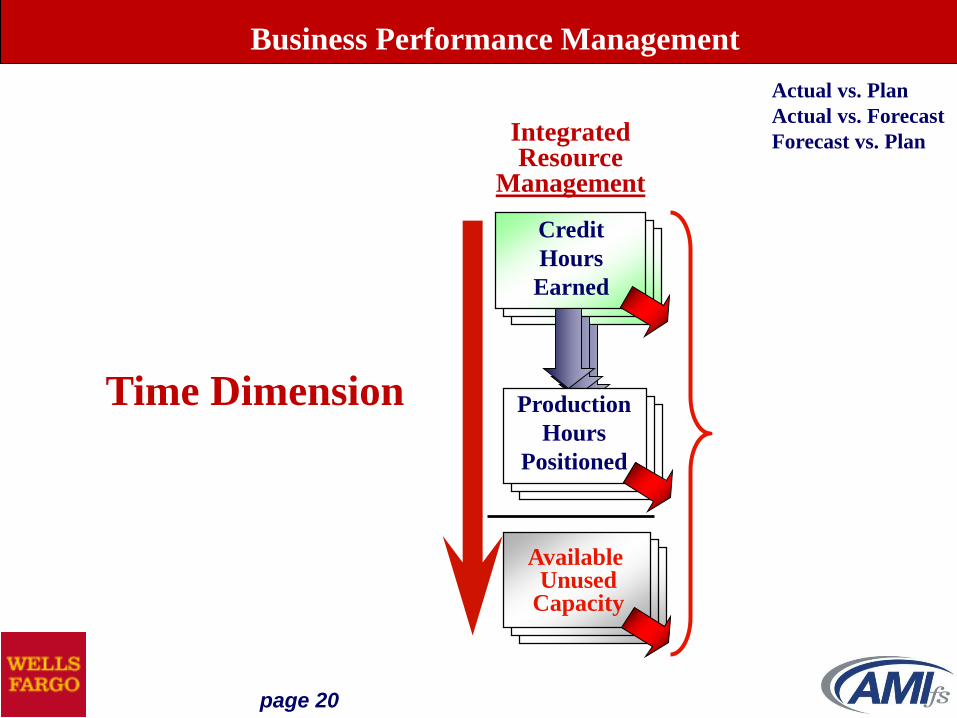
Credit
Hours
Earned
Production
Hours
Positioned
Available Unused
Capacity
IntegratedResource
Management
Time Dimension
Business Performance Management
Actual vs. Plan
Actual vs. Forecast
Forecast vs. Plan

page 21
Integrated Profitability Measurement
Integration Points
Business Performance Management

page 22
Product
Revenues
LOB
Customer
Distributed
Costs
Product
Margins
Del. Chan.
Distributed
Credits
Bus. Proc.
Proc. Group
Del. Chan.
Expenses
Incurred
Cost
Recovery
Residual
Integrated Profitability Information
Business Performance Management

page 23
• Customer/
Relationship
• Organization/
Location/LOB
• Product
Integration
Integrated Profitability Information
Business Performance Management

page 24
Delivery Channel
Decisions
Customer Access Point
Decisions
ProductOfferings
ServiceOfferings
Access Point Offerings
Access Point Locations
Access Points to Promote
Customer Behaviors
Diversion Strategies
Performance Measurement
Product Pricing
DecisionsProduct Feature
Decisions
Product Offerings
Product Features
Products to Promote
Products to Discourage
Competitive Information
Performance Measurement
Product Pricing
Relationship Pricing
Volume Discounts
Market Prices
Compensation Strategies
Performance Measurement
Delivery Channel Costs
Delivery Channel Usage
Delivery Channel Capacity
Del. Channel Capacity Utl.
Process Improvement
Performance Measurement
Strategic Management
Integrated Profitability Measurement
Analyze Performance Results
Set Performance Targets
Measure Actual Performance
Results vs. Targets
Acknowledge Performance
Improvements
Business Performance Management

page 25
Customer: R. McDonald
ABC Bank: YTD 2016Drill down into Products
Customer Profitability Integrated by Product
TOTAL
DEPOSIT
PRODUCTS
CREDIT
PRODUCTSFEE BASED
PRODUCTS
Cost of Servicing
Customers
INTEREST INCOME
CHARGE FOR FUNDS
NET INTEREST INCOME
INTEREST EXPENSE
CREDIT FOR FUNDS
NET FUNDS ADJUSTMENT
NET INTEREST MARGIN
PROVISION FOR LOSSES
GROSS FEES
WAIVED FEES
NON-INTEREST INCOME
NET REVENUES
SERVICING COSTS - BRANCH
SERVICING COSTS - ATM
SERVICING COSTS - TEL. BKG.
SERVICING COSTS - INTERNET
DIRECT PRODUCT COSTS
RELATIONSHIP MGT COSTS
SALES AND MARKETING COSTS
TOTAL COSTS
PRODUCT MARGINS
XXXX
XXXX
XXXX
XXXX
XXXX
XXXX
XXXX
XXXX
XXXX
XXXX
XXXX
XXXX
XXXX
XXXX
XXXX
XXXX
XXXX
XXXX
XXXX
XXXX
XXXX
XXXX
XXXX
XXXX
XXXX
XXXX
XXXX
XXXX
XXXX
XXXX
XXXX
XXXX
XXXX
XXXX
XXXX
XXXX
XXXX
XXXX
XXXX
XXXX
XXXX
XXXX
XXXX
XXXX
XXXX
XXXX
XXXX
XXXX
XXXX
XXXX
XXXX
XXXX
XXXX
XXXX
XXXX
XXXX
XXXX
XXXX
XXXX
XXXX
XXXX
XXXX
XXXX
Business Performance Management

page 26
Integrated Resource Management
Integration Points
Business Performance Management

page 27
Product
Revenues
Location
Customer
Distributed
Costs
Product
Margins
Del. Chan.
Distributed
Credits
Bus. Proc.
Proc. Group
Del. Chan.
Expenses
Incurred
Cost
Recovery
Residual
Integrated Resource Management
Business Performance Management

page 28
• Business Process• Delivery Channel
• Resource Group
Integration
Integrated Resource Management
Business Performance Management

page 29
FinancialManagement
Fixed, Variable, Semi-V Costs
Targeted Unit Costs
Hourly Rate Analyses
Unit Time Analyses
Throughput Analyses
Process Improvements
Performance Measurement
Fixed, Variable, Semi-V Exp.
Targeted Expenses
Targeted Recoveries
Actual Expenses
Actual Recoveries
Expense Residual Analyses
Performance Measurement
ExpenseManagement
CostManagement
ResourceManagement
Targeted Productivity
Actual Productivity
Productivity Improvements
Incentive Compensation
Integrated Productivity Mgmt.
Performance Measurement
Targeted Capacity
Targeted Capacity Utilization
Actual Capacity
Actual Capacity Utilization
Integrated Capacity Mgmt.
Performance Measurement
CapacityManagement
ProductivityManagement
Integrated Resource Management
Strategic Management
Analyze Performance Results
Set Performance Targets
Measure Actual Performance
Results vs. Targets
Acknowledge Performance
Improvements
Business Performance Management

page 30
DIRECT EXPENSES
SALARIES
BENEFITS
OCCUPANCY
EQUIPMENT
SUPPLIES
TOTAL DIRECT EXP.
INDIRECT EXPENSES
HUMAN RESOURCES
TECHNOLOGY
OTHER INDIRECT
TOTAL INDIRECT EXP.
TOTAL EXPENSES
COST RECOVERY RESIDUAL
TOTAL
PLAN
ABC Bank
YTD 2016
Site: Maitland
Center: 123
Integrated Resource Management(One Example of New Management Information Dimension)
Cost
Recovery
Residual
XXXX
XXXX
XXXX
XXXX
XXXX
XXXX
XXXX
XXXX
XXXX
XXXX
XXXX
XXXX
PROCESSING CREDITS
PROCESSING RCD #1
PROCESSING RCD #2
PROCESSING RCD #3
PROCESSING REJECT ITEMS
PROCESSING OFFLINE ITEMS
TOTAL PROCESSING CREDITS
XXXX
XXXX
XXXX
XXXX
XXXX
XXXX
Cost Recovery
Expenses
Incurred
XXXX
XXXX
XXXX
XXXX
XXXX
XXXX
XXXX
XXXX
XXXX
XXXX
XXXX
XXXX
XXXX
XXXX
XXXX
XXXX
XXXX
XXXX
XXXX
XXXX
XXXX
XXXX
XXXX
XXXX
XXXX
XXXX
XXXX
XXXX
XXXX
XXXX
XXXX
XXXX
XXXX
XXXX
XXXX
XXXX
TOTAL
ACTUAL
TOTAL
VARIANCE
Business Performance Management
Resource
Cost
Drivers

page 31
Developing and Administering a
Comprehensive Cost Management (CCM)
Information Database
Business Performance Management

page 32
Product
Revenues
Processing
Credits
Distributed
“Expenses”
Expenses
Incurred
Cost
Recovery
Residual
Expense Allocation View
of P&Ls for Lines of Business
Product
Margins
X
Little Information
Value For the
Expense Center
Managers
Business Performance Management

page 33
INTEREST INCOME
CHARGE FOR FUNDS
NET INTEREST INCOME
INTEREST EXPENSE
CREDIT FOR FUNDS
NET FUNDS ADJUSTMENT
PROVISION FOR LOSSES
GROSS FEES
WAIVED FEES
NON-INTEREST INCOME
ALLOCATED EXPENSES
NET CONTRIBUTION
INCOME TAX
NET EARNINGS
XXXX
XXXX
XXXX
XXXX
XXXX
XXXX
XXXX
XXXX
XXXX
XXXX
XXXX
XXXX
XXXX
XXXX
Customer: R. McDonald
ABC Bank: YTD 2015
TOTAL
Customer Value Estimate
This P&L is
driven by balances
and
not reflective of
customer transaction
behavior
These are usually
fixed amounts
per account and
not usage based
Could also be
Net Funds
Used/Provided
Business Performance Management

page 34
CostRecovery
Bus. Proc.
Res. Group
Cost
Recovery
Residual
Product
Revenues
LOB
Customer
Distributed
Costs
Product
Margins
Expenses
Incurred
Business Performance Management

page 35
•Create a Shared Vision for the Business Information Value of a CCM
Cost Development and Deployment initiative
•Conduct Cost Information Requirements meetings with Line of Business
Management Partners:
–Service Receivers
–Service Providers
•Establish Management Accounting Policies and Standards for NIE
in Integrated Profitability Measurement and Integrated Resource
Management
•Develop Maintenance and Administration processes for the CCM
Information database
Developing and Administering a CCM Information Database
Business Performance Management

page 36
Expense Classifications &
Cost Distribution Techniques
for
Integrated Profitability Measurement
Business Performance Management

page 37
Responsibility Center Classifications:
•Centralized Expense Centers
•Service Centers
•Local Overhead Centers
•Processing Centers
•Profit CentersProduct Management
Sales & Marketing
Relationship Management
•Corporate Overhead Centers
Business Performance Management

page 38
•Unit Cost Rate “X” Volume
•Fixed Percentage
•Dynamic Percentage
•Fixed Dollar Amount
•Expense to Expense Ratio
•Expense to FTE Ratio
•Expense to Revenue Ratio
•Expense to Equity Ratio
•Rate “X” Customer Classification
CCM Cost Distribution Techniques for Integrated Profitability Measurement
Cost Distribution
Rates & Rules
Business Performance Management

page 39
•Centralized Expense Centers•Service Centers•Local Overhead Centers
•Processing Centers
•Profit Centers
Product Management
Sales & Marketing
Relationship Management
•Corporate Overhead Centers
Product
Revenues
LOB
Customer
Non-Interest Expenses
Distributed
Costs
Product
Margins
Business Performance Management

page 40
•Centralized Expense Centers•Service Centers•Local Overhead Centers
•Processing Centers
•Profit Centers
Product Management
Sales & Marketing
Relationship Management
•Corporate Overhead Centers
Product
Revenues
LOB
Customer
Non-Interest Expenses
Distributed
Costs
CCM Cost Development
& Distribution Rules
for Indirect ExpensesCenter
to Center
Distributions
Business Performance Management
Product
Margins

page 41
Center Classification:
Certain types of institution operating expenses are often managed centrally to obtain
purchasing efficiencies or improved controls (for example: occupancy, utilities, bulk
office supplies, etc.). Typically these expenses are accounted for in separate
responsibility centers to facilitate ease of analysis and reporting from the general
ledger. If these expenses are centrally recorded, material and not distributed in the
GL, consideration should be given to distributing these expenses to the specific centers
that consume the resources.
•Service CentersService Center expenses are for resources positioned to provide internal support
services to other organizational units throughout the institution. Examples include
Human Resources, Procurement Services, certain IT services such as Network and PC
support, etc. Service Centers do not process for bank Customers or bank Products
directly.
•Local Overhead CentersLocal overhead centers are those centers that are responsible for the administration of
a specific group of centers. Examples of local overhead centers include Branch
Administration and Operations Administration.
•Centralized Expense Centers
Business Performance Management

page 42
The Funds Transfer Pricing rate applied to non-earning Fixed Assets
(e.g. Facilities, Leasehold Improvements, Equipment, etc.) is often
called the Cost to Carry that asset. The calculation results are
reported as an Income Statement line item and classified as part of
Indirect Expenses for the period.
Expense Classification:
•Cost to Carry Fixed Assets
Business Performance Management

page 43
HRService Center
ITService Center
UnderwritingProcessing Center
Lending UnitProfit Center
Centerto
Center
Distributions
Distribution Sequencing and Cascading
Business Performance Management

page 44
Direct Expenses
Compensation
Occupancy
Equipment
Supplies
Other
Indirect Expenses
IT Distribution
HR DistributionLOH DistributionCost to Carry FAOther Indirect
Product
Revenues
LOB
Customer
Indirect ExpensesDistributed
Costs
•Processing Centers
•Profit Centers
•Corporate Overhead Centers
for
Non-Interest Expenses
•Centralized Expense Centers
•Service Centers
•Local Overhead Centers
•Cost of Carry Fixed Assets
Business Performance Management
Product
Margins
page 45
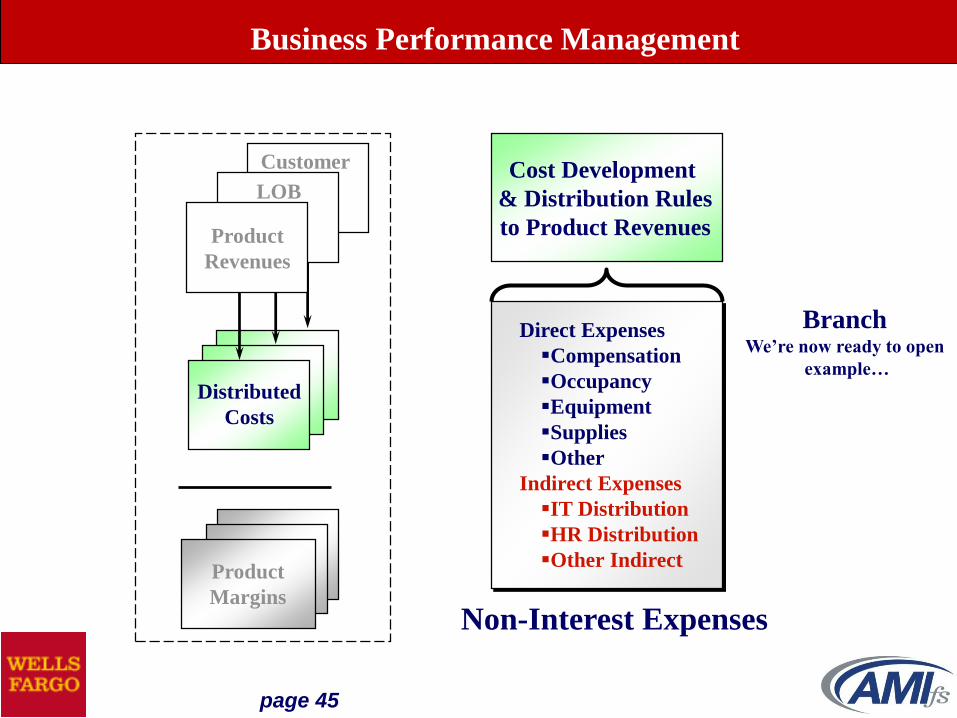
Direct Expenses
Compensation
Occupancy
Equipment
Supplies
Other
Indirect Expenses
IT Distribution
HR Distribution
Other Indirect
Product
Revenues
LOB
Customer
Non-Interest Expenses
Cost Development
& Distribution Rules
to Product Revenues
Distributed
Costs
BranchWe’re now ready to open
example…
Business Performance Management
Product
Margins

page 46
•Centralized Expense Centers•Service Centers•Local Overhead Centers
•Processing Centers
•Profit Centers
Product Management
Sales & Marketing
Relationship Management
•Corporate Overhead Centers
Product
Revenues
LOB
Customer
Non-Interest Expenses
Distributed
Costs
Cost Development
& Distribution Rules
to Product Revenues
Business Performance Management
Product
Margins

page 47
Center Classification:
•Processing Centers
Processing Center Expenses are resources positioned to process
activities for bank Customers and the Products that they purchase.
Examples include Branch Tellers, Bank Operations and certain IT
related functions.
The distribution of Processing Center expenses is typically usage-
driven (rate X volume) and classified as Processing Costs or
Servicing Costs on the P&Ls for Integrated Profitability
measurement.
Business Performance Management

page 48
•Typically Unit Cost Rate “X” Volume
–Capacity-Based Unit Costing
–Allocation-Based Unit Costing
Cost Distribution Techniques:
•Processing Centers
Distribution
Rates & Rules:
Unit Cost Development Techniques
Business Performance Management
page 49
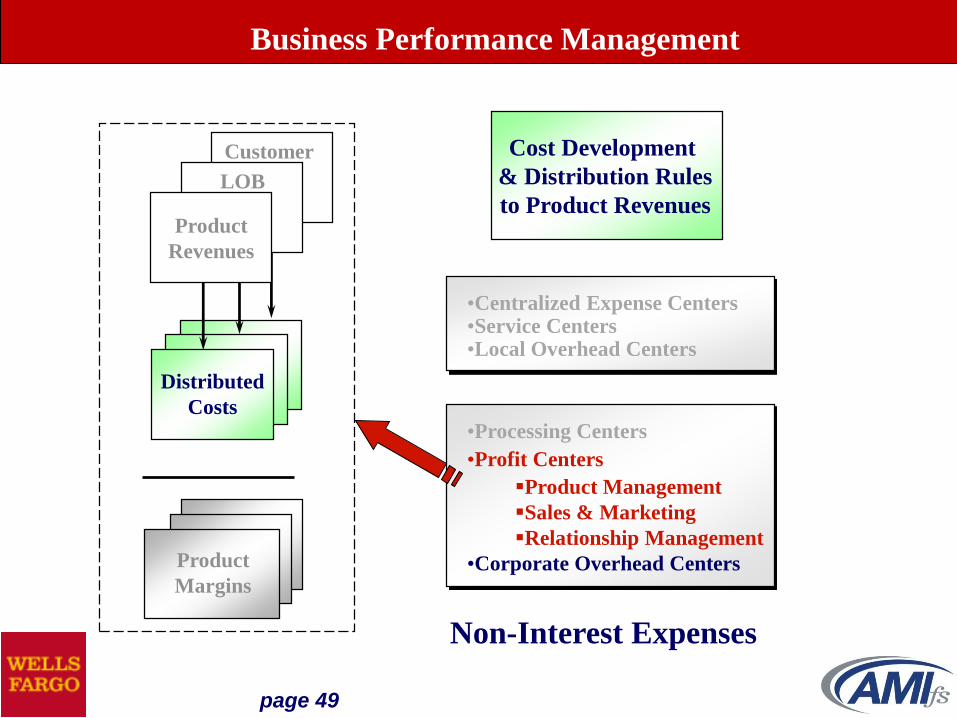
•Centralized Expense Centers•Service Centers•Local Overhead Centers
•Processing Centers
•Profit Centers
Product Management
Sales & Marketing
Relationship Management
•Corporate Overhead Centers
Product
Revenues
LOB
Customer
Non-Interest Expenses
Distributed
Costs
Cost Development
& Distribution Rules
to Product Revenues
Business Performance Management
Product
Margins

page 50
Center Classification:
•Profit CentersProduct Management
Sales & Marketing
Relationship Management
Profit Centers are Responsibility Centers that have a GL booking of
Product Revenues and Product Balances, in addition to their own
Non-Interest Expenses and positioning of resources to perform
activities.
The distribution of Profit Center expenses is typically a re-
classification to the P&L view as Direct Product Costs, Sales &
Marketing Costs and Relationship Management Costs – how much
and why the expenses are incurred.
Business Performance Management

page 51
Product
RevenuesProcessing
Credits
Distributed
Costs
Expenses
Incurred
Cost
Recovery
Residual
Management Accounting View
Product
Margins
Reclassification
of
Expenses Incurred
to
Costs and Purpose ID
Business Performance Management
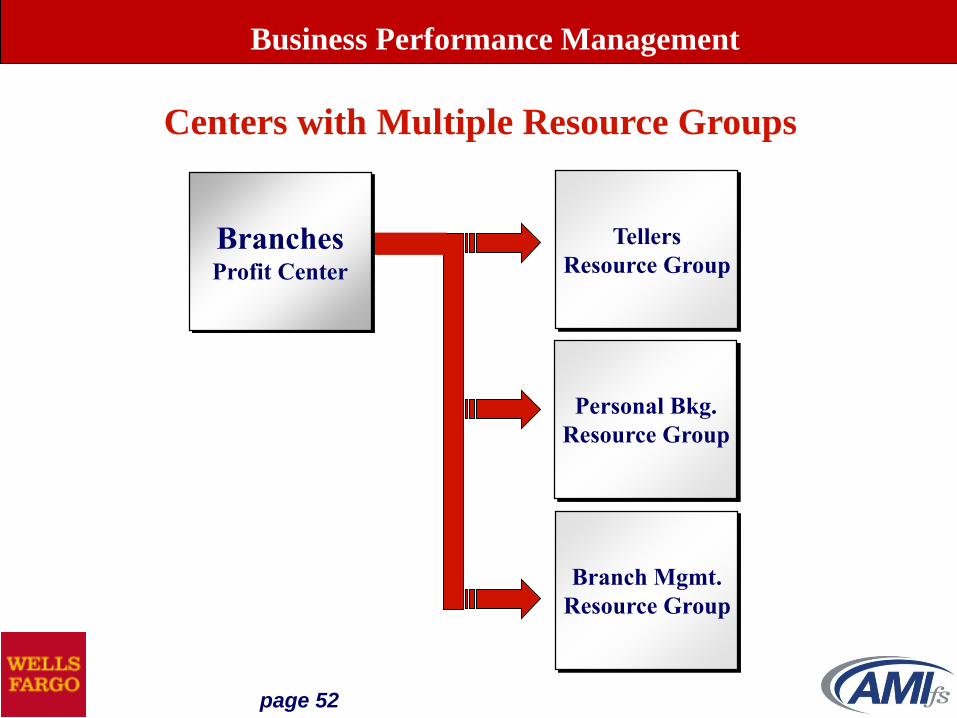
page 52
BranchesProfit Center
Tellers
Resource Group
Personal Bkg.
Resource Group
Branch Mgmt.
Resource Group
Centers with Multiple Resource Groups
Business Performance Management

page 53
•Centralized Expense Centers•Service Centers•Local Overhead Centers
•Processing Centers
•Profit Centers
Product Management
Sales & Marketing
Relationship Management
•Corporate Overhead Centers
Product
Revenues
LOB
Customer
Non-Interest Expenses
Distributed
Costs
Cost Development
& Distribution Rules
to Product Revenues
Business Performance Management
Product
Margins

page 54
Center Classification:
•Corporate Overhead Centers
Corporate Overhead Center expenses are those expenses that cannot be
directly aligned to a specific Product or group of Products, Customer
Segments, or Organizational Units. Therefore, they are aligned to all
Products, Customer Segments and Organizational Units. Examples
include office of the CEO, enterprise level advertising, directors fees,
external reporting, etc.
The distribution technique is typically an expense to expense ratio, but
could also be expense to revenues or equity or some combination
Business Performance Management

page 55
•Centralized Expense Centers•Service Centers•Local Overhead Centers
•Processing Centers
•Profit Centers
Product Management
Sales & Marketing
Relationship Management
•Corporate Overhead Centers
•Cost Recovery Residual
Product
Revenues
LOB
Customer
Non-Interest Expenses
Distributed
Costs
Cost Development
& Distribution Rules
to Product Revenues
Business Performance Management
Product
Margins

page 56
The Cost Recovery Residual is the difference between processing credits
and expenses incurred for the period. This could be the result of a rate/
utilization variance for Capacity-Based cost studies or a volume/spending
variance for Allocation-Based-based studies. The Management
Accounting Policies & Standards will define the management accounting
treatment. One option is to leave the residual with the processing centers.
Another option is to distribute the residual based on the processing charge
distributions. However, this should be to a dedicated line item on the
P&L, along with Corporate Overhead, in order to maintain the
management information value of the contribution margin on the P&L.
Distributions Techniques:
•Cost Recovery Residual– Markup on Processing Charges
Business Performance Management

page 57
Product
Revenues
Cost
Recovery
Distributed
Costs
Expenses
Incurred
Product
Margins
Cost
Recovery
Residual
RecoveryResidual/
COH
Product
Revenues
DistributedCosts
Product
Margins
Net
Income
Expenses
Incurred
Accounting for the Cost Recovery Residual
Business Performance Management

page 58
•Centralized Expense Centers
•Service Centers
•Local Overhead Centers
•Cost to Carry Fixed Assets
•Processing Centers
•Profit Centers
Product Management
Sales & Marketing
Relationship Management
•Corporate Overhead Centers
•Cost Recovery Residual
•Fixed Dollar, Fixed %, Dynamic %
•All
•Expense to Expense or to FTE Ratio
•FTP Rate
•All
•Fixed Dollar, Fixed %, Dynamic %
•Fixed Dollar, Fixed %, Dynamic %
•Rate “X” Customer Classification
•Expense to Expense or to Other Ratio
•Markup on Processing Cost Distributions
Center Classification Distribution Technique Guidelines
Recap
Business Performance Management

page 59
•Centralized Expense Centers•Service Centers
•Local Overhead Centers•Processing Centers
•Profit Centers
Product Management
Sales & Marketing
Relationship Management
•Corporate Overhead Centers
•Cost Recovery Residual
Product
Revenues
LOB
Customer
Non-Interest Expenses
Distributed
Costs
100% of NIE
Business Performance Management
Product
Margins

page 60
Large Corporate LOB
ABC Bank: YTD 2016Drill down into Products
Integrated Profitability Measurement
TOTAL
DEPOSIT
PRODUCTS
CREDIT
PRODUCTSFEE BASED
PRODUCTS
INTEREST INCOME
CHARGE FOR FUNDS
NET INTEREST INCOME
INTEREST EXPENSE
CREDIT FOR FUNDS
NET FUNDS ADJUSTMENT
NET INTEREST MARGIN
PROVISION FOR LOSSES
GROSS FEES
WAIVED FEES
NON-INTEREST INCOME
NET REVENUES
SERVICING COSTS - BRANCH
SERVICING COSTS - ATM
SERVICING COSTS - TEL. BKG.
SERVICING COSTS - INTERNET
DIRECT PRODUCT COSTS
RELATIONSHIP MGT COSTS
SALES AND MARKETING COSTS
TOTAL COSTS
CONTRIBUTION
COST RECOVERY RESIDUAL
CORPORATE OVERHEAD
NET INCOME
XXXX
XXXX
XXXX
XXXX
XXXX
XXXX
XXXX
XXXX
XXXX
XXXX
XXXX
XXXX
XXXX
XXXX
XXXX
XXXX
XXXX
XXXX
XXXX
XXXX
XXXX
XXXX
XXXX
XXXX
_____
XXXX
XXXX
XXXX
XXXX
XXXX
XXXX
XXXX
XXXX
XXXX
XXXX
XXXX
XXXX
XXXX
XXXX
_____
XXXX
XXXX
XXXX
XXXX
XXXX
XXXX
_____
_____
XXXX
XXXX
XXXX
XXXX
XXXX
XXXX
XXXX
XXXX
XXXX
XXXX
XXXX
_____
XXXX
XXXX
XXXX
_____
_____
_____
XXXX
XXXX
XXXX
XXXX
XXXX
XXXX
XXXX
XXXX
XXXX
XXXX
XXXX
XXXX
XXXX
_____
_____
_____
XXXX
_____
XXXX
XXXX
XXXX
XXXX
XXXX
XXXX
XXXX
XXXX
NON-
PRODUCT
100% Association
of Expenses
to Revenues
in the form of
Various Cost
Distribution
Techniques

page 61
Unit Cost Development Techniques
Capacity-Based Unit Costing
Allocation-Based Unit Costing
Business Performance Management

page 62
A very interesting question asked was about the most important determinant in choosing a
cost distribution methodology. The participants were asked to rank from the following list
in order from 1 to 5 with 1 being the most important:
•Fairness
•User Comprehension
•Cost Effectiveness
•Consistency
•Information Integrity
For the tier 1 and tier 3 institutions, information integrity was the most important. For the
tier 2 institutions, it was fairness [Graph 9]. User comprehension was last across the
board.
Graph 9
50%
42%
45%
36%
38%
40%
42%
44%
46%
48%
50%
Tier 1 - Info Integrity Tier 2 - Fairness Tier 3 - Info Integrity
Most Important Derterminant for Cost Distribution Methodology
Best Practice Costing – Treasury Management

page 63
Loan Products Deposit Products
Product Cost Drivers# of Active Accounts by Loan
Account Type (e.g. Home Equity
Loans, Commercial Loans)
# of Transactions (e.g. Installment
Loan Payments, Line of Credit
Draws)
Product Cost Drivers# of Active Accounts by Deposit
Account Type (e.g. Student
Checking, Commercial DDA)
# of Transactions (e.g. ATM
Withdrawals, Branch Deposits)
Business Performance Management

page 64
Capacity-Based and Allocation-Based Costing:
Unit Cost Development Techniques
•Provide stable and consistent Product and Resource
Cost Driver rates from period to period
•Provide for an end-to-end view of unit costs with
Study Group contributions along a Processing Path
•Provide for Integrated views of the Cost Information:
–by Product
–by Customer
–by Location
•Provide for Integrated views of the Cost Information:
–by Resource Group
–by Delivery Channel
–by Business Process
Business Performance Management

page 65
Support Costing Information Analyses, such as:
•Pricing Analyses
•Productivity Analyses
•Capacity Analyses
•Fixed vs. Variable and Semi-Variable Analyses
•Breakeven Analyses
•Location Analyses
•Delivery Channel Alternatives
•Marketing Strategies
The management information value of both the Capacity-Based
and Allocation-Based cost development approaches:
Business Performance Management

page 66
Capacity-Based Approach:
Build unit rates with a unit time and an hourly rate calculation
Allocation-Based Approach:
Full absorption expense pools divided by relevant volumes
- unit rate calculation
GL line items distributions to expense pools:
Management Estimate/Survey – Fixed %/Fixed $
Volume Based – Dynamic %
Relative Value Technique – Dynamic %
Two Unit Cost Development Techniques
Business Performance Management

page 67
Financial Data
Resource Production HoursVolume Statistical Data
Business
Performance
Management
Capacity-Based Approach
Business Performance Management

page 68
Pooling:
Expenses Statistical Volumes = Pooled Expense per Item
Time Statistical Volumes = Throughput Rate per Unit
Expenses Available Production Hours =
Resource Group Hourly Rate
Measure: Activity or Transaction “Unit Times”
Build: Measured “Unit Time” X Resource Group
“Hourly Rate” = Capacity-Based Unit Cost
Capacity-Based Costing
Business Performance Management

page 69
Capacity-Based Costing
Example:
Total Expenses = $500,000
Total FTE = 7
Total Production Hours = 12,768 (7 * 152 * 12)
Hourly Rate = $39.16 ($500,000/12,768)
RCD #1 takes 1 minute to process
RCD #2 takes 3 minutes to process
Unit Cost for RCD #1 = 1/60 * 39.16 = $0.6527
Unit Cost for RCD #2 = 3/60 * 39.16 = $1.9580
Business Performance Management

page 70
Capacity-Based Cost Study Execution
June 2016
Credit
Hours
Monthly
Volumes
Decimal
Hours
Calculation Fixed
Semi-
Variable Variable
Total Unit
Costs
Cost Recovery
Calculation
RCD 1 101.93 30,010 0.003397 0.0738$ 0.0777$ 0.0467$ 0.1982$ 5,947.52$
RCD 2 387.37 33,442 0.011583 0.2518$ 0.2649$ 0.1592$ 0.6759$ 22,602.33$
RCD 3 7.38 510 0.014472 0.3146$ 0.3309$ 0.1989$ 0.8444$ 430.64$
RCD 4 49.69 13,879 0.003580 0.0778$ 0.0819$ 0.0492$ 0.2089$ 2,899.41$
RCD 5 609.41 3,697,281 0.000165 0.0036$ 0.0038$ 0.0023$ 0.0096$ 35,557.50$
RCD 6 33.89 410,809 0.000083 0.0018$ 0.0019$ 0.0011$ 0.0048$ 1,977.54$
RCD 8 292.73 79,117 0.003700 0.0804$ 0.0846$ 0.0509$ 0.2159$ 17,080.27$
RCD 9 13.53 2,697 0.005017 0.1090$ 0.1147$ 0.0690$ 0.2927$ 789.42$
RCD 10 34.75 1,298 0.026774 0.5820$ 0.6122$ 0.3680$ 1.5622$ 2,027.71$
RCD 11 74.77 672,906 0.000111 0.0024$ 0.0025$ 0.0015$ 0.0065$ 4,362.49$
RCD 13 5.24 191 0.027450 0.5967$ 0.6277$ 0.3773$ 1.6016$ 305.91$
RCD 14 1.00 NA NA 21.74$ 22.87$ 13.75$ 58.35$ 58.35$
RCD 15 264.00 4,319 0.061125 1.3286$ 1.3976$ 0.8402$ 3.5665$ 15,403.61$
1,875.70 Total Cost Recovery 109,442.71$
Total Hours 2,061.56 Hourly Rate 58.35$ Total Expenses 120,286.99$
90.98% 90.98%
Capacity Utilization % = Total Cost Recovery Ratio
Capcity-Based Unit Costs
Business Performance Management

page 71
RCD/PCDAccount Classifications Total 1 2 3 4
Direct ExpensesSalaries & BenefitsOccupancyEquipmentSuppliesOther
Indirect ExpensesIT DistributionHR DistributionOther Indirect
X
X
X
X
X
X
X
X
X
X
X
X
X
X
X
X
X
X
X
X
X
X
X
X
X
X
X
X
X
X
X
X
X
X
X
X
X
X
X
X
X
X
X
X
X
Allocation-Based Approach
Expense Pooling: Fixed %, Dynamic %
Business Performance Management
page 72
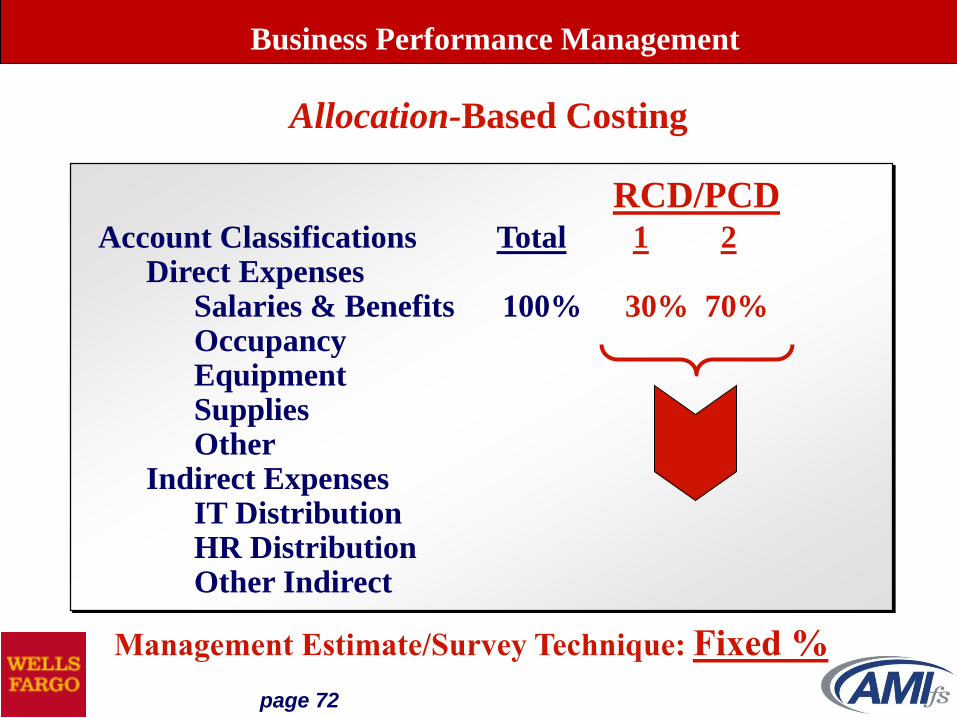
RCD/PCDAccount Classifications Total 1 2
Direct ExpensesSalaries & Benefits 100% 30% 70% OccupancyEquipmentSuppliesOther
Indirect ExpensesIT DistributionHR DistributionOther Indirect
Management Estimate/Survey Technique: Fixed %
Allocation-Based Costing
Business Performance Management

page 73
Example:
Total Expenses = $500,000
RCD #1 Volume = 100,000
RCD #2 Volume = 300,000
Total Volume = 400,000
Distribution % for RCD #1 = 25% (100,000/400,000)
Distribution % for RCD #2 = 75% (300,000/400,000)
Unit Cost for RCD #1 = 500,000*25%/100,000 = $1.25
Unit Cost for RCD #2 = 500,000*75%/300,000 = $1.25
Allocation-Based Costing
Volume Based Distribution Technique: Dynamic%
Business Performance Management
page 74
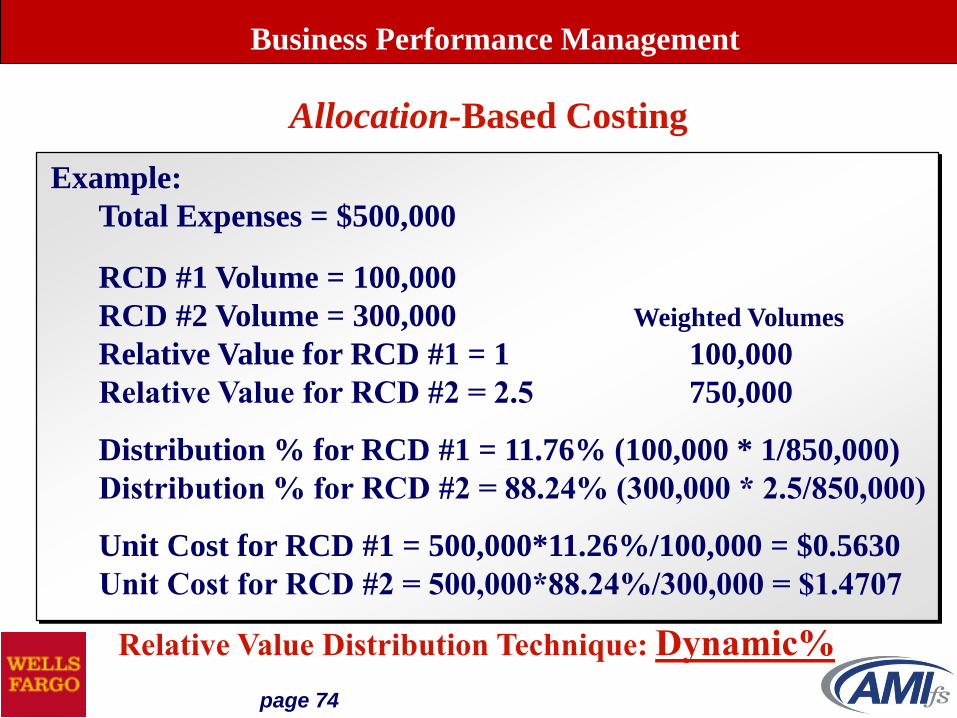
Example:
Total Expenses = $500,000
RCD #1 Volume = 100,000
RCD #2 Volume = 300,000 Weighted Volumes
Relative Value for RCD #1 = 1 100,000
Relative Value for RCD #2 = 2.5 750,000
Distribution % for RCD #1 = 11.76% (100,000 * 1/850,000)
Distribution % for RCD #2 = 88.24% (300,000 * 2.5/850,000)
Unit Cost for RCD #1 = 500,000*11.26%/100,000 = $0.5630
Unit Cost for RCD #2 = 500,000*88.24%/300,000 = $1.4707
Allocation-Based Costing
Relative Value Distribution Technique: Dynamic%
Business Performance Management

page 75
Allocation-Based Cost Study Execution2016 Forecast
Total RCD 1 RCD 2 TOTAL
Total Personnel 866,992 Survey 216,748 650,244 866,992$
Total Equipment 1,376,579 Direct Association 166,667$ 166,667$
- Weighting Factor 126,433$ 1,083,480$ 1,209,912$
Total Occupancy 170,892 Volume 14,591$ 156,301$ 170,892$ -
IT SUPPORT EXPENSE 2,630,302 Volume 224,582$ 2,405,720$ 2,630,302$
PRINTING & OFFICE EXPENSE 97,843 Volume 8,354$ 89,489$ 97,843$
TRAVEL & ENTERTAINMENT 40,404 Weighting Factor 4,222$ 36,182$ 40,404$
MISC PROFESSIONAL FEES 850,000 Volume 72,575$ 777,425$ 850,000$
HIRING EXPENSE 800 Weighting Factor 84$ 716$ 800$
FREIGHT & EXPRESS EXPENSE 6,600 Volume 564 6,036 6,600$
OPERATING LOSSES/RECOV 400,000 Volume 34,153$ 365,847$ 400,000$
TOTAL IT INTERNAL 1,105,201 Volume 94,365$ 1,010,837$ 1,105,201$
Total Other Operating 5,131,150 438,898 4,692,252 5,131,150
Total Direct Expenses 7,545,613 963,336 6,582,277 7,545,613
Total Indirect Expenses 622,783 Direct Controllable 79,510 543,273 622,783
Total Expenses 8,168,396 1,042,846 7,125,550 8,168,396
Total Unit Costs 0.0272$ 0.0174$
RCD 1 @ 1.25 RCD 2 @ 1 Total
Weighting Factor Distribution 47,903,170 410,511,402 458,414,572.2
10.45% 89.55% 100.00%
RCD 1 RCD 2 Total
Volume Base Distribution 38,322,536 410,511,402 448,833,938.2
8.54% 91.46% 100.00%
Business Performance Management
page 76
Fixed, Semi-Variable
and
Variable Classifications
Business Performance Management

page 77
A calculated contribution margin is the difference between price and the variable cost. It
represents how much is left to contribute to fixed costs and profits after covering variable
costs only. The number of institutions reporting contribution margins was 59% for the tier
1 institutions, 27% for tier 2 and 25% for tier 3 [Graph 15]. Less than 1/3 of the
respondents also have a semi-variable component, which is designed to account for
personnel related expenses. Of those respondents, 1/3 took associated semi-variable with
the variable classification for the contribution margin calculation and 2/3 split it into both
variable and fixed [Graph 16].
Semi-Variable Cost Treatment
SV to V
9%
SV to F
0%
SV to V and F
18%
No SV
73%
Graph 15 Graph 16
59%
27%25%
0%
10%
20%
30%
40%
50%
60%
Tier 1 Tier 2 Tier 3
% of Respondents who Report Contribution Margin
Best Practice Costing – Treasury Management

page 78
Fixed/Variable/Semi-Variable Analysis
Volumes
Expenses
Run
Rise
The classification of expenses as fixed, variable and semi-variable defines
how expenses will behave over a relevant range of volume during a pre-
defined time period (typically defined as at least one year). The
incorporation of volume ranges and time requires a “run/rise” analysis
when defining whether an expense is fixed, variable or semi-variable.
This type of analysis defines the “run” as the relevant range of volume
over which the associated expense will be remaining stable. The “rise” is
the magnitude of the increase (or decrease) the expenses will experience
once the relevant range of volume is surpassed. The following diagram
illustrates “run” and “rise”:
Business Performance Management

page 79
Fixed/Variable/Semi-Variable Analysis
Volumes
Expenses
Yr 2Yr 1
Volumes
Expenses
Yr 2Yr 1
Volumes
Expenses
Yr 2Yr 1
Fixed Variable
Semi-Variable
Business Performance Management

page 80
Account Classifications: Fixed Variable Semi-VDirect Expenses
PersonnelOccupancyEquipmentSuppliesPostageOther
Indirect ExpensesIT DistributionHR DistributionCost to Carry FAOther Indirect
X
XX
X
X
X
X
X
X
Fixed/Variable/Semi-Variable Analysis
X
Business Performance Management

page 81
•Centralized Expense and Service Center Distributions;
•Local Overhead Distributions;
•Cost to Carry Fixed Assets;
•Fixed/Variable/Semi-Variable Components;
-Applied to Hourly Rates for the Capacity-Based
unit cost development approach.
-Applied directly to Expense Pools for Allocation-Based
unit cost development approach.
Unit Cost Development Techniques
Business Performance Management

page 82
Treasury Management Cost Structure at Wells Fargo
Business Performance Management
TM Variable costs are charged to the LOBs using a consumption based
rate X volume methodology at the Account Analysis billing element
level.
TM Direct Fixed costs are associated to TM Products and are charged
to the LOBs using a fixed $ methodology (plan/12) for services at a TM
Product level such as Cash Vault Occupancy to the Cash Services
Product.
TM Indirect Fixed expenses are incurred on behalf of all TM (not
associated to TM Products) and are charged to the LOBs using a fixed
$ methodology (plan/12) for services such as TM Marketing and TM
Risk Management.
TM Sales costs are charged to LOBs based geographic assignments or
industry specific support using a fixed $ methodology (plan/12).

page 83
CCM unit cost development is a structured project approach
designed to streamline the costing effort, while maximizing the
information value
StudyPreparation
StudyExecution
StudyApproval
Study Information
Rollout
CCM Unit Cost Development Techniques
Business Performance Management

page 84
StudyPreparation
•Leverage and optimize the skill sets of the cost analyst team
•Analyze and classify processing centers
•Establish study group IDs
•Determine study period
•Communicate expectations with study group management
•Look for quick management information wins
Cost Study Process
CCM Unit Cost Development Techniques
Business Performance Management

page 85
StudyExecution
Activity
Definition
Activity Time
Development
Expense
Analysis
Calculate
Component
Rates
Define
Activities
Develop
Activity
Unit
Times
Develop
Resource
Hourly
Rate(s)
Calculate
Capacity-
Based
Costs
Statistical
Volume
Analysis
RCD &
PCD
Unit Rates
Capacity-Based Cost
Study Execution
Processes
CCM Unit Cost Development Techniques
Business Performance Management

page 86
StudyExecution
Activity
Definition
Distribution
Techniques
To Cost Pools
Expense &
RCD Analysis
Calculate
Unit
Rates
Define
Activities
Determine
GL Line
ItemDistribution
Bases
ExecuteDistributions
to
Expense
Pools
Calculate
Fully
Absorbed
Costs
Statistical
Volume
Analysis
RCD &
PCD
Unit Rates
CCM Unit Cost Development Techniques
Allocation-Based Cost
Study Execution
Processes
Business Performance Management

page 87
StudyApproval
•Communicate study period results with Study Group management
•Obtain approval (sign-off) for results
•Reinforce the role of the rates representing the Study Group and
Study Period in Integrated Profitability
• Reinforce the role of the Study Period results as a new balance type
for Integrated Resource Management reporting
Cost Study Process
CCM Unit Cost Development Techniques
Business Performance Management

page 88
Study Information
Rollout
•Use the cost information database to support ongoing business
ad hoc analyses, such as pricing, capacity, fixed vs. variable, etc.
•Deploy the Product Cost Driver (PCD) rates and business logic in
Integrated Profitability measurement.
•Deploy the Resource Cost Driver (RCD) rates and business logic in
Integrated Resource Management.
Cost Study Process
CCM Unit Cost Development Techniques
Business Performance Management

page 89
Comprehensive Cost Management
Case Study
Development - Capacity-Based Methodology
Vs.
Allocation-Based
If you can do cost accounting for financial institutions,
you can do it for ANY industry…
Business Performance Management

page 90
Study Period Data Assumptions
Personnel Expense $250,000
Equip. Depreciation Expense $ 35,000
Occupancy Expense $ 65,000
Raw Materials Expense $ 30,000
Total Expenses $380,000
Calculate the following:
Capacity Utilization %
Hourly Rates (Fixed, Semi-Variable, Variable)
Capacity-Based unit cost
Allocation-Based Fully Absorbed unit cost
Capacity-Based Cost Recovery %
Productivity
Hours worked 10,000
Bottles processed 1,000,000
Unit time per Bottle 30 seconds
Comprehensive Cost Management Case Study
Business Performance Management
page 91
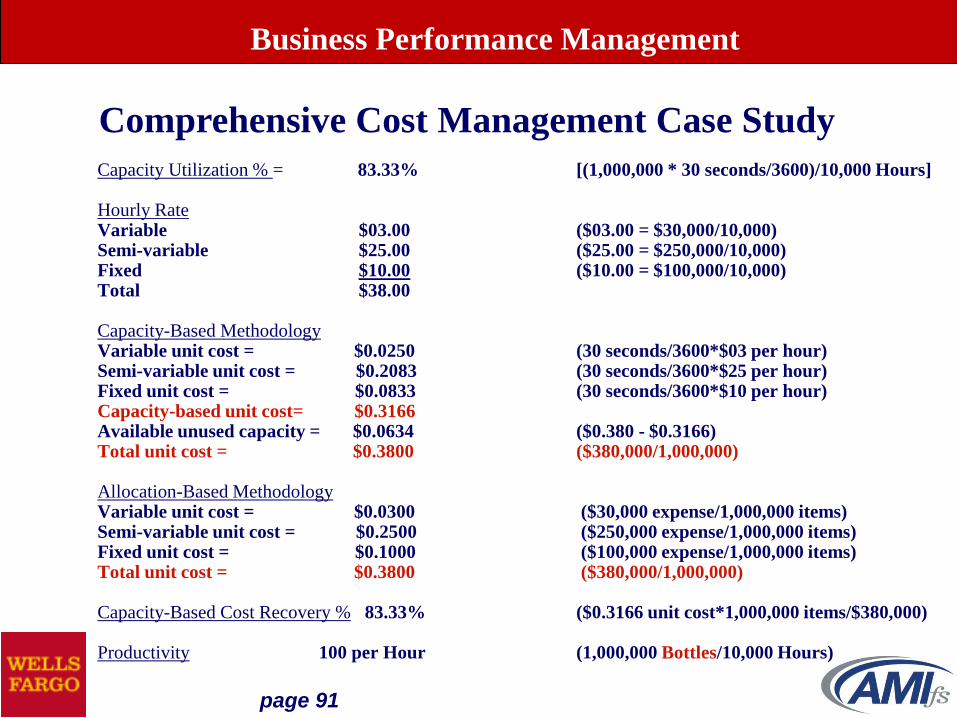
Capacity Utilization % = 83.33% [(1,000,000 * 30 seconds/3600)/10,000 Hours]
Hourly RateVariable $03.00 ($03.00 = $30,000/10,000)Semi-variable $25.00 ($25.00 = $250,000/10,000)Fixed $10.00 ($10.00 = $100,000/10,000)Total $38.00
Capacity-Based MethodologyVariable unit cost = $0.0250 (30 seconds/3600*$03 per hour)Semi-variable unit cost = $0.2083 (30 seconds/3600*$25 per hour)Fixed unit cost = $0.0833 (30 seconds/3600*$10 per hour)Capacity-based unit cost= $0.3166Available unused capacity = $0.0634 ($0.380 - $0.3166)Total unit cost = $0.3800 ($380,000/1,000,000)
Allocation-Based Methodology Variable unit cost = $0.0300 ($30,000 expense/1,000,000 items)Semi-variable unit cost = $0.2500 ($250,000 expense/1,000,000 items)Fixed unit cost = $0.1000 ($100,000 expense/1,000,000 items)Total unit cost = $0.3800 ($380,000/1,000,000)
Capacity-Based Cost Recovery % 83.33% ($0.3166 unit cost*1,000,000 items/$380,000)
Productivity 100 per Hour (1,000,000 Bottles/10,000 Hours)
Comprehensive Cost Management Case Study
Business Performance Management

page 92
Cost Deployment
for
Integrated Resource Management
Business Performance Management

page 93
Product
Revenues
LOB
Customer
Distributed
Costs
Del. Chan.
Distributed
Credits
Bus. Proc.
Proc. Group
Del. Chan.
Expenses
Incurred
Cost
Recovery
Residual
CCM Deployment for Integrated Resource Management
Business Performance Management
Product
Margins

page 94
•NIE Financial Data
•Statistical Volume Data
•FTE (Production Hours) Data
Linking involves the Integration of:
Business Performance Management
page 95
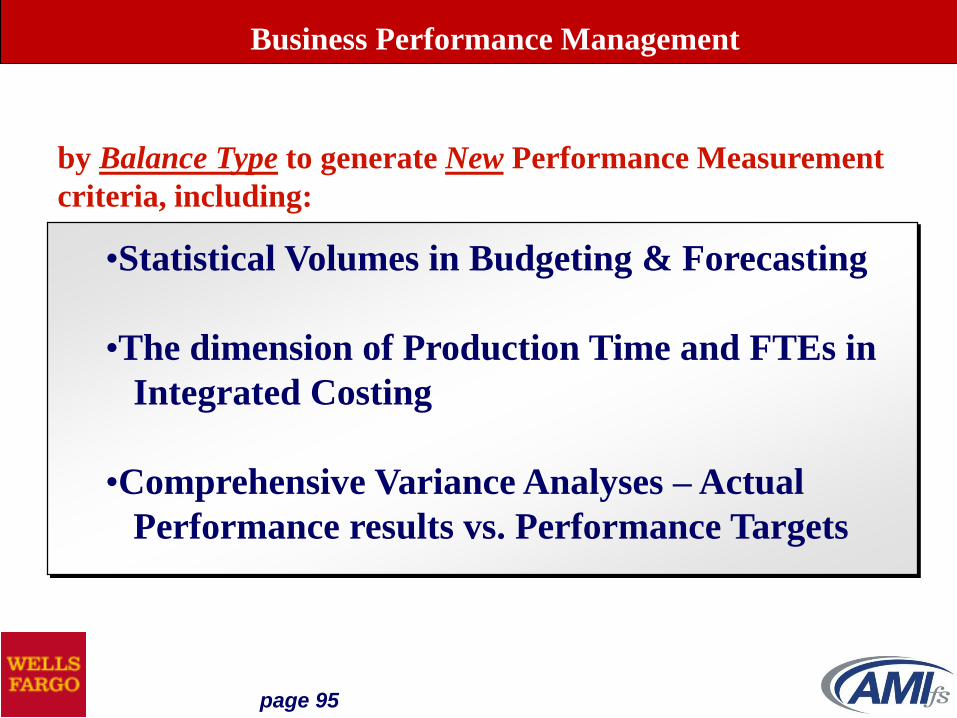
by Balance Type to generate New Performance Measurement
criteria, including:
•Statistical Volumes in Budgeting & Forecasting
•The dimension of Production Time and FTEs in
Integrated Costing
•Comprehensive Variance Analyses – Actual
Performance results vs. Performance Targets
Business Performance Management

page 96
•Actual
•Budget
•Forecast (Multiple Forecasts)
•Study Period (if Applicable)
Balance Type Comparisons
Financial Data
Business Performance Management

page 97
Plaza 48 Hour Processing
0
2
4
6
8
10
12
14
16
0:00
2:00
4:00
6:00
8:00
10:0
0
12:0
0
14:0
0
16:0
0
18:0
0
20:0
0
22:0
00:
002:
004:
006:
008:
00
10:0
0
12:0
0
14:0
0
16:0
0
18:0
0
20:0
0
22:0
0
Time
So
rters
@54,0
42 ite
m p
er/
ho
ur
IBFS
Capture
Available Unused capacity versus Excess capacity
- no Available Unused capacity at 2:00, therefore no Excess capacity overall
Window Capacity By Time of Day
Business Performance Management
Excess Capacity
Available Unused
page 98
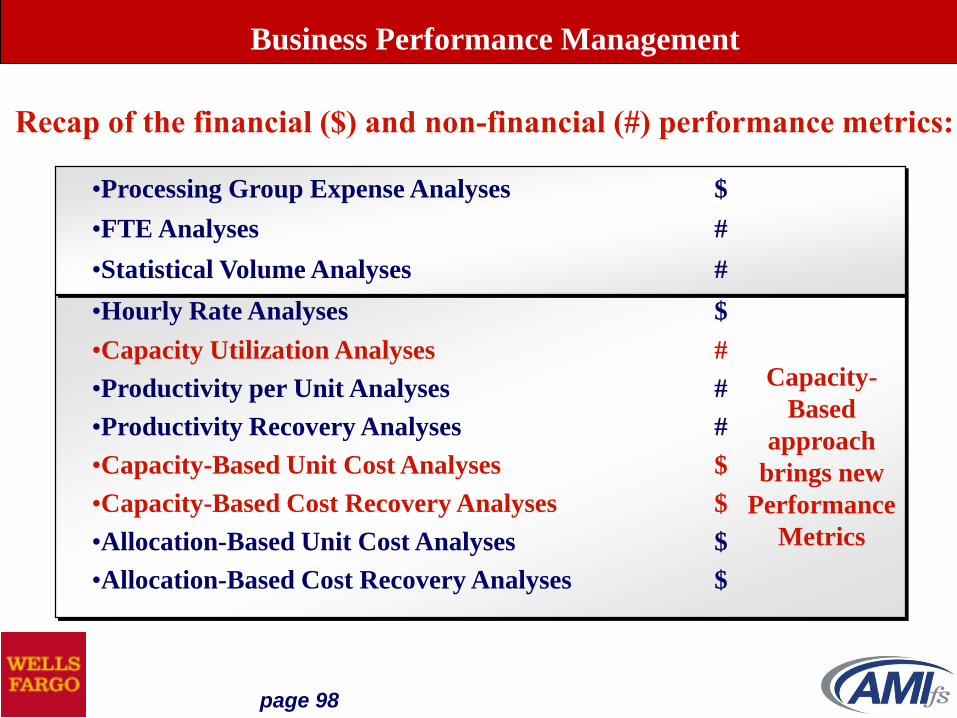
•Processing Group Expense Analyses $
•FTE Analyses #
•Statistical Volume Analyses #
•Hourly Rate Analyses $
•Capacity Utilization Analyses #
•Productivity per Unit Analyses #
•Productivity Recovery Analyses #
•Capacity-Based Unit Cost Analyses $
•Capacity-Based Cost Recovery Analyses $
•Allocation-Based Unit Cost Analyses $
•Allocation-Based Cost Recovery Analyses $
Recap of the financial ($) and non-financial (#) performance metrics:
Capacity-
Based
approach
brings new
Performance
Metrics
Business Performance Management

page 99
•Error Rates
•Reject Rates
•Turnaround Time
•Response Time
•Customer Satisfaction
•Employee Tenure
•Employee Turnover
In addition, the analyses should align certain quality
indicators and other relevant information against the
performance metrics to look for patterns and/or trends
against the performance results. Examples include:
Business Performance Management

page 100
Performance Metrics can also be presented across
multiple balance types. Comprehensive Variance Analyses
across balance type comparisons include:
•Actual vs. Budget
•Actual vs. Forecast (Multiple Forecasts)
•Budget vs. Forecast
•Actual vs. Study Period (if Different from
Budget/Forecast)
Business Performance Management

page 101
Analysis
Module
Analysis Outputs
Monthly Performance Metrics
• Monthly Results by Balance Type
• Balance Type Comparatives
Comprehensive Variance Analyses
• Performance Variance Calculations
• Variance Explanations
Analysis Inputs
Costing Information Database:•Unit Costs by Study Group•Unit Times by Study Group•HR FTE/Production Hours by Study Group •Study Period Hourly Rates•Study Period Performance Ratios
Monthly Production Values:
•RCD Volumes by Proc. Center
•PCD Volumes
•GL $ by Processing Center
•FTE/Hours by Processing Center•Quality Indicators by Processing Center
Monthly Analysis Balance Types:
•Budget by Period
•Forecast by Period
•Actual by Period
•Study Period Results
CCM Deployment for Integrated Resource Management
Business Performance Management

page 102
Treasury Operations
January February March April May June
$ 365,060 $ 334,842 $ 353,857 $ 358,986 $ 369,217 $ 377,349
$ 366,200 $ 366,200 $ 374,200 $ 366,200 $ 366,200 $ 366,200
$ 375,858 $ 375,858 $ 375,858 $ 375,858 $ 375,858 $ 375,858
Strategic Business Analysis
January February March April May June
36.91 34.95 39.28 35.00 37.00 40.00
40.00 40.00 40.00 40.00 40.00 40.00
37.50 37.50 37.50 37.50 37.50 37.50
Treasury Operations
1 2 3 4 5 6
Actual
Study Period$310,000
$320,000
$330,000
$340,000
$350,000
$360,000
$370,000
$380,000
Month
Expense Analysis
Actual
Forecast
Study Period
1 2 3 4 5 6
Actual
Study Period32
33
34
35
36
37
38
39
40
Month
FTE Analysis
Actual
Forecast
Study Period
Business Performance Management

page 103
January February March April May June
$ 65.07 $ 63.03 $ 59.27 $ 67.48 $ 65.65 $ 62.06
$ 60.23 $ 60.23 $ 61.55 $ 60.23 $ 60.23 $ 60.23
$ 65.94 $ 65.94 $ 65.94 $ 65.94 $ 65.94 $ 65.94
Treasury Operations
Strategic Business Analysis
January February March April May June
95.22% 96.01% 87.73% 102.15% 92.54% 94.30%
85.54% 85.54% 85.54% 85.54% 85.54% 85.54%
90.00% 90.00% 90.00% 90.00% 90.00% 90.00%
Treasury Operations
1 2 3 4 5 6
Actual
Study Period54
56
58
60
62
64
66
68
Month
Hourly Rate Analysis
Actual
Forecast
Study Period
1 2 3 4 5 6
Actual
Study Period75%
80%
85%
90%
95%
100%
105%
Month
Capacity Utilization Analysis
Actual
Forecast
Study Period
Business Performance Management

page 104
Analysis
Module
Analysis Outputs
Monthly Performance Metrics
• Monthly Results by Balance Type
• Balance Type Comparatives
Comprehensive Variance Analyses
• Performance Variance Calculations
• Variance Explanations
Analysis Inputs
Costing Information Database:•Unit Costs by Study Group•Unit Times by Study Group•HR FTE/Production Hours by Study Group •Study Period Hourly Rates•Study Period Performance Ratios
Monthly Production Values:
•RCD Volumes by Proc. Center
•PCD Volumes
•GL $ by Processing Center
•FTE/Hours by Processing Center•Quality Indicators by Processing Center
Monthly Analysis Balance Types:
•Budget by Period
•Forecast by Period
•Actual by Period
•Study Period Results
CCM Deployment for Integrated Resource Management
Business Performance Management

page 105
Processing
Credits
Expenses
Incurred
CostRecoveryResidual
IntegratedResource
Management
$ Dimension
Residual
Analysis
By Ledger Type:
•Actual
•Budget
•Forecast•Multiple Forecast
Business Performance Management

page 106
When using standard or published costs for cost allocations, a residual is created each
period. As a result, the cost pools will either be over-allocated or under-allocated. For the
tier 1 financial institutions, 67% create a residual when running cost allocations. For tier 2
institutions responding, 50% create a residual and for tier 3, less than 30% [Graph 5].
When asked whether calculated residuals are distributed, two thirds of the tier 1
institutions said yes, 57% of the tier 2 institutions and half of the tier 3 institutions said yes
[Graph 6].
Graph 5 Graph 6
67%
50%
32%
0%
10%
20%
30%
40%
50%
60%
70%
Tier 1 Tier 2 Tier 3
% of Respondents Creating Residuals
67%
57%
50%
0%
10%
20%
30%
40%
50%
60%
70%
Tier 1 Tier 2 Tier 3
% of Respondents Allocating Residuals
Best Practice Costing – Treasury Management

page 107
A follow up question for those institutions that allocate the residual each period was to
what level, including:
•Line of Business (LOB)
•Product
•Customer
•Customer Account
Across all three tiers, 13% allocate to LOB only, 21% to Product only and nearly 2/3 to
both LOB and product. None of the respondents allocate residuals to a customer or
customer account level. [Graph 8].
Graph 8
Residual Distributions
LOB
13%
Product
21%
LOB & Product
66%
Customer
0%
Best Practice Costing – Treasury Management

page 108
Actual
Expenses
$135,425
Actual
Expenses
Forecast
Expenses
Forecast
Volumes
Forecast
Alloc-Based Unit Cost
“X”
Actual Volumes
Alloc.-Based
Cost Recovery
Residual
$144
Volume
Variance
$3,739
Spending
Variance
($3,595)
Actual
Volumes
Example: Allocation-Based Cost Recovery Analysis
$135,569
Volume Variance
“X”
Forecast
Alloc-Based Unit Cost
Forecast Expenses
Less
Actual Expenses
Business Performance Management

page 109
Business Performance Management
Example: Allocation-Based Cost Recovery Analysis
Allocation-Based Expense Recovery Variance Analysis January February March April May June
Study Period vs. Actual
Expense Recovery Variance
Portfolio Loans 5,166$ 5,187$ 5,083$ 5,148$ 5,285$ 5,329$
Loan Payoffs 52,945$ 53,154$ 53,115$ 53,429$ 52,263$ 52,978$
Loan Disbursements 20$ 17$ 23$ 12$ 20$ 17$
Loan Payments 77,438$ 77,663$ 77,083$ 78,379$ 78,088$ 76,774$
Total 135,569$ 136,021$ 135,305$ 136,967$ 135,657$ 135,098$
Actual Expenses 135,425$ 136,244$ 135,152$ 136,517$ 135,731$ 135,091$
Total Expense Recovery Variance 144 (223) 152 450 (75) 7
RCD Volume Variance
Portfolio Loans 73$ 94$ (10)$ 54$ 192$ 236$
Loan Payoffs 4,359$ 4,568$ 4,529$ 4,843$ 3,677$ 4,392$
Loan Disbursements (20)$ (23)$ (17)$ (28)$ (20)$ (23)$
Loan Payments (673)$ (448)$ (1,028)$ 268$ (23)$ (1,337)$
Total RCD Volume Variance 3,739$ 4,191$ 3,475$ 5,137$ 3,827$ 3,268$
Spending Variance
Study Period 131,830$ 131,830$ 131,830$ 131,830$ 131,830$ 131,830$
Actual 135,425$ 136,244$ 135,152$ 136,517$ 135,731$ 135,091$
Total Spending Variance (3,595)$ (4,414)$ (3,322)$ (4,687)$ (3,902)$ (3,261)$
Total Expense Recovery Variance 144 (223)$ 152$ 450$ (75)$ 7$

page 110
Business Performance Management
Example: Allocation-Based Cost Recovery Analysis
Allocation-Based Expense Recovery Variance Analysis January February March April May June
Study Period vs. Actual
Expense Recovery Variance
Portfolio Loans 5,166$ 5,569$ 5,684$ 5,791$ 5,791$ 5,813$
Loan Payoffs 51,246$ 52,604$ 53,665$ 53,978$ 53,912$ 52,681$
Loan Disbursements 17$ 20$ 23$ 17$ 20$ 20$
Loan Payments 73,688$ 77,663$ 84,583$ 89,629$ 89,338$ 93,649$
Total 130,117$ 135,856$ 143,956$ 149,416$ 149,062$ 152,163$
Actual Expenses 145,425$ 149,244$ 149,152$ 149,517$ 143,731$ 144,091$
Total Expense Recovery Variance (15,307) (13,388) (5,196) (101) 5,330 8,072
RCD Volume Variance
Portfolio Loans 73$ 476$ 591$ 698$ 698$ 719$
Loan Payoffs 2,660$ 4,018$ 5,079$ 5,392$ 5,326$ 4,095$
Loan Disbursements (23)$ (20)$ (17)$ (23)$ (20)$ (20)$
Loan Payments (4,423)$ (448)$ 6,473$ 11,518$ 11,228$ 15,538$
Total RCD Volume Variance (1,712)$ 4,026$ 12,126$ 17,586$ 17,232$ 20,333$
Spending Variance
Study Period 131,830$ 131,830$ 131,830$ 131,830$ 131,830$ 131,830$
Actual 145,425$ 149,244$ 149,152$ 149,517$ 143,731$ 144,091$
Total Spending Variance (13,595)$ (17,414)$ (17,322)$ (17,687)$ (11,902)$ (12,261)$
Total Expense Recovery Variance (15,307) (13,388)$ (5,196)$ (101)$ 5,330$ 8,072$
page 111
Business Performance Management
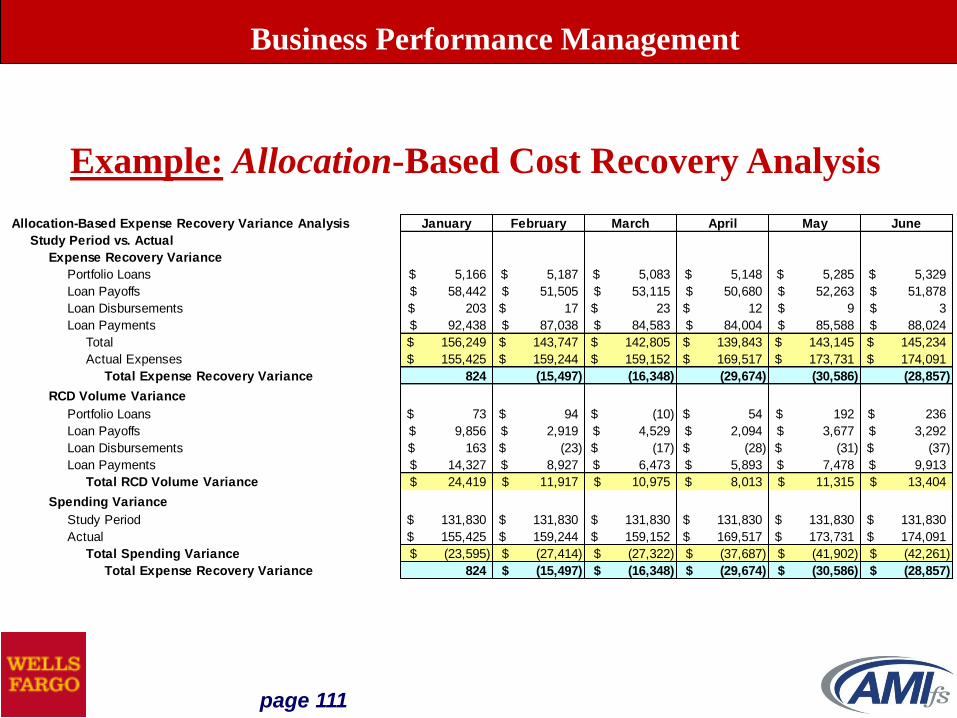
Example: Allocation-Based Cost Recovery Analysis
Allocation-Based Expense Recovery Variance Analysis January February March April May June
Study Period vs. Actual
Expense Recovery Variance
Portfolio Loans 5,166$ 5,187$ 5,083$ 5,148$ 5,285$ 5,329$
Loan Payoffs 58,442$ 51,505$ 53,115$ 50,680$ 52,263$ 51,878$
Loan Disbursements 203$ 17$ 23$ 12$ 9$ 3$
Loan Payments 92,438$ 87,038$ 84,583$ 84,004$ 85,588$ 88,024$
Total 156,249$ 143,747$ 142,805$ 139,843$ 143,145$ 145,234$
Actual Expenses 155,425$ 159,244$ 159,152$ 169,517$ 173,731$ 174,091$
Total Expense Recovery Variance 824 (15,497) (16,348) (29,674) (30,586) (28,857)
RCD Volume Variance
Portfolio Loans 73$ 94$ (10)$ 54$ 192$ 236$
Loan Payoffs 9,856$ 2,919$ 4,529$ 2,094$ 3,677$ 3,292$
Loan Disbursements 163$ (23)$ (17)$ (28)$ (31)$ (37)$
Loan Payments 14,327$ 8,927$ 6,473$ 5,893$ 7,478$ 9,913$
Total RCD Volume Variance 24,419$ 11,917$ 10,975$ 8,013$ 11,315$ 13,404$
Spending Variance
Study Period 131,830$ 131,830$ 131,830$ 131,830$ 131,830$ 131,830$
Actual 155,425$ 159,244$ 159,152$ 169,517$ 173,731$ 174,091$
Total Spending Variance (23,595)$ (27,414)$ (27,322)$ (37,687)$ (41,902)$ (42,261)$
Total Expense Recovery Variance 824 (15,497)$ (16,348)$ (29,674)$ (30,586)$ (28,857)$

page 112
Productivity Measurement
Links total Production Volumes to total
Production Hours (e.g., # of FTEs or # of CPU Hours)
to Calculate a Throughput Rate per Hour
Business Performance Management

page 113
With a plan commitment to increase Productivity
from 10,000 items per FTE to 12,000 items per FTE,
improvement can be represented as follows:
Total
Plan Volume
400,000
FTEs Required
at 10,000 per FTE
40.0
FTEs Required
at 12,000 per FTE
33.33
FTEs Required
at 12,000 per FTE
40.0
Potential
Plan Volume
480,000
Potential
FTE Re-Deployment
6.67
Business Performance Management

page 114
Actual
Expenses
$175,425
Actual
Expenses
Study Period
Expenses
Study Period
Volumes
Study Period
Cap-Based Unit Costs
“X”
Actual Volumes
Cap.-Based
Cost Recovery
Residual
($36,611)
Hourly Rt.
Variance
$23,217
Utilization
Variance
($59,828)
Actual
Volumes
Example: Capacity-Based Cost Recovery Analysis
$138,814
Hourly Rate
Variance
“X”
Actual Hours
Actual Unused
Capacity
“X”
Study Period
Hourly Rate
Business Performance Management

page 115
Business Performance Management
Example: Capacity-Based Cost Recovery Analysis
Capacity-Based Cost Recovery Variance Analysis January February March April May June
Study Period vs. Actual
Cost Recovery Variance
Portfolio Loans 4,590$ 4,608$ 4,515$ 4,573$ 4,695$ 4,734$
Loan Payoffs 51,921$ 45,757$ 47,188$ 45,025$ 46,431$ 41,206$
Loan Disbursements 181$ 15$ 21$ 10$ 8$ 3$
Loan Payments 82,123$ 68,997$ 75,145$ 74,630$ 76,038$ 66,541$
Total Recovery 138,814$ 119,378$ 126,870$ 124,239$ 127,172$ 112,484$
Total Expenses 175,425$ 149,244$ 139,152$ 169,517$ 133,731$ 134,091$
% Recovery 79.13% 79.99% 91.17% 73.29% 95.10% 83.89%
Total Cost Recovery Variance (36,611)$ (29,866)$ (12,283)$ (45,278)$ (6,559)$ (21,607)$
Hourly Rate Variance
Study Period Hourly Rate 40.70$ 40.70$ 40.70$ 40.70$ 40.70$ 40.70$
Actual Hourly Rate 35.94$ 28.90$ 27.82$ 34.30$ 27.49$ 29.49$
Rate Variance per Hour 4.76$ 11.80$ 12.88$ 6.39$ 13.21$ 11.20$
Actual Hours 4,880.72 5,164.96 5,002.32 4,941.52 4,864.00 4,546.32
Total Hourly Rate Variance 23,217$ 60,966$ 64,439$ 31,599$ 64,230$ 50,941$
Utilization Variance
ABC Unit Times X Actual Volumes 3,411 2,933 3,117 3,053 3,125 2,764
Actual Hours 4,881 5,165 5,002 4,942 4,864 4,546
Utilization Variance (1,470) (2,232) (1,885) (1,889) (1,739) (1,783)
Study Period Hourly Rate 40.70$ 40.70$ 40.70$ 40.70$ 40.70$ 40.70$
Total Utilization Variance (59,828)$ (90,832)$ (76,721)$ (76,878)$ (70,789)$ (72,548)$
Total Cost Recovery Variance (36,611)$ (29,866)$ (12,283)$ (45,278)$ (6,559)$ (21,607)$

page 116
Capacity Utilization Measurement
Links total Production Volumes
Extended by Unit Times against
Practical Capacity, Expressed in Hours
Business Performance Management

page 117
With a plan commitment to increase Capacity
Utilization from 75% to 85%, improvement
can be represented as follows:
Total
Plan Capacity
400,000
Capacity Utilization
at 75%
300,000
Potential Reduction
to Total Plan Capacity
353,000
Potential Volume
Increase to Plan
40,000
Capacity Utilization
at 85%
340,000
Capacity Utilization
at 85%
300,000
Business Performance Management

page 118
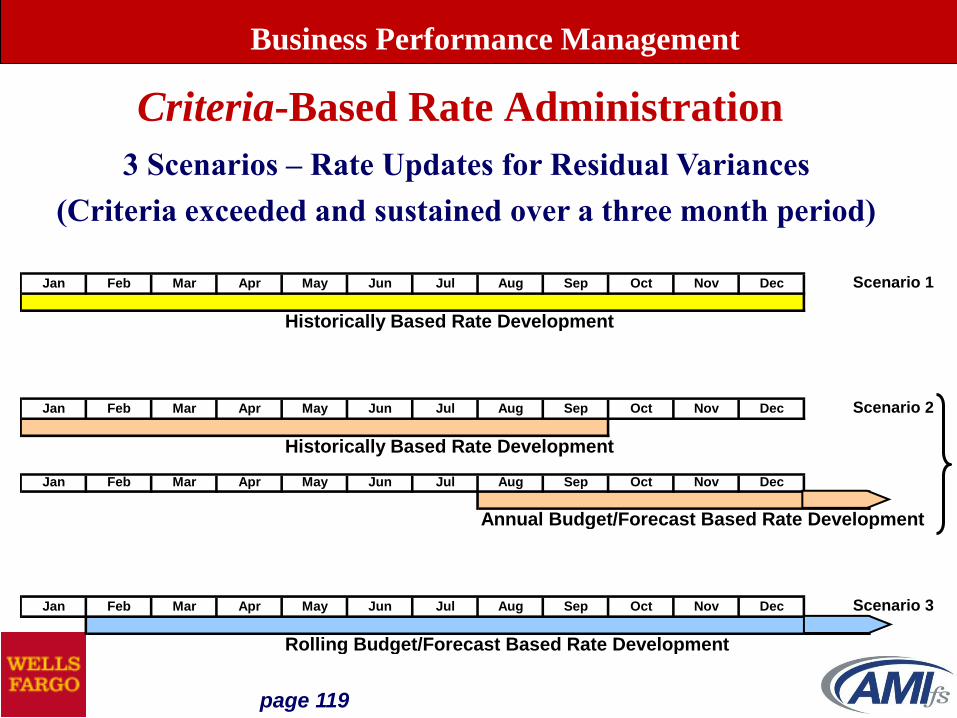
Criteria-Based Rate Administration
•Residual Variances (sustained over a three month period)
> 15% Cost Pools under $X MM
> 10% Cost Pools over $X MM
•Changes in forecasted expenses associated with strategic
efficiency or productivity initiatives
•Changes is projected volumes associated with significant new
business or the loss of key customers
•New Service / Drivers
•New Service (e.g. Image Cash Letter)
•New Drivers (e.g. Clearing Checks via ACH)
•Exceptions considered case-by-case
Business Performance Management
page 119
Criteria-Based Rate Administration
3 Scenarios – Rate Updates for Residual Variances
(Criteria exceeded and sustained over a three month period)
Jan Feb Mar Apr May Jun Jul Aug Sep Oct Nov Dec Scenario 1
Historically Based Rate Development
Jan Feb Mar Apr May Jun Jul Aug Sep Oct Nov Dec Scenario 2
Historically Based Rate Development
Jan Feb Mar Apr May Jun Jul Aug Sep Oct Nov Dec
Annual Budget/Forecast Based Rate Development
Jan Feb Mar Apr May Jun Jul Aug Sep Oct Nov Dec Scenario 3
Rolling Budget/Forecast Based Rate Development
Business Performance Management

page 120
Comprehensive Cost Management
Case Study
Deployment - Capacity-Based Methodology
Vs.
Allocation-Based
If you can do cost accounting for financial services,
you can do it for ANY industry…
Business Performance Management

page 121
Monthly Production Data Assumptions:
Personnel Expense $ 31,000
Equip. Depreciation Expense $ 3,000
Occupancy Expense $ 6,000
Materials Expense $ 4,500
Total Expenses $ 44,500
Calculate the following:
Capacity Utilization %
Hourly Rates (Fixed, Semi-Variable, Variable)
Capacity-Based Cost Recovery %
Capacity-Based Cost Recovery Residual $
• Hourly Rate Component
• Utilization Component
Fully Absorbed Cost Recovery %
Fully Absorbed Cost Recovery Residual $
• Spending Component
• Volume Component
Productivity
Hours worked 1,000
Bottles processed 110,000
Comprehensive Cost Management Case Study
Business Performance Management

page 122
Capacity Utilization % = 91.67% [(110,000 * 30 seconds/3600)/1,000 Hours]Hourly RateVariable $ 4.50 ($ 4.50 = $4,500/1,000)Semi-variable $31.00 ($31.00 = $31,000/1,000)Fixed $ 9.00 ($ 9.00 = $9,000/1,000)Total $44.50
Full Capacity Unit Cost $0.3166Fully Absorbed Unit Cost $0.3800
Capacity-Based Cost Recovery% 78.26% ($0.3166 unit cost * 110,000 Bottles/$44,500)
Capacity-Based Cost Recovery Residual $(9,667) ($0.3166 unit cost * 110,000 Bottles = $34,833) less $44,500
-Hourly Rate Component $(6,500) (Study Period Hrly. Rate less Actual Hrly. Rate) * Actual Hours
-Utilization Component $(3,167) [(Unit Time * Actual Volume) – Actual Hours]
* Study Period Hourly Rate
Fully Absorbed Cost Recovery % 93.93% ($0.3800 unit cost * 110,000 Bottles/$44,500)
Fully Absorbed Cost Recovery Residual $(2,700) ($0.3800 unit cost * 110,000 Bottles = $41,800) less $44,500
-Spending Component $(12,833) ($380,000/12) less $44,500-Volume Component $10,133 [(110,000 - (1,000,000/12)] * $0.3800
Productivity 110 per Hour (110,000 Bottles/1,000 Hours)
Comprehensive Cost Management Case Study
Business Performance Management

page 123
Cost Deployment
for
Integrated Profitability
Business Performance Management

page 124
Product
Revenues
LOB
Customer
Distributed
Costs
Product
Margins
Del. Chan.
Distributed
Credits
Bus. Proc.
Res. Group
Expenses
Incurred
Cost
Recovery
Residual
CCM Deployment for Integrated Profitability
Business Performance Management

page 125
Usage –Driven
Transaction Costs by
Delivery Channel
Business Performance Management

page 126
They have to anticipate Resource Requirements every day:
Too many resources positioned today by Delivery Channel
Not enough resources positioned today by Delivery Channel
Resource Managers are frustrated without
Management Information:
What about tomorrow?
Customers of the Bank do not announce their
transaction intentions nor their
Delivery Channel preferences.
Delivery Channel Alternatives
Business Performance Management
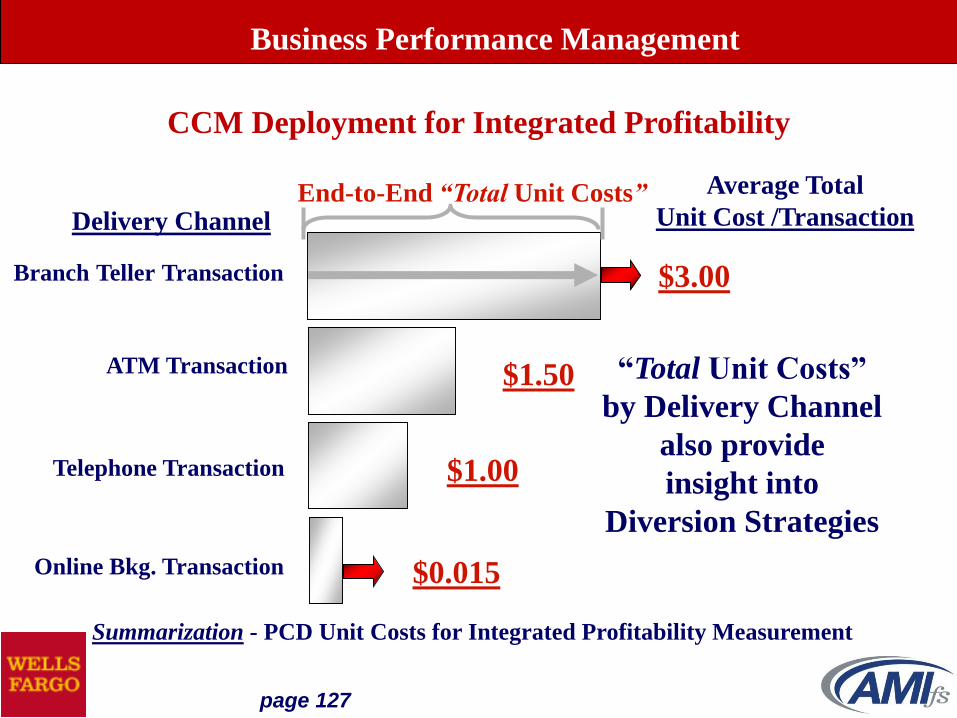
page 127
Branch Teller Transaction
Delivery Channel
ATM Transaction
Telephone Transaction
Online Bkg. Transaction
Average Total
Unit Cost /Transaction
$1.00
$3.00
$1.50
$0.015
“Total Unit Costs”
by Delivery Channel
also provide
insight into
Diversion Strategies
End-to-End “Total Unit Costs”
Summarization - PCD Unit Costs for Integrated Profitability Measurement
CCM Deployment for Integrated Profitability
Business Performance Management

page 128
Understanding Costs and Usage by Delivery Channel provides
insight into Integrated Profitability and Integrated Resource Management
Branch Teller Transactions
Delivery Channel
ATM Transactions
Telephone Banking Transactions
Online Banking Transactions
Utilization %
67%
72%
50%
10% Available Unused Capacity
Business Performance Management

page 129
Customer: R. McDonald
ABC Bank: YTD 2016Drill down into Products
TOTAL
DEPOSIT
PRODUCTS
CREDIT
PRODUCTSFEE BASED
PRODUCTS
INTEREST INCOME
CHARGE FOR FUNDS
NET INTEREST INCOME
INTEREST EXPENSE
CREDIT FOR FUNDS
NET FUNDS ADJUSTMENT
NET INTEREST MARGIN
PROVISION FOR LOSSES
GROSS FEES
WAIVED FEES
NON-INTEREST INCOME
NET REVENUES
SERVICING COSTS - BRANCH
SERVICING COSTS - ATM
SERVICING COSTS - TEL. BKG.
SERVICING COSTS - INTERNET
DIRECT PRODUCT COSTS
RELATIONSHIP MGT COSTS
SALES AND MARKETING COSTS
TOTAL COSTS
PRODUCT MARGINS
XXXX
XXXX
XXXX
XXXX
XXXX
XXXX
XXXX
XXXX
XXXX
XXXX
XXXX
XXXX
XXXX
XXXX
XXXX
XXXX
XXXX
XXXX
XXXX
_____
XXXX
XXXX
XXXX
XXXX
XXXX
XXXX
XXXX
XXXX
XXXX
XXXX
XXXX
XXXX
XXXX
XXXX
XXXX
XXXX
XXXX
XXXX
XXXX
_____
_____
XXXX
XXXX
XXXX
XXXX
XXXX
XXXX
XXXX
XXXX
XXXX
XXXX
XXXX
XXXX
XXXX
_____
_____
_____
XXXX
XXXX
XXXX
XXXX
XXXX
XXXX
XXXX
XXXX
XXXX
XXXX
XXXX
XXXX
Usage-Driven Transaction Costs
Usage-Driven
Transaction
Costs by
Delivery Channel
CCM Deployment for Integrated Profitability
Delivery Channel
Alternatives:
•Same Customer
•Same Product
•Same Transaction
Different Costs

page 130
Customer: R. McDonald
ABC Bank: YTD 2016Drill down into Products
TOTAL
DEPOSIT
PRODUCTS
CREDIT
PRODUCTSFEE BASED
PRODUCTS
INTEREST INCOME
CHARGE FOR FUNDS
NET INTEREST INCOME
INTEREST EXPENSE
CREDIT FOR FUNDS
NET FUNDS ADJUSTMENT
NET INTEREST MARGIN
PROVISION FOR LOSSES
GROSS FEES
WAIVED FEES
NON-INTEREST INCOME
NET REVENUES
SERVICING COSTS - BRANCH
SERVICING COSTS - ATM
SERVICING COSTS - TEL. BKG.
SERVICING COSTS - INTERNET
DIRECT PRODUCT COSTS
RELATIONSHIP MGT COSTS
SALES AND MARKETING COSTS
TOTAL COSTS
PRODUCT MARGINS
XXXX
XXXX
XXXX
XXXX
XXXX
XXXX
XXXX
XXXX
XXXX
XXXX
XXXX
XXXX
XXXX
XXXX
XXXX
XXXX
XXXX
XXXX
XXXX
_____
XXXX
XXXX
XXXX
XXXX
XXXX
XXXX
XXXX
XXXX
XXXX
XXXX
XXXX
XXXX
XXXX
XXXX
XXXX
XXXX
XXXX
XXXX
XXXX
_____
_____
XXXX
XXXX
XXXX
XXXX
XXXX
XXXX
XXXX
XXXX
XXXX
XXXX
XXXX
XXXX
XXXX
_____
_____
_____
XXXX
XXXX
XXXX
XXXX
XXXX
XXXX
XXXX
XXXX
XXXX
XXXX
XXXX
XXXX
CCM Deployment for Integrated Profitability
Credibility
with CCM brings
Renewed Focus
to the Product
Margins Line
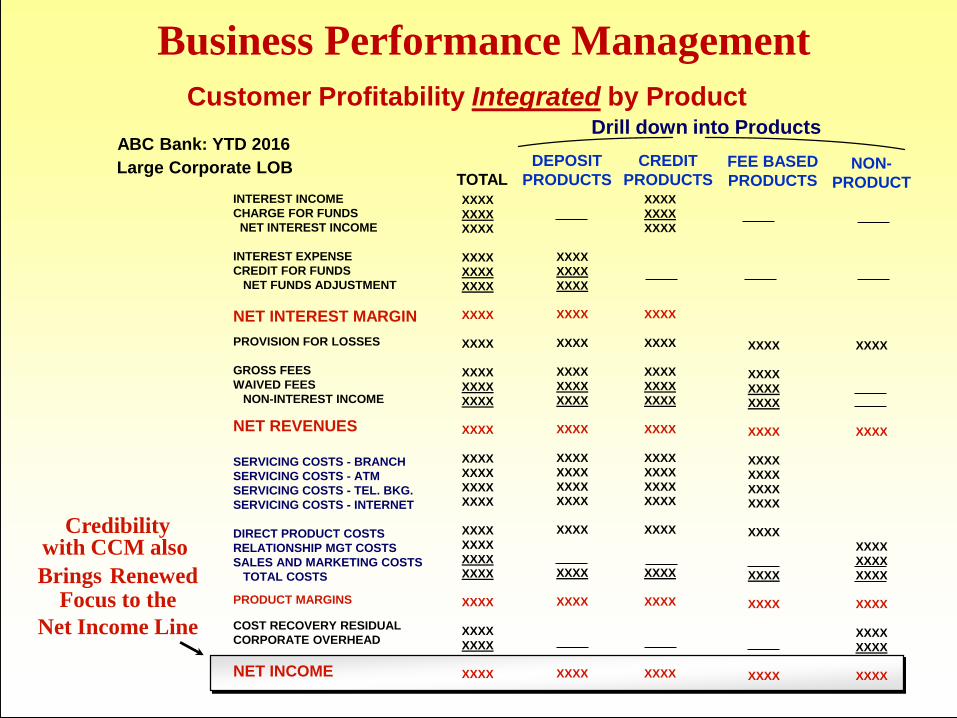
page 131
ABC Bank: YTD 2016Drill down into Products
Customer Profitability Integrated by Product
TOTAL
DEPOSIT
PRODUCTS
CREDIT
PRODUCTSFEE BASED
PRODUCTSINTEREST INCOME
CHARGE FOR FUNDS
NET INTEREST INCOME
INTEREST EXPENSE
CREDIT FOR FUNDS
NET FUNDS ADJUSTMENT
NET INTEREST MARGIN
PROVISION FOR LOSSES
GROSS FEES
WAIVED FEES
NON-INTEREST INCOME
NET REVENUES
SERVICING COSTS - BRANCH
SERVICING COSTS - ATM
SERVICING COSTS - TEL. BKG.
SERVICING COSTS - INTERNET
DIRECT PRODUCT COSTS
RELATIONSHIP MGT COSTS
SALES AND MARKETING COSTS
TOTAL COSTS
PRODUCT MARGINS
COST RECOVERY RESIDUAL
CORPORATE OVERHEAD
NET INCOME
XXXX
XXXX
XXXX
XXXX
XXXX
XXXX
XXXX
XXXX
XXXX
XXXX
XXXX
XXXX
XXXX
XXXX
XXXX
XXXX
XXXX
XXXX
XXXX
XXXX
XXXX
XXXX
XXXX
XXXX
XXXX
XXXX
XXXX
XXXX
XXXX
XXXX
XXXX
XXXX
XXXX
XXXX
XXXX
XXXX
XXXX
XXXX
XXXX
XXXX
XXXX
XXXX
XXXX
XXXX
XXXX
XXXX
XXXX
XXXX
XXXX
XXXX
XXXX
XXXX
XXXX
XXXX
XXXX
XXXX
XXXX
XXXX
XXXX
XXXX
XXXX
XXXX
XXXX
XXXX
XXXX
XXXX
XXXX
XXXX
XXXX
XXXX
XXXX
Business Performance Management
XXXX
XXXX
XXXX
XXXX
XXXX
XXXX
XXXX
XXXX
XXXX
NON-
PRODUCT
Credibilitywith CCM also
Brings RenewedFocus to the
Net Income Line
Large Corporate LOB

page 132
Usage –Driven Transaction
Unit Cost Components
and
Contribution Margins
Business Performance Management

page 133
Large Corporate LOB
ABC Bank: YTD 2016Drill down into Products
TOTAL
DEPOSIT
PRODUCTS
CREDIT
PRODUCTSFEE BASED
PRODUCTS
INTEREST INCOME
CHARGE FOR FUNDS
NET INTEREST INCOME
INTEREST EXPENSE
CREDIT FOR FUNDS
NET FUNDS ADJUSTMENT
NET INTEREST MARGIN
PROVISION FOR LOSSES
GROSS FEES
WAIVED FEES
NON-INTEREST INCOME
NET REVENUES
VARIABLE COSTS
CONTRIB. TO SEMI-V. & FIXED
SEMI-VARIABLE COSTS
CONTRIB. TO FIXED
FIXED COSTS
AVAILABLE UNUSED CAPACITY
NET INCOME
XXXX
XXXX
XXXX
XXXX
XXXX
XXXX
XXXX
XXXX
XXXX
XXXX
XXXX
XXXX
XXXX
XXXX
XXXX
XXXX
XXXX
XXXX
XXXX
_____
XXXX
XXXX
XXXX
XXXX
XXXX
XXXX
XXXX
XXXX
XXXX
XXXX
XXXX
XXXX
XXXX
XXXX
XXXX
XXXX
XXXX
_____
_____
XXXX
XXXX
XXXX
XXXX
XXXX
XXXX
XXXX
XXXX
XXXX
XXXX
XXXX
NON-
PRODUCT
CCM Deployment for Integrated Profitability
CCM
also brings
Unit Cost
Components
And Capacity
Information for
Various
Contribution
Margins
_____
_____
_____
XXXX
_____
XXXX
XXXX
XXXX
XXXX
XXXX
XXXX
_____
_____
XXXX
XXXX
XXXX
XXXX
XXXX
XXXX
XXXX
XXXX
XXXX
XXXX

page 134
Establishing
Business Performance Management
Targets
Business Performance Management

page 135
Another very interesting topic is planning or budgeting. Participants were asked what
form of planning/budgeting best describes the practices at their institution from the
following list:
•Static Budgeting (budget remains unchanged all year)
•Moving Budget (one that is updated only for material changes)
•Rolling Budget (one that is updated in a continuous pattern, such as monthly or
quarterly)
•Volume-Based Budgeting
•Zero-Based Budgeting
The answers are stratified by institution tier below [Graph 13]:
Graph 13
25%
37%
38%
0%
55%
23%
14%
8%
65%
24%
11%0%
0%
10%
20%
30%
40%
50%
60%
70%
80%
90%
100%
Tier 1 Tier 2 Tier 3
Budgeting Practices
Zero-Based
Rolling
Moving
Static
Best Practice Costing – Treasury Services

page 136
Another question asked participants the extent to which costing efforts are integrated with
the budget or planning process from the following:
•Fully Integrated
•Mostly Integrated
•Somewhat Integrated
•No Integration
The answers are again stratified by institution tier below [Graph 14]:
Graph 14
13%
38%
38%
13%
9%
9%
45%
36%
5%
11%
47%
37%
0%
10%
20%
30%
40%
50%
60%
70%
80%
90%
100%
Tier 1 Tier 2 Tier 3
Costing Integrated with Budgeting Process
Not Integrated
Somewhat Integrated
Mostly Integrated
Fully Integrated
Best Practice Costing – Treasury Services
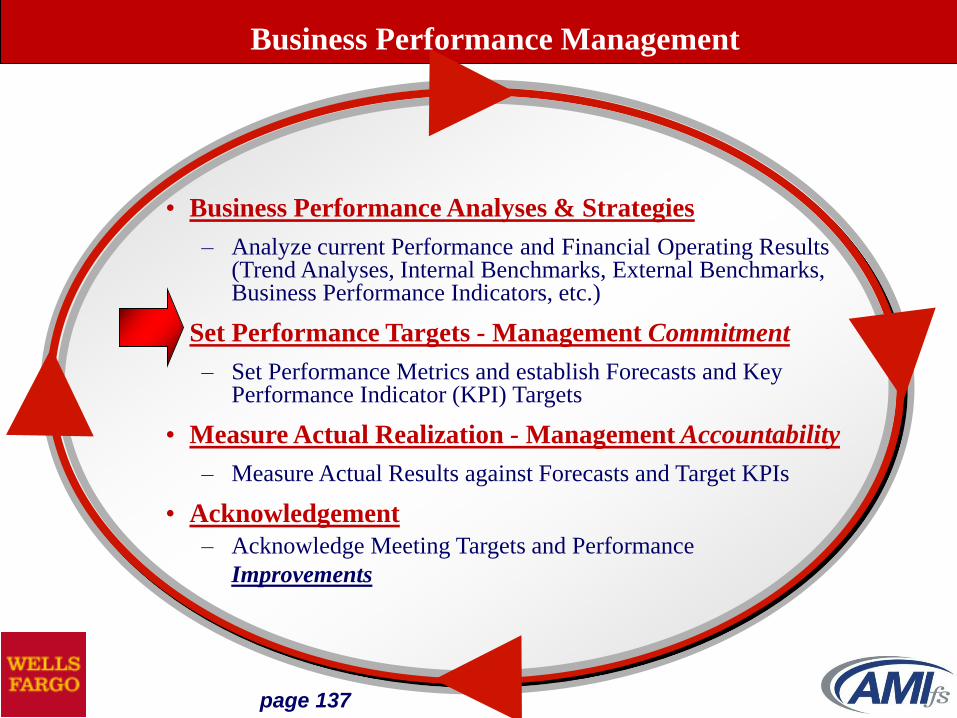
page 137
• Business Performance Analyses & Strategies
– Analyze current Performance and Financial Operating Results (Trend Analyses, Internal Benchmarks, External Benchmarks, Business Performance Indicators, etc.)
• Set Performance Targets - Management Commitment
– Set Performance Metrics and establish Forecasts and Key Performance Indicator (KPI) Targets
• Measure Actual Realization - Management Accountability
– Measure Actual Results against Forecasts and Target KPIs
• Acknowledgement
– Acknowledge Meeting Targets and Performance
Improvements
Business Performance Management

page 138
Business Performance Management
Business performance optimization is not an end goal, but
rather a relentless commitment to continuous business
process improvement. To optimize is to make something
function at its best or most effective, or to use something to
its best advantage. Activity-based metrics quantify business
processes and resource utilization. Baseline financial
information, together with indentifying business process
value-add opportunities, are the means to prioritize and
measure evidence of continuous business process
improvement.
Business Performance Optimization

page 139
Business Performance Management
The approach to process improvements looks first for
business processes that can be eliminated, either because
they are redundant tasks or because they add no value to
the end product.
Business Performance Optimization

page 140
Business Performance Management
Second is to look for processes that can be simplified.
This step considers ideas such as alternative techniques or
procedures, non-concession shortcuts, and processing
path hand off and/or receipt logistics, for example.
Business Performance Optimization

page 141
Business Performance Management
Finally, this improvement approach looks for process
automation opportunities to achieve efficiencies and
quality enhancements for only legitimate and value-add
business processes.
Business Performance Optimization

page 142
Key Product and Non-
Product growth projections
by Market and Customer
Segment are provided by
each LOB through Business
Analyst liaisons.
The process to establish projected volumes follows a logical sequence
to align Resource Managers with front office LOB Managers’ plans as
follows:
Projected growth and Product
mix factors are transformed
and applied to projected
PCDs and functional RCDs,
which are aligned by area or
site providing the services.
Planning and Forecasting
Business Performance Management

page 143
With published Budget (or
Forecast) volume projections,
establish Key Performance
Indicator Targets, including
Capacity Utilization and
Productivity Improvements.
Combine Volume Projections
with Performance Targets by
site to establish Budget (or
Forecast) Resource
Requirements and related
Budget (or Forecast) Expenses.
Secure “Management Commitment”
to achieving Performance Targets
and Budget (or Forecast) results.
Planning and Forecasting
Business Performance Management

page 144
Product
Growth
Forecasts
Product
Cost Driver
Volume
Forecasts
Resource
Cost Driver
Volume
Forecasts
Productivity/
Capacity
Utilization
Targets
Forecast
Resource
RequirementsIntegrated
Resource
Management
ForecastPlanning & Forecasting
Product
Account
Volume
Forecasts
CCM
Study
Update
Integrated
Profitability
Forecast
Product
Balances,
Revenue
Forecasts
Business Performance Management

page 145
Delivery Channel Migration Strategies
Paper to Electronic Migration Strategies
Capacity Management & Planning Strategies
New Deal and Pricing Scenarios
Business/Product Exit Strategies
Key Customer Retention Strategies
Unprofitable Customer Exit Strategies
Strategic Business
Analyses and Pricing
Business Performance Management

page 146
Integrated
Resource
Management
Scorecard
Integrated Performance
Measurement Architecture
Strategic Management
Strategic
Analyses,
Pricing &
Forecasting
Integrated
Profitability
Measurement
Scorecard
Analyze Performance Results
Set Performance Targets
Measure Actual PerformanceResults vs. Targets
Acknowledge PerformanceImprovements
Integrated CCM
InformationDatabase
Business Performance Management
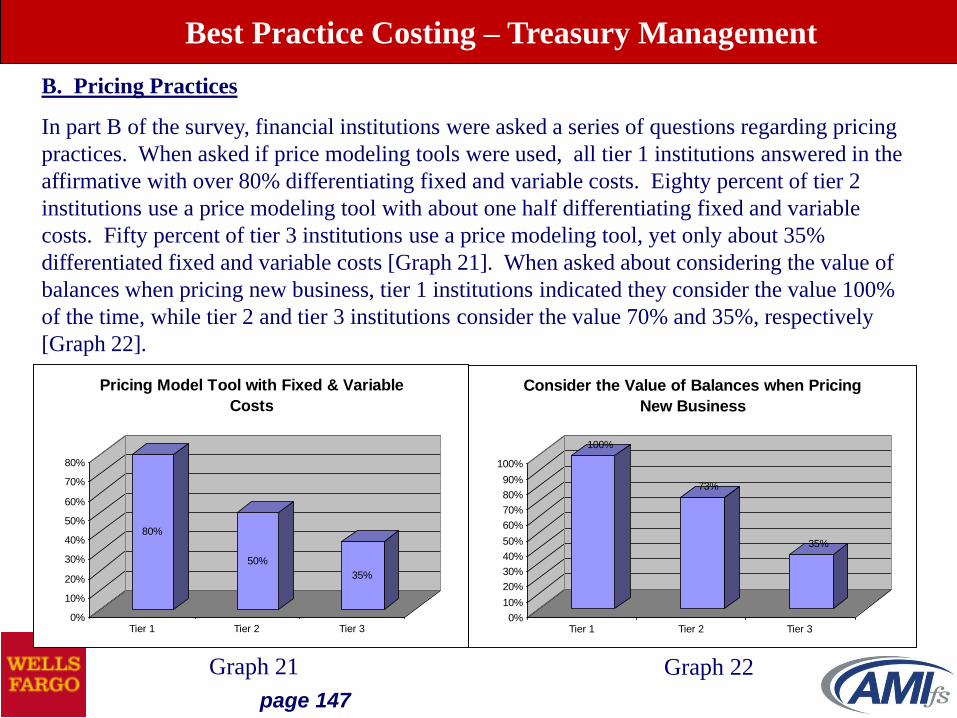
page 147
B. Pricing Practices
In part B of the survey, financial institutions were asked a series of questions regarding pricing
practices. When asked if price modeling tools were used, all tier 1 institutions answered in the
affirmative with over 80% differentiating fixed and variable costs. Eighty percent of tier 2
institutions use a price modeling tool with about one half differentiating fixed and variable
costs. Fifty percent of tier 3 institutions use a price modeling tool, yet only about 35%
differentiated fixed and variable costs [Graph 21]. When asked about considering the value of
balances when pricing new business, tier 1 institutions indicated they consider the value 100%
of the time, while tier 2 and tier 3 institutions consider the value 70% and 35%, respectively
[Graph 22].
80%
50%
35%
0%
10%
20%
30%
40%
50%
60%
70%
80%
Tier 1 Tier 2 Tier 3
Pricing Model Tool with Fixed & Variable
Costs
Graph 22Graph 21
100%
73%
35%
0%
10%
20%
30%
40%
50%
60%
70%
80%
90%
100%
Tier 1 Tier 2 Tier 3
Consider the Value of Balances when Pricing
New Business
Best Practice Costing – Treasury Management

page 148
When asked the basis for most pricing decisions, 38% of tier 1 institutions indicated they used
market-based pricing exclusively, while 62% used a combination of market-based AND cost-
based strategies. Tier 2 and 3 institutions also predominately used a combination of the two
approaches, but only 8% and 14% respectively, use just a cost-based approach [Graph 23]. The
limited use of a cost-based pricing strategy was reinforced when we asked the degree financial
institutions’ relied on cost information when pricing new business. Seventy percent of tier 1
institutions said they had slight to moderate reliance on costs data when making pricing
decisions while tier 2 and 3 institutions indicated that 50% have slight to moderate reliance on
cost data when making pricing decisions [Graph 24].
70%
50% 50%
0%
10%
20%
30%
40%
50%
60%
70%
Tier 1 Tier 2 Tier 3
Slight to Moderate Reliance on Cost Data when
making a Pricing Decision
Graph 24Graph 23
38%
0%
62%
25%
8%
67%
13%
14%
73%
0%
10%
20%
30%
40%
50%
60%
70%
80%
90%
100%
Tier 1 Tier 2 Tier 3
Market Pricing vs. Cost Pricing (or both)
Both
Cost
Market
Best Practice Costing – Treasury Management

page 149
Delivery Channel Migration Strategy
The measurement of the transaction costs and customer usage
of the various Delivery Channel alternatives supports an
informed and proactive customer migration strategy. A
strategy that could offer pricing or service incentives to
customers who use the less costly Delivery Channels. The
migration strategy could also provide disincentives for
customers using the costly channels, such as charging for
certain transactions done at the branch or transactions with
live telephone service representatives.
As mentioned previously, it is no longer the case where the
same transaction for the same product and the same customer
all cost the same.
Business Performance Management

page 150
One of the hottest topics in banking today is the paper-to-electronic migration of
payments. When asked what impact this will have on institutional profitability, most
respondents agreed the impact would be either positive or neutral [Graph 31].
Graph 31
Best Practice Costing – Treasury Management
33%
33%
33%
0%
30%
30%
30%
10%
41%
47%
12%0%
0%
10%
20%
30%
40%
50%
60%
70%
80%
90%
100%
Tier 1 Tier 2 Tier 3
Impact of Paper-to-Electronic Migration of
Payments on Profitability
Neg
Neg, then Pos
Nuetral
Pos

page 151
Paper to Electronic Migration Strategy
The migration era from paper to electronic transactions has arrived in
full force. Paper check volumes were predicted to peak in the early 1990s
but kept climbing until about 2002. Now we have debit and credit cards,
electronic bill payment, ACH, Point of Sale transactions, etc. to name a
few alternatives. All contributing to the fall of the paper check. The
implications for the entire payment system and the infrastructure to
process paper checks are huge.
It is critical to measure and understand capacity utilization and to
respond to changes. An example is now replacing traditional paper check
clearing with ACH. The cost is less, but so is the price to the customer. A
slow response would mean declining revenues without a corresponding
decrease in expenses. A good strategy for customers and pricing, but
without a coordinated effort enterprise-wide, it’s not a good strategy for
the costs and bottom line.
Business Performance Management

page 152
Strategic Business
Analyses and Pricing Example:
using
Capacity and Cost Information
Business Performance Management

page 153
Capacity Utilization - Staff
0%
20%
40%
60%
80%
100%
120%
1 2 3 4 5 6 7 8
Sites
Available Unused Capacity
Capacity Utilization
100% Capacity
Available Unused Capacity
Capacity Utilization
Total Capacity
22% 20% 24% 27% 12% 19% 14% 10%
78% 80% 76% 73% 88% 81% 86% 90%
100% 100% 100% 100% 100% 100% 100% 100%
Business Performance Management

page 154
This slide is designed to show that the largest sites from an expense standpoint don’t
necessarily mean the most costly. In this example, Site #3 expenses are more than three
times as much as Site #1 and four times as much as Site #7. When aligning the expenses with
the FTEs however, Site #3 is actually less costly from an hourly rate perspective. This
information would help with potential migration strategies, moving processing from high cost
sites to lower cost sites where feasible .
Hourly Rate Analysis by Site
Hourly Rate Analysis Sit
e 1
Sit
e 2
Sit
e 3
Sit
e 4
Sit
e 5
Sit
e 6
Sit
e 7
Sit
e 8
136,239$ 391,731$ 465,335$ 89,174$ 152,870$ 697,472$ 119,253$ 332,281$
13.02 36.00 50.00 8.00 15.50 60.44 10.50 34.00
60.42$ 62.83$ 53.73$ 64.36$ 56.94$ 66.63$ 65.57$ 56.43$
Business Performance Management
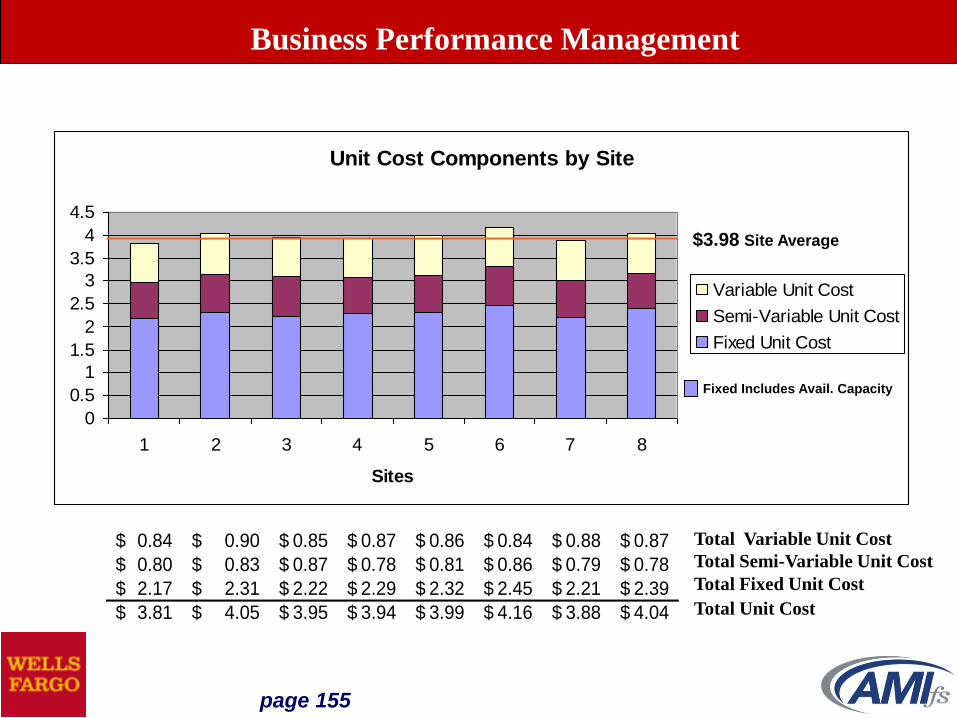
page 155
Unit Cost Components by Site
0
0.5
1
1.5
2
2.5
3
3.5
4
4.5
1 2 3 4 5 6 7 8
Sites
Variable Unit Cost
Semi-Variable Unit Cost
Fixed Unit Cost
$3.98 Site Average
Fixed Includes Avail. Capacity
Total Variable Unit Cost
Total Semi-Variable Unit Cost
Total Fixed Unit Cost
Total Unit Cost
0.84$ 0.90$ 0.85$ 0.87$ 0.86$ 0.84$ 0.88$ 0.87$
0.80$ 0.83$ 0.87$ 0.78$ 0.81$ 0.86$ 0.79$ 0.78$
2.17$ 2.31$ 2.22$ 2.29$ 2.32$ 2.45$ 2.21$ 2.39$
3.81$ 4.05$ 3.95$ 3.94$ 3.99$ 4.16$ 3.88$ 4.04$
Business Performance Management

page 156
This slide is designed to quantify the revenue and incremental margin impacts of forecasting
and committing to additional volumes by quarter through 2016. In this example, the new
volumes would be absorbed by available unused capacity identified in both staff and
equipment, therefore maximizing the incremental margin opportunity.
Criteria for the sales pipeline and tiered reality probabilities, which would include a new
volume commitment classification, need to be established
Business Performance Management
P&L Forecast Analysis
Ramp Up Strategy – Site 1
Q1 -
2008
Q2 -
2008
Q3 -
2008
Q4 -
2008
Q1 -
2009
Q2 -
2009
Q3 -
2009
Q4 -
2009
Total
20% Staff
Increase
Total Volumes 100,452 105,475 108,111 113,009 117,529 121,055 127,107 130,285
Cumulative Volume Increases 5,023 2,637 4,897 4,520 3,526 6,053 3,178
% Increase 5.0% 2.5% 4.5% 4.0% 3.0% 5.0% 2.5%
Available Unused Capacity - Staff 22.00% 18.10% 16.05% 12.25% 8.74% 21.67% 17.75% 15.70%
Incremental Margin Opportunity - Staff -$ 15,470$ 8,122$ 15,083$ 13,923$ 9,837$ 16,887$ 8,866$
Incremental Margin Opportunity - Staff (per Item) 3.08$ 3.08$ 3.08$ 3.08$ 2.79$ 2.79$ 2.79$
Available Unused Capacity - Equipment 44.00% 41.20% 39.73% 37.00% 34.48% 25.02% 21.27% 19.30%
Incremental Margin Opportunity - Equipment -$ -$ -$ -$ -$ -$ -$ -$
Incremental Margin Opportunity - Equipment (per Item)
Total Incremental Margin Opportunity -$ 15,470$ 8,122$ 15,083$ 13,923$ 9,837$ 16,887$ 8,866$ 88,187$
Q1 Q2 Q3 Q4 Q1 Q2 Q3 Q4

page 157
20% Staff
Reduction
Total Volumes 100,452 95,429 93,044 90,252 85,740 84,882 82,760 81,105
Incremental Values (5,023) (2,386) (2,791) (4,513) (857) (2,122) (1,655)
% Decrease -5.0% -2.5% -3.0% -5.0% -1.0% -2.5% -2.0%
Available Unused Capacity - Staff 22.00% 25.90% 27.75% 29.92% 33.42% 17.61% 19.67% 21.28%
Incremental Margin Opportunity - Staff (per Item) -$ -$ -$ -$ -$ -$ -$ -$
40% Equip.
Reduction
Available Unused Capacity - Equipment 44.00% 46.80% 48.13% 49.69% 52.20% 32.40% 34.09% 35.41%
Incremental Margin Opportunity - Equipment (per Item) -$ -$ -$ -$ -$ -$ -$ -$
Total Fixed Cost Per Unit 2.17$ 2.29$ 2.34$ 2.42$ 2.54$ 2.06$ 2.11$ 2.15$
Total Unit Cost - Fully Absorbed 3.81$ 3.93$ 3.98$ 4.06$ 4.18$ 3.70$ 3.75$ 3.79$
Total Net Income Opportunity 211,747$ 190,254$ 180,045$ 168,100$ 148,789$ 188,743$ 179,662$ 172,579$
Efficiency Ratio 64.39% 71.67% 75.73% 81.11% 91.64% 57.79% 60.71% 63.21%
This slide is designed to quantify the total impact of right sizing resources, and therefore expenses
and unit costs, by proactively managing for permanent declines in customer volumes. There is a
redeployment of unnecessary staff and a reduction in unused equipment. The vast majority of the
financial impact is reflected in the fixed cost per item and the total fully absorbed unit cost. The
take down success is reflected in the Net Income per item and the Efficiency Ratio
improvements over time
Business Performance Management
Q1 Q2 Q3 Q4 Q1 Q2 Q3 Q4
P&L Forecast Analysis
Take Down Strategy – Site 1

page 158
Phase 1 - Budgeting and Responsibility Center Reporting
Phase 2 - Expense Pooling and Allocations
Phase 3 – Organization/Line of Business Profitability
Phase 4 - Product and Customer Value Estimates
Phase 5 - CCM/Capacity-Based Costing
Phase 7 - Integration – Resource Mgmt. and Profitability Measurement
Business
Information
Value
Business Information Requirements
Financial Information
directly linked to
Business Events
and Customer
Interactions
Accounting
Integration
Performance Measurement Continuum
Phase 10 - Strategic Management
Phase 8 – Integrated and InformedPlanning and Forecasting
Phase 6 - Integration – Financial and Non-Financial Performance Metrics
Phase 9 – Strategic Business Analysis
Business Performance Management
page 159
M
Comprehensive Cost Management
CCInstitute – 2016
Business Performance Management

page 160
Appendix
Business Performance Management

page 161
Activity-Based Costing (ABC)
Also known as Capacity –Based Costing, activity-based costing quantifies (e.g., salaries, supplies, equipment, etc.) and links the
consumption of resources to the activities (e.g., process new account application) performed by financial institutions and then links those
activities to product cost drivers (e.g., fixed rate installment loan) and customers.
Study Group
A study group consists of one or more responsibility centers that perform similar functions, such as check processing, human resources,
controllers, etc. Each center with non-interest expenses is analyzed and mapped to a study group. The ABC Production Analyst is
responsible for developing an overview for each study group.
Study Period
A study period is an elapsed period of time during which an ABC study is performed including developing (or refreshing) unit times,
hourly rates, frequency of occurrence ratios, etc. The duration of a study period can vary based upon a number of factors such as the
quality of statistical data or the consistency of the unit times collected.
Resource Cost Driver (RCD)
A resource cost driver (RCD) is a unit that represents a logical grouping of activities performed within a processing center. An RCD may
represent a single activity or a combination of activities. All RCDs have a unique ID, a unique unit cost and can be counted in a
production application with a processing center ID attached.
Product Cost Driver (PCD)
A product cost driver is a unit that represents a logical grouping of RCDs to business events or product transactions. All PCDs have
unique identities and unit costs, and can be counted in product application systems. PCD volumes must be counted by responsibility
center of record (center that owns the account) and center of processing. For example, Branch A (center of processing) cashes a check
for a customer of Branch B (center of record). This is required to execute cost transfers in the profitability systems and to align costs to
accounts where their associated revenues are booked (e.g., open new account via call center).
Glossary of Terms
Business Performance Management

page 162
Cost Transfer
The Cost Transfer process creates cost information that is used for integrated profitability measurement and resource management. It
integrates unit cost information, distribution rules, source system statistical data and General Ledger financial information resulting in
costs that are aligned to products, customers and owning centers, and cost offsets aligned to processing centers. The most common cost
transfer technique is “Rate X Volume,” which is usage driven.
Frequency of Occurrence (FOC) Ratio
The frequency of occurrence ratio is developed during the ABC study period and equates to the number of activities for every 1 RCD
and/or the number of RCD’s for every 1 PCD. The unit cost and unit times that are developed during the study period are developed at the
activity level and only through this type of frequency analysis are RCD and PCD unit costs derived.
Equivalent Production Unit (EPU)
A time-weighted volume that is derived from a statistical volume (RCD) multiplied by an EPU factor to adjust for the unit time required to
process a single unit of volume. The purpose is to establish a common basis so that volumes can be aggregated and utilized to determine a
meaningful measure of throughput. As an example: 1 unit of RCD1 takes 30 seconds to process and 1 unit of RCD2 takes 15 seconds to
process. If RCD2 is used as the base unit it will be assigned an EPU factor of 1. Since RCD1 takes twice as long to process it will be
assigned an EPU factor of 2. If a processing center processes 100 units of RCD1 and 40 units of RCD2 in an hour their throughput equals
240 EPUs per hour. If RCD1 and RCD2 volumes were not converted to an EPU measure, they could not be aggregated in a meaningful
way to determine throughput per hour since their processing time per unit is different.
Glossary of Terms (continued)
Business Performance Management

page 163
Direct Product expenses are expenses incurred directly on behalf of a Product and are typically not related to specific customer transactions. When there is a material and direct relationship between expenses and a product ID such as Product Management expenses, these expenses should be reclassified as Direct Product Costs and added directly to the P & L as such. Other Direct Product treatments include:
Balance driven product expenses, such as FDIC Insurance Premiums, can be distributed based on applying the appropriate rate to product balances, and calculating the relevant distribution by product.
Direct Product expenses can also be service related expenditures. Examples include Fed ACH and Wire Transfer fees, Check Processing presentment fees, specific Outsourcing services, etc. The distribution can be calculated on per unit basis and distributed to product revenues by extending the unit costs by the actual product volumes. The unit rates could also be calculated based on product revenues.
Direct Product related expenses are reclassified as Direct Product Costs
Direct Product Costs (Details)
Business Performance Management

page 164
Sales and Marketing expenses are expenses incurred bringing in potential new customers or product revenues to the bank. Certain Sales and/or Marketing related expenses can be associated directly to a Product. An example might be a promotion campaign for Credit Cards. Certain other Sales and/or Marketing related expenses can be associated only with an Organizational Unit or Customer identity, such as Sales and Marketing type resources positioned and deployed specifically for that purpose. Sales and Marketing Expenses can be distributed employing one of two Management Accounting treatments as follows:
Product specific Sales and Marketing expenses that can be associated directly to a Product can be calculated on a per unit basis or as a markup on processing costs. The unit rates could also be calculated based on product revenues.
Sales and Marketing expenses that cannot be associated with a Product should be aligned at an Organizational Unit level in Product / Organization Profitability and at a Customer level in Customer Profitability, and presented as a non-product aligned cost component of the P & L.
S & M related expenses are reclassified as S & M costs.
Sales and Marketing Costs (Details)
Business Performance Management

page 165
Relationship Management (RM) expenses are expenses incurred in managing
existing customer relationships (vs. sales and marketing for new business). RM
expenses are not typically directly associated with revenues at a product level, but
rather at a customer or relationship level. The management accounting for the
RM expenses can be stratified, and based on a customer or relationship type
classification. A scale, such as 1 to 5 can be established with criteria to assign a
classification type based on relationship complexity and/or amount of time and
effort required. The RM expenses are pooled and distributed based on the total
number of customer relationships by classification. Relationship Management
expenses are then aligned at an Organizational Unit level in Product /
Organization Profitability and at a Customer level in Customer Profitability, and
presented as a non-product aligned cost component of the P & L.
Relationship Management Costs (Details)
Business Performance Management
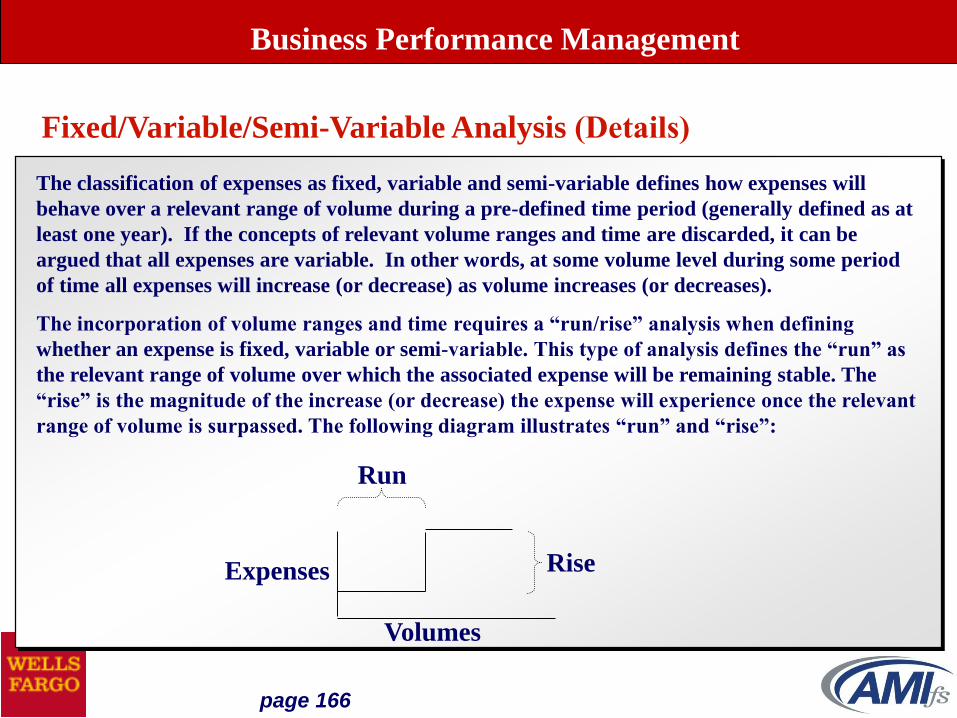
page 166
The classification of expenses as fixed, variable and semi-variable defines how expenses will
behave over a relevant range of volume during a pre-defined time period (generally defined as at
least one year). If the concepts of relevant volume ranges and time are discarded, it can be
argued that all expenses are variable. In other words, at some volume level during some period
of time all expenses will increase (or decrease) as volume increases (or decreases).
The incorporation of volume ranges and time requires a “run/rise” analysis when defining
whether an expense is fixed, variable or semi-variable. This type of analysis defines the “run” as
the relevant range of volume over which the associated expense will be remaining stable. The
“rise” is the magnitude of the increase (or decrease) the expense will experience once the relevant
range of volume is surpassed. The following diagram illustrates “run” and “rise”:
Fixed/Variable/Semi-Variable Analysis (Details)
Volumes
Expenses
Run
Rise
Business Performance Management

page 167
Fixed expenses remain stable over the largest relevant volume range, which means that it takes
a significant or very material volume increase or decrease before these expenses are impacted.
This yields the longest run and highest rise on the run/rise step curve. While fixed expenses
stay flat as volume is increased within the relevant volume tolerance range, fixed unit costs
actually go down within the same tolerance range. The opposite is true when volume decreases
within the relevant volume tolerance range defined for the fixed classification. To illustrate,
let’s say an expense stays flat at $100 per year during years 1 and 2. Volume, on the other hand,
increases from 10 items to 20 items. The resulting per item unit costs will drop from $10 ($100
/10) to $5 ($100/20) since the fixed expense is assigned to a larger number of items. Examples
of fixed expenses or resources include Occupancy or large equipment devices, such as Reader-
Sorters in Check Processing or CPUs in IT.
Volumes
Expenses
Yr 2Yr 1
Fixed Analysis (Details)
Business Performance Management

page 168
Semi-variable expenses fit logically into a relevant volume tolerance range between the fixed
classification and the variable classification. This yields a shorter run and rise on the run/rise
step curve than fixed expenses, but more than the linear nature of variable expenses. While
these expenses don’t vary with volume increases or decreases directly, they do change on a
smaller scale and within a smaller defined relevant volume tolerance range than fixed expenses.
A good example of semi-variable expenses is salaries and benefits for personnel, where increases
or decreases can be one or very few FTEs at a time within a tighter relevant volume tolerance
range than fixed.
Semi-Variable Analysis (Details)
Volumes
Expenses
Yr 2Yr 1
Business Performance Management

page 169
Variable expenses vary in direct relation to each unit of volume. Expenses move directly with
volume increases (or decreases) in a linear fashion and therefore have no volume tolerance
ranges. The linear nature yields a line to define the relationship between expenses and volume
rather than a run/rise step curve. When expressed as a unit cost, the variable cost component
remains constant, regardless of the relevant volume. Examples include postage, EPN fees for
ACH transactions, certain supplies and per-item presentment fees to the Fed or Correspondent
Banks for check clearing.
Variable Analysis (Details)
Volumes
Expenses
Yr 2Yr 1
Business Performance Management