comprehensive annual financial report … annual financial report of the city of birmingham, alabama...
TRANSCRIPT
COMPREHENSIVE ANNUAL FINANCIAL REPORT
OF THE
CITY OF BIRMINGHAM, ALABAMA
FOR THE FISCAL YEAR ENDED
JUNE 30, 2006
OFFICE OF THE DIRECTOR OF FINANCE Michael Johnson, CPA
Director
City of Birmingham, AlabamaComprehensive Annual Financial ReportFor the Fiscal Year Ended June 30, 2006
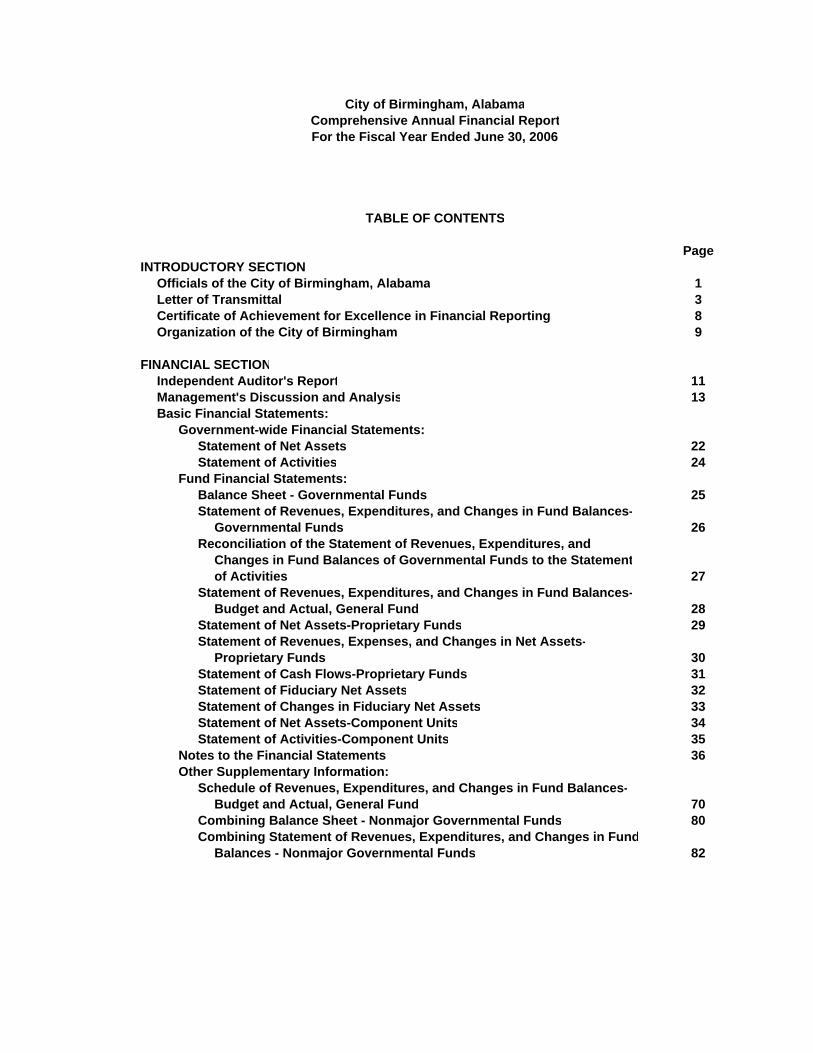
TABLE OF CONTENTS
PageINTRODUCTORY SECTION
Officials of the City of Birmingham, Alabama 1Letter of Transmittal 3Certificate of Achievement for Excellence in Financial Reporting 8Organization of the City of Birmingham 9
FINANCIAL SECTIONIndependent Auditor's Report 11Management's Discussion and Analysis 13Basic Financial Statements:
Government-wide Financial Statements:Statement of Net Assets 22Statement of Activities 24
Fund Financial Statements:Balance Sheet - Governmental Funds 25Statement of Revenues, Expenditures, and Changes in Fund Balances-
Governmental Funds 26Reconciliation of the Statement of Revenues, Expenditures, and
Changes in Fund Balances of Governmental Funds to the Statementof Activities 27
Statement of Revenues, Expenditures, and Changes in Fund Balances-Budget and Actual, General Fund 28
Statement of Net Assets-Proprietary Funds 29Statement of Revenues, Expenses, and Changes in Net Assets-
Proprietary Funds 30Statement of Cash Flows-Proprietary Funds 31Statement of Fiduciary Net Assets 32Statement of Changes in Fiduciary Net Assets 33Statement of Net Assets-Component Units 34Statement of Activities-Component Units 35
Notes to the Financial Statements 36Other Supplementary Information:
Schedule of Revenues, Expenditures, and Changes in Fund Balances-Budget and Actual, General Fund 70
Combining Balance Sheet - Nonmajor Governmental Funds 80Combining Statement of Revenues, Expenditures, and Changes in Fund
Balances - Nonmajor Governmental Funds 82
City of Birmingham, AlabamaComprehensive Annual Financial ReportFor the Fiscal Year Ended June 30, 2006
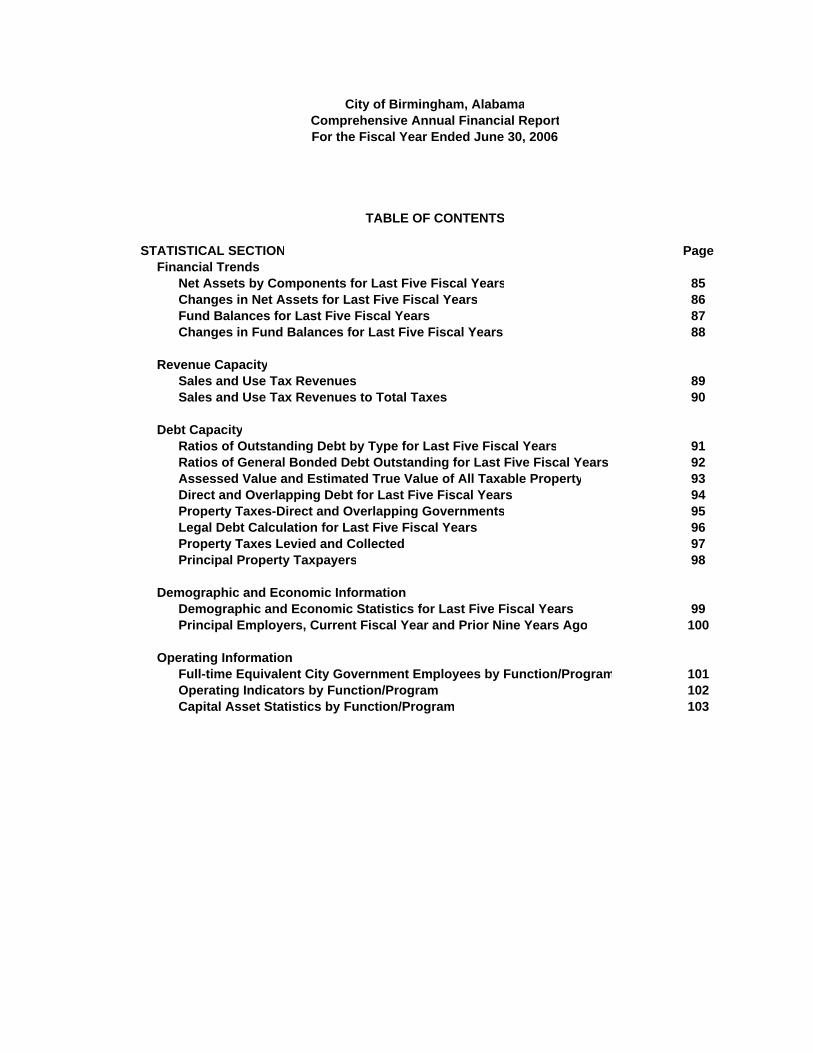
TABLE OF CONTENTS
STATISTICAL SECTION PageFinancial Trends
Net Assets by Components for Last Five Fiscal Years 85Changes in Net Assets for Last Five Fiscal Years 86Fund Balances for Last Five Fiscal Years 87Changes in Fund Balances for Last Five Fiscal Years 88
Revenue CapacitySales and Use Tax Revenues 89Sales and Use Tax Revenues to Total Taxes 90
Debt CapacityRatios of Outstanding Debt by Type for Last Five Fiscal Years 91Ratios of General Bonded Debt Outstanding for Last Five Fiscal Years 92Assessed Value and Estimated True Value of All Taxable Property 93Direct and Overlapping Debt for Last Five Fiscal Years 94Property Taxes-Direct and Overlapping Governments 95Legal Debt Calculation for Last Five Fiscal Years 96Property Taxes Levied and Collected 97Principal Property Taxpayers 98
Demographic and Economic InformationDemographic and Economic Statistics for Last Five Fiscal Years 99Principal Employers, Current Fiscal Year and Prior Nine Years Ago 100
Operating InformationFull-time Equivalent City Government Employees by Function/Program 101Operating Indicators by Function/Program 102Capital Asset Statistics by Function/Program 103
INTRODUCTORY SECTION
• List of City Officials
• Finance Director’s Letter of Transmittal • Certificate of Achievement- Government Finance Officers Association
• City of Birmingham Organization Chart

OFFICIALS OF THE CITY OF BIRMINGHAM JUNE 30, 2006
MAYOR Bernard Kincaid, J.D., Ph.D
CITY COUNCIL
Carole Smitherman, President District 6
Joel Montgomery District 1 William A. Bell, Sr. District 5Carol Reynolds District 2 Miriam Witherspoon District 7Valerie A. Abbott District 3 Steven W. Hoyt District 8Maxine H. Parker District 4 Roderick V. Royal District 9
DEPARTMENT HEADS
Arlington Daniel Brooks, DirectorAuditorium Kevin Arrington, DirectorCity Clerk Paula Smith, City ClerkCity Council Cheryl Kidd, AdministratorCommunity Development James Fenstermaker, DirectorEquipment Management George R. Rainey, DirectorFinance Michael Johnson, DirectorFire Dwayne Murray, ChiefLaw Tamara Harris Johnson, City AttorneyLibrary Barbara Sirmans, DirectorMunicipal Court Raymond Chambliss, Presiding JudgeMuseum of Art Gail Trechsel, DirectorOffice of Information Management Systems John Wade, DirectorParole Stanley Hamby, DirectorPark and Recreation Melvin Miller, DirectorPersonnel Ann Thompson, DirectorPlanning, Engineering, and Permits William Gilchrist, DirectorPolice Annetta Nunn, ChiefPublic Safety Stephen Fancher, DirectorSloss Furnaces Robert Rathburn, DirectorSouthern Museum of Flight Jim Griffin, DirectorTraffic Engineering John A. Garrett, Engineer
1

This page is intentionally blank.
3
December 16, 2006 To the Honorable Bernard Kincaid, Mayor, City Council Members, Citizens of the City of Birmingham
The Comprehensive Annual Financial Report for the City of Birmingham’s fiscal year ended June 30, 2006, is hereby submitted. This report is the official comprehensive publication of the City’s financial position at June 30, 2006. The City is responsible for both the accuracy of the data and the completeness and fairness of the presentation including all disclosures. To the best of our knowledge and belief, the enclosed report is accurate in all material respects and all statements; and disclosures necessary for the reader to obtain a thorough understanding of the City’s financial activities have been included.
THE REPORT
The report is presented in three sections: introductory, financial, and statistical. The introductory section includes this transmittal letter, a list of the City’s principal officials, an organizational chart, and the Governmental Finance Officer’s Certificate of Achievement.
The financial section is prepared in accordance with generally accepted accounting principles (GAAP) established by the Governmental Accounting Standards Board. This section of the CAFR contains the Management’s Discussion & Analysis (MD&A), which is located immediately after the independent auditors’ report, the basic financial statements, the combining and individual fund statements and schedules, as well as the independent auditors’ report and any required supplementary information.
The MD&A provides an overview and analysis of the City’s financial performance. This letter of transmittal is designed to supplement the MD&A and should be read in conjunction with it. The basic financial statements include the City’s government-wide financial statements that present an overview of the City’s

4
entire operations; the fund level statements present the financial information of each of the City’s major funds, as well as the nonmajor funds. The statistical section contains selected financial and demographic statistics, generally on a multi-year basis.
CITY PROFILE
The City of Birmingham was incorporated in 1871 and is centrally located in the State of Alabama at the foothills of the Appalachian Mountains. The City is approximately 151 square miles in area with an estimated population of 242,820.
The City operates under a mayor-council form of government. There are nine council members representing the separate districts of the City. The Mayor and Council are elected at large and serve four-year terms.
The City of Birmingham provides a wide range of services to its citizens including the following: • Police and fire protection • Sanitation services • Construction and maintenance of highways, streets, and infrastructure • Recreational activities • Cultural events • Libraries and museums
REPORTING ENTITY
This report includes all funds of the City of Birmingham. Also included are the funds of two separate legal entities, the Birmingham Airport Authority and the Birmingham Parking Authority. They are included because the City is financially accountable for their activities.
ECONOMIC CONDITIONS AND OUTLOOK
The City of Birmingham has a diverse economy which has shown signs of increased economic activity and vitality evidenced by an increase in sales and use taxes for a second consecutive year. Unemployment levels have improved over the last year and are below the national median. The results of operations in fiscal year 2006 showed an increase in sales, use, and occupational taxes of $4,765,000. The first five months of fiscal year 2007 indicate a continuing rise in the collection of business taxes. The City of Birmingham continues to serve as the financial and service center for the metropolitan area with a strong institutional presence anchored by the University of Alabama Medical Center and various federal, state, and local government employers.
In fiscal year 2006, the City of Birmingham entered into an agreement with Wal-Mart to revitalize the Eastwood Mall area of Birmingham. Wal-Mart officials

5
agreed to build a Wal-Mart Supercenter in the Eastwood Mall location. The old structure has been demolished and construction has begun in earnest to recreate a thriving shopping area for the citizens of the Crestwood and surrounding neighborhoods. With Wal-Mart as the anchor, there will be other retailers located in the same area such as a major electronics store, a major office supply store, and restaurants.
In 2005, the Birmingham City Council approved the newly-created Ensley Automotive District Urban Renewal and Redevelopment Plan to encourage automotive dealers to locate in the western area of the city. In December 2006, the first new dealership had their groundbreaking ceremony. Serra Honda will be located in the District which is located in the historical Tuxedo Junction section of Ensley; the project is estimated to cost over $3 million and is expected to generate over $400,000 annually in new sales tax revenue to the City.
The Mayor and City Council of the City of Birmingham continue to seek out opportunities to attract new businesses and retain current businesses in the City. Redevelopment agreements are becoming more commonplace to accomplish this goal; and the citizens should reap the rewards with improved infrastructure, better living conditions, and more opportunities for employment.
FUTURE INITIATIVES
The future outlook for the City of Birmingham is staple with many capital
improvement projects anticipated. The City is proud of its commitment to the Birmingham Public School system and its capital project initiatives. Of the proceeds received from the Water Works Board, $126 million was dedicated to the school system. At the end of fiscal year 2006, over $92 million had been spent in building new state-of-the-art school facilities and renovating existing facilities.
The leaders of the City are committed to using resources in the most efficient
and effective ways and have embraced the use to technology to help accomplish this objective. To that end, they have begun to implement a new performance measurement system to ensure citizens’ needs are met timely and that departments are meeting established goals. Also, they have approved the acquisition and implementation of a new human resources/payroll computer system as well as a new financial reporting system. The overall goal is to provide timely and accurate operational data and financial information for decision making.
The City’s capital improvement program for the next few years proposes a
continuance of improving the City’s existing infrastructure and facilities as well as

6
the construction of new projects as needed. For fiscal year 2007, the
following expenditures are projected for specific categories: Storm Sewers $6.9 million Street Improvements $7.8 million Sanitary Sewers $4.6 million Schools $9.2 million Libraries $2.7 million Park Improvements $5.9 million
OTHER FINANCIAL INFORMATION
The City’s management is responsible for the establishment and
maintenance of accounting and other internal controls to ensure compliance with applicable laws and City policies, that assets are safeguarded, and that financial transactions are properly recorded and documented to provide reliable information for the preparation of the City’s financial statements in accordance with GAAP. Because the cost of internal controls should not outweigh their benefits, the City’s comprehensive framework of internal controls has been designed to provide reasonable rather than absolute assurance that the financial statements will be free from material misstatement.
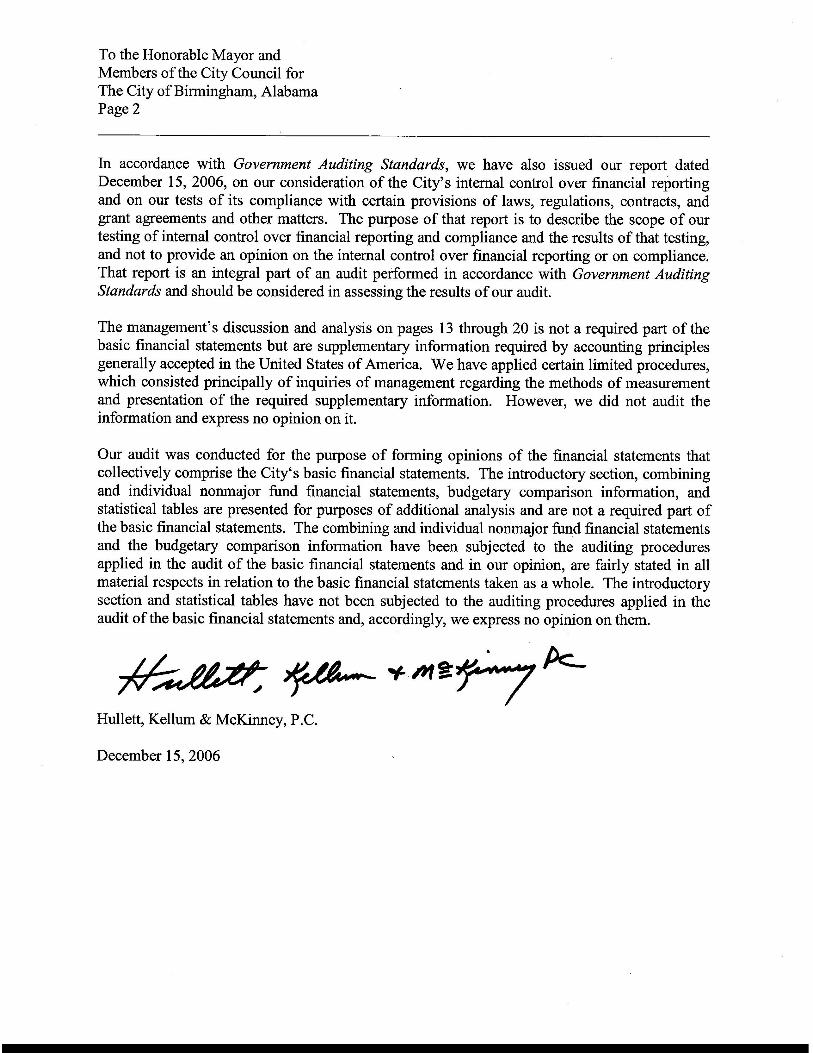
Section 3.18 of the Mayor-Council Act requires an independent audit of the
financial records by a certified public accounting firm. The City’s financial statements for June 30, 2006, have been audited by Hullett, Kellum & McKinney, P.C., Certified Public Accountants. The independent auditor concluded, based upon the audit, that there was a reasonable basis for rendering an unqualified opinion that the City of Birmingham’s financial statements for the fiscal year ended June 30, 2006, are fairly presented in conformity with GAAP. The independent auditor’s report is presented as the first component of the financial section of this report.
The independent audit of the financial statements of the City was part of a
broader federal and state mandated “Single Audit” designed to meet the special needs of federal and state grantor agencies. The standards governing Single Audit engagements require the independent auditor to report not only on the fair presentation of the financial statements, but also on the audited government’s internal controls and compliance with legal requirements, with special emphasis on the administration of federal and state awards. The Single Audit is available upon request.
Included in this report is a narrative, Management’s Discussion and Analysis
(MD&A), that provides an overview and analysis of the City’s financial performance. This letter of transmittal is designed to supplement the MD&A and
7
should be read in conjunction with it. The City’s MD&A is located immediately following the auditor’s report.
ACHIEVEMENTS
The Government Finance Officer’s Association of the United States and
Canada (GFOA) awarded a Certificate of Achievement for Excellence in Financial Reporting to the City of Birmingham for its Comprehensive Financial Audit Report (CAFR) for the fiscal year ended June 30, 2005.
The Certificate of Achievement is a prestigious national award presented to
state and local governments for publishing an easily readable and efficiently organized CAFR whose contents conform to program standards and complies with generally accepted accounting principles and applicable legal requirements. The Certificate is valid for a period of one year.
The City of Birmingham has received the Certificate for the last 29
consecutive years. We believe our current CAFR continues to conform to Certificate of Achievement program requirements, and we are submitting it to GFOA for consideration.
Additionally, the City’s budget report for fiscal year beginning July 1, 2005,
was awarded the Government Finance Officer’s Association Award for Distinguished Budget Presentation. In order to receive this award, a governmental unit must publish a document that meets program criteria as a policy document, as an operations guide, as a financial plan, and as a communications device. The City believes its current budget report also meets the above criteria, and we have submitted it to the GFOA for consideration.
ACKNOWLEDGMENT
Preparation of this report could not have been accomplished without the
professional, efficient, and dedicated services of the staff of the Finance Department. I would also like to thank the Mayor, Council, and other department heads for their cooperation in the development of this financial report.
Respectfully submitted, Michael Johnson, CPA Director of Finance


FINANCIAL SECTION
• Independent Auditor’s Report • Management’s Discussion and Analysis • Basic Financial Statements • Notes to the Financial Statements • Required Supplementary Information


13
MANAGEMENT’S DISCUSSION AND ANALYSIS
As management of the City of Birmingham, Alabama (City), we invite our readers to review this overview and analysis of the financial activities of the City for the fiscal year ended June 30, 2006 (fiscal year 2006). Its purpose is to provide an introduction and overview readers should use to interpret and analyze the City’s basic financial statements and financial activities based upon currently known facts, decisions and conditions. We encourage readers to consider the information presented here in conjunction with additional information that we have furnished in our letter of transmittal at the front of this report and the City's financial statements, which follow this section. FINANCIAL HIGHLIGHTS
• The City’s net assets were
$283,283,000 for governmental activities and $934,000 for business-type activities at June 30, 2006. This reflects a decrease in governmental activities’ net assets of $69,516,000, or 26.3% from fiscal year 2005.
• During fiscal year 2006, the City
received $363,371,000 in taxes and other revenues, which represents an increase of $3,995,000 from fiscal year 2005. Increases in sales and use tax, occupational taxes, and property taxes accounted for the majority of the increase.
• Total expenditures for the year were
$432,887,000, which represent an increase of $45,852,000 (12%) from fiscal year 2005. The increase in expenditures was a result of higher fuel and utility costs as well as an increase in personnel costs due mainly to a 2% cost-of-living salary increase for City employees.
• General fund operating revenues exceeded operating expenditures by $3,795,000 for the fiscal year. Increases in sales and use tax, occupational taxes, and property taxes accounted for the majority of the increase.
• The City has one business-type activity, the Emergency Management Communications District (E911). Revenues are generated through charges assessed for E911 services. Total revenues received were $3,037,000 and expenditures were $3,157,000, resulting in a net loss of $120,000 for fiscal year 2006.
OVERVIEW OF THE FINANCIAL STATEMENTS The government-wide financial statements are designed to provide readers with a broad overview of the City’s finances, similar to that presented by private sector businesses. The City’s basic financial statements are comprised of the following: Government-wide Financial Statements Government-wide financial statements provide the reader with both long-term and short-term information about the City’s financial condition. Changes in the City’s financial position may be measured over time by increases or decreases in net assets as shown on the Statement of Net Assets. The Statement of Activities shows how the City’s net assets changed during the fiscal year. Both of the government-wide financial statements distinguish functions of the City that are principally supported by taxes and intergovernmental revenues (governmental activities) from other functions that are intended to recover all or a significant portion of their costs through user fees and charges (business-type activities). The governmental activities of the City include general government, public safety, highways and streets, sanitation, economic development, and culture and recreation. The business-type activity of the City is the Emergency Management Communications District (E911). Fund Financial Statements Fund financial statements report the City’s operations in more detail than what is presented in the government-wide financial statements. Fund financial statements include the statements for governmental, proprietary, and fiduciary funds.
14
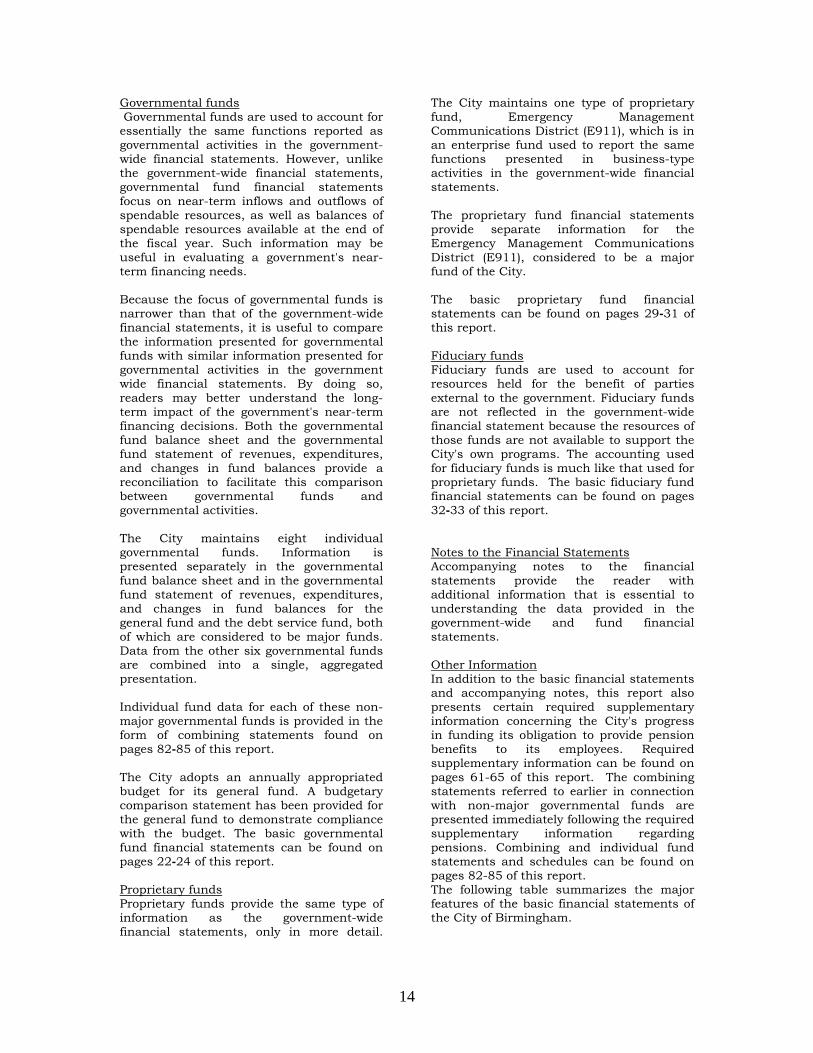
Governmental funds Governmental funds are used to account for essentially the same functions reported as governmental activities in the government-wide financial statements. However, unlike the government-wide financial statements, governmental fund financial statements focus on near-term inflows and outflows of spendable resources, as well as balances of spendable resources available at the end of the fiscal year. Such information may be useful in evaluating a government's near-term financing needs. Because the focus of governmental funds is narrower than that of the government-wide financial statements, it is useful to compare the information presented for governmental funds with similar information presented for governmental activities in the government wide financial statements. By doing so, readers may better understand the long-term impact of the government's near-term financing decisions. Both the governmental fund balance sheet and the governmental fund statement of revenues, expenditures, and changes in fund balances provide a reconciliation to facilitate this comparison between governmental funds and governmental activities. The City maintains eight individual governmental funds. Information is presented separately in the governmental fund balance sheet and in the governmental fund statement of revenues, expenditures, and changes in fund balances for the general fund and the debt service fund, both of which are considered to be major funds. Data from the other six governmental funds are combined into a single, aggregated presentation. Individual fund data for each of these non-major governmental funds is provided in the form of combining statements found on pages 82-85 of this report. The City adopts an annually appropriated budget for its general fund. A budgetary comparison statement has been provided for the general fund to demonstrate compliance with the budget. The basic governmental fund financial statements can be found on pages 22-24 of this report. Proprietary funds Proprietary funds provide the same type of information as the government-wide financial statements, only in more detail.
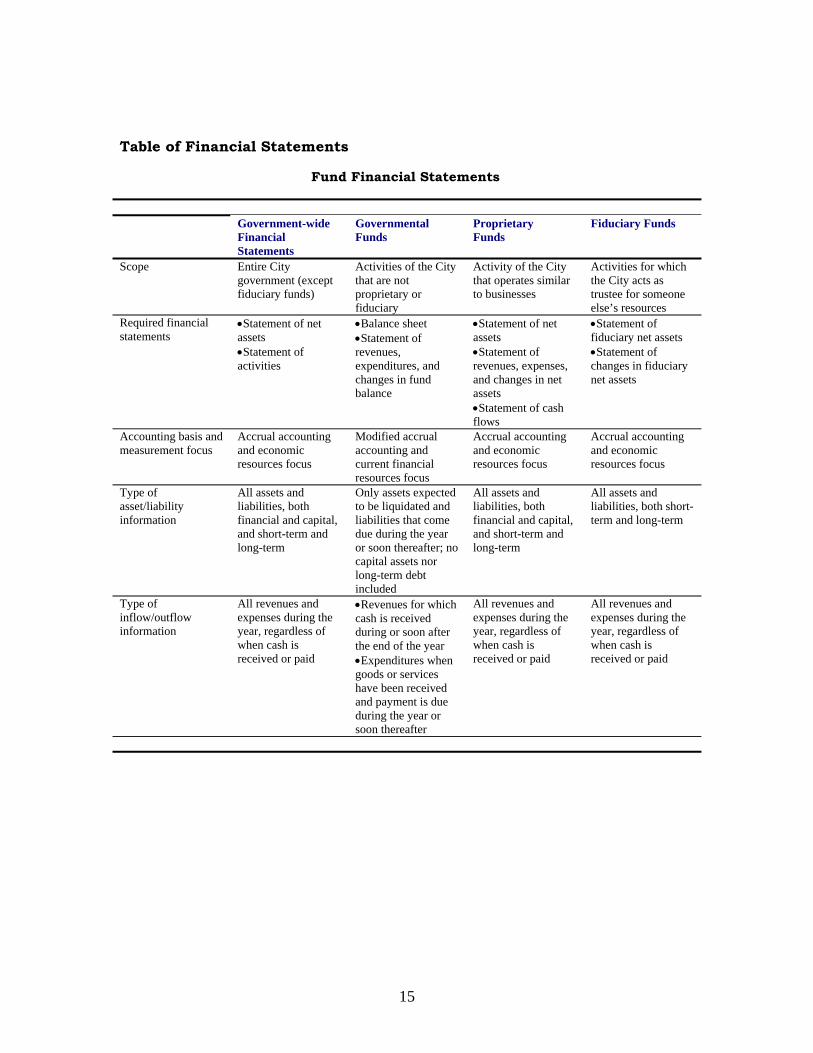
The City maintains one type of proprietary fund, Emergency Management Communications District (E911), which is in an enterprise fund used to report the same functions presented in business-type activities in the government-wide financial statements. The proprietary fund financial statements provide separate information for the Emergency Management Communications District (E911), considered to be a major fund of the City. The basic proprietary fund financial statements can be found on pages 29-31 of this report. Fiduciary funds Fiduciary funds are used to account for resources held for the benefit of parties external to the government. Fiduciary funds are not reflected in the government-wide financial statement because the resources of those funds are not available to support the City's own programs. The accounting used for fiduciary funds is much like that used for proprietary funds. The basic fiduciary fund financial statements can be found on pages 32-33 of this report. Notes to the Financial Statements Accompanying notes to the financial statements provide the reader with additional information that is essential to understanding the data provided in the government-wide and fund financial statements. Other Information In addition to the basic financial statements and accompanying notes, this report also presents certain required supplementary information concerning the City's progress in funding its obligation to provide pension benefits to its employees. Required supplementary information can be found on pages 61-65 of this report. The combining statements referred to earlier in connection with non-major governmental funds are presented immediately following the required supplementary information regarding pensions. Combining and individual fund statements and schedules can be found on pages 82-85 of this report. The following table summarizes the major features of the basic financial statements of the City of Birmingham.
15
Table of Financial Statements
Fund Financial Statements
Government-wide
Financial Statements
Governmental Funds
Proprietary Funds
Fiduciary Funds
Scope Entire City government (except fiduciary funds)
Activities of the City that are not proprietary or fiduciary
Activity of the City that operates similar to businesses
Activities for which the City acts as trustee for someone else’s resources
Required financial statements
•Statement of net assets •Statement of activities
•Balance sheet •Statement of revenues, expenditures, and changes in fund balance
•Statement of net assets •Statement of revenues, expenses, and changes in net assets •Statement of cash flows
•Statement of fiduciary net assets •Statement of changes in fiduciary net assets
Accounting basis and measurement focus
Accrual accounting and economic resources focus
Modified accrual accounting and current financial resources focus
Accrual accounting and economic resources focus
Accrual accounting and economic resources focus
Type of asset/liability information
All assets and liabilities, both financial and capital, and short-term and long-term
Only assets expected to be liquidated and liabilities that come due during the year or soon thereafter; no capital assets nor long-term debt included
All assets and liabilities, both financial and capital, and short-term and long-term
All assets and liabilities, both short-term and long-term
Type of inflow/outflow information
All revenues and expenses during the year, regardless of when cash is received or paid
•Revenues for which cash is received during or soon after the end of the year •Expenditures when goods or services have been received and payment is due during the year or soon thereafter
All revenues and expenses during the year, regardless of when cash is received or paid
All revenues and expenses during the year, regardless of when cash is received or paid
16
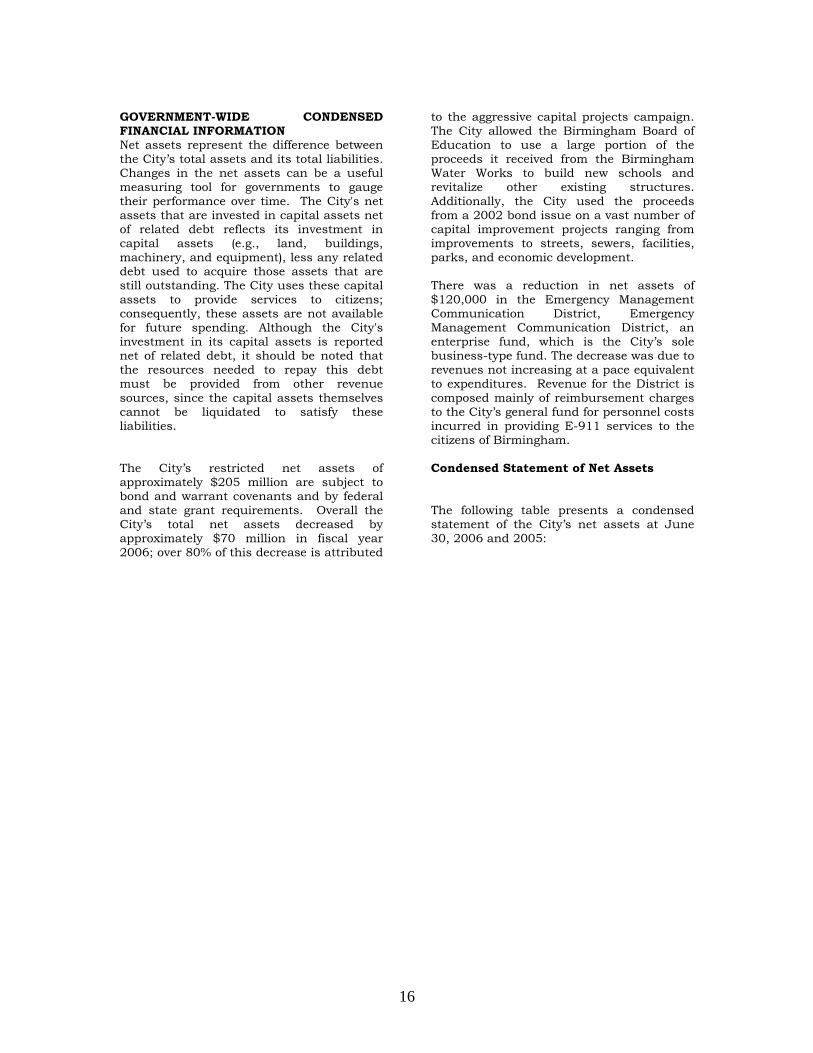
GOVERNMENT-WIDE CONDENSED FINANCIAL INFORMATION Net assets represent the difference between the City’s total assets and its total liabilities. Changes in the net assets can be a useful measuring tool for governments to gauge their performance over time. The City's net assets that are invested in capital assets net of related debt reflects its investment in capital assets (e.g., land, buildings, machinery, and equipment), less any related debt used to acquire those assets that are still outstanding. The City uses these capital assets to provide services to citizens; consequently, these assets are not available for future spending. Although the City's investment in its capital assets is reported net of related debt, it should be noted that the resources needed to repay this debt must be provided from other revenue sources, since the capital assets themselves cannot be liquidated to satisfy these liabilities. The City’s restricted net assets of approximately $205 million are subject to bond and warrant covenants and by federal and state grant requirements. Overall the City’s total net assets decreased by approximately $70 million in fiscal year 2006; over 80% of this decrease is attributed
to the aggressive capital projects campaign. The City allowed the Birmingham Board of Education to use a large portion of the proceeds it received from the Birmingham Water Works to build new schools and revitalize other existing structures. Additionally, the City used the proceeds from a 2002 bond issue on a vast number of capital improvement projects ranging from improvements to streets, sewers, facilities, parks, and economic development. There was a reduction in net assets of $120,000 in the Emergency Management Communication District, Emergency Management Communication District, an enterprise fund, which is the City’s sole business-type fund. The decrease was due to revenues not increasing at a pace equivalent to expenditures. Revenue for the District is composed mainly of reimbursement charges to the City’s general fund for personnel costs incurred in providing E-911 services to the citizens of Birmingham. Condensed Statement of Net Assets The following table presents a condensed statement of the City’s net assets at June 30, 2006 and 2005:

17
Table 2
CONDENSED STATEMENT OF NET ASSETS
June 30, 2006 and 2005
(in thousands)
Governmental Business-Type Totals
Activities Activities
06/30/06 06/30/05 06/30/06 06/30/05 06/30/06 06/30/05
Current and other assets $501,557 601,837 (7) 335 501,550 602,172
Capital assets, net 378,522 340,976 942 764 379,464 341,740
Total assets 880,079 942,813 935 1,099 881,014 943,912
Current and other
liabilities 63,637 68,993 1 45 63,638 69,038
Long-term liabilities 533,159 551,231 0 0 533,159 551,231
Total liabilities 596,796 646,134 1 45 596,797 624,269
Net assets:
Invested in capital assets,
net of related debt 53,708 (18,295) 942 764 54,65 (17,531)
Restricted 205,388 361,917 205,388 361,917
Unrestricted 24,187 25,033 (8) 290 24,179 (24,743)
Net assets $283,283 318,589 934 1,054 284,217 319,643
18
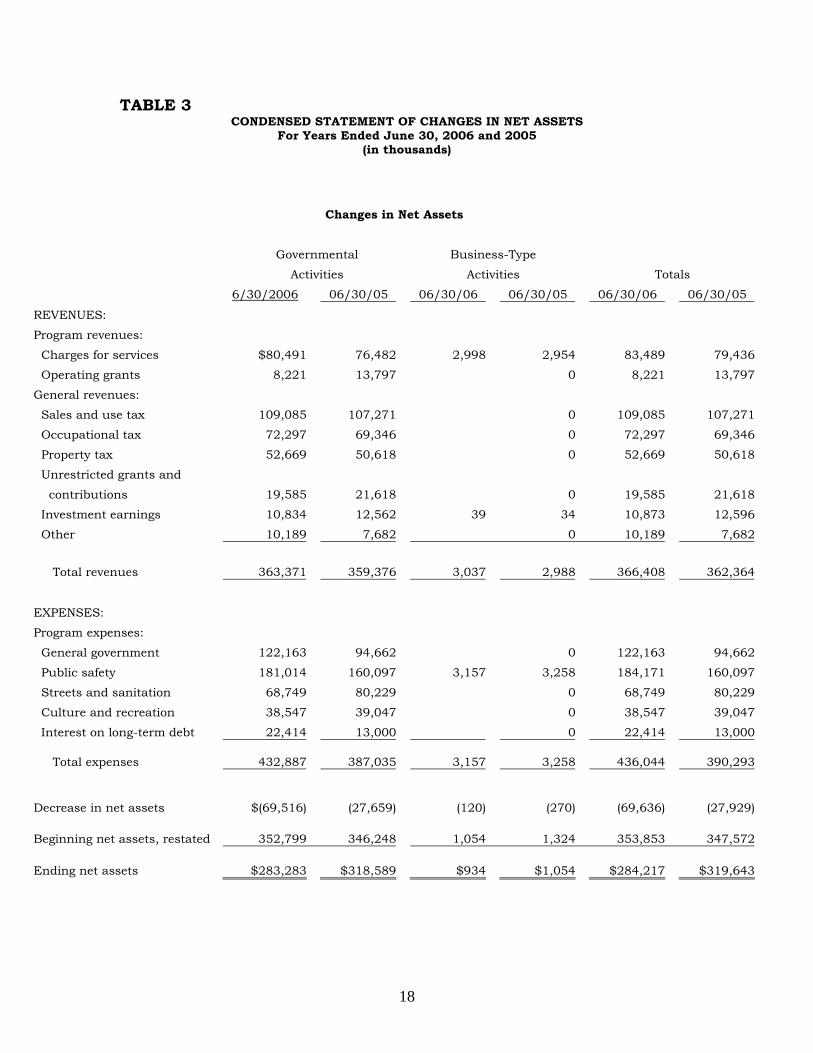
TABLE 3 CONDENSED STATEMENT OF CHANGES IN NET ASSETS
For Years Ended June 30, 2006 and 2005 (in thousands)
Changes in Net Assets
Governmental Business-Type
Activities Activities Totals
6/30/2006 06/30/05 06/30/06 06/30/05 06/30/06 06/30/05
REVENUES:
Program revenues:
Charges for services $80,491 76,482 2,998 2,954 83,489 79,436
Operating grants 8,221 13,797 0 8,221 13,797
General revenues:
Sales and use tax 109,085 107,271 0 109,085 107,271
Occupational tax 72,297 69,346 0 72,297 69,346
Property tax 52,669 50,618 0 52,669 50,618
Unrestricted grants and
contributions 19,585 21,618 0 19,585 21,618
Investment earnings 10,834 12,562 39 34 10,873 12,596
Other 10,189 7,682 0 10,189 7,682
Total revenues 363,371 359,376 3,037 2,988 366,408 362,364
EXPENSES:
Program expenses:
General government 122,163 94,662 0 122,163 94,662
Public safety 181,014 160,097 3,157 3,258 184,171 160,097
Streets and sanitation 68,749 80,229 0 68,749 80,229
Culture and recreation 38,547 39,047 0 38,547 39,047
Interest on long-term debt 22,414 13,000 0 22,414 13,000
Total expenses 432,887 387,035 3,157 3,258 436,044 390,293
Decrease in net assets $(69,516) (27,659) (120) (270) (69,636) (27,929)
Beginning net assets, restated 352,799 346,248 1,054 1,324 353,853 347,572
Ending net assets $283,283 $318,589 $934 $1,054 $284,217 $319,643

19
As shown in this table, the City’s revenues from its governmental activities increased by 1% from the prior fiscal year. The increase was the result of increases in sales and use taxes, occupational taxes, and property taxes. Expenses increased by 12% from the previous fiscal year as a result of higher fuel and utility costs as well as an increase in
personnel costs due mainly to a 2% cost-of-living salary increase for City employees. The business-type activity of the City had a $120,000 decline in net assets. Revenue received from charges for services increased by $44,000 from prior fiscal year.
FUND ANALYSIS
Changes in fund balance for the major governmental funds for the fiscal year ended June 30, 2006 are as follows: Table 4
Governmental Funds The focus of the City's governmental funds is to provide information regarding near-term inflows, outflows, and balances of spendable resources. Such information is useful in assessing the City's financing requirements. In particular, unreserved fund balance may serve as a useful measure of a government's net resources available for spending at the end of the fiscal year. The Fund balance of the General Fund increased due to an increase in sales and other taxes. Other factors contributing to the reduction in fund balance include:
• A decrease in Debt Service Fund balance as a result of increased debt
service payments. The increase in payments is due to the issuance of an additional $70,500,000 in Bonds in Fiscal Year 2002, which are serviced by the Debt Service Reserve Fund.
• An increase in Special Revenue
Fund balance as a result of the City receiving additional grant funds.
The Capital Projects fund balance decreased by $23,184,000 due to an increase in capital projects undertaken by the City. The Statement of Revenues, Expenditures, and Changes in Fund Balances for Nonmajor Governmental Funds details the changes.
Beginning EndingFund Increases Fund
Balance (Decrease) Balance
General Fund $74,178 3,795$ $77,973Birmingham Fund 80,710 (1,147) 79,563Birmingham Water Work Proceeds 116,071 (54,153) 61,918General Bond Debt Reserve 51,085 (6,043) 45,042General Bond Debt Service 123 (4) 119
Total $322,167 ($51,171) $264,615
20
Budget Variances in the General Fund During the fiscal year, revisions were made to the original budget adopted by the City due to changes in the projected revenues. Revenues exceeded the budgeted amounts in several categories. In additional revisions were made in the projected expenditures including additional appropriations. CAPITAL ASSETS AND LONG-TERM DEBT ACTIVITY Capital Asset Activity At June 30, 2006 the City of Birmingham reported $378,522,000 in net capital assets, including its infrastructure, for governmental activities. The business-type activity reported $942,000 in net capital assets. The notes to the financial statements on pages 48 & 49 report more information on capital assets including the changes that occurred during the fiscal year. Long-term Debt Activity At June 30, 2006, the City of Birmingham had $519,190,000 total debt outstanding for its bonds and warrants payable; of this, $493,370,000 is considered long-term. The notes to the financial statements on pages 52-54 include additional details for the City’s long-term debt activity. On November 14, 2005, the City issued its general obligation refunding bonds in the amount of $28,230,000. The proceeds were used to refund a portion of the outstanding 1997-B refunding issue and a portion of the outstanding 1999-B refunding issue. The City’s bond ratings are AA, Aa3 by Standard & Poor’s Rating Service & Moody Investors Service, respectively. The rating agencies cite the City’s broad and diverse economy, including strong service, financial, and trade sectors as factors contributing to the strong rating. Noted also is the City’s current policy of maintaining reserve balances equal to 15% of expenditures; currently, reserves equal approximately 26% of expenditures. The notes to the financial statements contain more detailed information regarding the City’s long-term debt and the changes that occurred. Please refer to them for additional information including the City’s obligations for capitalized equipment leases, workmen’s compensation claims, closure and post closure costs, and compensated
absences. The City does not have any debt for its business-type activities. ECONOMIC FACTORS AFFECTING THE CITY OF BIRMINGHAM AND THE 2007 BUDGET INFORMATION As common in other municipalities across the country, the City of Birmingham MITIGATING RISKS OF FRAUD The City of Birmingham is committed to maintaining a culture of honesty and integrity to ensure the safeguarding of its assets and proper presentation of its financial statements. To that end, the City will continue to employ and train competent personnel and evaluate the risks of fraud and implement processes, procedures and controls to mitigate risks and opportunities for fraud. REQUEST FOR INFORMATION This financial report is designed to give a general overview of the City’s finances. Questions concerning any of the information in this report may be sent to the Director of Finance, City of Birmingham, 710 North 20th Street, Suite A-100, Birmingham, AL, 35203.

Basic Financial Statements
21
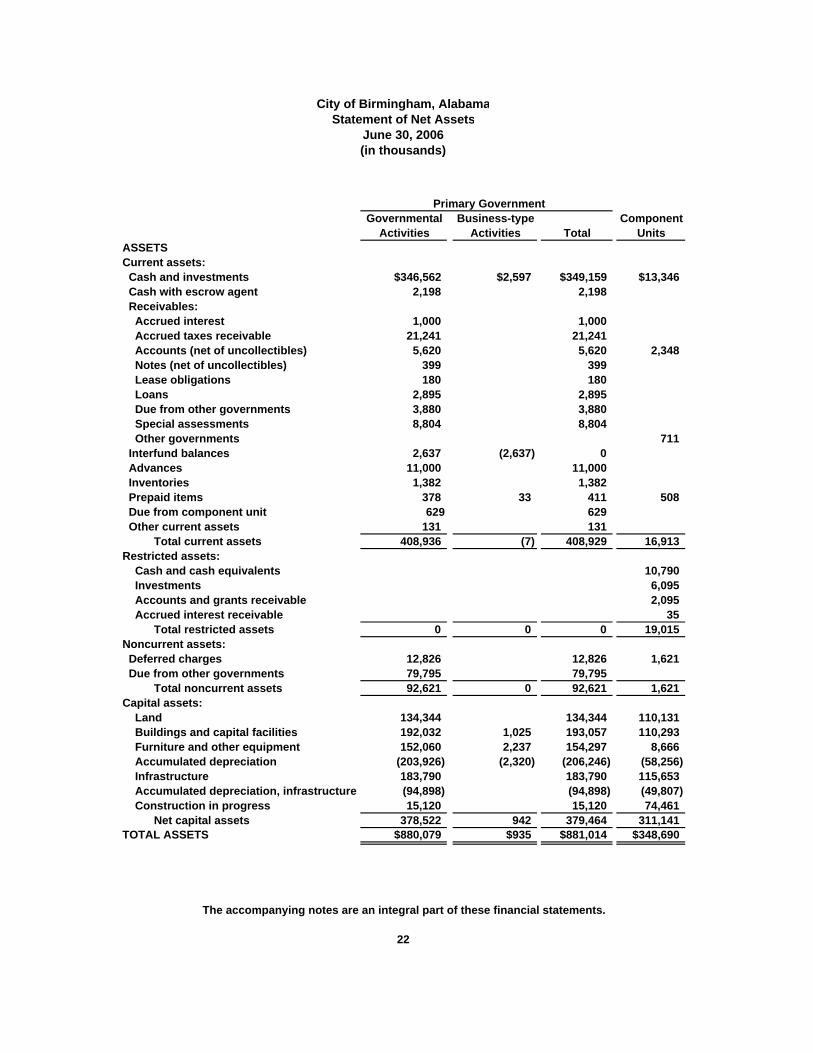
City of Birmingham, AlabamaStatement of Net Assets
June 30, 2006(in thousands)
Primary GovernmentGovernmental Business-type Component
Activities Activities Total UnitsASSETSCurrent assets: Cash and investments $346,562 $2,597 $349,159 $13,346 Cash with escrow agent 2,198 2,198 Receivables: Accrued interest 1,000 1,000 Accrued taxes receivable 21,241 21,241 Accounts (net of uncollectibles) 5,620 5,620 2,348 Notes (net of uncollectibles) 399 399 Lease obligations 180 180 Loans 2,895 2,895 Due from other governments 3,880 3,880 Special assessments 8,804 8,804 Other governments 711 Interfund balances 2,637 (2,637) 0 Advances 11,000 11,000 Inventories 1,382 1,382 Prepaid items 378 33 411 508 Due from component unit 629 629 Other current assets 131 131 Total current assets 408,936 (7) 408,929 16,913Restricted assets: Cash and cash equivalents 10,790 Investments 6,095 Accounts and grants receivable 2,095 Accrued interest receivable 35 Total restricted assets 0 0 0 19,015Noncurrent assets: Deferred charges 12,826 12,826 1,621 Due from other governments 79,795 79,795 Total noncurrent assets 92,621 0 92,621 1,621Capital assets: Land 134,344 134,344 110,131 Buildings and capital facilities 192,032 1,025 193,057 110,293 Furniture and other equipment 152,060 2,237 154,297 8,666 Accumulated depreciation (203,926) (2,320) (206,246) (58,256) Infrastructure 183,790 183,790 115,653 Accumulated depreciation, infrastructure (94,898) (94,898) (49,807) Construction in progress 15,120 15,120 74,461 Net capital assets 378,522 942 379,464 311,141TOTAL ASSETS $880,079 $935 $881,014 $348,690
The accompanying notes are an integral part of these financial statements.
22
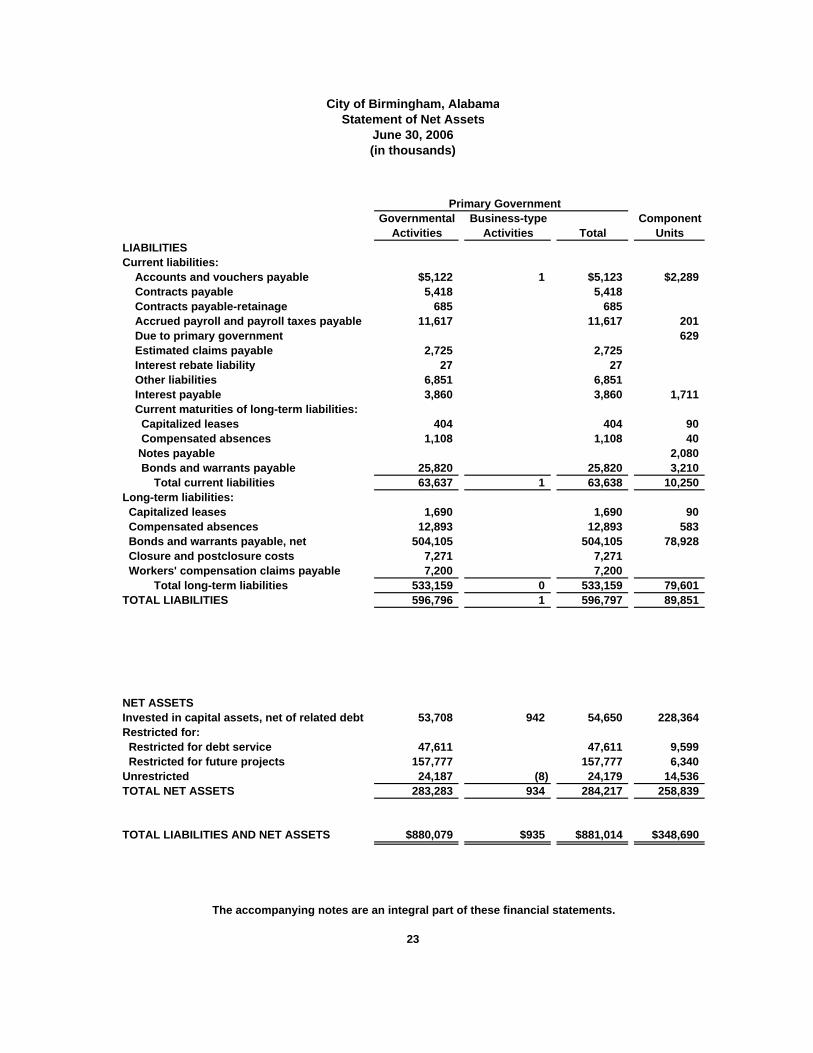
City of Birmingham, AlabamaStatement of Net Assets
June 30, 2006(in thousands)
Primary GovernmentGovernmental Business-type Component
Activities Activities Total UnitsLIABILITIESCurrent liabilities: Accounts and vouchers payable $5,122 1 $5,123 $2,289 Contracts payable 5,418 5,418 Contracts payable-retainage 685 685 Accrued payroll and payroll taxes payable 11,617 11,617 201 Due to primary government 629 Estimated claims payable 2,725 2,725 Interest rebate liability 27 27 Other liabilities 6,851 6,851 Interest payable 3,860 3,860 1,711 Current maturities of long-term liabilities: Capitalized leases 404 404 90 Compensated absences 1,108 1,108 40 Notes payable 2,080 Bonds and warrants payable 25,820 25,820 3,210 Total current liabilities 63,637 1 63,638 10,250Long-term liabilities: Capitalized leases 1,690 1,690 90 Compensated absences 12,893 12,893 583 Bonds and warrants payable, net 504,105 504,105 78,928 Closure and postclosure costs 7,271 7,271 Workers' compensation claims payable 7,200 7,200 Total long-term liabilities 533,159 0 533,159 79,601TOTAL LIABILITIES 596,796 1 596,797 89,851
NET ASSETSInvested in capital assets, net of related debt 53,708 942 54,650 228,364Restricted for: Restricted for debt service 47,611 47,611 9,599 Restricted for future projects 157,777 157,777 6,340Unrestricted 24,187 (8) 24,179 14,536TOTAL NET ASSETS 283,283 934 284,217 258,839
TOTAL LIABILITIES AND NET ASSETS $880,079 $935 $881,014 $348,690
The accompanying notes are an integral part of these financial statements.
23

City of Birmingham, AlabamaStatement of Activities
For the Year Ended June 30, 2006(in thousands)
Net (Expenses) Revenues and Changesin Net Assets
Program Revenues Primary GovernmentOperating Capital
Charges for Grants and Grants and Governmental Business-type ComponentExpenses Services Contributions Contributions Activities Activities Total Units
Functions:Primary Government:
Governmental activities:General government 122,163$ 60,564$ 8,221$ ($53,378) ($53,378)Public safety 181,014 17,244 (163,770) (163,770)Streets and sanitation 68,749 1,706 (67,043) (67,043)Culture and recreation 38,547 977 (37,570) (37,570)Interest on long-term debt 22,414 (22,414) (22,414)
Total governmental activities 432,887 80,491 8,221 0 (344,175) (344,175)
Business-type activities:Emergency Management Communication District 3,157 2,998 (159) (159)Total business-type activities 3,157 2,998 0 0 0 (159) (159)
Total primary government $436,044 $83,489 $8,221 $0 ($344,175) ($159) ($344,334)
Component Units:Birmingham Airport Authority 30,921 30,325 19,378 18,782Birmingham Parking Authority 4,998 5,130 132Total component units $35,919 $35,455 $0 $19,378 $0 $0 $0 $18,914
General revenues:Sales and use tax 109,085 109,085Occupational tax 72,297 72,297Property tax 52,669 52,669Grants and contributions not restricted to specific purposes 19,585 19,585Unrestricted investment earnings 10,834 39 10,873 839Other 10,189 10,189 4,461Total general revenues 274,659 39 274,698 5,300Change in net assets (69,516) (120) (69,636) 24,214Net assets at beginning of year, restated 352,799 1,054 353,853 234,625Net assets at end of year $283,283 $934 $284,217 $258,839
The accompanying notes are an integral part of these financial statements.
24

City of Birmingham, AlabamaBalance Sheet
Governmental FundsJune 30, 2006(in thousands)
Birmingham General General Other Total Birmingham Water Works Bond Debt Bond Debt Governmental Governmental
General Fund Proceeds Reserve Service Funds FundsASSETSCash and investments $97,381 $79,098 $65,986 $44,756 $204 $59,137 $346,562Cash with fiscal agent 2,198 2,198Receivables: Accrued interest 119 504 0 286 0 91 1,000 Accrued taxes receivable 21,241 21,241 Accounts (net of uncollectibles) 4,936 379 5,315 Notes (net of uncollectibles) 399 399 Lease obligations 180 0 180 Loans 2,895 2,895 Due from other governments 82,930 745 83,675 Special assessments 8,804 8,804Due from other funds 2,746 38,244 40,990Due from component units 934 934Advances 11,000 11,000Inventories 1,382 1,382Prepaid items 378 378Other 78 53 131TOTAL ASSETS $140,774 $79,602 $65,986 $127,972 $204 $112,546 $527,084
LIABILITIES AND FUND BALANCESAccounts and vouchers payable 3,084 85 1,833 5,002Contracts payable 21 4,009 1,508 5,538Contracts payable-retainage 18 667 685Accrued payroll and payroll taxes payable 11,519 16 82 11,617Due to other funds 37,876 43 1,206 39,125Deferred revenue 801 82,930 12,735 96,466Estimated claims payable 2,725 2,725Other liabilities 6,796 55 6,851TOTAL LIABILITIES 62,801 39 4,068 82,930 85 18,086 168,009
FUND BALANCES: Reserved for encumbrances 7,206 319 1,496 14,306 23,327 Reserved for debt service 45,042 119 1,513 46,674 Reserved for prepaid items 378 378 Reserved for capital projects 79,244 60,422 80,487 220,153 Unreserved reported in: General fund 70,389 70,389 Special revenue funds (1,846) (1,846)TOTAL FUND BALANCES 77,973 79,563 61,918 45,042 119 94,460 359,075
TOTAL LIABILITIES AND FUND BALANCES $140,774 $79,602 $65,986 $127,972 $204 $112,546
Amounts reported for governmental activities in the statement of net assets are different because: Capital assets used in governmental activities are not financial resources and, therefore, are not reported in the funds 378,522 Long-term liabilities, including bonds payable, are not due and payable in the current period and, therefore, are not reported i (551,525) Deferred revenues are not recognized until available in the funds 96,466 Arbitrage rebate (27) Interfund eliminations 772
Net assets of governmental activities $283,283
The accompanying notes are an integral part of these financial statements.
25

City of Birmingham, AlabamaStatement of Revenues, Expenditures, and Changes in Fund Balances
Governmental FundsFor the Year Ended June 30, 2006
(in thousands)
Birmingham General General Other Total Birmingham Water Works Bond Debt Bond Debt Governmental Governmental
General Fund Proceeds Reserve Service Funds FundsREVENUES: Taxes $207,550 25,983 $518 $234,051 Licenses and permits 60,564 60,564 Intergovernmental 14,671 24,602 39,273 Charges for services 15,746 15,746 Fines and forfeitures 4,181 4,181 Investment income 2,647 3,999 2,273 53 1,862 10,834 Other operating revenues 2,947 2,524 5,471TOTAL REVENUES 308,306 3,999 2,273 26,036 0 29,506 370,120
EXPENDITURES: Current: Public safety 145,688 145,688 Street and sanitation 66,430 72 1,981 68,483 Cultural and recreational 35,259 2,727 561 38,547 General government 45,802 2,347 57,040 0 20,944 126,133 Other 416 416 Total current operations 293,179 5,146 57,040 0 416 23,486 379,267
Debt service: Principal 15,420 8,249 23,669 Interest 15,623 352 15,975 Total debt service 31,043 8,601 39,644
Capital outlays 38,075 38,075Warrant issue costs 541 541
TOTAL EXPENDITURES 293,179 5,146 57,040 0 31,459 70,703 457,527
Excess (deficiency) of revenues over (under) expenditures 15,127 (1,147) (54,767) 26,036 (31,459) (41,197) (87,407)
Other financing sources (uses): Proceeds from sale of property 4,230 582 4,812 Issuance of warrants 28,230 28,230 Capital lease 1,845 1,845 Discounts on warrants 1,767 1,767 Payment to escrow agent (624) (29,456) (30,080) Transfers in 32,079 17,142 49,221 Transfers out (15,562) 614 (32,079) (2,194) (49,221) Net other financing sources (uses) (11,332) 0 614 (32,079) 31,455 17,916 6,574
Net change in fund balances 3,795 (1,147) (54,153) (6,043) (4) (23,281) (80,833)Fund balances, beginning of year 74,178 80,710 116,071 51,085 123 117,741 439,908Fund balances, end of year $77,973 $79,563 $61,918 $45,042 $119 $94,460 $359,075
The accompanying notes are an integral part of these financial statements.
26

City of Birmingham, AlabamaReconciliation of the Statement of Revenues, Expenditures, and
Changes in Fund Balances of Governmental Funds to theStatement of Activities
For the Year Ended June 30, 2006(in thousands)
Net change, decrease, in fund balances - total governmental funds (80,833)
Governmental funds report capital outlays as expenditures. In the statement of activities, however, these costs are allocated over their estimated useful lives and reported as depreciation expense: Reclassify new additions to general fixed assets 12,853 Reclassify new additions to infrastructure 6,860 Depreciation on general fixed assets (10,126) Depreciation on infrastructure (5,637) 3,950
The issuance of long-term debt provides current resources to governmental funds and the repayment of the principal of long-term debt uses current financial resources of governmental funds. These transactions have no effect on net assets: Proceeds from capital lease (1,845) Payment of principal on general obligation debt 21,415 Payment on capital leases 168 Payment on note payable 380 Issuance costs of general obligation debt 624 20,742
Some expenses reported in the statement of activities do notrequire the use of current financial resources and are not reportedas expenditures in governmental funds: Change in compensated absences (1,406) Change in closure and postclosure costs (266) Amortization of deferred charges (124) Arbitrage rebate liability 129 Change in interest payable (219) (1,886)
Revenue not recognized until future years 5,108Revenue recognized in a prior year (16,055)Elimination of interfund receivable 72Loss on disposal of fixed assets (614) (11,489)
Change, decrease, in net assets of governmental activities ($69,516)
The accompanying notes are an integral part of these financial statements.
27

City of Birmingham, AlabamaGeneral Fund
Statement of Revenues, Expenditures, and Changes in Fund Balances -Budget and Actual
For the Year Ended June 30, 2006(in thousands)
VarianceBudget Amounts with Final
Original Final Actual BudgetRevenues: Taxes $203,540 $204,340 $207,549 $3,209 Licenses and permits 55,876 59,066 60,564 1,498 Intergovernmental 14,301 14,527 14,671 144 Charges for services 16,671 19,405 18,384 (1,021) Fines and forfeitures 4,400 4,400 4,181 (219) Other operating revenues 8,612 6,588 5,668 (920)Total revenues 303,400 308,326 311,017 2,691
Expenditures: Public safety 151,944 151,370 148,436 (2,934) Environment and street 67,460 66,794 63,635 (3,159) Cultural and recreational 35,678 35,816 35,154 (662) General government 48,318 47,254 47,113 (141)Total expenditures 303,400 301,234 294,338 (6,896)
Excess revenue over expenditures $7,092 16,679 $9,587
Other financing uses (11,332)
Deficiency of revenues over expenditures and other uses 5,347Fund balance, beginning of year 65,420Fund balance, end of year $70,767
The accompanying notes are an integral part of these financial statements
28

City of Birmingham, AlabamaStatement of Net Assets
Proprietary FundEmergency Management Communication District
June 30, 2006(in thousands)
ASSETSCurrent assets: Cash and investments $2,597 Prepaid items 33Total current assets 2,630
Property, plant, and equipment: Buildings and systems 1,025 Machinery and equipment 2,188 Furniture and fixtures 49 Less accumulated depreciation (2,320)Total property, plant, and equipment 942
TOTAL ASSETS $3,572
LIABILITIESCurrent liabilities: Accounts payable $1 Due to other funds 2,637TOTAL LIABILITIES 2,638
NET ASSETSInvested in capital assets 942Unrestricted (8)NET ASSETS 934
TOTAL LIABILITIES AND NET ASSETS $3,572
The accompanying notes are an integral part of these financial statements.
29
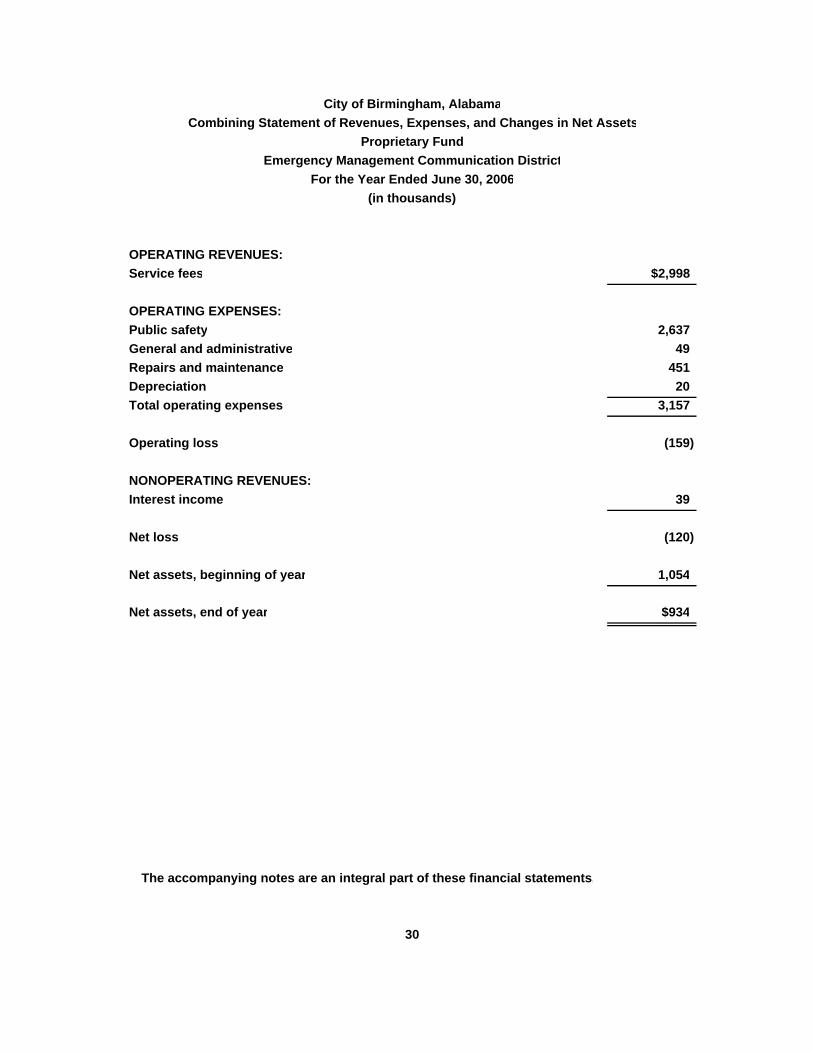
City of Birmingham, AlabamaCombining Statement of Revenues, Expenses, and Changes in Net Assets
Proprietary FundEmergency Management Communication District
For the Year Ended June 30, 2006(in thousands)
OPERATING REVENUES:Service fees $2,998
OPERATING EXPENSES:Public safety 2,637General and administrative 49Repairs and maintenance 451Depreciation 20Total operating expenses 3,157
Operating loss (159)
NONOPERATING REVENUES:Interest income 39
Net loss (120)
Net assets, beginning of year 1,054
Net assets, end of year $934
The accompanying notes are an integral part of these financial statements.
30

City of Birmingham, AlabamaStatement of Cash Flows
Proprietary FundEmergency Management Communication District
For the Year Ended June 30, 2006(in thousands)
Cash flows from operating activities: Cash received from customers $2,998 Cash payments to suppliers (3,172) Cash payments to employees (47)Net cash used by operating activities (221)
Cash flows from capital activities: Acquisition of capital assets (198)
Cash flows from investing activities: Interest received 52
Net decrease in cash and cash equivalents (367)Cash and investments, beginning of year 2,964Cash and investments, end of year $2,597
Reconciliation of operating loss to net cash used by operating activities: Operating loss ($159)
Adjustments to reconcile operating loss to net cash used by operating activities: Depreciation 20 Change in prepaid items (48) Change in accounts payable and other liabilities (34)Net cash used by operating activities ($221)
The accompanying notes are an integral part of these financial statements.
31
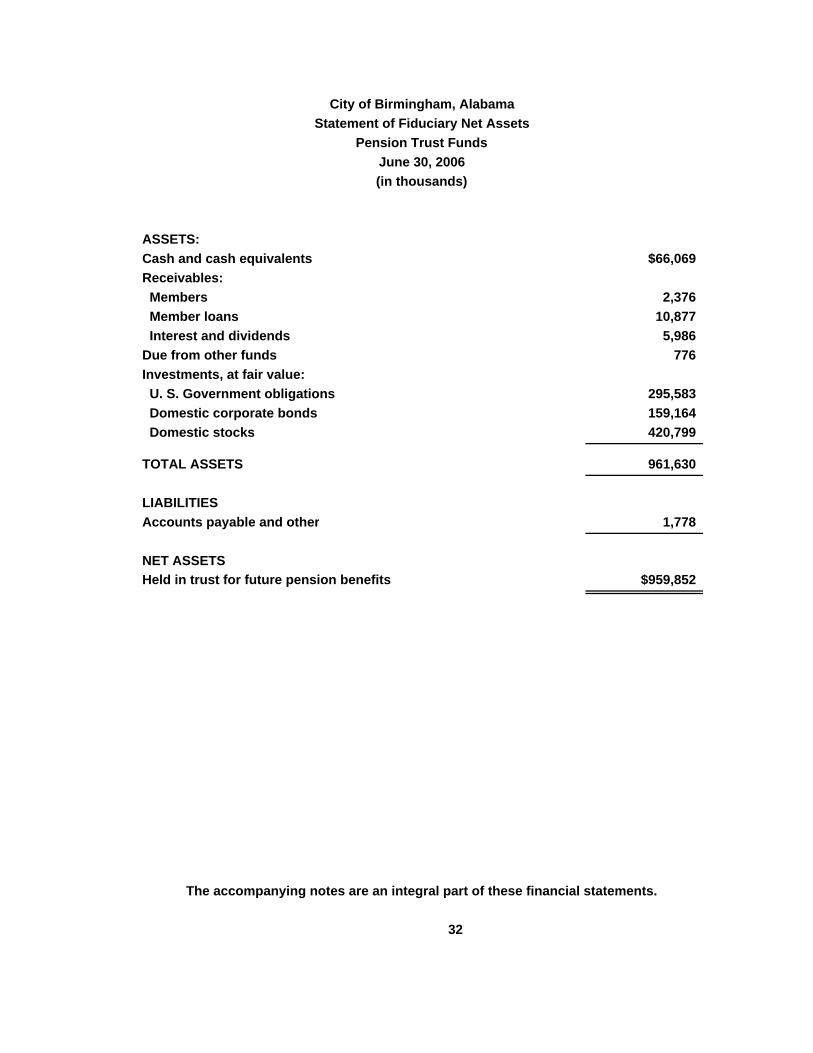
City of Birmingham, AlabamaStatement of Fiduciary Net Assets
Pension Trust FundsJune 30, 2006(in thousands)
ASSETS:Cash and cash equivalents $66,069Receivables: Members 2,376 Member loans 10,877 Interest and dividends 5,986Due from other funds 776Investments, at fair value: U. S. Government obligations 295,583 Domestic corporate bonds 159,164 Domestic stocks 420,799
TOTAL ASSETS 961,630
LIABILITIESAccounts payable and other 1,778
NET ASSETSHeld in trust for future pension benefits $959,852
The accompanying notes are an integral part of these financial statements.
32

City of Birmingham, AlabamaStatement of Changes in Fiduciary Net Assets
Pension Trust FundsFor the Year Ended June 30, 2006
(in thousands)
ADDITIONS:Contributions:Employer contributions $14,985Plan member contributions 14,030 Total contributions 29,015
Investment income: Investment earnings 44,782 Securities lending 279
45,061 Less investment expenses 3,430 Net investment income 41,631
Other income 491
TOTAL ADDITIONS 71,137
DEDUCTIONS:Benefits 51,543Refunds of contributions 1,221Administrative expenses 844
TOTAL DEDUCTIONS 53,608
Net increase 17,529
Net assets held in trust for future pension benefits: Beginning of year 942,323 End of year $959,852
The accompanying notes are an integral part of these financial statements.
33
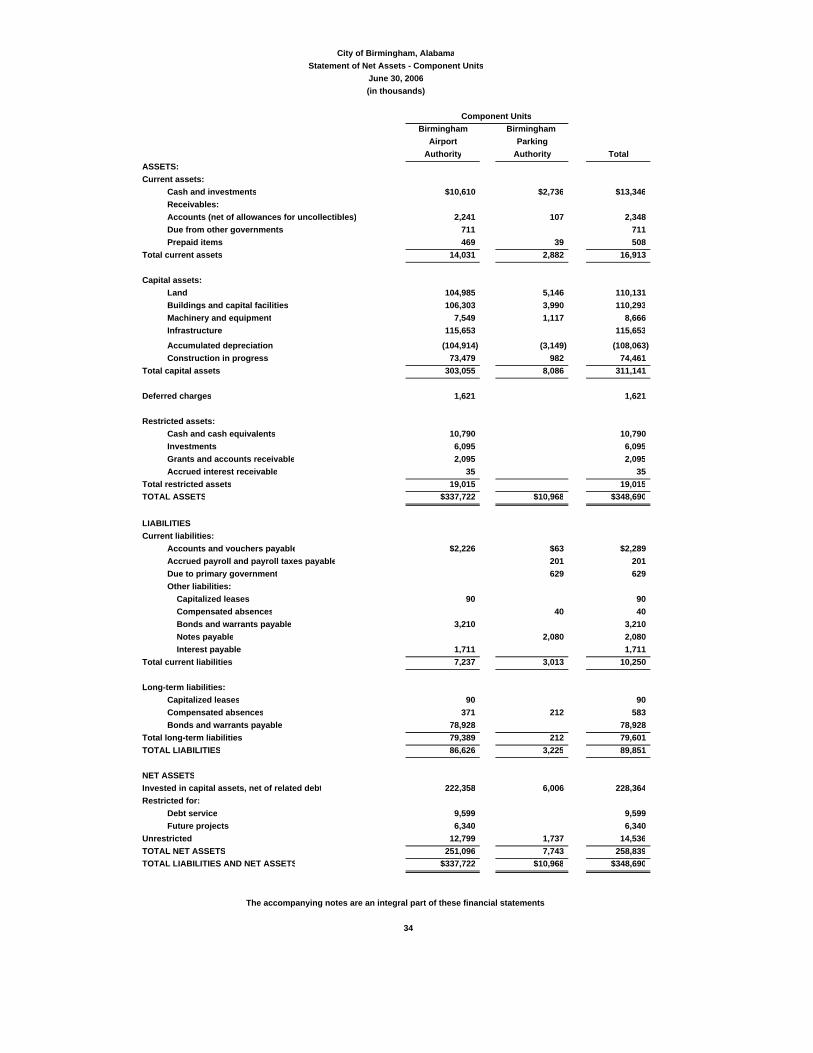
City of Birmingham, AlabamaStatement of Net Assets - Component Units
June 30, 2006(in thousands)
Component UnitsBirmingham Birmingham
Airport ParkingAuthority Authority Total
ASSETS:Current assets:
Cash and investments $10,610 $2,736 $13,346Receivables:Accounts (net of allowances for uncollectibles) 2,241 107 2,348Due from other governments 711 711Prepaid items 469 39 508
Total current assets 14,031 2,882 16,913
Capital assets:Land 104,985 5,146 110,131Buildings and capital facilities 106,303 3,990 110,293Machinery and equipment 7,549 1,117 8,666Infrastructure 115,653 115,653Accumulated depreciation (104,914) (3,149) (108,063)Construction in progress 73,479 982 74,461
Total capital assets 303,055 8,086 311,141
Deferred charges 1,621 1,621
Restricted assets:Cash and cash equivalents 10,790 10,790Investments 6,095 6,095Grants and accounts receivable 2,095 2,095Accrued interest receivable 35 35
Total restricted assets 19,015 19,015TOTAL ASSETS $337,722 $10,968 $348,690
LIABILITIESCurrent liabilities:
Accounts and vouchers payable $2,226 $63 $2,289Accrued payroll and payroll taxes payable 201 201Due to primary government 629 629Other liabilities: Capitalized leases 90 90 Compensated absences 40 40 Bonds and warrants payable 3,210 3,210 Notes payable 2,080 2,080 Interest payable 1,711 1,711
Total current liabilities 7,237 3,013 10,250
Long-term liabilities:Capitalized leases 90 90Compensated absences 371 212 583Bonds and warrants payable 78,928 78,928
Total long-term liabilities 79,389 212 79,601TOTAL LIABILITIES 86,626 3,225 89,851
NET ASSETSInvested in capital assets, net of related debt 222,358 6,006 228,364Restricted for:
Debt service 9,599 9,599Future projects 6,340 6,340
Unrestricted 12,799 1,737 14,536TOTAL NET ASSETS 251,096 7,743 258,839TOTAL LIABILITIES AND NET ASSETS $337,722 $10,968 $348,690
The accompanying notes are an integral part of these financial statements.
34
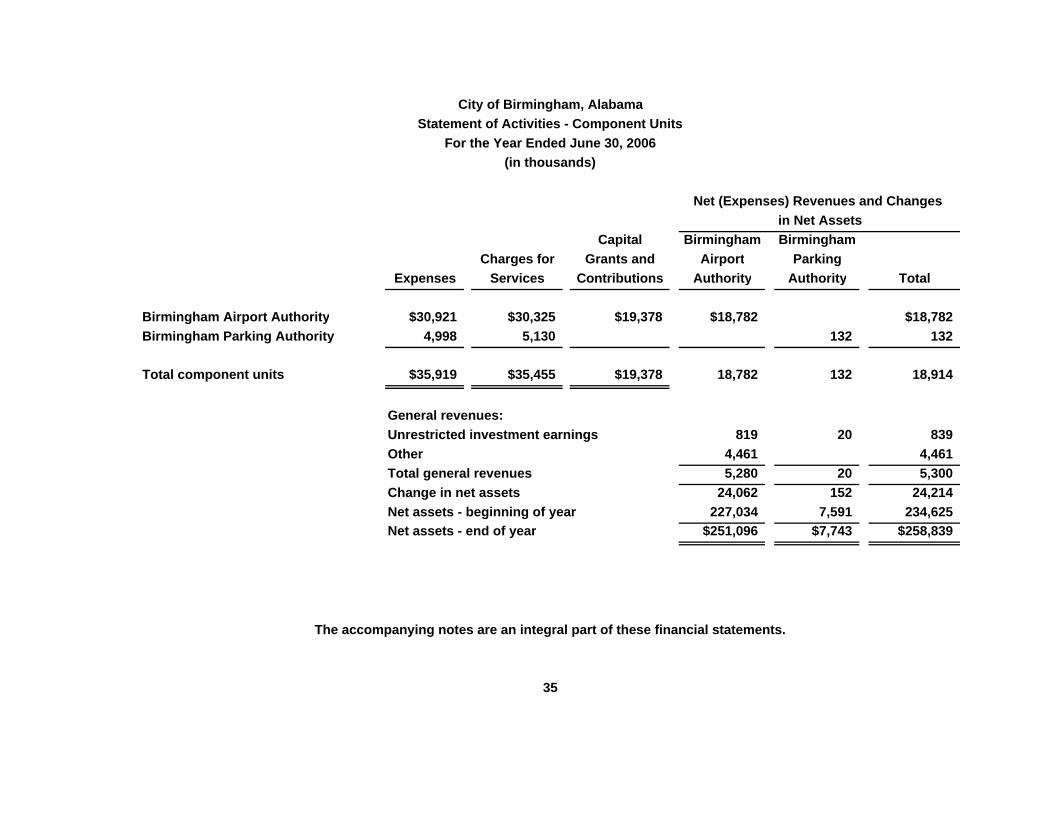
City of Birmingham, AlabamaStatement of Activities - Component Units
For the Year Ended June 30, 2006(in thousands)
Net (Expenses) Revenues and Changes in Net Assets
Capital Birmingham BirminghamCharges for Grants and Airport Parking
Expenses Services Contributions Authority Authority Total
Birmingham Airport Authority $30,921 $30,325 $19,378 $18,782 $18,782Birmingham Parking Authority 4,998 5,130 132 132
Total component units $35,919 $35,455 $19,378 18,782 132 18,914
General revenues:Unrestricted investment earnings 819 20 839Other 4,461 4,461Total general revenues 5,280 20 5,300Change in net assets 24,062 152 24,214Net assets - beginning of year 227,034 7,591 234,625Net assets - end of year $251,096 $7,743 $258,839
The accompanying notes are an integral part of these financial statements.
35

CITY OF BIRMINGHAM Notes to the Financial Statements
June 30, 2006
36
I. Organization and Summary of Significant Accounting Policies
A. Reporting Entity The City of Birmingham, located in Alabama, is a municipal corporation that was incorporated on December 19, 1871. The City operates under a Mayor-Council form of government as provided by Act No. 425 of the Alabama Legislature (The Mayor-Council Act) and is comprised of a Mayor and a nine-member council that is elected at large. The financial statements of the City have been presented in conformity with accounting principles accepted in the United States of America (GAAP) as applied to governmental units. The Governmental Accounting Standards Board (GASB) is the accepted standard-setting body for establishing governmental accounting and financial reporting principles. The accompanying financial statements present the City and its component units, entities for which the City of Birmingham is considered to be financially accountable. The City’s discretely presented component units are presented in total in a separate column in the government-wide financial statements to emphasize that they are legally separate from the City. Discretely presented component units • The Birmingham Airport Authority (BAA) is a seven-member board appointed by the City and is a non-profit corporation under the provisions of the Code of Alabama. The Authority is responsible for the operations of the Birmingham International Airport. Because the City of Birmingham appoints the BAA’s governing body and the City is obligated in some manner for the debt of the BAA, the Authority is included as a component unit in these financial statements. The BAA’s fiscal year ends June 30. The BAA reimburses the City for the cost of providing security and fire protection services to the Airport. Amounts charged by the City for the fiscal year ended June 30, 2006, totaled $2,927,404. • The Birmingham Parking Authority (BPA) is a three-member board appointed by the City and operates parking facilities in the City and also acts as a financing agent for certain other parking facilities. Because the City appoints the BPA’s governing body, the City is obligated to provide and receives specific financial benefits, and the City is obligated in some manner for the debt of the BPA, the Authority is included as a component unit in these financial statements. The BPA’s fiscal year ends June 30.
CITY OF BIRMINGHAM Notes to the Financial Statements
June 30, 2006
37
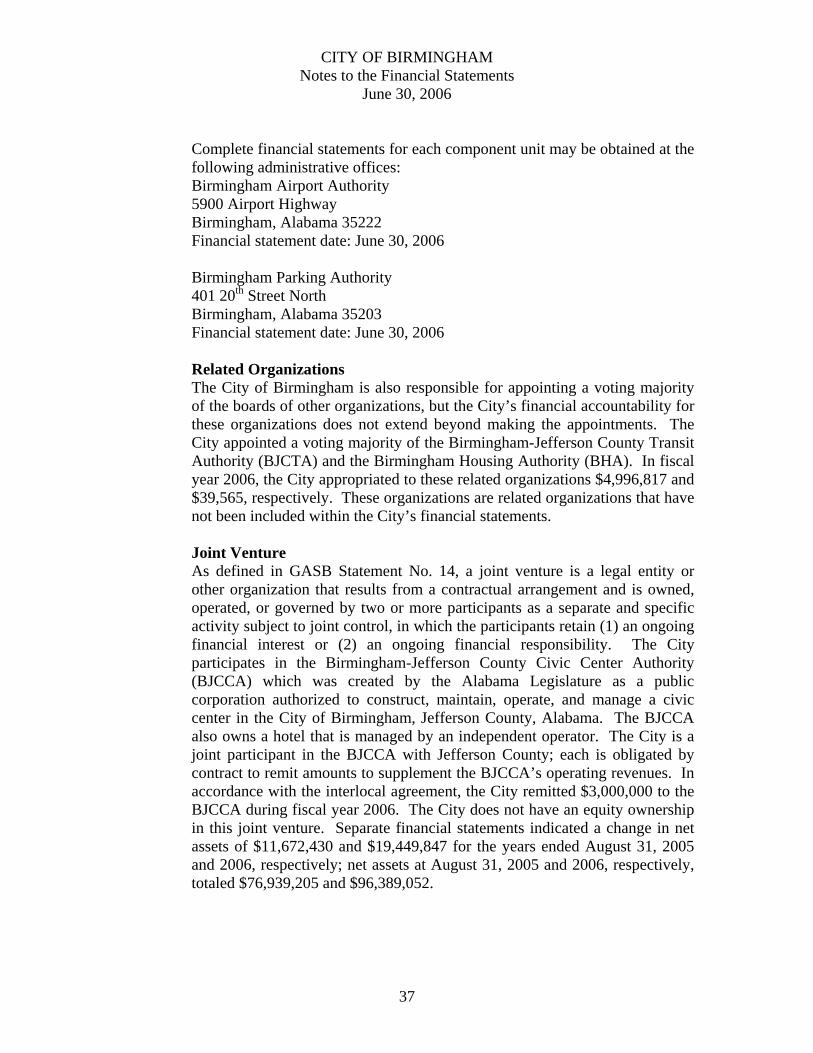
Complete financial statements for each component unit may be obtained at the following administrative offices: Birmingham Airport Authority 5900 Airport Highway Birmingham, Alabama 35222 Financial statement date: June 30, 2006 Birmingham Parking Authority 401 20th Street North Birmingham, Alabama 35203 Financial statement date: June 30, 2006 Related Organizations The City of Birmingham is also responsible for appointing a voting majority of the boards of other organizations, but the City’s financial accountability for these organizations does not extend beyond making the appointments. The City appointed a voting majority of the Birmingham-Jefferson County Transit Authority (BJCTA) and the Birmingham Housing Authority (BHA). In fiscal year 2006, the City appropriated to these related organizations $4,996,817 and $39,565, respectively. These organizations are related organizations that have not been included within the City’s financial statements. Joint Venture As defined in GASB Statement No. 14, a joint venture is a legal entity or other organization that results from a contractual arrangement and is owned, operated, or governed by two or more participants as a separate and specific activity subject to joint control, in which the participants retain (1) an ongoing financial interest or (2) an ongoing financial responsibility. The City participates in the Birmingham-Jefferson County Civic Center Authority (BJCCA) which was created by the Alabama Legislature as a public corporation authorized to construct, maintain, operate, and manage a civic center in the City of Birmingham, Jefferson County, Alabama. The BJCCA also owns a hotel that is managed by an independent operator. The City is a joint participant in the BJCCA with Jefferson County; each is obligated by contract to remit amounts to supplement the BJCCA’s operating revenues. In accordance with the interlocal agreement, the City remitted $3,000,000 to the BJCCA during fiscal year 2006. The City does not have an equity ownership in this joint venture. Separate financial statements indicated a change in net assets of $11,672,430 and $19,449,847 for the years ended August 31, 2005 and 2006, respectively; net assets at August 31, 2005 and 2006, respectively, totaled $76,939,205 and $96,389,052.

CITY OF BIRMINGHAM Notes to the Financial Statements
June 30, 2006
38
The City of Birmingham participates in the West Jefferson Amusement Authority which was created pursuant to Section 4 of Act No. 69-916 of the Alabama Legislature as a public corporation, which provides for the joint and cooperative development of an amusement park. The City is a joint participant in this entity with other municipalities in Jefferson County. The City and the other participants are obligated by an interlocal agreement to remit annually funds to supplement the West Jefferson Amusement Authority’s operations in the amount of $2,952,000. The City’s share of the annual remittance is $1,000,000. Pursuant to this agreement, the City is required to make this annual remittance for a period of five years beginning with fiscal year 2000. The City does not have an equity ownership in this joint venture. The Authority has filed for protection under bankruptcy. B. Government-wide and Fund Financial Statements The government-wide financial statements of the City consist of the statement of net assets and the statement of activities for all of the nonfiduciary activities of the City and its two component units. The effect of interfund activity has been removed from these statements. The statements report separately the governmental activities from the business-type activities. Governmental activities are normally supported by taxes and intergovernmental revenues, whereas business-type activities rely on fees and charges for support. The City as the primary government is shown separately from its two legally separate component units. The statement of activities demonstrates the degree to which the direct expenses of a given function are offset by program revenues. Direct expenses are those that are clearly identifiable with a specific function; program revenues include (a) charges to customers who purchase, use, or directly benefit from goods, services, or privileges provided by a given function, and (b) grants and contributions that are restricted to meeting the operational or capital requirements of a particular function. General revenues include taxes and other items not included in program revenues. Included in this report are separate financial statements for governmental funds, proprietary funds, and fiduciary funds, even though the latter are excluded from the government-wide financial statements. The City reports its major individual governmental funds as separate columns in the fund financial statements. C. Measurement Focus, Basis of Accounting, and Financial Statement
Presentation The accounting and financial reporting treatment applied to a fund is determined by its measurement focus. The government-wide financial
CITY OF BIRMINGHAM Notes to the Financial Statements
June 30, 2006
39
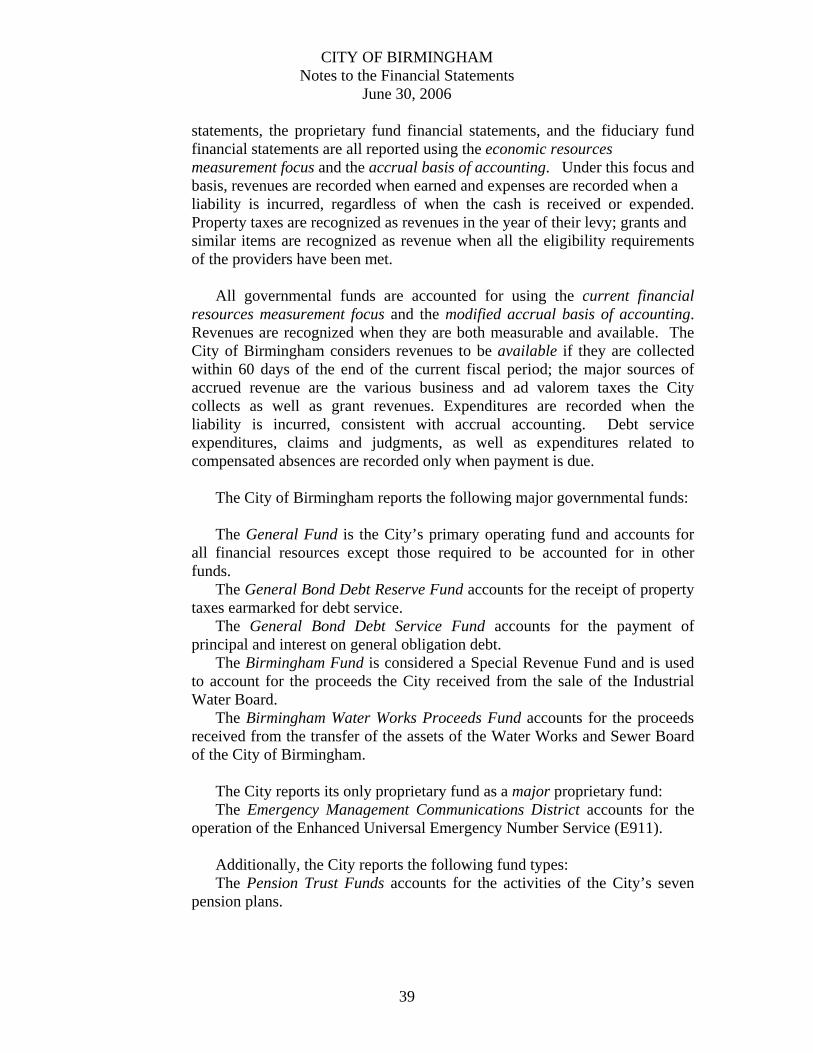
statements, the proprietary fund financial statements, and the fiduciary fund financial statements are all reported using the economic resources measurement focus and the accrual basis of accounting. Under this focus and basis, revenues are recorded when earned and expenses are recorded when a liability is incurred, regardless of when the cash is received or expended. Property taxes are recognized as revenues in the year of their levy; grants and similar items are recognized as revenue when all the eligibility requirements of the providers have been met.
All governmental funds are accounted for using the current financial
resources measurement focus and the modified accrual basis of accounting. Revenues are recognized when they are both measurable and available. The City of Birmingham considers revenues to be available if they are collected within 60 days of the end of the current fiscal period; the major sources of accrued revenue are the various business and ad valorem taxes the City collects as well as grant revenues. Expenditures are recorded when the liability is incurred, consistent with accrual accounting. Debt service expenditures, claims and judgments, as well as expenditures related to compensated absences are recorded only when payment is due.
The City of Birmingham reports the following major governmental funds: The General Fund is the City’s primary operating fund and accounts for
all financial resources except those required to be accounted for in other funds.
The General Bond Debt Reserve Fund accounts for the receipt of property taxes earmarked for debt service.
The General Bond Debt Service Fund accounts for the payment of principal and interest on general obligation debt.
The Birmingham Fund is considered a Special Revenue Fund and is used to account for the proceeds the City received from the sale of the Industrial Water Board.
The Birmingham Water Works Proceeds Fund accounts for the proceeds received from the transfer of the assets of the Water Works and Sewer Board of the City of Birmingham.
The City reports its only proprietary fund as a major proprietary fund: The Emergency Management Communications District accounts for the
operation of the Enhanced Universal Emergency Number Service (E911). Additionally, the City reports the following fund types: The Pension Trust Funds accounts for the activities of the City’s seven
pension plans.
CITY OF BIRMINGHAM Notes to the Financial Statements
June 30, 2006
40
GASB Statement No. 20 requires that each government make elections
concerning proprietary funds. The City elected to apply Financial Accounting Standards Board (FASB) pronouncements and interpretations issued before or on November 20, 1989, unless they conflict with or contradict GASB pronouncements.
The accompanying financial statements reflect the elimination of interfund
activity with the exception of the charges to the City’s proprietary fund. These amounts are shown on the statement of net assets as interfund balances.
The operating revenues of the proprietary fund include charges to
customers for the operation of the 911 telephone service. Nonoperating revenues include investment earnings. The operating expenses of the proprietary fund are those expenses incurred in the normal operations of providing the 911 services, as well as depreciation of the capital assets.
D. Assets, Liabilities, and Net Assets or Equity
1. Deposits and Investments – Cash and cash equivalents includes
amounts in demand deposits as well as short-term investments with a maturity date within three months of the date acquired by the City. State statutes authorize the City to invest in U. S. government obligations, U. S. government agency obligations, U. S. corporate stock, U. S. debt, State of Alabama obligations, county obligations, and other municipal obligations.
All investments, including those of the City’s component units, are reported at fair value, market value, or best available estimates. Short-term investments are reported at cost which approximates market value. Securities traded on a national or international exchange are valued at the last reported sales price at current exchange rates. All investments have established markets to determine their fair value.
2. Receivables and Payables – The City shows “due to/from other funds”at the end of the fiscal year to
show the current outstanding balances from lending/borrowing arrangements. Taxes Receivable – All property taxes levied by the State of Alabama,
Jefferson and Shelby Counties are assessed by the Jefferson and Shelby Counties Tax assessors and collected by their tax collectors. The property tax calendars specify the following actions and dates:
Levy (assessment date) September 30 Lien date September 30 Due date October 1 Collection dates October 1 to December 31 Delinquent date January 1

CITY OF BIRMINGHAM Notes to the Financial Statements
June 30, 2006
41
The City of Birmingham receives a 3% sales tax for the sale of tangible goods within the City limits and a 1% occupational tax on wages of persons employed within the City limits. Tax collections are remitted to the City on a monthly basis. All amounts remitted within the bill paying period are included in revenue; taxes collected within the fiscal year but remitted to the City after year-end are accrued in both the government-wide and fund financial statements.
3. Inventories and Prepaid Items – Inventories are valued on the average cost basis. Inventory consists of expendable supplies held in the General Fund for consumption. The cost is recorded as an expenditure at the time individual inventory items are used (consumption method). Payments made to vendors for services that will benefit periods beyond June 30, 2006, are recorded as prepaid items.
4. Restricted Assets – Certain assets of the Birmingham Airport Authority (component unit) are restricted by the terms of federal grants and programs. These particular funds are restricted for designated capital projects and any debt incurred to finance the construction of those projects.
5. Capital assets – Capital assets include property, buildings, furniture
and other equipment, and infrastructure. Capital assets are reported in the applicable governmental or business-type activities columns in the government-wide financial statements. Capital outlays are recorded as expenditures of the governmental funds. Capital assets, other than infrastructure, are defined by the City as items with an estimated useful life of three years or more and an individual cost in excess of $500. Capital assets are recorded at cost where historical cost is available or at estimated historical cost if actual cost is not available. Donated capital assets are recorded at their estimated fair value at time of donation. The costs of normal repairs and maintenance that do not add to the value of the asset or materially extend useful lives are expensed. Upon sale or retirement of capital assets, the cost and related accumulated depreciation are eliminated from the respective accounts and any resulting gain or loss is included in the results of operations.
Capital assets are depreciated using the straight-line method over the
following estimated useful lives: ASSETS YEARS Buildings and capital facilities 50 Furniture and other equipment 10 – 20 Infrastructure 25 – 50 The City of Birmingham implemented the majority of the capital asset
requirements, including infrastructure assets, of GASB Statement No. 34

CITY OF BIRMINGHAM Notes to the Financial Statements
June 30, 2006
42
during fiscal year 2002. The City elected to capitalize all infrastructure assets that were purchased, constructed, or donated subsequent to June 30, 1980.
The City recognizes the intrinsic value of historical works and collections.
As such, the City has adopted a policy that these items will not be considered capital items and subject to depreciation. This policy covers the historical works and collections housed at the City’s various museums. Should the sale of any of these items occur, the City is committed to using the funds generated from the sale to purchasing other similar collectibles.
6. Compensated absences – City of Birmingham employees earn vacation
leave at graduated rates based on the employee’s length of service (one day per month of service, initially), and up to 40 days of unused leave may be carried over to the following year. Vacation pay is accrued when incurred in the government-wide financial statements. The City does not have a policy for vested sick pay, thus no liability for accumulated unpaid sick leave is accrued.
7. Long-term obligations – Long-term debt and other long-term obligations are reported in the government-wide financial statements. Bond premiums and issuance costs are deferred and amortized over the life of the bonds. Bonds payable are reported net of the applicable bond premiums. Bond issuance costs are reported as deferred charges and amortized over the term of the related debt.
In the fund financial statements, any bond premiums and issuance costs have been recognized in the current period. The face amount of the new debt issued and the premiums received are reported as other financing sources; issuance costs are reported as debt service expenditures.
8. Fund equity – In the fund financial statements, reservations of
governmental funds are used to indicate that a portion of the fund balance is not appropriated for expenditure or is legally segregated for a specific use.
II. Reconciliation of Government-Wide and Fund Financial Statements A. Explanation of certain differences between the governmental fund
balance sheet and the government-wide statement of net assets (dollars in thousands)
The governmental fund balance sheet includes a reconciliation between fund balance - total governmental funds and net assets – governmental activities as reported in the government-wide statement of net assets. One element of that reconciliation explains that “long-term liabilities, including bonds payable, are

CITY OF BIRMINGHAM Notes to the Financial Statements
June 30, 2006
43
not due and payable in the current period and therefore are not reported in the funds.” The details of this $551,525 difference are as follows:
Bonds payable $519,190 Add: Issuance premium (to be amortized as interest expense) 10,766 Less: Discount on issuance of warrants (31)Less: Deferred charge for issuance costs (to be amortized over the life of the debt) (12,826)Accrued interest payable 3,860 Capital leases 2,094 Compensated absences 14,001 Landfill closure liability 7,271 Workmen's compensation claims 7,200 $551,525
B. Explanation of certain differences between the governmental fund
statement of revenues, expenditures, and changes in fund balances and the government-wide statement of activities (dollars in thousands)
The governmental fund statement of revenues, expenditures, and changes in fund balances includes a reconciliation between net changes in fund balances- total governmental funds and changes in net assets of governmental activities as reported in the government-wide statement of activities. One element of that reconciliation explains that “governmental funds report capital outlays as expenditures. In the statement of activities, however, these costs are allocated over their estimated useful lives and reported as depreciation expense.” The details of this $3,950 difference are as follows:
Capital outlay $19,713
Depreciation expense
(15,763) Net adjustment to increase net changes in fund balances - total governmental funds to arrive at changes in net assets of governmental activities $3,950
CITY OF BIRMINGHAM Notes to the Financial Statements
June 30, 2006
44
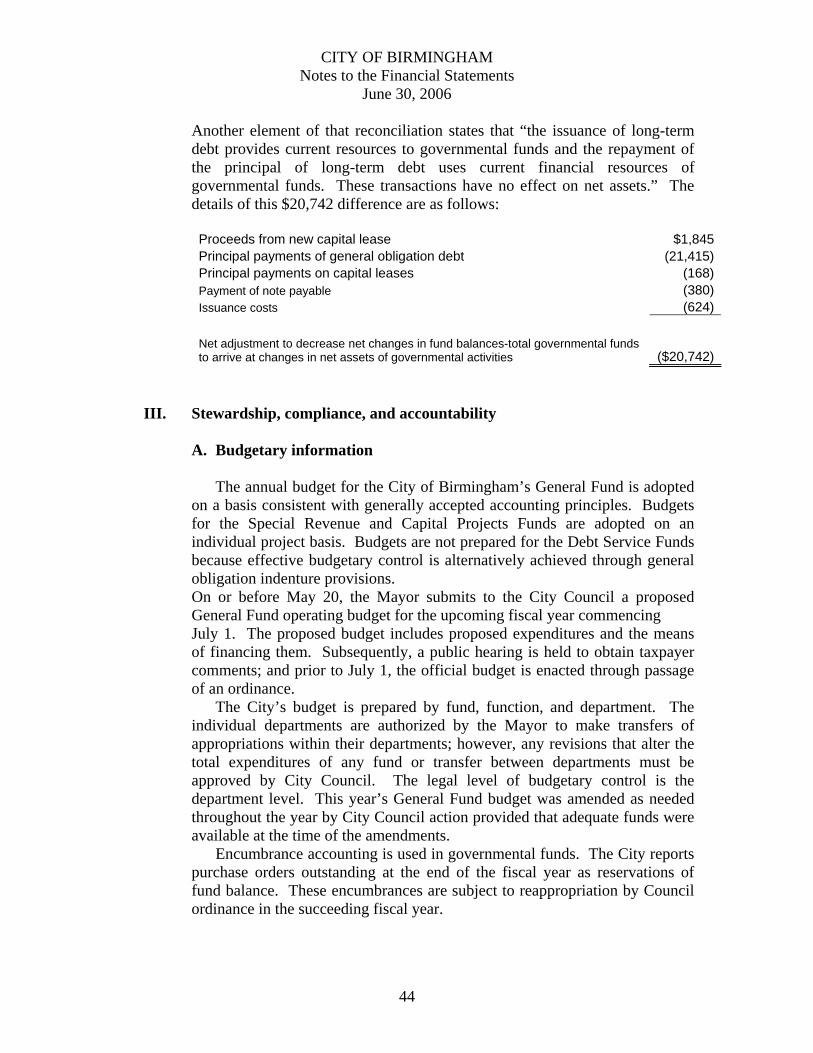
Another element of that reconciliation states that “the issuance of long-term debt provides current resources to governmental funds and the repayment of the principal of long-term debt uses current financial resources of governmental funds. These transactions have no effect on net assets.” The details of this $20,742 difference are as follows: Proceeds from new capital lease $1,845Principal payments of general obligation debt (21,415)Principal payments on capital leases (168)Payment of note payable (380)Issuance costs (624)
Net adjustment to decrease net changes in fund balances-total governmental funds to arrive at changes in net assets of governmental activities ($20,742)
III. Stewardship, compliance, and accountability
A. Budgetary information
The annual budget for the City of Birmingham’s General Fund is adopted on a basis consistent with generally accepted accounting principles. Budgets for the Special Revenue and Capital Projects Funds are adopted on an individual project basis. Budgets are not prepared for the Debt Service Funds because effective budgetary control is alternatively achieved through general obligation indenture provisions. On or before May 20, the Mayor submits to the City Council a proposed General Fund operating budget for the upcoming fiscal year commencing July 1. The proposed budget includes proposed expenditures and the means of financing them. Subsequently, a public hearing is held to obtain taxpayer comments; and prior to July 1, the official budget is enacted through passage of an ordinance.
The City’s budget is prepared by fund, function, and department. The individual departments are authorized by the Mayor to make transfers of appropriations within their departments; however, any revisions that alter the total expenditures of any fund or transfer between departments must be approved by City Council. The legal level of budgetary control is the department level. This year’s General Fund budget was amended as needed throughout the year by City Council action provided that adequate funds were available at the time of the amendments.
Encumbrance accounting is used in governmental funds. The City reports purchase orders outstanding at the end of the fiscal year as reservations of fund balance. These encumbrances are subject to reappropriation by Council ordinance in the succeeding fiscal year.

CITY OF BIRMINGHAM Notes to the Financial Statements
June 30, 2006
45
Reconciliation between the GAAP basis of reporting and the budgetary basis of reporting (dollars in thousands):
Excess of revenues and other sources over expenditures and other uses (GAAP basis) $3,795Less prior year accrued expense (GAAP) (3,281)Plus current year accrued expense (GAAP) 2,508 Plus encumbrance elimination (GAAP) 10,142 Plus net decrease in fair market value of investments (GAAP) 75 Less current year encumbrances (budgetary basis) (7,892)Excess of revenues and other sources over expenditures and other uses (Budgetary basis) $5,347
IV. Detailed notes on all funds
A. Deposits and Investments Deposits – At June 30, 2006 the carrying amount of the City’s demand deposits, certificates of deposits, and money market investments in all funds was $183,781,543 and the bank balance was $174,777,376.
Financial institutions utilized as depositories by the City must provide evidence of its designation by the Alabama State Treasurer as a qualified public depository under the Security of Alabama Funds Enhancement Act (SAFE). From time to time, the City may request that the depository provide evidence of its continuing designation as a qualified public depository. The enactment of the SAFE program changed the way all Alabama public deposits are collateralized. Each qualified public depository (QPD) is required to hold collateral for all its public depositories on a pooled basis in a custody account established by the State Treasurer as SAFE administrator. In the unlikely event a public entity should suffer a deposit loss due to QPD insolvency or default, a claim form would be filed with the State Treasurer who would use the SAFE pool collateral or other means to reimburse the loss. Investments – At June 30, 2006, the City of Birmingham had the following investments:
Investment Type
Fair Value
Weighted Avg. Maturity (years)
U.S. Govt. agency obligations $ 202,293,021 3.49 U.S. Treasuries 199,221,097 6.43 U.S. Corporate debt 168,271,853 7.95 U.S. Corporate stock 506,389,454 - Total fair value $1,076,175,425 Portfolio weighted avg. maturity 5.96

CITY OF BIRMINGHAM Notes to the Financial Statements
June 30, 2006
46
Interest Rate Risk The City has a formal investment policy for its internally managed funds which limits the weighted average duration of fixed income investments as a means of controlling the portfolio’s exposure to undesirable interest rate risk. The guidelines for these various internally managed fund groups are as follows:
Fund Group Weighted Avg Duration Limit Operating & Investment Fund 3 years Sinking Fund 5 years 1992 Street Warrants 2 years Investible Grants 1 year HUD Trust 1 year Firemen’s & Policemen’s Supplemental 7 years Emergency Management Communication District
1 year
1990 G.O. Bonds 2 years 1990 Storm/Sewer Bonds 2 years 1992 G.O. Bond 2 years 1993 G.O. Bond 2 years Birmingham Fund 7 years
Retirement & Relief System – The City’s investment policy for its Retirement & Relief System does not limit investment maturities as a means of managing its exposure to fair value losses arising from increasing interest rates. Investments Highly Sensitive to Interest Rate Changes The City also invests in mortgage-backed securities, representing U.S. government agency obligations with a fair value of $7,770,464, and U.S. corporate debt with a fair value of $2,165,764. Mortgage-backed securities are based on cash flows from the collection of mortgages. Prepayments arise when, for example, mortgage holders redeem their mortgages early. The investor’s investment is returned early, or in extreme cases, not returned at all. Mortgage-backed securities may be considered to be investments with terms that may cause their fair values to be highly sensitive to interest rate changes. Credit Risk: The City’s Retirement & Relief System’s investment policy limits investments in all bonds to securities having a Standard & Poors rating of AAA, AA, A, or BBB, or a Moody’s rating of Aaa, Aa, A, or Baa. The City’s investments included the following bonds at June 30, 2006:

CITY OF BIRMINGHAM Notes to the Financial Statements
June 30, 2006
47
Description Rating Fair Value
U.S. Govt Agency Discount Notes,Bonds
AAA
$202,293,021
U. S. Corporate Bonds: A $ 86,707,244 AA 27,867,731 AAA 13,292,855 BB 980,270 BBB 39,423,754 168,271,854 $370,564,875
Securities Lending Transactions – Under the provisions of State statutes, the City lends securities to broker-dealers and other entities (borrowers) for collateral that will be returned for the same securities in the future. One of the City’s custodial banks manage the securities lending program and received both cash and domestic bonds as collateral. The collateral securities cannot be pledged nor sold by the City unless the borrower defaults. Collateral securities are initially pledged at 102 % of the market value of the securities lent and this collateral is adjusted weekly to maintain the 102% level. The City’s Pension Plans authorize the lending of domestic bonds and equity securities. The cash collateral is invested in commingled short-term fixed income accounts. The City, as a program participant, assumes the risk that (a) the overnight investment will not equal or exceed the rebate rate, (b) a loss of principal in the overnight investment, and (c) the collateral will not be sufficient if called upon to repurchase the lost security. As of June 30, 2006, the City has approximately $278,462,990 of securities in the securities lending program and has incurred no loss through its participation in this program and has no anticipated risk exposure.
B. Receivables The City entered into a Lease, Assignment, and Operating Agreement with the Birmingham Airport Authority. Under the lease portion of the agreement, the Authority leased the entire airport facility and operation with net assets of $16,490,000 for a term of fifty years beginning September 16, 1986. The lease, which has been properly recognized as a direct financing lease, has been recorded in the General Fund financial statements at the minimum lease payments. The following is a schedule of minimum rentals to be received for the periods ending June 30 (in thousands):

CITY OF BIRMINGHAM Notes to the Financial Statements
June 30, 2006
48
Year Amount 2007 96 2008 92
Total minimum lease payments 188 Less amount representing interest (8) Present value of minimum lease payments $180
C. Capital Assets Capital asset activity for the year ended June 30, 2006 was as follows (in thousands):
June 30, June 30, 2005 Increases Decreases 2006 Governmental activities: Capital assets, nondepreciable: Land $134,401 57 134,344 Construction in progress 13,115 4,043 2,038 15,120 Land, infrastructure projects 15,220 465 15,685 Total nondepreciable capital assets 162,736 4,508 2,095 165,149 Capital assets, depreciable: Buildings & capital facilities 192,517 3 488 192,032 Furniture & other equipment 140,958 12,850 1,748 152,060 Infrastructure 163,715 4,390 168,105 Total depreciable capital assets 497,190 17,243 2,236 512,197 Less accumulated depreciation: Buildings & capital facilities 87,298 2,995 176 90,117 Furniture & other equipment 108,181 7,131 1,503 113,809 Infrastructure 89,261 5,637 94,898 Total accumulated depreciation 284,740 15,763 1,679 298,824 Net depreciable capital assets 212,450 1,480 557 213,373 Governmental activities, net capital assets $375,186 5,988 2,652 378,522
Note: Beginning balance for accumulated depreciation on buildings was increased by $54,031 to correct a coding error that occurred when GASB34 was implemented whereby some of the City’s buildings that were fully depreciated did not have the depreciation properly recorded. Additionally, the beginning balance for land was increased by $88,241 to capture the cost of ROW the City acquired for the period of 1980-2002.

CITY OF BIRMINGHAM Notes to the Financial Statements
June 30, 2006
49
Business-type activities:
Buildings & other capital facilities $1,025 1,025 Furniture & other equipment 2,039 198 2,237 Total capital assets 3,064 198 3,262 Less accumulated depreciation: Buildings & other capital facilities 297 20 307 Furniture & other equipment 2,003 2,003 Total accumulated depreciation 2,300 20 2,320 Business-type activities, net capital assets $764 178 942
Depreciation expense was charged to the following functions (in thousands): Governmental activities: Public safety, including depreciation of infrastructure assets $9,196 Streets and sanitation 2,094 Cultural and recreation 1,202 General government 3,271 Total depreciation - governmental activities $15,763 Business-type activities: E-911 operations $20 D. Interfunds receivable, payable, and transfers The City uses interfund receivables/payables to record interfund reimbursements that arise when one fund reimburses another fund for costs incurred on its behalf. The composition of interfund balances as of June 30, 2006, is as follows (in thousands):
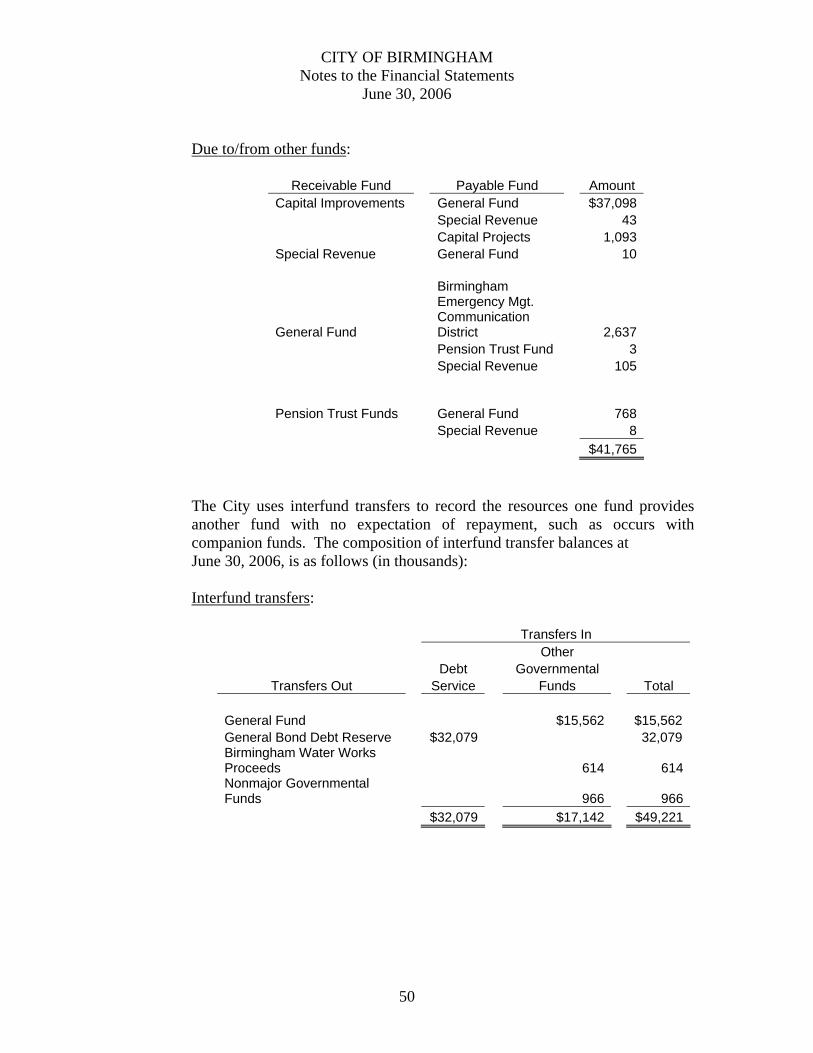
CITY OF BIRMINGHAM Notes to the Financial Statements
June 30, 2006
50
Due to/from other funds:
Receivable Fund Payable Fund Amount Capital Improvements General Fund $37,098 Special Revenue 43 Capital Projects 1,093 Special Revenue General Fund 10
General Fund
Birmingham Emergency Mgt. Communication District 2,637
Pension Trust Fund 3 Special Revenue 105 Pension Trust Funds General Fund 768 Special Revenue 8 $41,765
The City uses interfund transfers to record the resources one fund provides another fund with no expectation of repayment, such as occurs with companion funds. The composition of interfund transfer balances at June 30, 2006, is as follows (in thousands): Interfund transfers:
Transfers In Other Debt Governmental
Transfers Out Service Funds Total General Fund $15,562 $15,562 General Bond Debt Reserve $32,079 32,079 Birmingham Water Works Proceeds 614 614Nonmajor Governmental Funds 966 966 $32,079 $17,142 $49,221
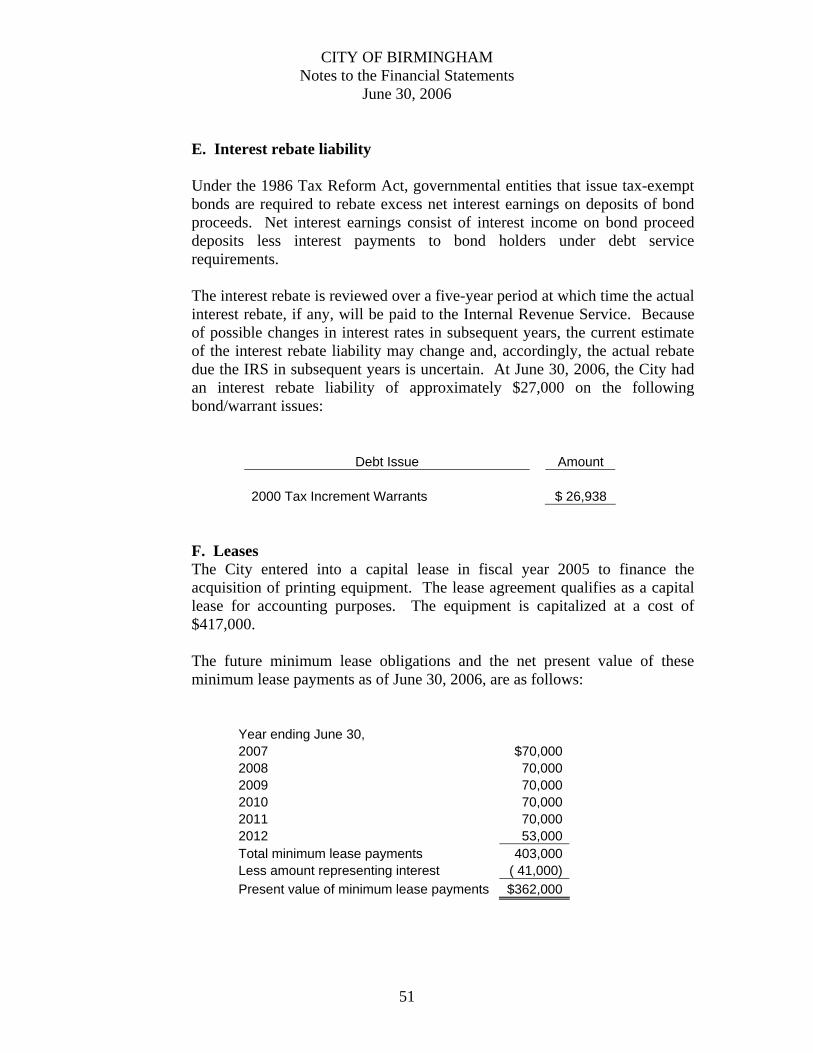
CITY OF BIRMINGHAM Notes to the Financial Statements
June 30, 2006
51
E. Interest rebate liability
Under the 1986 Tax Reform Act, governmental entities that issue tax-exempt bonds are required to rebate excess net interest earnings on deposits of bond proceeds. Net interest earnings consist of interest income on bond proceed deposits less interest payments to bond holders under debt service requirements. The interest rebate is reviewed over a five-year period at which time the actual interest rebate, if any, will be paid to the Internal Revenue Service. Because of possible changes in interest rates in subsequent years, the current estimate of the interest rebate liability may change and, accordingly, the actual rebate due the IRS in subsequent years is uncertain. At June 30, 2006, the City had an interest rebate liability of approximately $27,000 on the following bond/warrant issues:
Debt Issue Amount 2000 Tax Increment Warrants $ 26,938
F. Leases The City entered into a capital lease in fiscal year 2005 to finance the acquisition of printing equipment. The lease agreement qualifies as a capital lease for accounting purposes. The equipment is capitalized at a cost of $417,000. The future minimum lease obligations and the net present value of these minimum lease payments as of June 30, 2006, are as follows:
Year ending June 30, 2007 $70,000 2008 70,000 2009 70,000 2010 70,000 2011 70,000 2012 53,000 Total minimum lease payments 403,000 Less amount representing interest ( 41,000)Present value of minimum lease payments $362,000

CITY OF BIRMINGHAM Notes to the Financial Statements
June 30, 2006
52
The City entered into a capital lease in fiscal year 2006 to finance the acquisition of a new financial reporting and human resource/payroll computer system. The future minimum lease obligations and the net present value of these minimum lease payments as of June 30, 2006, are as follows:
Year ending June 30, 2007 $405,000 2008 405,000 2009 405,000 2010 405,000 2011 270,000 Total minimum lease payments 1,890,000 Less amount representing interest ( 156,000) Present value of minimum lease payments $1,734,000
G. Long-term debt General obligation bonds The City issues general obligation bonds to provide funds for the acquisition and/or construction of capital assets. The bonds are direct obligations of the City, and the full faith and credit of the City is pledged against the bonds. The bonds outstanding at June 30, 2006, are as follows (in thousands):
1977 A-M; 4%-8% $2,960 1996; 3.75%-5.25% 4,000 1997-A; variable rate 61,735 1997-B, A-E; 4.5%-5.375% 3,790 1998-A, A-B; 3.7%-5.125% 8,875 1999-A; 3.1%-5.0% 21,225 1999-B; 3.5%-5.75% 14,260 2001-A; 2.3%-5.75% 58,725 2002-A; 5%-5.5% 31,690 2002-B; 2.25%-5.25% 74,430 2005-A; 3.75%-5.75% 28,230 $309,920

CITY OF BIRMINGHAM Notes to the Financial Statements
June 30, 2006
53
Annual debt service requirements to maturity for general obligation bonds are as follows (in thousands):
June 30, Principal Interest 2007 16,335 15,582 2008 16,390 15,083 2009 17,190 14,268 2010 18,125 13,325 2011 19,030 12,370
2012-2016 100,290 45,273 2017-2021 59,445 20,425 2022-2026 23,325 12,542 2027-2031 26,930 6,719 2032-2033 12,860 651
$309,920 $156,537 On November 14, 2005, the City issued $28,230,000 in refunding bonds, Series 2005-A. The proceeds of the issue were used to retire a portion of the City’s outstanding General Obligation Bonds, Series 1999-B, and a portion of the City’s outstanding General Obligation Bonds, Series 1997-B. Interest rates range from 3.75%-5.75, and the bonds mature on November 1, 2023. The City realized a net present value benefit of $972,506 on the advance refunding. General obligation warrants and revenue warrants: The City issues general obligation warrants for the same purposes as general obligation bonds. The warrants are also direct obligations of the City for which it pledges its full faith and credit. Under state statute, general obligation warrants can be issued without an election and must be issued for a period of maturity of not longer than thirty years. Revenue warrants are tax increment financing district warrants in which ad valorem taxes are collected to fund the debt service. The warrants outstanding at June 30, 2006 are as follows (in thousands):
1997; 3.8%-5.0% $5,1801998-A; variable rate 5,535 1998-B; variable rate 26,875 2000-A; 4.3%-5.5% 50,520 2001-B; 5%-5.5% 11,795 2001-C; 4%-5.75% 20,800 2003-A; 1.7%-5.25% 17,520 2003-B; 1.2%-5% 28,445 2004-A; variable rate 22,7502004-B; 2.3%-4% 8,015 $197,435
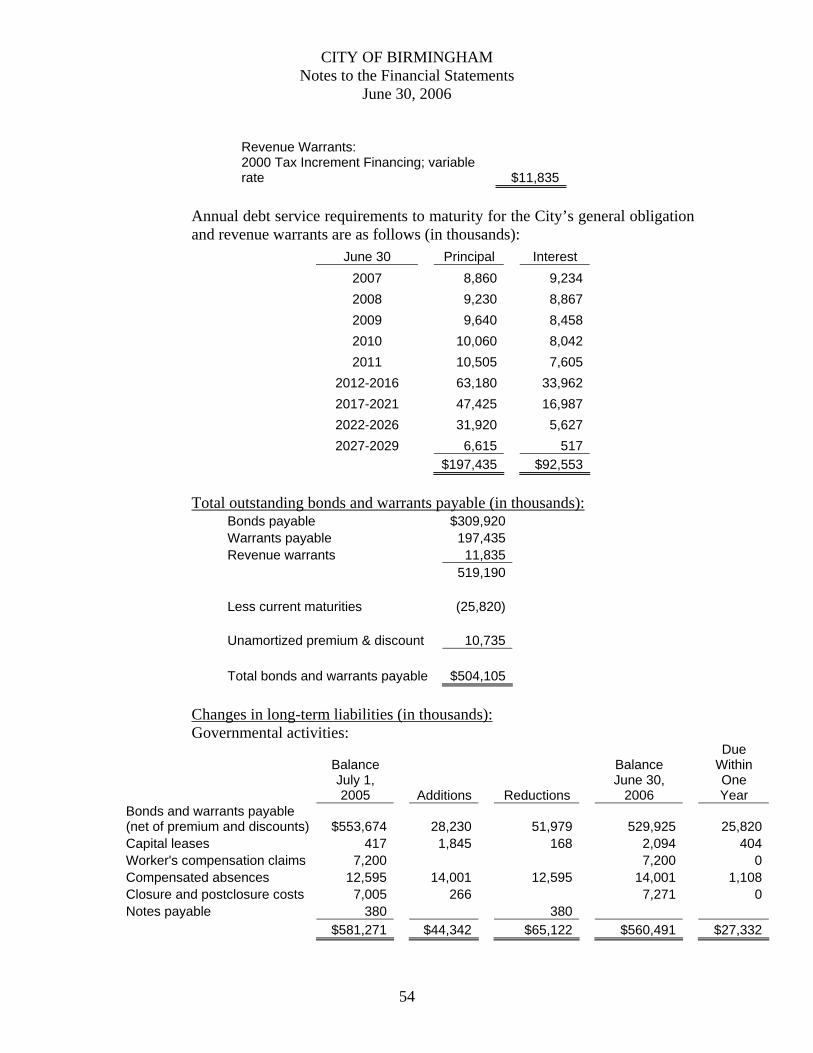
CITY OF BIRMINGHAM Notes to the Financial Statements
June 30, 2006
54
Revenue Warrants: 2000 Tax Increment Financing; variable rate $11,835
Annual debt service requirements to maturity for the City’s general obligation and revenue warrants are as follows (in thousands):
June 30 Principal Interest 2007 8,860 9,234 2008 9,230 8,867 2009 9,640 8,458 2010 10,060 8,042 2011 10,505 7,605
2012-2016 63,180 33,962 2017-2021 47,425 16,987 2022-2026 31,920 5,627 2027-2029 6,615 517
$197,435 $92,553 Total outstanding bonds and warrants payable (in thousands):
Bonds payable $309,920Warrants payable 197,435Revenue warrants 11,835 519,190 Less current maturities (25,820) Unamortized premium & discount 10,735 Total bonds and warrants payable $504,105
Changes in long-term liabilities (in thousands): Governmental activities:
Balance Balance Due
Within
July 1, 2005 Additions Reductions
June 30, 2006
One Year
Bonds and warrants payable (net of premium and discounts) $553,674 28,230 51,979 529,925 25,820Capital leases 417 1,845 168 2,094 404Worker's compensation claims 7,200 7,200 0Compensated absences 12,595 14,001 12,595 14,001 1,108Closure and postclosure costs 7,005 266 7,271 0Notes payable 380 380 $581,271 $44,342 $65,122 $560,491 $27,332

CITY OF BIRMINGHAM Notes to the Financial Statements
June 30, 2006
55
The City’s general fund is typically used to liquidate long-term liabilities with the exception of the debt which is paid from the City’s debt service fund. H. Risk Management The City of Birmingham is exposed to various risks of loss related to torts, theft, errors and omissions, job-related illnesses and injuries, and natural disasters. Risk management is the process of managing the City’s activities to minimize the adverse effects of certain types of losses and to obtain finances to provide for or restore the economic damages of those losses. The City finances its risk through self-insurance (risk retention) and through the purchase of insurance with a commercial insurance carrier (risk transfer). The City funds the dental expense reimbursement plan that provides coverage up to a maximum of $1,000 for each covered individual per claim year. The plan is financed by City and employee contributions. Settled claims have not exceeded the self-insured retention in any of the past three fiscal years. At June 30, the estimated liability for claims and changes in the liability from the preceding fiscal year were as follows (in thousands):
Current
Year Claims and Beginning Changes in Claim Ending
June 30 Liability Estimates Payments Liability 2006 $0 698 698 $0 2005 $0 720 720 $0 2004 $0 697 697 $0
The City covers all workers’ compensation claims out of its General Fund resources. Claims expenditures and liabilities are reported when it is probable that a loss has occurred and the amount of loss can be reasonably estimated. At June 30, the amount of the incurred but not reported liability for the past three fiscal years is as follows (in thousands):
Current
Year Claims and Beginning Changes in Claim Ending
June 30 Liability Estimates Payments Liability 2006 $7,200 0 0 $7,200 2005 $7,200 0 0 $7,200 2004 $7,200 0 0 $7,200
The City covers all claims expenditures out of its General Fund resources. Claims expenditures and liabilities are reported when it is probable that a loss

CITY OF BIRMINGHAM Notes to the Financial Statements
June 30, 2006
56
has occurred, and the amount of that loss can be reasonably estimated. These losses include an estimate of claims that have been incurred but not reported. At June 30, 2006, the amount of these liabilities totaled $2.725 million. The liability is the City’s best estimate based on available information. Changes in the General Fund’s claims liability amount in the last three fiscal years are as follows (in thousands):
Current
Year Claims and Beginning Changes in Claim Ending
June 30 Liability Estimates Payments Liability 2006 $3,144 (759) 1,178 $2,7252005 $3,975 1,768 2,599 $3,1442004 $7,792 (1,806) 2,011 $3,975
I. Commitments and Contingencies
The City of Birmingham is required by Act 232 of the 1977 Alabama Legislature to pay the Birmingham Jefferson County Transit Authority an amount equal to 10% of the ad valorem taxes collected for the County on property located within the municipality. Such amount was approximately $3,000,000 for the 2006 fiscal year. The City entered into an agreement with Jefferson County and the Birmingham-Jefferson County Civic Center Authority (BJCCA) for the improvement of the Civic Center facilities. Under the agreement, both the City and the County agreed to appropriate, pledge, and pay to the BJCCA an annual amount of tax revenue proceeds for the retirement of debt and for financing Civic Center improvements. The City is committed to expend $3,000,000 of tax revenue for twenty years beginning in 1992. The City is a joint participant in the West Jefferson Amusement and Public Park Authority (the Authority) along with ten other municipalities in Jefferson County, Alabama. The Authority provides for the joint and cooperative development of the VisionLand Amusement Park. The City and the Authority entered into a funding agreement whereby the City agreed to pay to the Authority the sum of $5,000,000 in annual installments of $1,000,000 beginning October 15, 1999, through and including October 15, 2004, for the purpose of assisting the Authority in the payment of bonds used to construct the VisionLand Amusement Park. The funding agreement has provisions which obligate the City to pay to the Authority the additional sum of $1,000,000 annually by October 15 of each year, beginning October 15, 2004, unless the City gives notice by September 30 of each year, that it will not renew its obligation for that additional year. As of June 30, 2003, the Authority defaulted on its long-term debt payments to bondholders and other
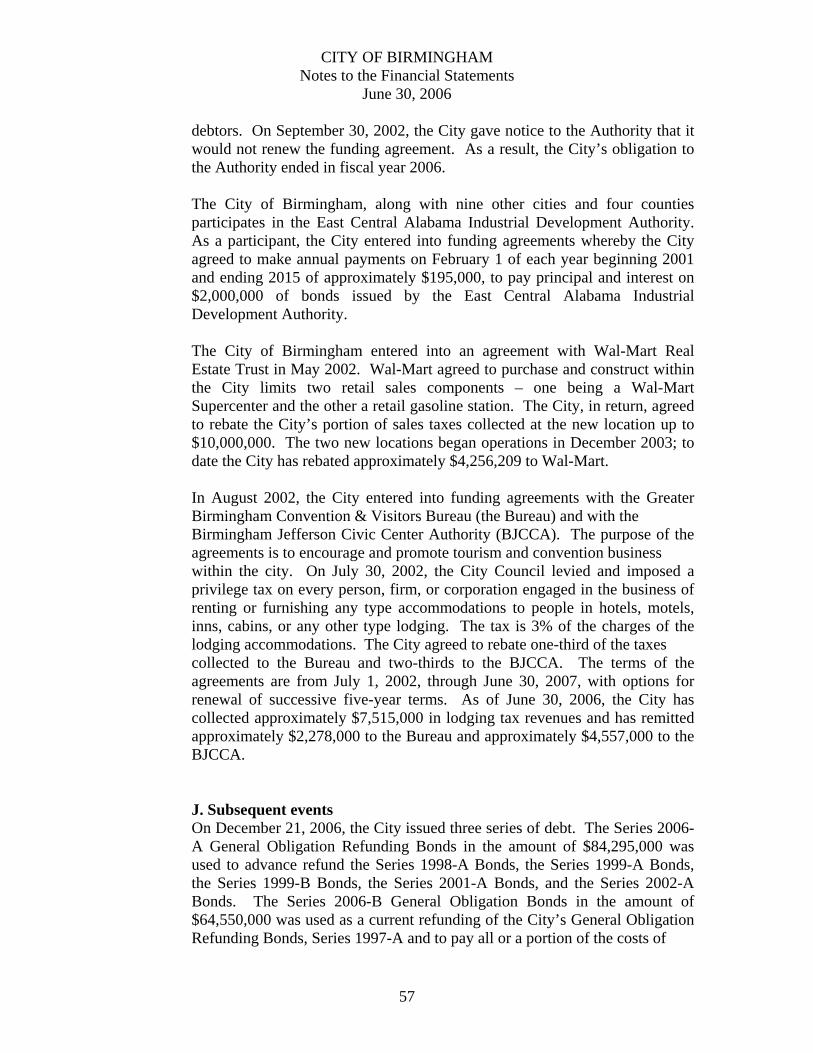
CITY OF BIRMINGHAM Notes to the Financial Statements
June 30, 2006
57
debtors. On September 30, 2002, the City gave notice to the Authority that it would not renew the funding agreement. As a result, the City’s obligation to the Authority ended in fiscal year 2006. The City of Birmingham, along with nine other cities and four counties participates in the East Central Alabama Industrial Development Authority. As a participant, the City entered into funding agreements whereby the City agreed to make annual payments on February 1 of each year beginning 2001 and ending 2015 of approximately $195,000, to pay principal and interest on $2,000,000 of bonds issued by the East Central Alabama Industrial Development Authority. The City of Birmingham entered into an agreement with Wal-Mart Real Estate Trust in May 2002. Wal-Mart agreed to purchase and construct within the City limits two retail sales components – one being a Wal-Mart Supercenter and the other a retail gasoline station. The City, in return, agreed to rebate the City’s portion of sales taxes collected at the new location up to $10,000,000. The two new locations began operations in December 2003; to date the City has rebated approximately $4,256,209 to Wal-Mart. In August 2002, the City entered into funding agreements with the Greater Birmingham Convention & Visitors Bureau (the Bureau) and with the Birmingham Jefferson Civic Center Authority (BJCCA). The purpose of the agreements is to encourage and promote tourism and convention business within the city. On July 30, 2002, the City Council levied and imposed a privilege tax on every person, firm, or corporation engaged in the business of renting or furnishing any type accommodations to people in hotels, motels, inns, cabins, or any other type lodging. The tax is 3% of the charges of the lodging accommodations. The City agreed to rebate one-third of the taxes collected to the Bureau and two-thirds to the BJCCA. The terms of the agreements are from July 1, 2002, through June 30, 2007, with options for renewal of successive five-year terms. As of June 30, 2006, the City has collected approximately $7,515,000 in lodging tax revenues and has remitted approximately $2,278,000 to the Bureau and approximately $4,557,000 to the BJCCA. J. Subsequent events On December 21, 2006, the City issued three series of debt. The Series 2006-A General Obligation Refunding Bonds in the amount of $84,295,000 was used to advance refund the Series 1998-A Bonds, the Series 1999-A Bonds, the Series 1999-B Bonds, the Series 2001-A Bonds, and the Series 2002-A Bonds. The Series 2006-B General Obligation Bonds in the amount of $64,550,000 was used as a current refunding of the City’s General Obligation Refunding Bonds, Series 1997-A and to pay all or a portion of the costs of
CITY OF BIRMINGHAM Notes to the Financial Statements
June 30, 2006
58
certain fees payable with respect to assignment of the City’s position in the Interest Rate Swap. The Series 2006-C General Obligation Parking Improvement Warrants in the amount of $24,740,000 will be used to construct a new public parking deck and to make improvements and repairs to other off-street parking facilities. K. Closure and post closure cost State and federal laws and regulations require the City to place a final cover on its landfill sites when it stops accepting waste and to perform certain maintenance and monitoring functions at the sites for thirty years after closure. Although closure and postclosure costs will be paid only near or after the date that the landfill stops accepting waste, the City reports a portion of the estimated closure and postclosure cost liability as a long-term liability. The liability is increased or decreased each period based on landfill capacity used as of each balance sheet date. The approximate $7 million reported as closure and postclosure care liability at June 30, 2006, represents the cumulative amount reported to date based on the use of approximately 95 percent of the estimated capacity of the landfill. The City will decrease the existing liability by approximately $1.1 million as the remaining estimated capacity is filled. These amounts are based on what it would cost to perform all closure and postclosure care in 2006. Actual costs may be higher due to inflation, changes in technology, and/or changes in regulations. L. Pension Funds The City of Birmingham maintains seven single employer defined benefit pension plans covering substantially all employees. These plans consist of the Retirement and Relief System, Firemen’s and Policemen’s Supplemental Pension System, Firemen’s Pension and Relief System, Policemen’s Pension and Relief System, Limited Firemen’s Retirement and Relief, Limited Policemen’s Retirement and Relief, and the Unclassified Employees Pension and Relief System. Each of the seven plans was established by state law and is administered by a separate board of managers. Plan Description The funding methods and determination of benefits payable were established by the legislative acts creating such plans and provide that the pension plans’ funds are to be accumulated from employee contributions, employer contributions, and income from the investment of accumulated funds. The cost of administering the plans is funded by the City. The City acts as the

CITY OF BIRMINGHAM Notes to the Financial Statements
June 30, 2006
59
trustee for six of these plans. Separate financial statements are presented in this report for the pension funds. The two plans listed below are funded by contributions from employees, the City, and income from the investment of accumulated funds: City of Birmingham Retirement and Relief System – This system covers all civil service employees, elected officials, and appointed employees. Membership is mandatory for covered employees and is effective upon employment. Appointed employees have the option of participating in this plan or in an alternative retirement plan. The City and employees each contribute one-half of the required contribution payable as a percent of compensation for the year, exclusive of overtime and subject to statutory limits. Current membership as of the last actuarial valuation of July 1, 2005, was 3,802 active members, 231 inactive members, 1,810 retired service pensioners, and 429 beneficiaries. City of Birmingham Firemen’s and Policemen’s Supplemental Pension System- This system covers sworn firemen and policemen and provides retirement benefits for twenty or twenty-five years of service. Membership is mandatory for such personnel and is effective upon employment. Employees hired prior to May 2, 1978, contribute 3.3% of payroll, exclusive of overtime; those hired on or subsequent to May 2, 1978, contribute 5.22% and the City matches these amounts. Current membership as of the last actuarial valuation of July 1, 2005, was 1,417 active members, 164 retired service pensioners, and 84 beneficiaries. The membership of the five plans listed below is closed and are funded by City contributions approximately equal to current benefit payments. City of Birmingham Unclassified Employees Pension and Relief System – This system covers laborers not hired under civil service. Employees contribute $10.00 bi-weekly. The City is required by City ordinance to contribute a sum, computed as a percentage of payroll, to fund the annual cost of the unfunded liability over thirty years. There are currently 8 active members and 49 pensioners including 2 beneficiaries. Firemen’s Pension and Relief Fund – This system covers firemen employed prior to September 1939. All participants are currently retired and receiving benefits. Funding is provided by a tax of 1 ½% of premiums on fire insurance on property in Birmingham and by City contributions. Retired members include 10 beneficiaries.

CITY OF BIRMINGHAM Notes to the Financial Statements
June 30, 2006
60
Policemen’s Pension and Relief Fund – This system covers policemen employed prior to September 1939. There are 7 beneficiaries currently in the plan. Limited Firemen’s Retirement and Relief System – This system covers certain designated firemen formerly members of the Firemen’s Pension and Relief Fund. Current membership includes 1 service pensioner and 5 beneficiaries. Limited Policemen’s Retirement and Relief System – This system covers certain designated policemen formerly members of the Policemen’s Pension and Relief Fund. Current membership includes 1 service pensioners and 5 beneficiaries. Post-Retirement Benefits In addition to the pension benefits described above, the City provides post-retirement health care benefits to retired employees who are eligible for pension benefits. The plan requires retirees to reduce their life insurance coverage, which retirees are required to pay in its entirety, and in exchange, the City will subsidize a portion of the retirees’ health insurance premiums. The amount of the subsidy is based on the type of health insurance coverage chosen by retirees and the percentage of the retirees’ life insurance reduction. The City’s subsidy for each covered retired employee ranges from $30 to $121 per month, and total insurance premiums range from $12 to $34 per month for dental insurance, and $116 to $953 for medical insurance. Currently, there are 2,568 retired members. Expenditures for post-retirement health care insurance costs are made and recognized monthly. Summary of Significant Accounting Policies The activities and the financial statements of the pension plans are accounted for on the accrual basis of accounting. Plan member contributions are recognized in the period in which the contributions are due. The City’s contributions are recognized when due and a formal commitment to provide the contributions has been made. Benefits and refunds are recognized when due and payable in accordance with the terms of the plan. Each pension plan’s cash assets are invested in equity and fixed-income securities. All plan assets are reported at fair value. Investments traded on the national exchange are valued at the last reported sales price on the government’s balance sheet date. Actuarial valuations are performed annually, and the latest are all dated July 1, 2004. The plans do not issue stand-alone financial reports, and all required disclosures are included in this report.
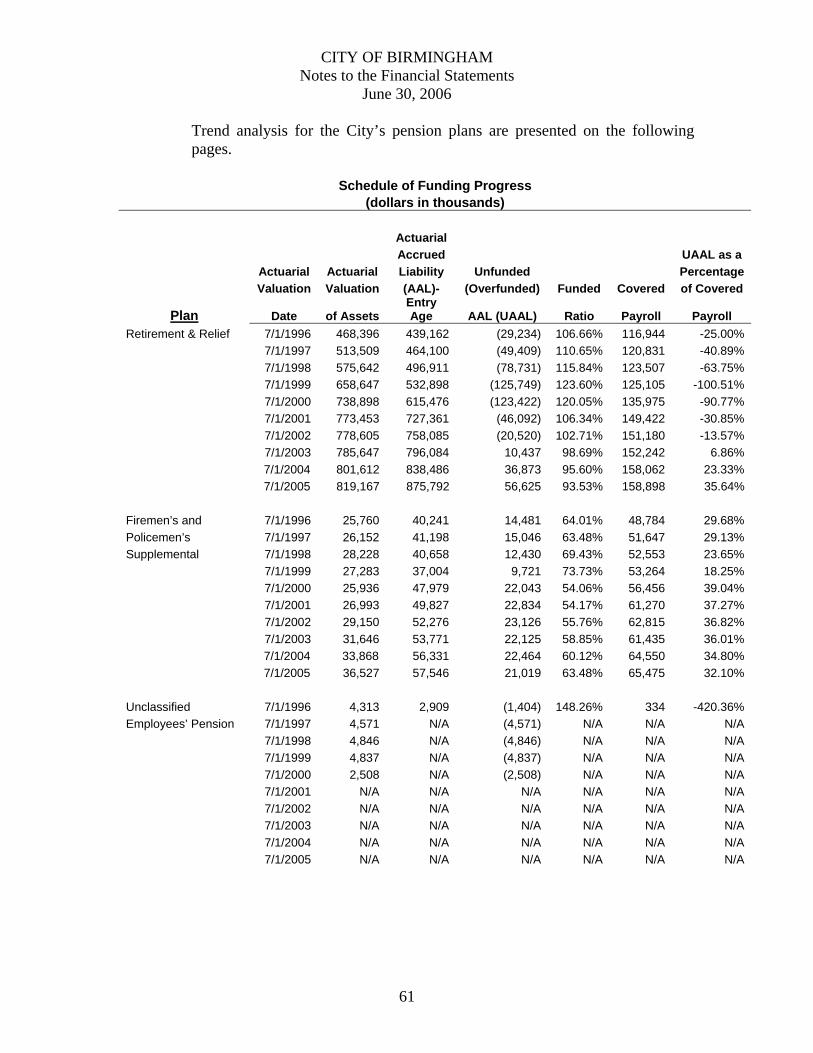
CITY OF BIRMINGHAM Notes to the Financial Statements
June 30, 2006
61
Trend analysis for the City’s pension plans are presented on the following pages.
Schedule of Funding Progress (dollars in thousands)
Actuarial Accrued UAAL as a Actuarial Actuarial Liability Unfunded Percentage Valuation Valuation (AAL)- (Overfunded) Funded Covered of Covered
Plan Date of Assets Entry Age AAL (UAAL) Ratio Payroll Payroll
Retirement & Relief 7/1/1996 468,396 439,162 (29,234) 106.66% 116,944 -25.00% 7/1/1997 513,509 464,100 (49,409) 110.65% 120,831 -40.89% 7/1/1998 575,642 496,911 (78,731) 115.84% 123,507 -63.75% 7/1/1999 658,647 532,898 (125,749) 123.60% 125,105 -100.51% 7/1/2000 738,898 615,476 (123,422) 120.05% 135,975 -90.77% 7/1/2001 773,453 727,361 (46,092) 106.34% 149,422 -30.85% 7/1/2002 778,605 758,085 (20,520) 102.71% 151,180 -13.57% 7/1/2003 785,647 796,084 10,437 98.69% 152,242 6.86% 7/1/2004 801,612 838,486 36,873 95.60% 158,062 23.33% 7/1/2005 819,167 875,792 56,625 93.53% 158,898 35.64% Firemen’s and 7/1/1996 25,760 40,241 14,481 64.01% 48,784 29.68% Policemen’s 7/1/1997 26,152 41,198 15,046 63.48% 51,647 29.13% Supplemental 7/1/1998 28,228 40,658 12,430 69.43% 52,553 23.65% 7/1/1999 27,283 37,004 9,721 73.73% 53,264 18.25% 7/1/2000 25,936 47,979 22,043 54.06% 56,456 39.04% 7/1/2001 26,993 49,827 22,834 54.17% 61,270 37.27% 7/1/2002 29,150 52,276 23,126 55.76% 62,815 36.82% 7/1/2003 31,646 53,771 22,125 58.85% 61,435 36.01% 7/1/2004 33,868 56,331 22,464 60.12% 64,550 34.80% 7/1/2005 36,527 57,546 21,019 63.48% 65,475 32.10% Unclassified 7/1/1996 4,313 2,909 (1,404) 148.26% 334 -420.36% Employees’ Pension 7/1/1997 4,571 N/A (4,571) N/A N/A N/A 7/1/1998 4,846 N/A (4,846) N/A N/A N/A 7/1/1999 4,837 N/A (4,837) N/A N/A N/A 7/1/2000 2,508 N/A (2,508) N/A N/A N/A 7/1/2001 N/A N/A N/A N/A N/A N/A 7/1/2002 N/A N/A N/A N/A N/A N/A 7/1/2003 N/A N/A N/A N/A N/A N/A 7/1/2004 N/A N/A N/A N/A N/A N/A 7/1/2005 N/A N/A N/A N/A N/A N/A

CITY OF BIRMINGHAM Notes to the Financial Statements
June 30, 2006
62
Schedule of Funding Progress (continued) (dollars in thousands)
Actuarial Accrued UAAL as a Actuarial Actuarial Liability Unfunded Percentage Valuation Valuation (AAL)- (Overfunded) Funded Covered of Covered
Plan Date of Assets Entry Age AAL (UAAL) Ratio Payroll Payroll
Firemen's Pension & 7/1/1996 2,285 1,273 (1,012) 179.50% N/A N/A Relief 7/1/1997 2,913 1,106 (1,807) 263.38% N/A N/A 7/1/1998 2,922 987 (1,935) 296.05% N/A N/A 7/1/1999 3,443 820 (2,623) 419.88% N/A N/A 7/1/2000 4,178 642 (3,536) 650.78% N/A N/A 7/1/2001 4,692 600 (4,092) 782.00% N/A N/A 7/1/2002 5,800 1,187 (4,613) 488.63% N/A N/A 7/1/2003 5,731 561 (5,170) 1021.57% N/A N/A 7/1/2004 6,189 501 (5,688) 1235.30% N/A N/A 7/1/2005 6,677 468 (6,209) 1426.71% N/A N/A Policemen's Pension & 7/1/1996 513 513 0 0.00% N/A N/A Relief 7/1/1997 433 433 0 0.00% N/A N/A 7/1/1998 384 384 0 0.00% N/A N/A 7/1/1999 334 334 0 0.00% N/A N/A 7/1/2000 282 282 0 0.00% N/A N/A 7/1/2001 302 302 0 0.00% N/A N/A 7/1/2002 226 226 0 0.00% N/A N/A 7/1/2003 0 186 186 0.00% N/A N/A 7/1/2004 0 159 159 0.00% N/A N/A 7/1/2005 0 129 129 0.00% N/A N/A Limited Firemen’s 7/1/1996 539 539 0 0.00% N/A N/A Retirement & Relief 7/1/1997 473 473 0 0.00% N/A N/A 7/1/1998 400 400 0 0.00% N/A N/A 7/1/1999 382 382 0 0.00% N/A N/A 7/1/2000 341 341 0 0.00% N/A N/A 7/1/2001 298 298 0 0.00% N/A N/A 7/1/2002 284 284 0 0.00% N/A N/A 7/1/2003 0 130 130 0.00% N/A N/A 7/1/2004 0 123 123 0.00% N/A N/A 7/1/2005 0 128 128 0.00% N/A N/A Limited Policemen's 7/1/1996 745 745 0 0.00% N/A N/A Retirement & Relief 7/1/1997 621 621 0 0.00% N/A N/A 7/1/1998 521 521 0 0.00% N/A N/A 7/1/1999 403 403 0 0.00% N/A N/A 7/1/2000 419 419 0 0.00% N/A N/A 7/1/2001 397 397 0 0.00% N/A N/A 7/1/2002 361 361 0 0.00% N/A N/A 7/1/2003 0 278 278 0.00% N/A N/A 7/1/2004 0 239 239 0.00% N/A N/A 7/1/2005 0 201 201 0.00% N/A N/A

CITY OF BIRMINGHAM Notes to the Financial Statements
June 30, 2006
63
Schedule of Employer Contributions
City of Birmingham Retirement & Relief Firemen's & Policemen's Supplemental
Annual Annual Fiscal Year Required Percentage Fiscal Year Required Percentage
End June 30, Contribution Contribution End June
30, Contribution Contribution 1996 8,574,845 100.00% 1996 1,485,656 100.00% 1997 9,327,208 100.00% 1997 1,725,118 100.00% 1998 6,621,250 100.00% 1998 1,704,350 100.00% 1999 8,157,000 100.00% 1999 1,734,200 100.00% 2000 7,073,900 100.00% 2000 1,757,550 100.00% 2001 10,151,206 100.00% 2001 2,371,000 100.00% 2002 8,580,579 100.00% 2002 2,756,102 100.00% 2003 9,756,787 100.00% 2003 2,722,342 100.00% 2004 11,290,871 100.00% 2004 2,570,134 100.00% 2005 12,875,198 84.5% 2005 2,647,128 100.00%
Unclassified Employees' Pension Firemen's Pension & Relief Annual Annual
Fiscal Year Required Percentage Fiscal Year Required Percentage
End June 30, Contribution Contribution End June
30, Contribution Contribution 1996 2,583 100.00% 1996 0 100.00% 1997 2,076 100.00% 1997 0 100.00% 1998 0 100.00% 1998 0 100.00% 1999 0 100.00% 1999 0 100.00% 2000 0 100.00% 2000 0 100.00% 2001 0 100.00% 2001 0 100.00% 2002 0 100.00% 2002 0 100.00% 2003 0 100.00% 2003 0 100.00% 2004 0 100.00% 2004 0 100.00% 2005 0 100.00% 2005 0 100.00%
Policemen's Pension & Relief Limited Firemen's Retirement & Relief
Annual Annual Fiscal Year Required Percentage Fiscal Year Required Percentage
End June 30, Contribution Contribution End June
30, Contribution Contribution 1996 123,230 100.00% 1996 104,592 100.00% 1997 101,229 100.00% 1997 103,711 100.00% 1998 90,100 100.00% 1998 96,700 100.00% 1999 82,700 100.00% 1999 88,100 100.00% 2000 67,686 100.00% 2000 84,461 100.00% 2001 70,759 100.00% 2001 75,381 100.00% 2002 66,425 100.00% 2002 69,862 100.00% 2003 57,585 100.00% 2003 51,953 100.00% 2004 51,617 100.00% 2004 34,926 100.00% 2005 42,714 100.00% 2005 34,450 100.00%
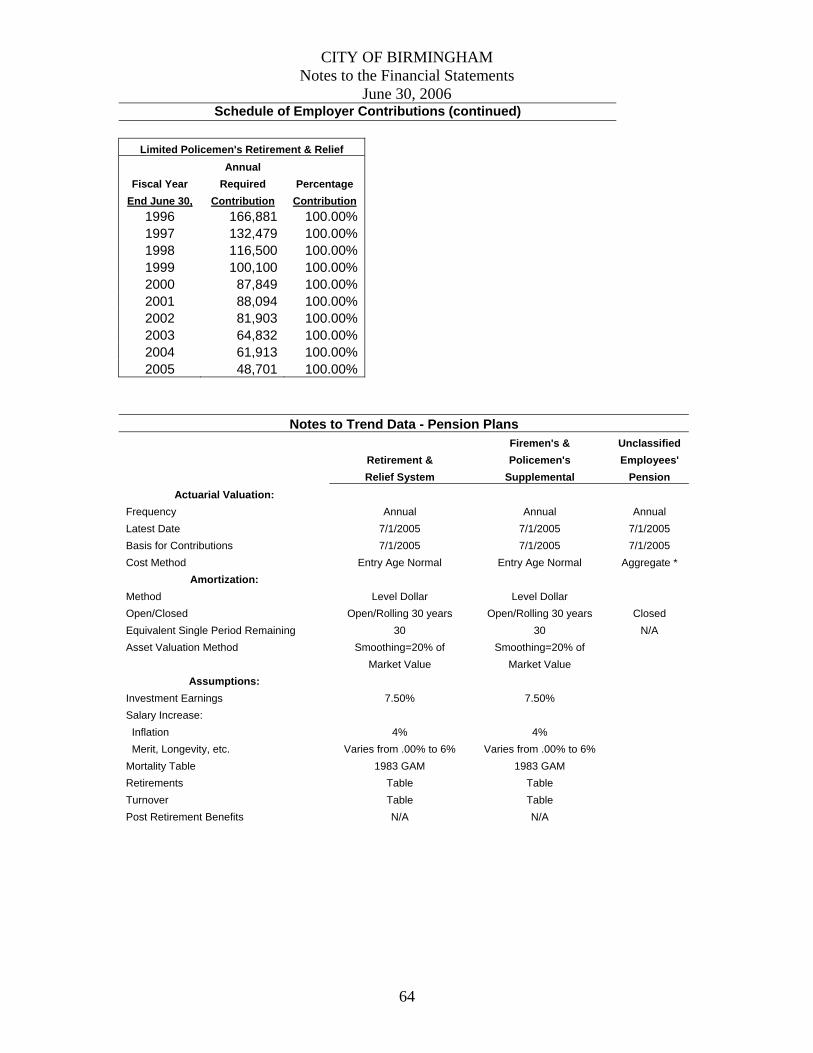
CITY OF BIRMINGHAM Notes to the Financial Statements
June 30, 2006
64
Schedule of Employer Contributions (continued)
Limited Policemen's Retirement & Relief Annual
Fiscal Year Required Percentage End June 30, Contribution Contribution
1996 166,881 100.00% 1997 132,479 100.00% 1998 116,500 100.00% 1999 100,100 100.00% 2000 87,849 100.00% 2001 88,094 100.00% 2002 81,903 100.00% 2003 64,832 100.00% 2004 61,913 100.00% 2005 48,701 100.00%
Notes to Trend Data - Pension Plans Firemen's & Unclassified Retirement & Policemen's Employees' Relief System Supplemental Pension
Actuarial Valuation: Frequency Annual Annual Annual Latest Date 7/1/2005 7/1/2005 7/1/2005 Basis for Contributions 7/1/2005 7/1/2005 7/1/2005 Cost Method Entry Age Normal Entry Age Normal Aggregate *
Amortization: Method Level Dollar Level Dollar Open/Closed Open/Rolling 30 years Open/Rolling 30 years Closed Equivalent Single Period Remaining 30 30 N/A Asset Valuation Method Smoothing=20% of Smoothing=20% of Market Value Market Value
Assumptions: Investment Earnings 7.50% 7.50% Salary Increase: Inflation 4% 4% Merit, Longevity, etc. Varies from .00% to 6% Varies from .00% to 6% Mortality Table 1983 GAM 1983 GAM Retirements Table Table Turnover Table Table Post Retirement Benefits N/A N/A

CITY OF BIRMINGHAM Notes to the Financial Statements
June 30, 2006
65
Notes to Trend Data - Pension Plans (continued)
Firemen's Policemen's Limited Firemen's Limited
Policemen's Pension & Relief Pension & Relief Retirement & Relief Retirement & Relief
Actuarial Valuation: Frequency Annual Annual Annual Annual Latest Date 7/1/2005 7/1/2005 7/1/2005 7/1/2005
Basis for Contributions 7/1/20
05 7/1/2005 7/1/2005 7/1/2005
Cost Method Funded Frozen
Plan Frozen with Additional
Frozen with Additional
Frozen with Additional
Benefit Payments Benefit Payments Benefit Payments Amortization:
Method N/A N/A N/A N/A Open/Closed Closed Closed Closed Closed Equivalent Single Period Remaining N/A N/A N/A N/A Asset Valuation Method N/A N/A N/A N/A
Assumptions: Investment Earnings 7% 7% 7% 7% Salary Increase: Inflation N/A N/A N/A N/A Merit, Longevity, etc. N/A N/A N/A N/A Mortality Table 1971 GAM 1971 GAM 1971 GAM 1971 GAM Retirements N/A N/A N/A N/A Turnover N/A N/A N/A N/A Post Retirement Benefits N/A N/A N/A N/A
* For the Unclassified Plan, the aggregate actuarial cost method does not identify or
separately amortize any unfunded actuarial accrued liabilities.

City of Birmingham, AlabamaCombining Statement of Fiduciary Net Assets
Pension Trust FundsJune 30, 2006(in thousands)
Firemen's and Limited Limited UnclassifiedRetirement Policemen's Firemen's Policemen's Firemen's Policemen's Employeesand Relief Supplemental Pension Pension Retirement & Retirement & Pension &
System Pension System and Relief and Relief Relief System Relief System Relief System TotalASSETS:Cash and cash equivalents $46,679 $10,402 $7,214 $1 $3 $1,770 $66,069Receivables: Members 1,798 578 2,376 Member loans 10,877 10,877 Interest and dividends 5,730 253 3 5,986Due from other funds 581 194 1 776Investments, at fair value: U. S. Government obligations 276,523 19,060 295,583 Domestic corporate bonds 151,961 7,203 159,164 Domestic stocks 420,309 490 420,799
TOTAL ASSETS 914,458 38,180 7,214 1 1 3 1,773 961,630
LIABILITIESAccounts payable and other 1,663 111 1 3 1,778
NET ASSETSHeld in trust for future pension benefits $912,795 $38,069 $7,213 $1 $1 $0 $1,773 $959,852
66
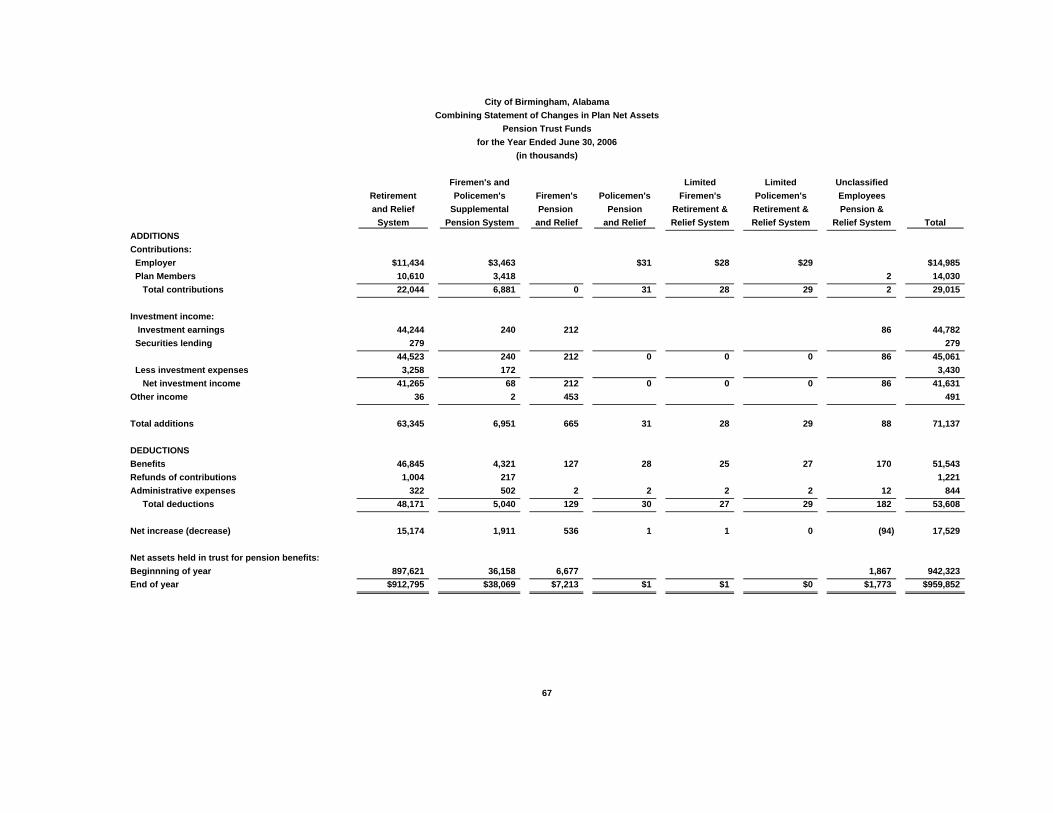
City of Birmingham, AlabamaCombining Statement of Changes in Plan Net Assets
Pension Trust Fundsfor the Year Ended June 30, 2006
(in thousands)
Firemen's and Limited Limited UnclassifiedRetirement Policemen's Firemen's Policemen's Firemen's Policemen's Employeesand Relief Supplemental Pension Pension Retirement & Retirement & Pension &
System Pension System and Relief and Relief Relief System Relief System Relief System TotalADDITIONSContributions: Employer $11,434 $3,463 $31 $28 $29 $14,985 Plan Members 10,610 3,418 2 14,030 Total contributions 22,044 6,881 0 31 28 29 2 29,015
Investment income: Investment earnings 44,244 240 212 86 44,782 Securities lending 279 279
44,523 240 212 0 0 0 86 45,061 Less investment expenses 3,258 172 3,430 Net investment income 41,265 68 212 0 0 0 86 41,631Other income 36 2 453 491
Total additions 63,345 6,951 665 31 28 29 88 71,137
DEDUCTIONSBenefits 46,845 4,321 127 28 25 27 170 51,543Refunds of contributions 1,004 217 1,221Administrative expenses 322 502 2 2 2 2 12 844 Total deductions 48,171 5,040 129 30 27 29 182 53,608
Net increase (decrease) 15,174 1,911 536 1 1 0 (94) 17,529
Net assets held in trust for pension benefits:Beginnning of year 897,621 36,158 6,677 1,867 942,323End of year $912,795 $38,069 $7,213 $1 $1 $0 $1,773 $959,852
67

OTHER SUPPLEMENTARY INFORMATION
69

City of Birmingham, AlabamaGeneral Fund
Schedule of Revenues, Expenditures, and EncumbrancesBudget and Actual
for the year ended June 30, 2006
Revenues: Budget Actual Over (Under)Taxes: Budget
Sales and use:Sales $87,500 $86,324 ($1,176)Use 20,500 22,761 2,261
108,000 109,085 1,085Occupational:
Occupational tax 70,750 72,297 1,547
Property:County tax collection 22,600 23,015 415County director of revenue 1,700 1,851 151County tax collector 150 123 (27)State of Alabama 60 96 36Library .5 mill tax 1,080 1,083 3
25,590 26,168 578Total taxes 204,340 207,549 3,209
Licenses and permits:Business:
General 32,100 32,665 565Public utilities 14,790 14,791 1Beer - wholesale 1 1 0Beer retail 26 26 0Liquor 860 939 79Liquor and wine 140 144 4Table wine tax 190 179 (11)Lease or rental tax 6,400 6,205 (195)
54,507 54,951 444Nonbusiness:
Building permits 4,313 5,241 928Electrical inspection fees 72 137 65Elevator permits 0 24 24Plumbing permits 17 18 1Gas permits 26 18 (8)Blasting permits 1 0 (0)Engineering permits 1 0 (1)Excavation permits 10 34 24Clearing and earthwork permits 25 27 2Billboard permits 35 49 14Mechanical permits 15 20 5Dance permits 35 31 (5)Other 10 13 3
4,559 5,613 1,054Total licenses and permits 59,066 60,564 1,497
Fines and forfeitures:Municipal court fines 1,700 1,649 (51)Traffic citations 1,600 1,506 (94)Partial payments 925 863 (62)False Alarm Fine 10 3 (7)Library 165 160 (5)
Total fines and forfeitures 4,400 4,181 (219)
70

City of Birmingham, AlabamaGeneral Fund
Schedule of Revenues, Expenditures, and EncumbrancesBudget and Actual
for the year ended June 30, 2006
Budget Actual Over (Under)Budget
Intergovernmental revenue:Shared from local units:
County gasoline tax 1,850 1,902 52County tobacco tax 375 295 (80)County road tax 2,200 2,388 188County library contributions 272 272 0Sales tax on sale of used cars 506 457 (49)State-wide uniform beer tax 1,735 1,707 (28)
6,938 7,021 83Shared state revenue:
Bank excise tax 1,400 1,658 258Motor vehicle license 700 731 31Share of State liquor profits 200 214 14State table wine tax 3 1 (2)Interstate Regulatory Plan registration fees 475 337 (138)Liquor store sales tax 240 264 24Alabama trust fund 1,464 1,422 (42)Business privilege tax 2,656 2,667 11Oil production privilege tax 35 68 33
7,173 7,364 191Other:
Civil Defense 26 46 20Industrial Development Board 110 65 (45)County Animal Control Contribution 30 0 (30)Indirect cost reimbursement - C.D. 250 175 (75)
416 286 (130)Total intergovernmental revenue 14,527 14,671 144
Charges for services:Culture and recreation:
Admission fees 44 46 2Concessions 270 139 (131)Parking 300 321 21Rent 490 433 (57)Gifts 16 12 (4)Lunches 26 24 (2)Miscellaneous 1 3 2
1,147 977 (170)Highways and streets:
Streets, sidewalks, and curbs 10 7 (3)Parking meters 1,300 1,295 (5)Street vacation fees 200 404 204
1,510 1,706 196
71
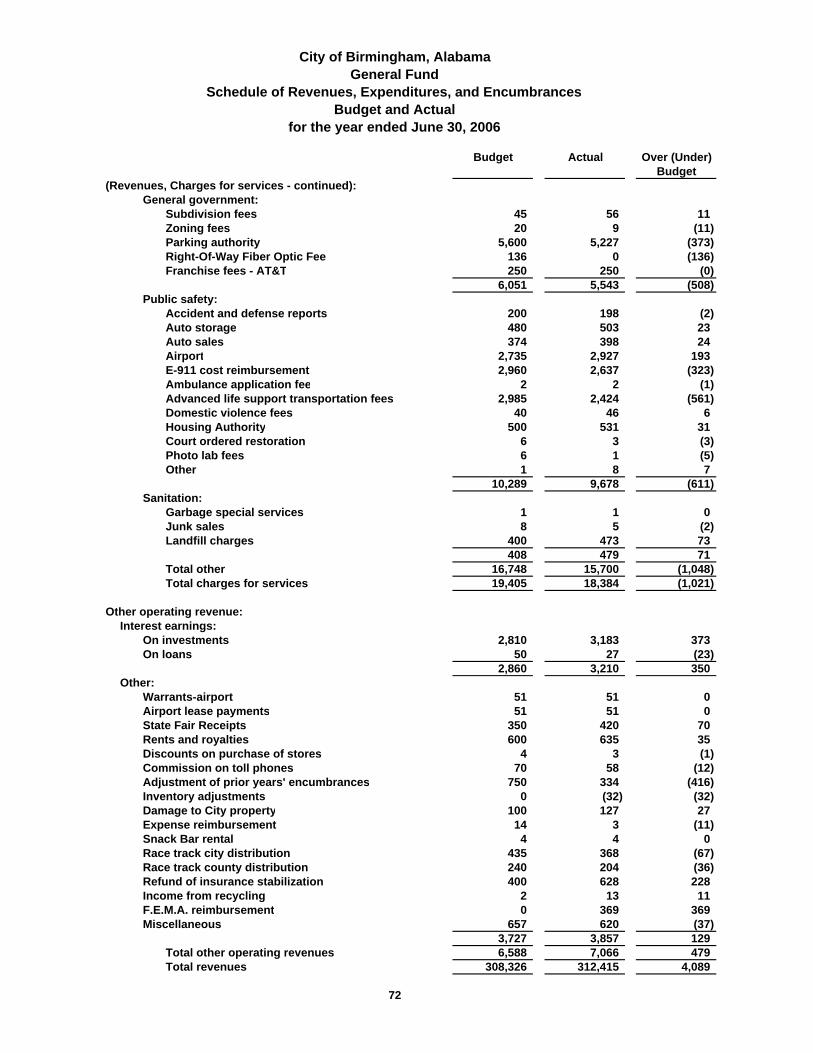
City of Birmingham, AlabamaGeneral Fund
Schedule of Revenues, Expenditures, and EncumbrancesBudget and Actual
for the year ended June 30, 2006
Budget Actual Over (Under)Budget
(Revenues, Charges for services - continued):General government:
Subdivision fees 45 56 11Zoning fees 20 9 (11)Parking authority 5,600 5,227 (373)Right-Of-Way Fiber Optic Fee 136 0 (136)Franchise fees - AT&T 250 250 (0)
6,051 5,543 (508)Public safety:
Accident and defense reports 200 198 (2)Auto storage 480 503 23Auto sales 374 398 24Airport 2,735 2,927 193E-911 cost reimbursement 2,960 2,637 (323)Ambulance application fee 2 2 (1)Advanced life support transportation fees 2,985 2,424 (561)Domestic violence fees 40 46 6Housing Authority 500 531 31Court ordered restoration 6 3 (3)Photo lab fees 6 1 (5)Other 1 8 7
10,289 9,678 (611)Sanitation:
Garbage special services 1 1 0Junk sales 8 5 (2)Landfill charges 400 473 73
408 479 71Total other 16,748 15,700 (1,048)Total charges for services 19,405 18,384 (1,021)
Other operating revenue:Interest earnings:
On investments 2,810 3,183 373On loans 50 27 (23)
2,860 3,210 350Other:
Warrants-airport 51 51 0Airport lease payments 51 51 0State Fair Receipts 350 420 70Rents and royalties 600 635 35Discounts on purchase of stores 4 3 (1)Commission on toll phones 70 58 (12)Adjustment of prior years' encumbrances 750 334 (416)Inventory adjustments 0 (32) (32)Damage to City property 100 127 27Expense reimbursement 14 3 (11)Snack Bar rental 4 4 0Race track city distribution 435 368 (67)Race track county distribution 240 204 (36)Refund of insurance stabilization 400 628 228Income from recycling 2 13 11F.E.M.A. reimbursement 0 369 369Miscellaneous 657 620 (37)
3,727 3,857 129Total other operating revenues 6,588 7,066 479Total revenues 308,326 312,415 4,089
72

City of Birmingham, AlabamaGeneral Fund
Schedule of Revenues, Expenditures, and EncumbrancesBudget and Actual
for the year ended June 30, 2006
Budget Actual Over (Under)Budget
Expenditures and encumbrances:Public safety:
Police:Personnel services 68,021 65,797 (2,224)Other 8,069 8,533 464
76,090 74,330 (1,760)Fire:
Personnel services 42,623 41,845 (777)Other 4,414 5,124 710
47,037 46,970 (67)Other:
EngineeringPersonnel services 13,520 12,737 (783)Other 1,071 1,276 206
14,591 14,013 (578)Traffic engineering:
Personnel services 4,550 4,057 (493)Other 4,179 4,286 107
8,729 8,343 (387)Municipal Court:
Personnel services 3,198 3,133 (64)Other 178 157 (21)
3,375 3,290 (85)Parole Office:
Personnel services 695 663 (32)Other 11 6 (5)
706 669 (37)Nondepartmental:
TASC 34 34 0Police Pension and Relief 48 31 (17)Limited Police Retirement and Relief 50 29 (21)Limited Fire Retirement and Relief 35 28 (7)Police Community Relations 4 4 0City Action Partnership 10 10 0Jefferson County Civil Defense 231 231 0 Supplemental Retirees 431 454 23
843 821 (22)Total other 28,244 27,137 (1,107)Total public safety 151,370 148,436 (2,934)
Environment and streets:Streets and sanitation:
Personnel services 44,852 41,029 (3,824)Other 6,661 7,997 1,337
51,513 49,026 (2,487)
73
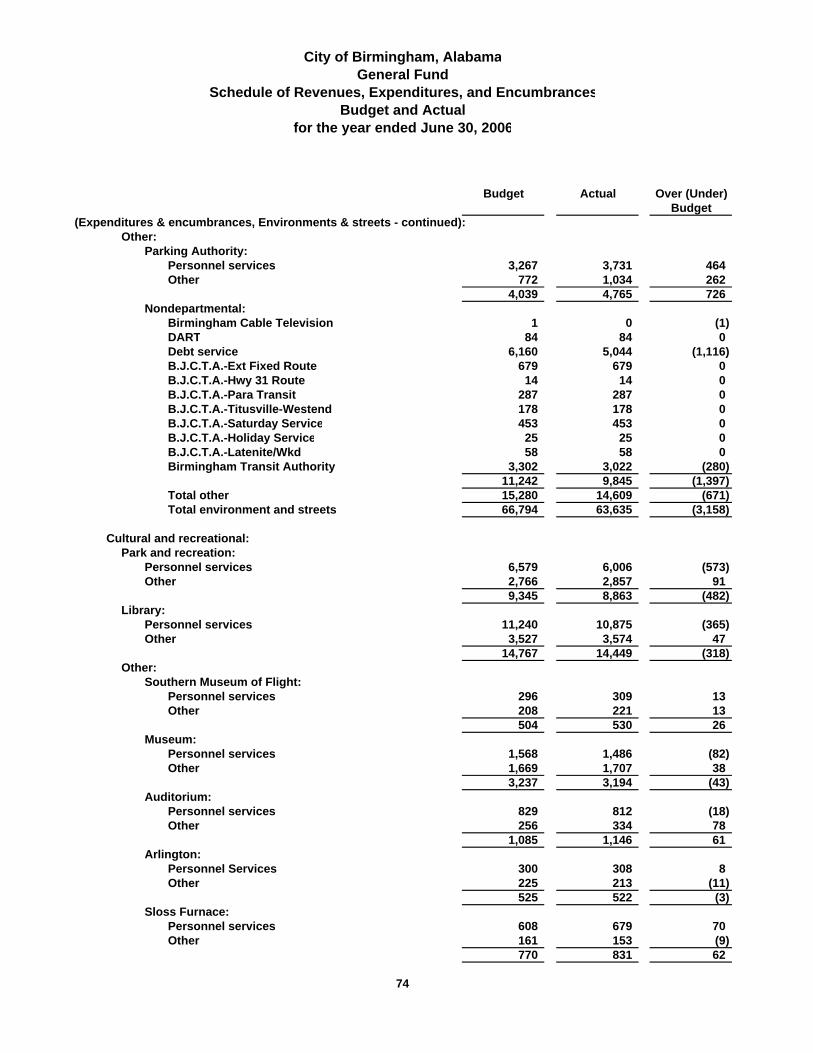
City of Birmingham, AlabamaGeneral Fund
Schedule of Revenues, Expenditures, and EncumbrancesBudget and Actual
for the year ended June 30, 2006
Budget Actual Over (Under)Budget
(Expenditures & encumbrances, Environments & streets - continued):Other:
Parking Authority:Personnel services 3,267 3,731 464Other 772 1,034 262
4,039 4,765 726Nondepartmental:
Birmingham Cable Television 1 0 (1)DART 84 84 0Debt service 6,160 5,044 (1,116)B.J.C.T.A.-Ext Fixed Route 679 679 0B.J.C.T.A.-Hwy 31 Route 14 14 0B.J.C.T.A.-Para Transit 287 287 0B.J.C.T.A.-Titusville-Westend 178 178 0B.J.C.T.A.-Saturday Service 453 453 0B.J.C.T.A.-Holiday Service 25 25 0B.J.C.T.A.-Latenite/Wkd 58 58 0Birmingham Transit Authority 3,302 3,022 (280)
11,242 9,845 (1,397)Total other 15,280 14,609 (671)Total environment and streets 66,794 63,635 (3,158)
Cultural and recreational:Park and recreation:
Personnel services 6,579 6,006 (573)Other 2,766 2,857 91
9,345 8,863 (482)Library:
Personnel services 11,240 10,875 (365)Other 3,527 3,574 47
14,767 14,449 (318)Other:
Southern Museum of Flight:Personnel services 296 309 13Other 208 221 13
504 530 26Museum:
Personnel services 1,568 1,486 (82)Other 1,669 1,707 38
3,237 3,194 (43)Auditorium:
Personnel services 829 812 (18)Other 256 334 78
1,085 1,146 61Arlington:
Personnel Services 300 308 8Other 225 213 (11)
525 522 (3)Sloss Furnace:
Personnel services 608 679 70Other 161 153 (9)
770 831 62
74
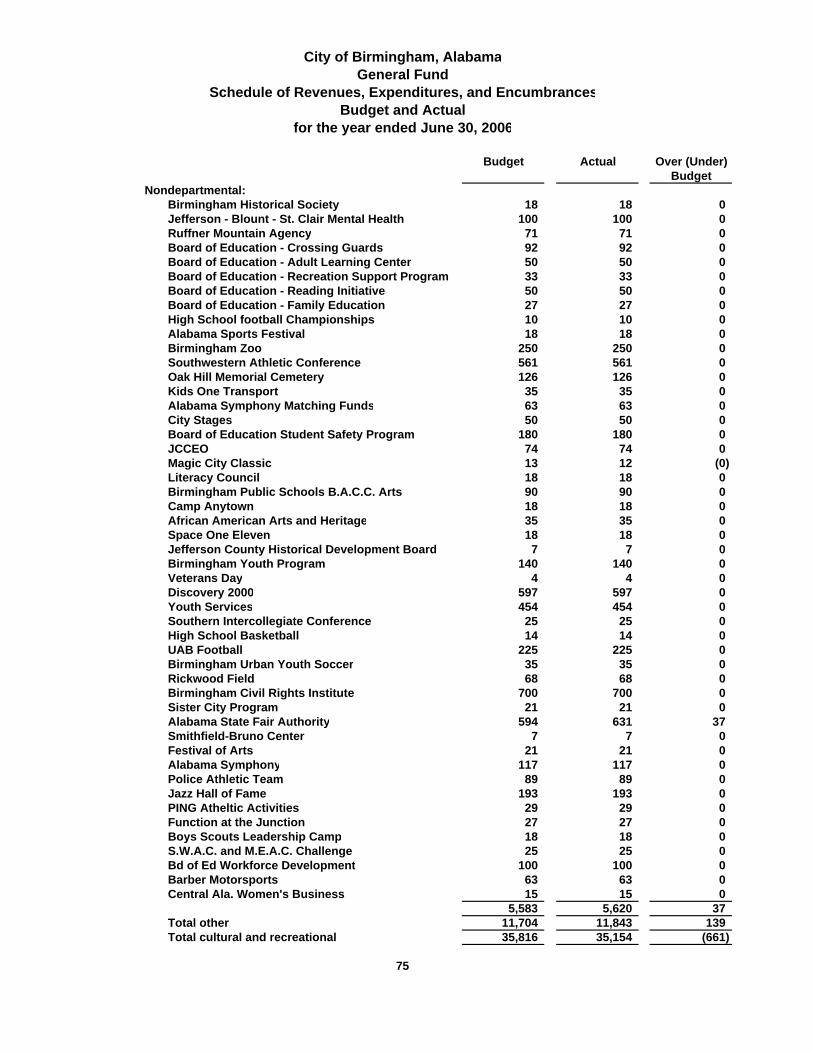
City of Birmingham, AlabamaGeneral Fund
Schedule of Revenues, Expenditures, and EncumbrancesBudget and Actual
for the year ended June 30, 2006
Budget Actual Over (Under)Budget
Nondepartmental:Birmingham Historical Society 18 18 0Jefferson - Blount - St. Clair Mental Health 100 100 0Ruffner Mountain Agency 71 71 0Board of Education - Crossing Guards 92 92 0Board of Education - Adult Learning Center 50 50 0Board of Education - Recreation Support Program 33 33 0Board of Education - Reading Initiative 50 50 0Board of Education - Family Education 27 27 0High School football Championships 10 10 0Alabama Sports Festival 18 18 0Birmingham Zoo 250 250 0Southwestern Athletic Conference 561 561 0Oak Hill Memorial Cemetery 126 126 0Kids One Transport 35 35 0Alabama Symphony Matching Funds 63 63 0City Stages 50 50 0Board of Education Student Safety Program 180 180 0JCCEO 74 74 0Magic City Classic 13 12 (0)Literacy Council 18 18 0Birmingham Public Schools B.A.C.C. Arts 90 90 0Camp Anytown 18 18 0African American Arts and Heritage 35 35 0Space One Eleven 18 18 0Jefferson County Historical Development Board 7 7 0Birmingham Youth Program 140 140 0Veterans Day 4 4 0Discovery 2000 597 597 0Youth Services 454 454 0Southern Intercollegiate Conference 25 25 0High School Basketball 14 14 0UAB Football 225 225 0Birmingham Urban Youth Soccer 35 35 0Rickwood Field 68 68 0Birmingham Civil Rights Institute 700 700 0Sister City Program 21 21 0Alabama State Fair Authority 594 631 37Smithfield-Bruno Center 7 7 0Festival of Arts 21 21 0Alabama Symphony 117 117 0Police Athletic Team 89 89 0Jazz Hall of Fame 193 193 0PING Atheltic Activities 29 29 0Function at the Junction 27 27 0Boys Scouts Leadership Camp 18 18 0S.W.A.C. and M.E.A.C. Challenge 25 25 0Bd of Ed Workforce Development 100 100 0Barber Motorsports 63 63 0Central Ala. Women's Business 15 15 0
5,583 5,620 37Total other 11,704 11,843 139Total cultural and recreational 35,816 35,154 (661)
75
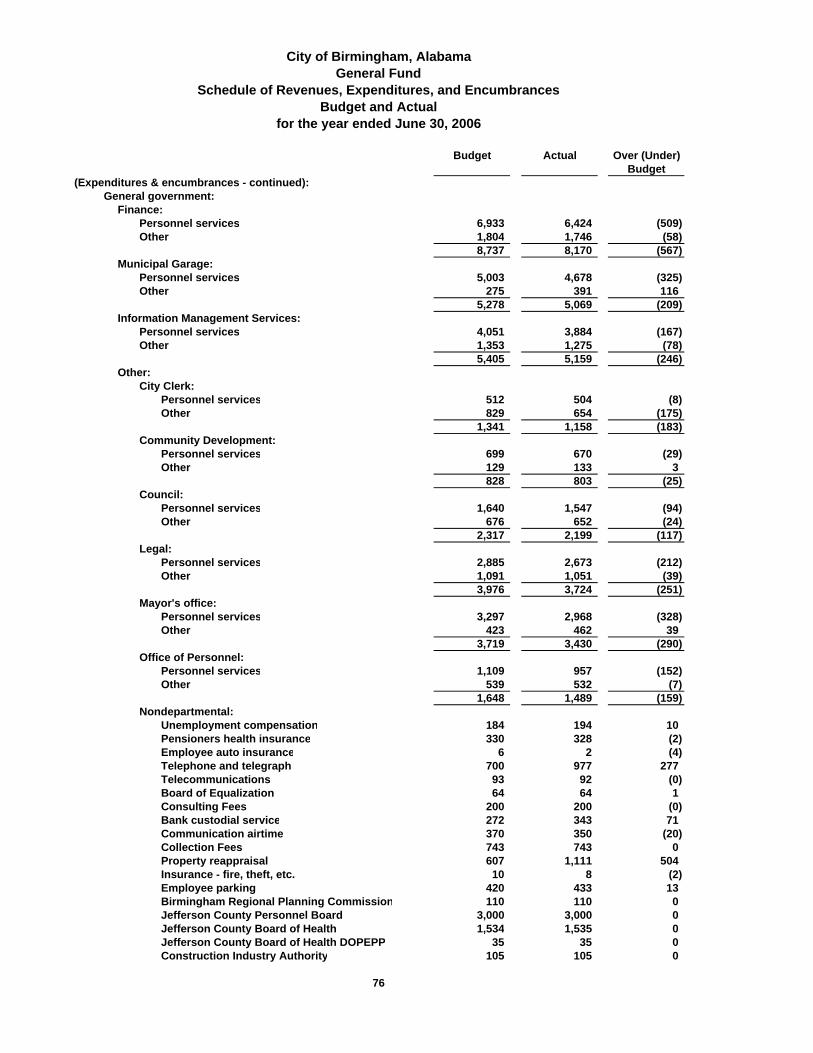
City of Birmingham, AlabamaGeneral Fund
Schedule of Revenues, Expenditures, and EncumbrancesBudget and Actual
for the year ended June 30, 2006
Budget Actual Over (Under)Budget
(Expenditures & encumbrances - continued):General government:
Finance:Personnel services 6,933 6,424 (509)Other 1,804 1,746 (58)
8,737 8,170 (567)Municipal Garage:
Personnel services 5,003 4,678 (325)Other 275 391 116
5,278 5,069 (209)Information Management Services:
Personnel services 4,051 3,884 (167)Other 1,353 1,275 (78)
5,405 5,159 (246)Other:
City Clerk:Personnel services 512 504 (8)Other 829 654 (175)
1,341 1,158 (183)Community Development:
Personnel services 699 670 (29)Other 129 133 3
828 803 (25)Council:
Personnel services 1,640 1,547 (94)Other 676 652 (24)
2,317 2,199 (117)Legal:
Personnel services 2,885 2,673 (212)Other 1,091 1,051 (39)
3,976 3,724 (251)Mayor's office:
Personnel services 3,297 2,968 (328)Other 423 462 39
3,719 3,430 (290)Office of Personnel:
Personnel services 1,109 957 (152)Other 539 532 (7)
1,648 1,489 (159)Nondepartmental:
Unemployment compensation 184 194 10Pensioners health insurance 330 328 (2)Employee auto insurance 6 2 (4)Telephone and telegraph 700 977 277Telecommunications 93 92 (0)Board of Equalization 64 64 1Consulting Fees 200 200 (0)Bank custodial service 272 343 71Communication airtime 370 350 (20)Collection Fees 743 743 0Property reappraisal 607 1,111 504Insurance - fire, theft, etc. 10 8 (2)Employee parking 420 433 13Birmingham Regional Planning Commission 110 110 0Jefferson County Personnel Board 3,000 3,000 0Jefferson County Board of Health 1,534 1,535 0Jefferson County Board of Health DOPEPP 35 35 0Construction Industry Authority 105 105 0
76

City of Birmingham, AlabamaGeneral Fund
Schedule of Revenues, Expenditures, and EncumbrancesBudget and Actual
for the year ended June 30, 2006
Budget Actual Over (Under)Budget
(Expenditures & encumbrances, General government, Nondepartmental - continued):
Birmingham Housing Authority 40 40 0Birmingham Urban League 66 66 0Crisis Center 6 6 0Southeast Police & Fire Championship 11 11 0R.E.S.P.E.C.T. Organization 7 7 0Impact Program 25 25 0Ministerial Brotherhood 18 18 0Municipal expansion 5 6 1Professional services other 260 260 0National League of Cities 11 11 0U.S. Conference of Mayors 11 11 0Alabama League of Municipalities 18 18 0A. R. C. of Jefferson County 18 18 0Alcoholism Recovery Service 11 11 0Vulcan Restoration 188 188 0Summer Youth Jobs 70 70 0JCCEO-PING 61 61 0Birmingham Aids Outreach 30 30 0Birmingham Area Technical Leadership 50 50 0Village Creek Human Justice 25 25 0Better Business Bureau of Cent. Alabama 30 30 0Housing for Mentally Ill 100 100 0Birmingham Business Network 117 117 0B.B.R.C. Administration 175 175 0B.B.R.C. Micro Lending 35 35 0Brownfield Match 35 0 (35)Development Solution 51 51 0Metropolitan Development Board 517 517 0Birmingham Foreign Trade Zone 10 0 (10)Grant Match 0 (3) (3)B.C.W.L.D.C.-SBA Micro Loan 27 27 0Greenwood Cemetery 60 60 0Vulcan Park Foundation 198 198 0Civil Rights Activist Committee 25 25 0Bd of Ed Camp Birmingham 86 86 0Operation New Birmingham 350 350 0Health Care for Homeless 59 59 0Sickle Cell Foundation 21 21 0Jefferson County Mayor's Association 24 24 0Local Government Leadership 22 22 0Environmental Center 14 14 0Birmingham Humane Society 668 668 0Planning and Zoning Commission 7 6 (2)PING operating expenses 5 5 0Birmingham Youth Jazz Ensemble 14 14 0Birmingham Regional Medical System 1 1 0Meals on Wheels 25 25 0Clergy That Care 23 23 0Land 0 1,525 1,525Damage Claims 1,597 1,178 (419)Total nondepartmental 14,006 15,912 1,906Total other 27,834 28,715 881Total general government 47,254 47,113 (141)Total expenditures and encumbrances $301,234 $294,339 ($6,895)
77
Nonmajor Governmental Funds
Special Revenue Funds
Federal Revenue Sharing Fund accounts for funds received and disbursed under Federal Revenue Sharing. Community Development Fund accounts for those funds received and used for Community Urban Development Block Grants. HUD Rental Rehabilitation Loan Fund accounts for funds used for rehabilitation of rental property. Miscellaneous Grant Fund accounts for funds arising from miscellaneous grants. Although the funds are consolidated, each grant is accounted for individually. Law Enforcement Block Grant accounts for funds received for reducing crime and improving public safety. Mortgage Subsidy Fund accounts for funds used to subsidize residential mortgages. UDAG Repayment Fund accounts for funds received in repayment of UDAG loans. HUD 108 Loan Fund accounts for funds used for economic development. Home Investment Trust Fund accounts for funds received from Housing and Urban Development to provide loans for low to moderate income housing. Other Funds represent small donations funds used to account for specific donations.
Debt Service Funds
Tax Increment Financing accounts for ad valorem taxes received from Jefferson County specifically for the repayment of the debt for the Tax Increment Financing Warrants. Tax Increment Reserve accounts for the funds with the escrow agent for the repayment of the debt for the Tax Increment Financing Warrants.
Capital Projects Funds Special Assessment Fund accounts for construction of Public Improvements which are to be paid wholly or in part from assessments levied against the property benefited by the improvements. General Obligation Bond Issues accounts for the expenditure of the proceeds from bond issues that are for capital projects. Capital Improvement Fund accounts for funds derived from specific grants and from current funds used for capital improvements. Fuel Tax Fund accounts for proceeds of a $ .04 State gasoline tax. The use of these funds is restricted for street projects. Highway Improvement Fund accounts for proceeds of a $ .07 State gasoline tax. The use of these funds is restricted for street projects.

Capital Projects Funds Industrial Park Improvement Fund accounts for proceeds from the sale of industrial park property. Capital Improvement General Obligation Warrant Fund accounts for proceeds of General Obligation Warrants designated for building and construction facilities. Street Improvement Warrant Fund accounts for proceeds of the 1988 and 1992 Street Improvement Warrants. The remaining funds presented represent the funds used to account for the proceeds from the particular General Obligation Warrant issue. 1994 General Obligation Warrant Fund 1997 General Obligation Warrant Fund 1998-A General Obligation Warrant Fund 1998-B General Obligation Warrant Fund 2004-A General Obligation Warrant Fund Tax Increment Financing Warrants Fund
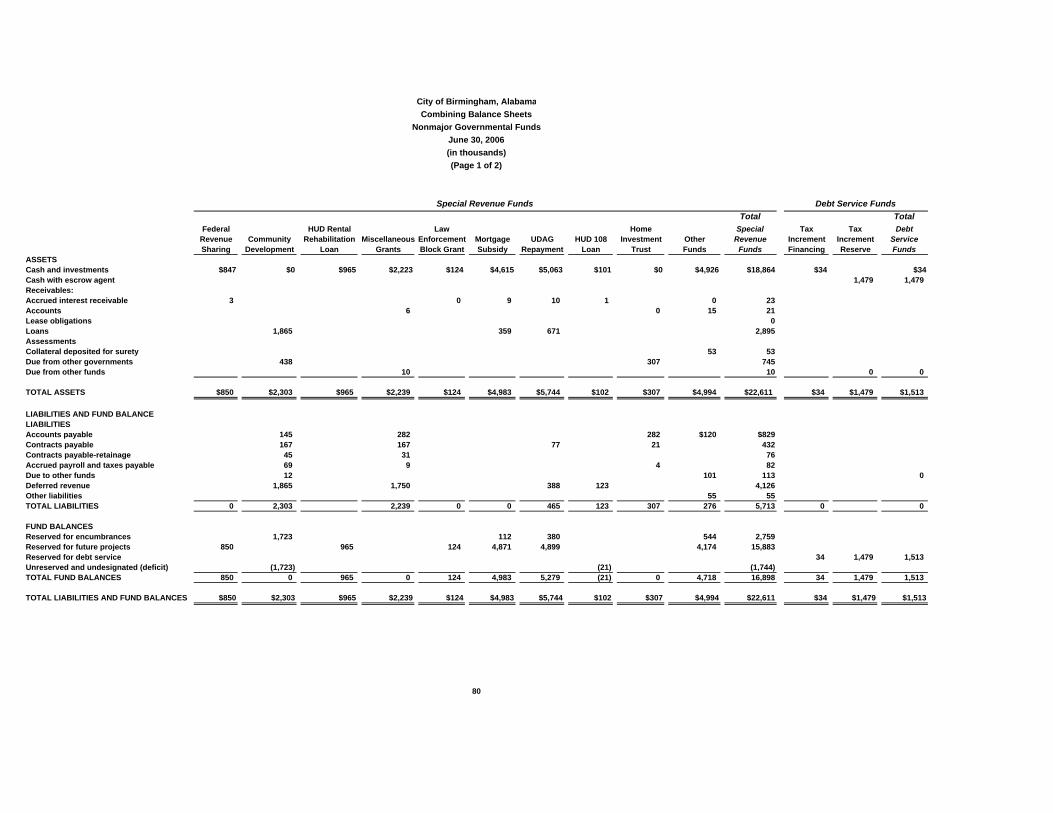
City of Birmingham, AlabamaCombining Balance Sheets
Nonmajor Governmental FundsJune 30, 2006(in thousands)(Page 1 of 2)
Special Revenue Funds Debt Service FundsTotal Total
Federal HUD Rental Law Home Special Tax Tax DebtRevenue Community Rehabilitation Miscellaneous Enforcement Mortgage UDAG HUD 108 Investment Other Revenue Increment Increment ServiceSharing Development Loan Grants Block Grant Subsidy Repayment Loan Trust Funds Funds Financing Reserve Funds
ASSETSCash and investments $847 $0 $965 $2,223 $124 $4,615 $5,063 $101 $0 $4,926 $18,864 $34 $34Cash with escrow agent 1,479 1,479Receivables:Accrued interest receivable 3 0 9 10 1 0 23Accounts 6 0 15 21Lease obligations 0Loans 1,865 359 671 2,895AssessmentsCollateral deposited for surety 53 53Due from other governments 438 307 745Due from other funds 10 10 0 0
TOTAL ASSETS $850 $2,303 $965 $2,239 $124 $4,983 $5,744 $102 $307 $4,994 $22,611 $34 $1,479 $1,513
LIABILITIES AND FUND BALANCELIABILITIES Accounts payable 145 282 282 $120 $829Contracts payable 167 167 77 21 432Contracts payable-retainage 45 31 76Accrued payroll and taxes payable 69 9 4 82Due to other funds 12 101 113 0Deferred revenue 1,865 1,750 388 123 4,126Other liabilities 55 55TOTAL LIABILITIES 0 2,303 2,239 0 0 465 123 307 276 5,713 0 0
FUND BALANCESReserved for encumbrances 1,723 112 380 544 2,759Reserved for future projects 850 965 124 4,871 4,899 4,174 15,883Reserved for debt service 34 1,479 1,513Unreserved and undesignated (deficit) (1,723) (21) (1,744)TOTAL FUND BALANCES 850 0 965 0 124 4,983 5,279 (21) 0 4,718 16,898 34 1,479 1,513
TOTAL LIABILITIES AND FUND BALANCES $850 $2,303 $965 $2,239 $124 $4,983 $5,744 $102 $307 $4,994 $22,611 $34 $1,479 $1,513
80
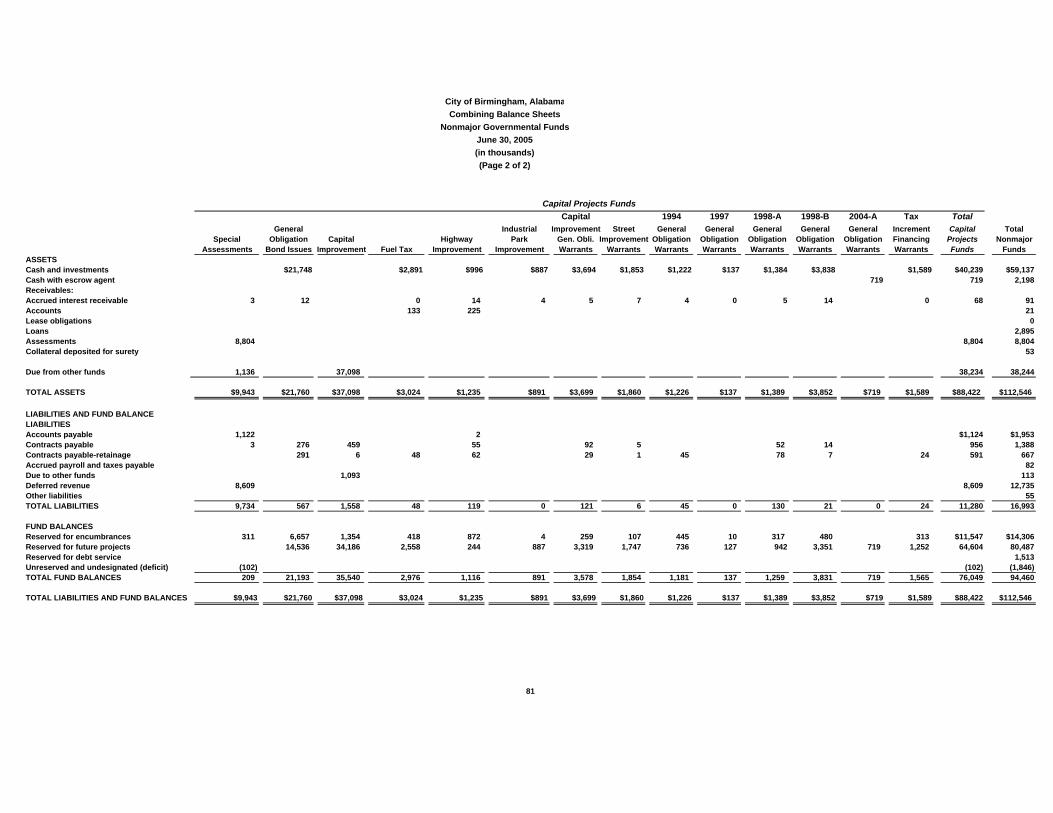
City of Birmingham, AlabamaCombining Balance Sheets
Nonmajor Governmental FundsJune 30, 2005(in thousands)(Page 2 of 2)
Capital Projects FundsCapital 1994 1997 1998-A 1998-B 2004-A Tax Total
General Industrial Improvement Street General General General General General Increment Capital TotalSpecial Obligation Capital Highway Park Gen. Obli. Improvement Obligation Obligation Obligation Obligation Obligation Financing Projects Nonmajor
Assessments Bond Issues Improvement Fuel Tax Improvement Improvement Warrants Warrants Warrants Warrants Warrants Warrants Warrants Warrants Funds FundsASSETSCash and investments $21,748 $2,891 $996 $887 $3,694 $1,853 $1,222 $137 $1,384 $3,838 $1,589 $40,239 $59,137Cash with escrow agent 719 719 2,198Receivables:Accrued interest receivable 3 12 0 14 4 5 7 4 0 5 14 0 68 91Accounts 133 225 21Lease obligations 0Loans 2,895Assessments 8,804 8,804 8,804Collateral deposited for surety 53
Due from other funds 1,136 37,098 38,234 38,244
TOTAL ASSETS $9,943 $21,760 $37,098 $3,024 $1,235 $891 $3,699 $1,860 $1,226 $137 $1,389 $3,852 $719 $1,589 $88,422 $112,546
LIABILITIES AND FUND BALANCELIABILITIES Accounts payable 1,122 2 $1,124 $1,953Contracts payable 3 276 459 55 92 5 52 14 956 1,388Contracts payable-retainage 291 6 48 62 29 1 45 78 7 24 591 667Accrued payroll and taxes payable 82Due to other funds 1,093 113Deferred revenue 8,609 8,609 12,735Other liabilities 55TOTAL LIABILITIES 9,734 567 1,558 48 119 0 121 6 45 0 130 21 0 24 11,280 16,993
FUND BALANCESReserved for encumbrances 311 6,657 1,354 418 872 4 259 107 445 10 317 480 313 $11,547 $14,306Reserved for future projects 14,536 34,186 2,558 244 887 3,319 1,747 736 127 942 3,351 719 1,252 64,604 80,487Reserved for debt service 1,513Unreserved and undesignated (deficit) (102) (102) (1,846)TOTAL FUND BALANCES 209 21,193 35,540 2,976 1,116 891 3,578 1,854 1,181 137 1,259 3,831 719 1,565 76,049 94,460
TOTAL LIABILITIES AND FUND BALANCES $9,943 $21,760 $37,098 $3,024 $1,235 $891 $3,699 $1,860 $1,226 $137 $1,389 $3,852 $719 $1,589 $88,422 $112,546
81

City of Birmingham, AlabamaCombining Statements of Revenues, Expenditures, and Changes in Fund Balances
Nonmajor Governmental FundsFor the Year Ended June 30, 2006
(in thousands)(Page 1 of 2)
Special Revenue Funds Debt Service FundsTotal Total
Federal HUD Rental Law Home Special Tax Tax DebtRevenue Community Rehabilitation Miscellaneous Enforcement Mortgage UDAG HUD 108 Investment Other Revenue Increment Increment ServiceSharing Development Loan Grants Block Grant Subsidy Repayment Loan Trust Funds Funds Financing Reserve Funds
REVENUESTaxes $518 $518Intergovernmental 5,504 10,534 3,650 19,688Investment income 24 (7) 136 180 3 165 501 2 51 53Other 194 (118) 2,133 2,209TOTAL REVENUES 24 5,504 10,534 (7) 136 374 (115) 3,650 2,298 22,398 520 51 571
EXPENDITURESCurrent:Streets and sanitation 344 344Cultural and recreation 445 116 561General government 115 4,715 10,534 130 604 3,650 1,196 20,944Total current operations 115 5,504 10,534 130 604 3,650 1,312 21,849
Debt service 947 947Capital outlays 270 270Bond issue costs
TOTAL EXPENDITURES 115 5,504 10,534 270 130 604 3,650 1,312 22,119 947 947
Excess (deficiency) of revenues over (under) expenditures (91) 0 (277) 6 (230) (115) 986 279 520 (896) (376)
Other financing sources (uses):Proceeds from sale of propertyIssuance of bondsCapital leasesPremiums on issuance of bondsPayment to escrow agentOperating transfers in 0 486 486Operating transfers out (486) (486)Total other financing sources (uses) 0 (486) 486 0
Excess (deficiency) of revenues and other sources over (under) expenditures and other uses (91) (277) 6 (230) (115) 986 279 34 (410) (376)
Fund balances, beginning of year 941 0 965 0 401 4,977 5,509 94 0 3,732 16,619 0 1,889 1,889Fund balances, end of year $850 $0 $965 $0 $124 $4,983 $5,279 ($21) $0 $4,718 $16,898 $34 $1,479 $1,513
82

City of BirminghamCombining Statements of Revenues, Expenditures, and Changes in Fund Balances
Nonmajor Governmental FundsFor the Year Ended June 30, 2006
(in thousands)(Page 2 of 2)
Capital Projects FundsCapital 1994 1997 1998-A 1998-B 2004-A Tax Total
General Industrial Improvement Street General General General General General Increment Capital TotalSpecial Obligation Capital Highway Park Gen.Obligation Improvement Obligation Obligation Obligation Obligation Obligation Financing Projects Nonmajor
Assessments Bond Issues Improvement Fuel Tax Improvement Improvement Warrants Warrants Warrants Warrants Warrants Warrants Warrants Warrants Funds FundsREVENUESTaxes $518Intergovernmental 1,566 3,348 4,914 24,602Investment income (4) 966 80 (12) (4) (46) 62 50 4 55 133 65 (41) 1,308 1,862Other 202 113 0 315 2,524TOTAL REVENUES 198 1,079 1,646 3,336 (4) (46) 62 50 4 55 133 65 (41) 6,537 29,506
EXPENDITURESCurrent:Streets and sanitation 558 193 329 557 1,637 1,981Cultural and recreation 561General government 20,944Total current operations 558 193 329 557 1,637 23,486
Debt service 3,452 691 3,271 240 7,654 8,601Capital outlays 544 22,284 9,390 51 0 1,452 470 289 3,325 37,805 38,075Warrant issue costs 541 541 541
TOTAL EXPENDITURES 544 22,825 12,842 742 3,829 0 1,692 193 329 470 289 3,325 557 47,637 70,703
Excess (deficiency) of revenues over (under) expenditures (346) (21,746) (12,842) 904 (493) (4) (1,738) (131) (279) 4 (415) (156) (3,260) (598) (41,100) (41,197)
Other financing sources (uses):582 582 582
Proceeds from sale of bonds 28,230 28,230 28,230Proceeds from sale of property 1,845 1,845 1,845Premiums on issuance of bonds 1,767 1,767 1,767Payment to escrow agent (29,456) (29,456) (29,456)Operating transfers in 1,093 15,563 16,656 17,142Operating transfers out (615) (1,093) (1,708) (2,194)Total other financing sources (uses) 478 541 16,315 582 17,916 17,916
Excess (deficiency) of revenues and other sources over (under) expenditures and other uses 132 (21,205) 3,473 904 (493) 578 (1,738) (131) (279) 4 (415) (156) (3,260) (598) (23,184) (23,281)
Fund balances, beginning of year 77 42,398 32,067 2,072 1,609 313 5,316 1,985 1,460 133 1,674 3,987 3,979 2,163 99,233 117,741Fund balances, end of year $209 $21,193 $35,540 $2,976 $1,116 $891 $3,578 $1,854 $1,181 $137 $1,259 $3,831 $719 $1,565 $76,049 $94,460
83
Statistical Section This portion of the City of Birmingham’s comprehensive financial annual report presents additional information to be used in conjunction with the preceding statements to gauge the City’s overall financial well being. Financial Trends These schedules present information on how the City’s financial performance has changed over the past five fiscal years. Revenue Capacity These schedules present information on the collection of the City’s most significant local revenue source, the sales and use tax. Debt Capacity These schedules present information on the City’s outstanding debt and its ability to issue additional debt in the future. Demographic and Economic Information These schedules present indicators of the City’s demographic and economic environment. Operating Information These schedules present data regarding the City’s services and infrastructure.

City of Birmingham, AlabamaNet Assets by Component
Last Five Fiscal Years(in thousands)
Table A-1
Fiscal Year Ended June 30,2002 2003 2004 2005 2006
Governmental activities:
Invested in capital assets, net of related debt $46,665 $78,637 $62,685 ($18,295) $53,708Restricted 93,059 117,253 114,982 361,917 205,388Unrestricted 271,655 181,986 168,581 (25,033) 24,187
Total governmental activities net assets 411,379 377,876 346,248 318,589 283,283
Business-type activities:
Invested in capital assets, net of related debt 933 871 784 764 942Unrestricted 795 844 540 290 (8)
Total business-type activities net assets 1,728 1,715 1,324 1,054 934
Primary Government:
Invested in capital assets, net of related debt 47,598 79,508 63,469 (17,531) 54,650Restricted 93,059 117,253 114,982 361,917 205,388Unrestricted 272,450 182,830 169,121 (24,743) 24,179
Total primary government net assets $413,107 $379,591 $347,572 $319,643 $284,217
Source: City Finance Department Data
85

City of Birmingham, AlabamaChanges in Net AssetsLast Five Fiscal Years
(in thousands)
Table A-2
Fiscal Year Ended June 30,2002 2003 2004 2005 2006
Expenses:Governmental activities:General government $73,183 $91,771 $84,411 $94,662 $122,163Public safety 175,491 140,226 138,260 160,097 181,014Streets & sanitation 70,472 93,381 97,657 80,229 68,749Culture & recreation 40,012 41,657 39,359 39,047 38,547Interest on long-term debt 10,633 15,115 13,179 13,000 22,414Total governmental activities expenses 369,791 382,150 372,866 387,035 432,887
Business-type activities:E-911 Services 3,196 3,168 3,471 3,258 3,157
Total primary government expenses $372,987 $385,318 $376,337 $390,293 $436,044
Program Revenues:Governmental activities:Charges for services $72,407 $72,170 $74,145 $76,482 $80,491Operating grants and contributions 20,684 13,385 18,051 13,797 8,221Total governmental activities program revenues 93,091 85,555 92,196 90,279 88,712
Business-type activities:E-911 Services 3,102 3,126 3,058 2,954 2,998
Total primary government program revenues $96,193 $88,681 $95,254 $93,233 $91,710
Net (Expense)/RevenueGovernmental activities ($276,700) ($296,595) ($280,670) ($296,756) ($344,175)Business-type activities (94) (42) (413) (304) (159)
($276,794) ($296,637) ($281,083) ($297,060) ($344,334)
General Revenues and Other Changes in Net Assets:Governmental activities: Taxes: Sales and use taxes $103,834 $101,434 $100,608 $107,271 $109,085 Occupational taxes 63,051 64,522 65,537 69,346 72,297 Property taxes 42,058 42,858 48,596 50,618 52,669 Unrestricted grants and contributions 18,101 18,249 18,434 21,618 19,585 Investment earnings 17,647 18,023 9,304 12,562 10,834 Other 25,817 18,006 6,563 7,682 10,189Total governmental activities 270,508 263,092 249,042 269,097 274,659
Business-type activities: Investment earnings 44 29 22 34 39
Total primary government $270,552 $263,121 $249,064 $269,131 $274,698
Change (decrease) in Net Assets:Governmental activities ($6,192) ($33,503) ($31,628) ($27,659) ($69,516)Business-type activities (50) (13) (391) (270) (120)Total primary government ($6,242) ($33,516) ($32,019) ($27,929) ($69,636)
Source:City Finance Department Data
86

City of Birmingham, AlabamaFund Balances, Governmental Funds
Last Five Fiscal Years(in thousands)
Table A-3
2002 2003 2004 2005 2006
General FundReserved $6,193 $6,892 $5,417 $13,969 $7,584Unreserved 85,653 81,120 78,316 60,209 70,389Total general fund $91,846 $88,012 $83,733 $74,178 $77,973
Other Governmental Funds:Reserved, reported in: Special revenue funds $102,791 $267,364 $250,697 $216,063 $160,123 Debt service funds 64,356 64,246 61,310 53,097 46,674 Capital projects funds 85,732 132,461 106,470 99,964 76,151
252,879 464,071 418,477 369,124 282,948Unreserved, reported in: Special revenue funds (3,522) (2,351) (3,618) (2,663) (1,744) Debt service funds (1,738) (2,889) (274) Capital projects funds (502) (731) (102)
(5,260) (5,240) (4,394) (3,394) (1,846)Total other governmental funds $247,619 $458,831 $414,083 $365,730 $281,102
Source: City Finance Department Data
87
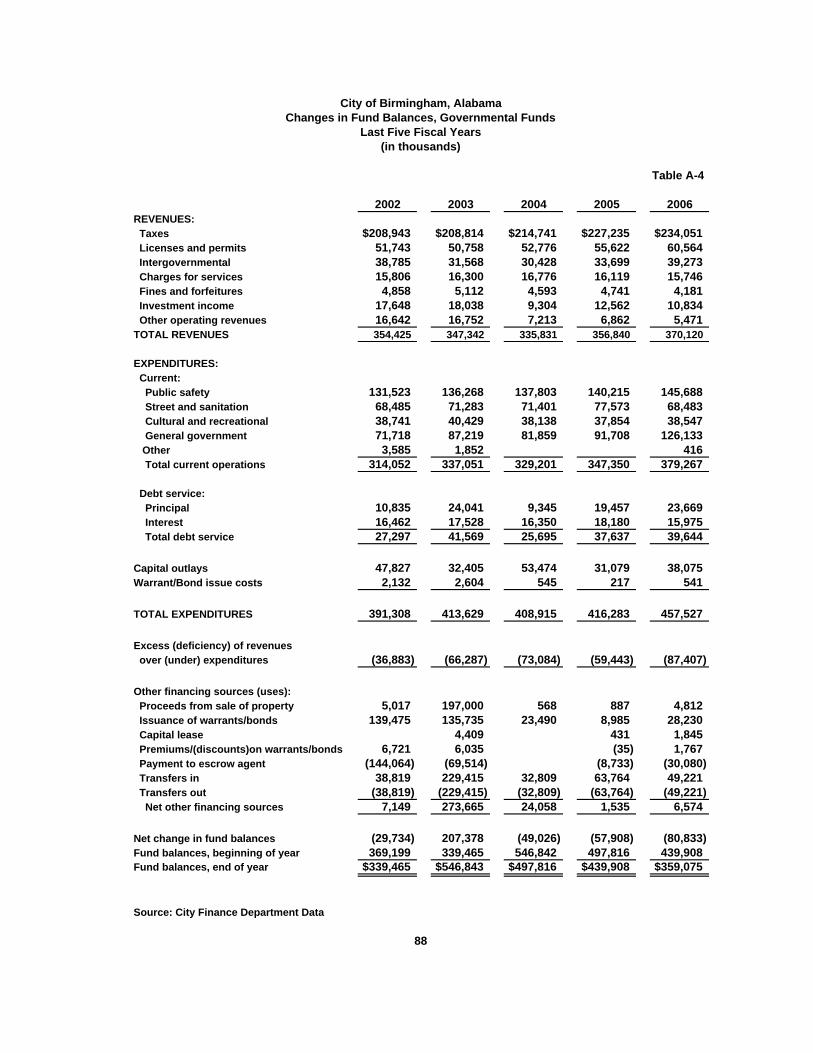
City of Birmingham, AlabamaChanges in Fund Balances, Governmental Funds
Last Five Fiscal Years(in thousands)
Table A-4
2002 2003 2004 2005 2006REVENUES: Taxes $208,943 $208,814 $214,741 $227,235 $234,051 Licenses and permits 51,743 50,758 52,776 55,622 60,564 Intergovernmental 38,785 31,568 30,428 33,699 39,273 Charges for services 15,806 16,300 16,776 16,119 15,746 Fines and forfeitures 4,858 5,112 4,593 4,741 4,181 Investment income 17,648 18,038 9,304 12,562 10,834 Other operating revenues 16,642 16,752 7,213 6,862 5,471TOTAL REVENUES 354,425 347,342 335,831 356,840 370,120
EXPENDITURES: Current: Public safety 131,523 136,268 137,803 140,215 145,688 Street and sanitation 68,485 71,283 71,401 77,573 68,483 Cultural and recreational 38,741 40,429 38,138 37,854 38,547 General government 71,718 87,219 81,859 91,708 126,133 Other 3,585 1,852 416 Total current operations 314,052 337,051 329,201 347,350 379,267
Debt service: Principal 10,835 24,041 9,345 19,457 23,669 Interest 16,462 17,528 16,350 18,180 15,975 Total debt service 27,297 41,569 25,695 37,637 39,644
Capital outlays 47,827 32,405 53,474 31,079 38,075Warrant/Bond issue costs 2,132 2,604 545 217 541
TOTAL EXPENDITURES 391,308 413,629 408,915 416,283 457,527
Excess (deficiency) of revenues over (under) expenditures (36,883) (66,287) (73,084) (59,443) (87,407)
Other financing sources (uses): Proceeds from sale of property 5,017 197,000 568 887 4,812 Issuance of warrants/bonds 139,475 135,735 23,490 8,985 28,230 Capital lease 4,409 431 1,845 Premiums/(discounts)on warrants/bonds 6,721 6,035 (35) 1,767 Payment to escrow agent (144,064) (69,514) (8,733) (30,080) Transfers in 38,819 229,415 32,809 63,764 49,221 Transfers out (38,819) (229,415) (32,809) (63,764) (49,221) Net other financing sources 7,149 273,665 24,058 1,535 6,574
Net change in fund balances (29,734) 207,378 (49,026) (57,908) (80,833)Fund balances, beginning of year 369,199 339,465 546,842 497,816 439,908Fund balances, end of year $339,465 $546,843 $497,816 $439,908 $359,075
Source: City Finance Department Data
88
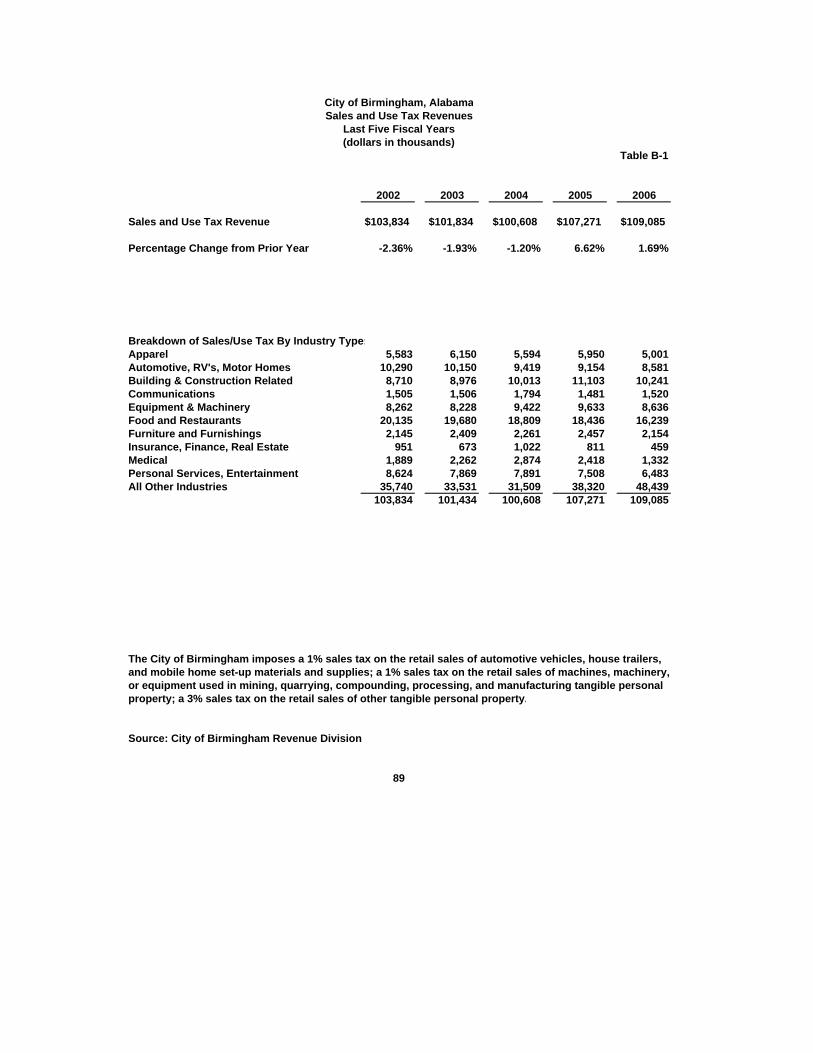
City of Birmingham, AlabamaSales and Use Tax Revenues
Last Five Fiscal Years(dollars in thousands)
Table B-1
2002 2003 2004 2005 2006
Sales and Use Tax Revenue $103,834 $101,834 $100,608 $107,271 $109,085
Percentage Change from Prior Year -2.36% -1.93% -1.20% 6.62% 1.69%
Breakdown of Sales/Use Tax By Industry Type:Apparel 5,583 6,150 5,594 5,950 5,001Automotive, RV's, Motor Homes 10,290 10,150 9,419 9,154 8,581Building & Construction Related 8,710 8,976 10,013 11,103 10,241Communications 1,505 1,506 1,794 1,481 1,520Equipment & Machinery 8,262 8,228 9,422 9,633 8,636Food and Restaurants 20,135 19,680 18,809 18,436 16,239Furniture and Furnishings 2,145 2,409 2,261 2,457 2,154Insurance, Finance, Real Estate 951 673 1,022 811 459Medical 1,889 2,262 2,874 2,418 1,332Personal Services, Entertainment 8,624 7,869 7,891 7,508 6,483All Other Industries 35,740 33,531 31,509 38,320 48,439
103,834 101,434 100,608 107,271 109,085
The City of Birmingham imposes a 1% sales tax on the retail sales of automotive vehicles, house trailers, and mobile home set-up materials and supplies; a 1% sales tax on the retail sales of machines, machinery,or equipment used in mining, quarrying, compounding, processing, and manufacturing tangible personalproperty; a 3% sales tax on the retail sales of other tangible personal property.
Source: City of Birmingham Revenue Division
89

City of Birmingham, AlabamaSales and Use Tax Revenues to Total Taxes
Last Five Fiscal Years(dollars in thousands)
Table B-2
2002 2003 2004 2005 2006
Breakdown of Tax Revenues:Sales and Use Tax $103,834 $101,434 $100,608 $107,271 $109,085Occupational Tax 63,051 64,522 65,537 69,346 72,297Property Tax 42,058 42,858 48,596 50,618 52,669
$208,943 $208,814 $214,741 $227,235 $234,051
% of Sales & Use to Total Taxes 49.69% 48.58% 46.85% 47.21% 46.61%
Source: Finance Department Data
90

City of Birmingham, Alabama Ratios of Outstanding Debt by Type
Last Five Fiscal Years
Table C-1
General General PercentageFiscal Obligation Obligation Revenue Capital Personal of Personal PerYear Bonds Warrants Warrants Leases Total Income Income Capita2002 295,100,000 213,870,000 13,000,000 11,432,000 533,402,000 3,803,289,660 14.02% $2,1972003 354,000,000 196,060,000 13,000,000 11,442,000 574,502,000 3,803,289,660 15.11% $2,3662004 344,655,000 212,695,000 13,000,000 0 570,350,000 3,803,289,660 15.00% $2,3492005 325,340,000 205,935,000 12,430,000 417,000 544,122,000 3,803,289,660 14.31% $2,2412006 309,920,000 197,435,000 11,835,000 2,094,000 521,284,000 3,803,289,660 13.71% $2,147
Source: City Finance Department data Personal income computed from 2000 census population and per capita income data (see table D-1).
91
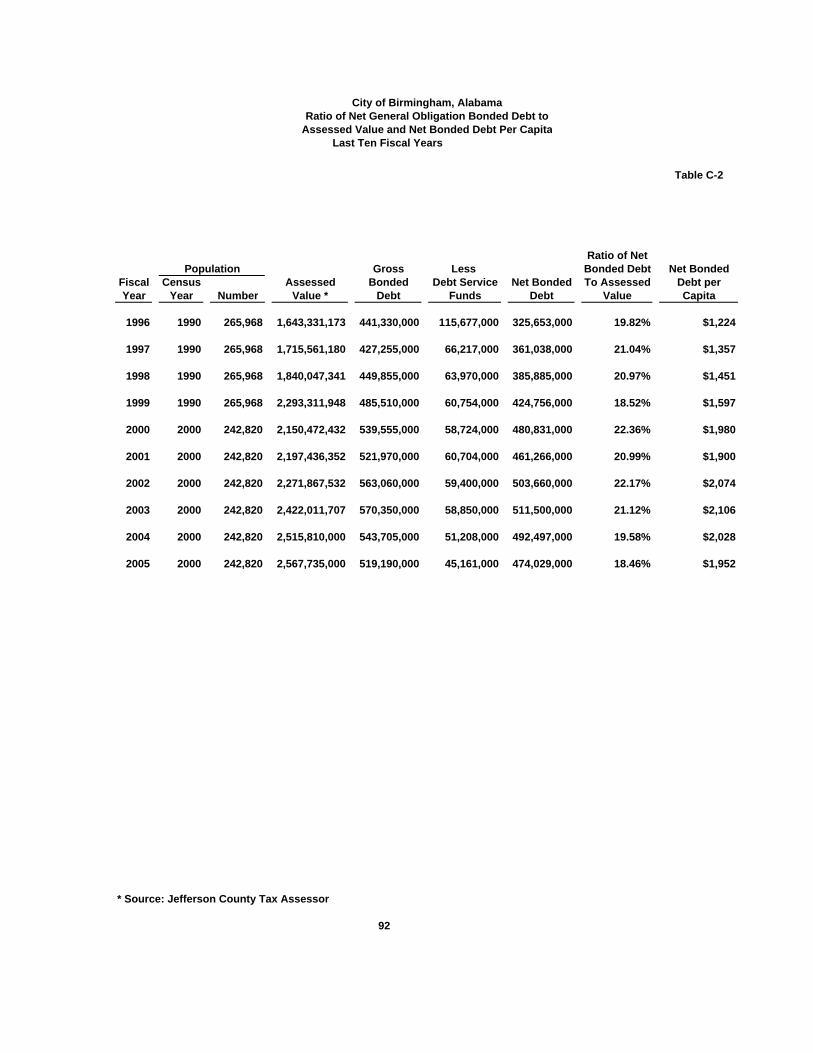
City of Birmingham, AlabamaRatio of Net General Obligation Bonded Debt to
Assessed Value and Net Bonded Debt Per CapitaLast Ten Fiscal Years
Table C-2
Ratio of NetPopulation Gross Less Bonded Debt Net Bonded
Fiscal Census Assessed Bonded Debt Service Net Bonded To Assessed Debt perYear Year Number Value * Debt Funds Debt Value Capita
1996 1990 265,968 1,643,331,173 441,330,000 115,677,000 325,653,000 19.82% $1,224
1997 1990 265,968 1,715,561,180 427,255,000 66,217,000 361,038,000 21.04% $1,357
1998 1990 265,968 1,840,047,341 449,855,000 63,970,000 385,885,000 20.97% $1,451
1999 1990 265,968 2,293,311,948 485,510,000 60,754,000 424,756,000 18.52% $1,597
2000 2000 242,820 2,150,472,432 539,555,000 58,724,000 480,831,000 22.36% $1,980
2001 2000 242,820 2,197,436,352 521,970,000 60,704,000 461,266,000 20.99% $1,900
2002 2000 242,820 2,271,867,532 563,060,000 59,400,000 503,660,000 22.17% $2,074
2003 2000 242,820 2,422,011,707 570,350,000 58,850,000 511,500,000 21.12% $2,106
2004 2000 242,820 2,515,810,000 543,705,000 51,208,000 492,497,000 19.58% $2,028
2005 2000 242,820 2,567,735,000 519,190,000 45,161,000 474,029,000 18.46% $1,952
* Source: Jefferson County Tax Assessor
92

City of Birmingham, AlabamaAssessed Value and Estimated True Value of All Taxable Property
Last Ten Fiscal Periods(dollars in thousands)
Table C-3
Ratio ofAssessed
Assessment Real Property * Personal Property * Automobile ** Total Total Value toDate Assessed Estimated Assessed Estimated Assessed Estimated Assessed Estimated Estimated
October 1, Value True Value Value True Value Value True Value Value True Value True Value
1996 1,183,673 6,928,706 343,817 1,718,883 130,517 870,111 1,658,007 9,517,700 17.42%
1997 1,201,575 7,006,392 386,870 1,934,235 143,375 955,835 1,731,820 9,896,462 17.50%
1998 1,245,579 7,221,650 465,625 2,327,559 128,843 858,953 1,840,047 10,408,162 17.68%
1999 1,483,666 8,269,172 634,398 3,171,990 175,248 1,168,318 2,293,312 12,609,480 18.19%
2000 1,492,553 8,766,013 442,548 2,212,740 215,371 1,435,807 2,150,472 12,414,560 17.32%
2001 1,481,383 8,738,667 459,883 2,299,375 256,170 1,708,655 2,197,436 12,746,697 17.24%
2002 1,527,622 8,988,867 491,702 2,458,367 252,544 1,683,624 2,271,868 13,130,858 17.30%
2003 1,674,340 10,542,808 496,546 2,482,650 251,126 1,674,170 2,422,012 14,699,628 16.48%
2004 1,776,272 11,123,810 489,175 2,445,835 250,363 1,669,088 2,515,810 15,238,733 16.51%
2005 1,821,769 11,612,895 479,231 2,396,157 266,735 1,778,233 2,567,735 15,787,286 16.26%
Ad valorem taxes are assessed and collected for the City of Birmingham by Jefferson and Shelby Counties
* Source: Tax Assessors for Jefferson and Shelby Counties ** Source: Directors of Revenue, Jefferson and Shelby Counties
Property is assessed on the following basis:Class I-Public Utility 30%Class II-Commercial 20%Class III-Residential 10%Class IV-Automobile 15%
93
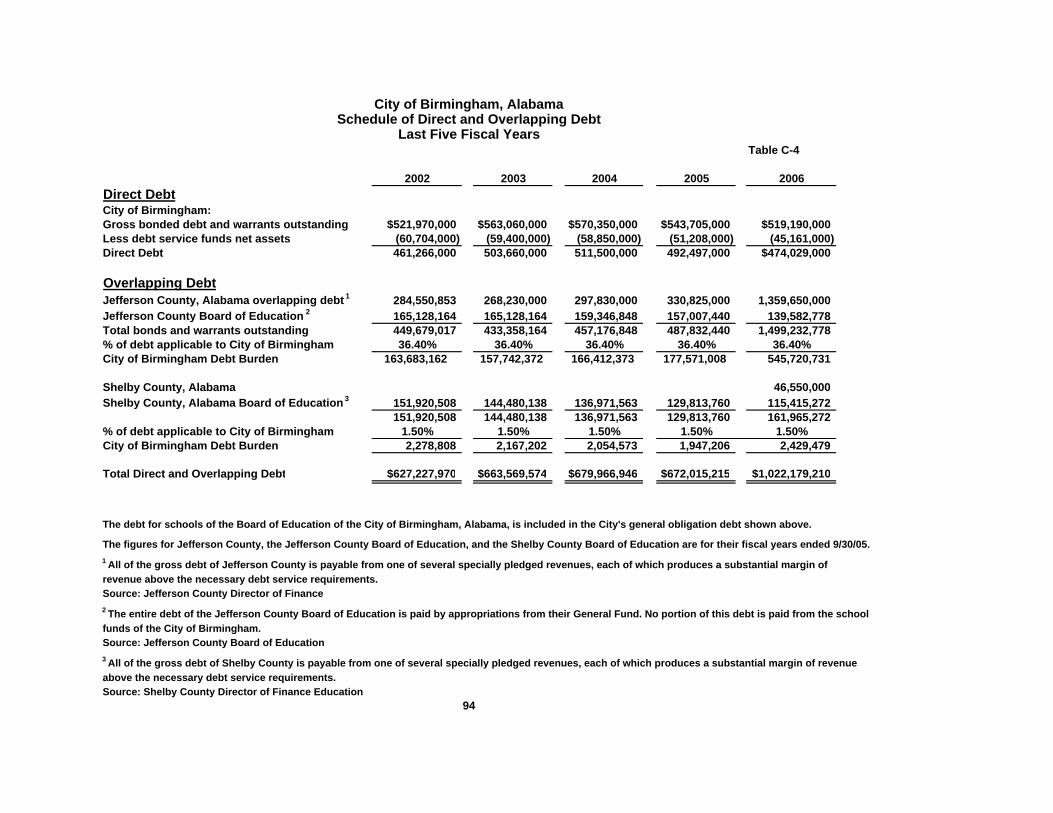
City of Birmingham, AlabamaSchedule of Direct and Overlapping Debt
Last Five Fiscal YearsTable C-4
2002 2003 2004 2005 2006Direct DebtCity of Birmingham:Gross bonded debt and warrants outstanding $521,970,000 $563,060,000 $570,350,000 $543,705,000 $519,190,000Less debt service funds net assets (60,704,000) (59,400,000) (58,850,000) (51,208,000) (45,161,000)Direct Debt 461,266,000 503,660,000 511,500,000 492,497,000 $474,029,000
Overlapping DebtJefferson County, Alabama overlapping debt 1 284,550,853 268,230,000 297,830,000 330,825,000 1,359,650,000Jefferson County Board of Education 2 165,128,164 165,128,164 159,346,848 157,007,440 139,582,778Total bonds and warrants outstanding 449,679,017 433,358,164 457,176,848 487,832,440 1,499,232,778% of debt applicable to City of Birmingham 36.40% 36.40% 36.40% 36.40% 36.40%City of Birmingham Debt Burden 163,683,162 157,742,372 166,412,373 177,571,008 545,720,731
Shelby County, Alabama 46,550,000Shelby County, Alabama Board of Education 3 151,920,508 144,480,138 136,971,563 129,813,760 115,415,272
151,920,508 144,480,138 136,971,563 129,813,760 161,965,272% of debt applicable to City of Birmingham 1.50% 1.50% 1.50% 1.50% 1.50%City of Birmingham Debt Burden 2,278,808 2,167,202 2,054,573 1,947,206 2,429,479
Total Direct and Overlapping Debt $627,227,970 $663,569,574 $679,966,946 $672,015,215 $1,022,179,210
The debt for schools of the Board of Education of the City of Birmingham, Alabama, is included in the City's general obligation debt shown above.
The figures for Jefferson County, the Jefferson County Board of Education, and the Shelby County Board of Education are for their fiscal years ended 9/30/05.1 All of the gross debt of Jefferson County is payable from one of several specially pledged revenues, each of which produces a substantial margin of revenue above the necessary debt service requirements.Source: Jefferson County Director of Finance2 The entire debt of the Jefferson County Board of Education is paid by appropriations from their General Fund. No portion of this debt is paid from the schoolfunds of the City of Birmingham.Source: Jefferson County Board of Education3 All of the gross debt of Shelby County is payable from one of several specially pledged revenues, each of which produces a substantial margin of revenueabove the necessary debt service requirements.Source: Shelby County Director of Finance Education
94

City of Birmingham, AlabamaProperty Taxes - Direct and Overlapping Governments
Table C-5
City of Birmingham and Jefferson and Shelby Counties(Per $100 of Assessed Value)Last Ten Fiscal Years
City of Birmingham Jefferson CountyDebt Board of
Fiscal Genera Service Education County State of TotalYear Fund Fund Fund Library Total County Schools Total Alabama Tax1996 $0.90 $1.20 $1.98 $0.05 $4.13 $1.35 $0.82 $2.17 $0.65 $6.951997 $0.90 $1.20 $1.98 $0.05 $4.13 $1.35 $0.82 $2.17 $0.65 $6.951998 $0.90 $1.20 $1.98 $0.05 $4.13 $1.35 $0.82 $2.17 $0.65 $6.951999 $0.90 $1.20 $1.98 $0.05 $4.13 $1.35 $0.82 $2.17 $0.65 $6.952000 $0.90 $1.20 $1.98 $0.05 $4.13 $1.35 $0.82 $2.17 $0.65 $6.952001 $0.90 $1.20 $1.98 $0.05 $4.13 $1.35 $0.82 $2.17 $0.65 $6.952002 $0.90 $1.20 $1.98 $0.05 $4.13 $1.35 $0.82 $2.17 $0.65 $6.952003 $0.90 $1.20 $1.98 $0.05 $4.13 $1.35 $0.82 $2.17 $0.65 $6.952004 $0.90 $1.20 $1.98 $0.05 $4.13 $1.35 $0.82 $2.17 $0.65 $6.952005 $0.90 $1.20 $1.98 $0.05 $4.13 $1.35 $0.82 $2.17 $0.65 $6.95
Source: Jefferson County Tax Assessor
City of Birmingham Shelby CountyDebt Board of
Fiscal Genera Service Education County State of TotalYear Fund Fund Fund Library Total County Schools Total Alabama Tax1996 $0.90 $1.20 $2.07 $0.05 $4.22 $0.75 $1.60 $2.35 $0.65 $7.221997 $0.90 $1.20 $2.07 $0.05 $4.22 $0.75 $1.60 $2.35 $0.65 $7.221998 $0.90 $1.20 $2.07 $0.05 $4.22 $0.75 $1.60 $2.35 $0.65 $7.221999 $0.90 $1.20 $2.07 $0.05 $4.22 $0.75 $1.60 $2.35 $0.65 $7.222000 $0.90 $1.20 $2.07 $0.05 $4.22 $0.75 $1.60 $2.35 $0.65 $7.222001 $0.90 $1.20 $2.07 $0.05 $4.22 $0.75 $1.60 $2.35 $0.65 $7.222002 $0.90 $1.20 $2.07 $0.05 $4.22 $0.75 $1.60 $2.35 $0.65 $7.222003 $0.90 $1.20 $2.07 $0.05 $4.22 $0.75 $1.60 $2.35 $0.65 $7.222004 $0.90 $1.20 $2.07 $0.05 $4.22 $0.75 $1.60 $2.35 $0.65 $7.222005 $0.90 $1.20 $2.07 $0.05 $4.22 $0.75 $1.60 $2.35 $0.65 $7.22
Source: Shelby County Tax Assessor
95

City of Birmingham, AlabamaLegal Debt Margin
Last Five Fiscal Years
Table C-6
2002 2003 2004 2005 2006
Assessed value of real and personal property 1 $2,197,436,352 $2,150,472,432 $2,422,011,707 $2,515,810,000 $2,567,735,000
Debt limit, 20% of assessed property value (see note below) 439,487,270 430,094,486 484,402,341 503,162,000 513,547,000
Outstanding general obligation bonds and warrants 521,970,000 563,060,000 570,350,000 543,705,000 519,190,000Less exemption for schools and sewer bonds (192,349,000) (201,509,000) (178,171,623) (189,122,423) (178,483,266)Less debt service fund balances (60,704,000) (59,400,000) (58,850,000) (51,208,000) (45,161,000)Net outstanding general obligation bonds and warrants 268,917,000 302,151,000 333,328,377 303,374,577 295,545,734
Legal debt margin $170,570,270 $127,943,486 $151,073,964 $199,787,423 $218,001,266
1 Source: Jefferson County Tax Assessor and Department of Revenue
Note: Section 225, as amended, of the Constitution of the State of Alabama, limits debt of theCity of Birmingham to 20% of the assessed value of taxable property. Excluded from this limitationare bonds issued for schools and sewers.
96

City of Birmingham, AlabamaProperty Taxes Levied and Collected for
Birmingham, Jefferson and Shelby CountiesLast Ten Fiscal Years
Table C-7City of Birmingham
Beginning Assessed Total Taxes Uncollectible at Sale DateOctober 1 Valuation Levied Amount Percentage
1996 1,527,489,953 37,816,069 245,076 0.65%1997 1,588,444,600 39,343,333 234,158 0.60%1998 1,711,204,381 42,226,013 278,750 0.66%1999 2,118,433,717 51,753,527 203,417 0.39%2000 1,935,101,332 47,038,556 234,328 0.50%2001 1,942,139,212 50,637,230 365,764 0.72%2002 1,929,418,765 52,780,331 679,324 1.29%2003 2,170,886,167 59,048,850 692,802 1.17%2004 2,265,446,818 61,440,447 362,036 0.59%2005 2,301,000,783 62,890,413 504,279 0.80%
Jefferson CountyBeginning Assessed Total Taxes Uncollectible at Sale DateOctober 1 Valuation Levied Amount Percentage
1996 4,260,514,692 254,823,293 761,341 0.30%1997 4,431,527,963 265,673,868 687,408 0.26%1998 4,647,424,025 284,182,209 892,304 0.31%1999 5,684,682,452 349,807,893 633,356 0.18%2000 5,523,608,900 340,759,254 897,388 0.26%2001 5,596,211,994 351,730,297 1,169,066 0.33%2002 5,771,213,901 365,507,555 2,879,114 0.79%2003 6,506,073,106 420,329,739 2,610,384 0.62%2004 6,355,450,405 445,840,218 1,523,732 0.34%2005 6,692,146,321 469,456,560 2,180,748 0.46%
Shelby CountyBeginning Assessed Total Taxes Uncollectible at Sale DateOctober 1 Valuation Levied Amount Percentage
1996 989,392,240 40,039,344 1,017,398 2.54%1997 1,074,185,000 43,834,362 1,135,602 2.59%1998 1,172,999,000 56,556,936 1,645,171 2.91%1999 1,435,400,100 71,537,000 2,201,200 3.08%2000 1,478,400,100 77,733,000 194,700 0.25%2001 1,595,590,500 80,076,800 1,720,600 2.15%2002 1,688,065,200 84,633,100 2,048,200 2.42%2003 1,754,022,160 104,069,970 347,557 0.33%2004 1,874,130,720 110,323,626 253,097 0.23%2005 2,339,693,320 109,863,446 371,368 0.34%
Source: Jefferson County and Shelby County Tax Assessors and Tax Collectors
97

City of Birmingham, Alabama Principal Property Taxpayers
Current Fiscal Year and Nine Years Prior
Table C-8
Fiscal Year Ended June 30, 2006 Fiscal Year Ended June 30, 1996Total Assessed % of Total Total Assessed % of Total
Value of Property Property Taxes Value of Property Property TaxesAssessed Entity Within City Limits Rank Collected Within City Limits Rank Collected
Alabama Power Company $111,623,680 1 6.35% 88,997,000 1 5.66%Bellsouth Telecommunications 56,948,760 2 3.23% 68,206,220 2 4.34%Healthsouth Corporation 54,098,675 3 2.38% 12,508,070 6 0.80%American Cast Iron & Pipe Company 30,910,439 4 1.42% 18,222,192 4 1.16%Marray-Ash Plaza, Inc. 18,916,420 5 1.07% 15,070,742 5 0.96%Chase Bank of Texas NA 17,883,260 6 1.01%Alabama Gas Corporation 17,195,120 7 0.97% 10,670,220 7 0.68%Tish Robert Preston 16,729,760 8 0.95%A T & T Communications 16,039,640 9 0.91% 20,484,180 3 1.30%AP-Knight LP 10,739,780 10 0.61%Century Plaza Company 7,547,176 8 0.48%Fifth Avenue Realty Company 6,594,405 9 0.42%Sonat Services Inc. 5,916,674 10 0.38%
$351,085,534 18.90% $254,216,879 16.18%
Source: Jefferson and Shelby Counties Tax Collectors
98

City of Birmingham, AlabamaDemographic and Economic Statistics
Last Ten Fiscal Years
Table D-1
Average Per CapitaPersonal Personal Unemployment
Year Population Income Income Rate1997 265,968 32,037 13,322 3.4%1998 265,968 32,037 13,322 2.8%1999 265,968 31,851 15,663 3.1%2000 242,820 31,851 15,663 5.6%2001 242,820 31,851 15,663 6.4%2002 242,820 31,851 15,663 7.8%2003 242,820 31,851 15,663 8.5%2004 242,820 31,851 15,663 8.2%2005 242,820 31,851 15,663 5.0%2006 242,820 31,851 15,663 4.7%
Population figures based on 1990 and 2000 census
Unemployment rates source: Alabama Department of Industrial Relations
Personal income and per capital personal income source: U. S. Bureau of the Census 1990 and 2000
99

City of Birmingham, AlabamaPrincipal Employers
Current Fiscal Year and Nine Years Ago
Table D-2
2006 1997% of Total % of Total
# of City # of CityEmployer Employees Rank Employment Employees Rank Employment
University of Alabama in Birmingham 18,750 1 3.62% 14,975 1 3.42%BellSouth 5,485 2 1.06% 6,020 3 1.37%Baptist Health System, Inc. 5,000 3 0.97% 5,364 6 1.22%Birmingham Board of Education 5,000 4 0.97% 4,500 8 1.03%City of Birmingham 4,989 5 0.96% 4,500 9 1.03%Jefferson County Board of Education 4,800 6 0.93% 6,121 4 1.40%Jefferson County Commission 3,875 7 0.75%AmSouth Bancorporation 3,785 8 0.73%Bruno's Supermarkets, Inc. 3,477 9 0.67% 4,950 7 1.13%Children's Health System 3,200 10 0.62%U. S. Government 8,925 2 2.04%State of Alabama 5,600 5 1.28%WalMart 4,000 10 0.91%
Source: Birmingham Regional Chamber of Commerce
100
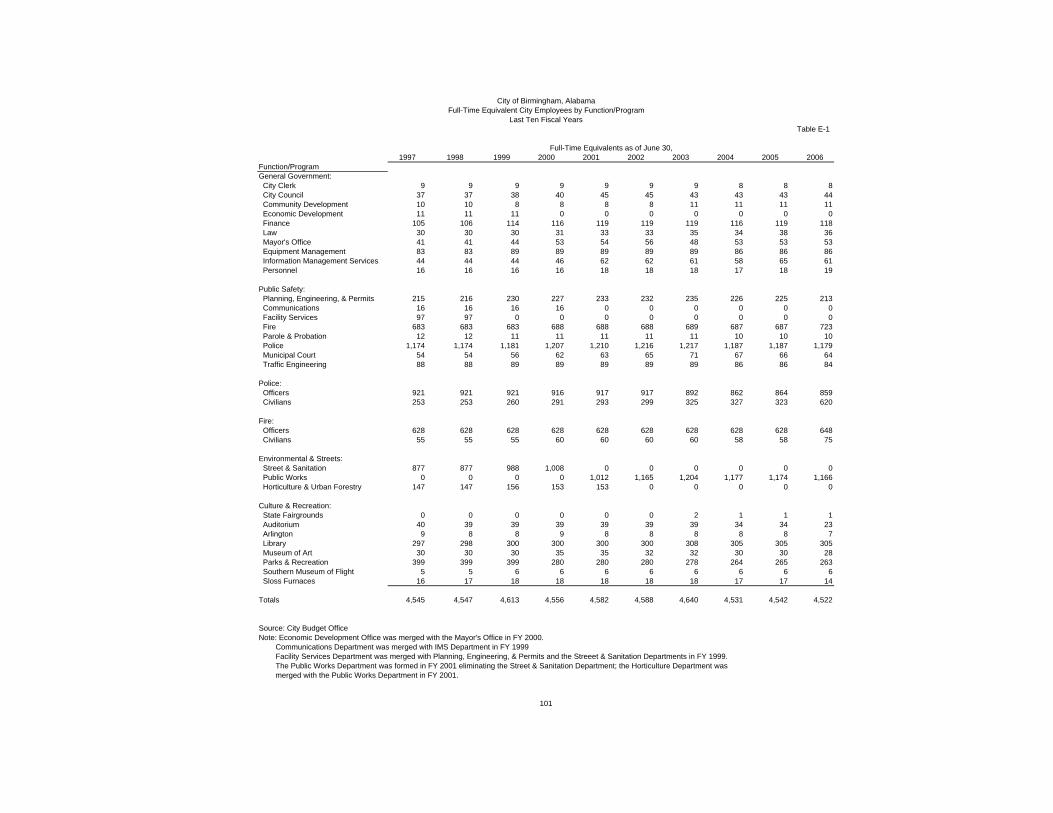
City of Birmingham, AlabamaFull-Time Equivalent City Employees by Function/Program
Last Ten Fiscal YearsTable E-1
Full-Time Equivalents as of June 30,1997 1998 1999 2000 2001 2002 2003 2004 2005 2006
Function/ProgramGeneral Government: City Clerk 9 9 9 9 9 9 9 8 8 8 City Council 37 37 38 40 45 45 43 43 43 44 Community Development 10 10 8 8 8 8 11 11 11 11 Economic Development 11 11 11 0 0 0 0 0 0 0 Finance 105 106 114 116 119 119 119 116 119 118 Law 30 30 30 31 33 33 35 34 38 36 Mayor's Office 41 41 44 53 54 56 48 53 53 53 Equipment Management 83 83 89 89 89 89 89 86 86 86 Information Management Services 44 44 44 46 62 62 61 58 65 61 Personnel 16 16 16 16 18 18 18 17 18 19
Public Safety: Planning, Engineering, & Permits 215 216 230 227 233 232 235 226 225 213 Communications 16 16 16 16 0 0 0 0 0 0 Facility Services 97 97 0 0 0 0 0 0 0 0 Fire 683 683 683 688 688 688 689 687 687 723 Parole & Probation 12 12 11 11 11 11 11 10 10 10 Police 1,174 1,174 1,181 1,207 1,210 1,216 1,217 1,187 1,187 1,179 Municipal Court 54 54 56 62 63 65 71 67 66 64 Traffic Engineering 88 88 89 89 89 89 89 86 86 84
Police: Officers 921 921 921 916 917 917 892 862 864 859 Civilians 253 253 260 291 293 299 325 327 323 620 Fire: Officers 628 628 628 628 628 628 628 628 628 648 Civilians 55 55 55 60 60 60 60 58 58 75
Environmental & Streets: Street & Sanitation 877 877 988 1,008 0 0 0 0 0 0 Public Works 0 0 0 0 1,012 1,165 1,204 1,177 1,174 1,166 Horticulture & Urban Forestry 147 147 156 153 153 0 0 0 0 0 Culture & Recreation: State Fairgrounds 0 0 0 0 0 0 2 1 1 1 Auditorium 40 39 39 39 39 39 39 34 34 23 Arlington 9 8 8 9 8 8 8 8 8 7 Library 297 298 300 300 300 300 308 305 305 305 Museum of Art 30 30 30 35 35 32 32 30 30 28 Parks & Recreation 399 399 399 280 280 280 278 264 265 263 Southern Museum of Flight 5 5 6 6 6 6 6 6 6 6 Sloss Furnaces 16 17 18 18 18 18 18 17 17 14
Totals 4,545 4,547 4,613 4,556 4,582 4,588 4,640 4,531 4,542 4,522
Source: City Budget OfficeNote: Economic Development Office was merged with the Mayor's Office in FY 2000. Communications Department was merged with IMS Department in FY 1999 Facility Services Department was merged with Planning, Engineering, & Permits and the Streeet & Sanitation Departments in FY 1999. The Public Works Department was formed in FY 2001 eliminating the Street & Sanitation Department; the Horticulture Department was merged with the Public Works Department in FY 2001.
101
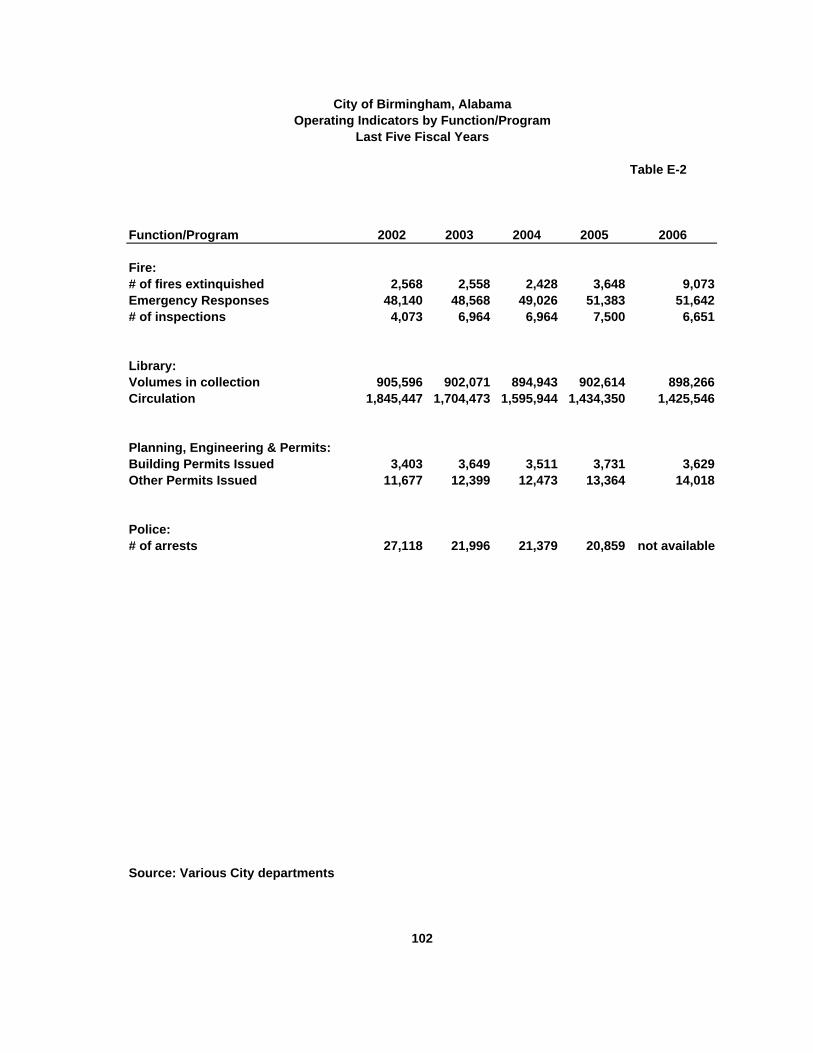
City of Birmingham, AlabamaOperating Indicators by Function/Program
Last Five Fiscal Years
Table E-2
Function/Program 2002 2003 2004 2005 2006
Fire:# of fires extinquished 2,568 2,558 2,428 3,648 9,073Emergency Responses 48,140 48,568 49,026 51,383 51,642# of inspections 4,073 6,964 6,964 7,500 6,651
Library:Volumes in collection 905,596 902,071 894,943 902,614 898,266Circulation 1,845,447 1,704,473 1,595,944 1,434,350 1,425,546
Planning, Engineering & Permits:Building Permits Issued 3,403 3,649 3,511 3,731 3,629Other Permits Issued 11,677 12,399 12,473 13,364 14,018
Police:# of arrests 27,118 21,996 21,379 20,859 not available
Source: Various City departments
102

City of Birmingham, AlabamaCapital Asset Statistics by Function/Program
Last Five Fiscal Years
Table E-3
2002 2003 2004 2005 2006Function/Program
Police precincts 4 4 4 4 4Police substations 6 6 6 6 6
Fire stations 30 30 30 30 30
Miles of sewers:Sanitary 890 890 890 890 1411Storm 475 475 475 475 691
Street lights 28,000 28,000 28,000 28,000 28,000Traffic signals 700 700 700 700 700Street miles 1,500 1,500 1,500 1,500 1,500
Parks & recreation:# of Parks 106 106 106 106 106Acreage of Parks 2,137 2,137 2,137 2,137 2,137Recreation/community centers 18 18 18 18 18Playgrounds 73 73 73 73 73Baseball/softball fields 45 45 45 45 45Soccer/football fields 18 18 18 18 18
Libraries:Central 1 1 1 1 1Branches 19 19 19 19 19
Source: Various City departments
103