2017 comprehensive annual financial report city of st
TRANSCRIPT

2017Comprehensive Annual Financial ReportCity of St. Louis, Missouri
Fiscal Year Ended June 30

City of St. Louis, MissouriComptroller
Compliments of the ComptrollerDarlene Green


CITY OF ST. LOUIS, MISSOURI Comprehensive Annual Financial Report Table of Contents June 30, 2017 INTRODUCTORY SECTION (Unaudited) Page(s)
Letter of Transmittal I-V
Certificate of Achievement for Excellence in Financial Reporting VI
Elected Officials VII
Organization Charts VIII-IX
FINANCIAL SECTION
Independent Auditors’ Report 1-3
Management’s Discussion and Analysis – Required Supplementary Information (Unaudited) 4-22
Basic Financial Statements:
Government-wide Financial Statements:
Statement of Net Position 23
Statement of Activities 24
Fund Financial Statements:
Balance Sheet – Governmental Funds 25
Reconciliation of the Balance Sheet of Governmental Funds to the Statement of Net Position 26
Statement of Revenues, Expenditures, and Changes in Fund Balances – Governmental Funds 27
Reconciliation of the Statement of Revenues, Expenditures, and Changes in Fund Balances of Governmental Funds to the Statement of Activities 28
Statement of Fund Net Position – Proprietary Funds 29
Statement of Revenues, Expenses, and Changes in Fund Net Position – Proprietary Funds 30
Statement of Cash Flows – Proprietary Funds 31
Statement of Fiduciary Net Position – Fiduciary Funds 32
Statement of Changes in Fiduciary Net Position – Fiduciary Funds 33
Notes to Basic Financial Statements 34-143
Schedule Page(s) Budgetary Comparison Information – Required Supplementary Information (Unaudited):
Schedule of Revenues, Expenditures, and Changes in Fund Balances – Budget and Actual – General Fund (Unaudited) 1 144-148
Schedule of Revenues, Expenditures, and Changes in Fund Balances – Budget and Actual – Redevelopment Projects Fund (Unaudited) 2 149
Notes to Schedule of Revenues, Expenditures, and Changes in Fund Balances – Budget and Actual – General Fund and Redevelopment Projects Fund (Unaudited) 3 150-151

CITY OF ST. LOUIS, MISSOURI Comprehensive Annual Financial Report June 30, 2017 Table of Contents
Schedule Page(s) Retirement Systems and Other Postemployment Benefit Plan – Required Supplementary Information (Unaudited) 4 152-160 Combining and Individual Fund Financial Statements and Schedules – Additional Supplementary Information:
Combining Balance Sheet – Nonmajor Governmental Funds 5 161-163
Combining Statement of Revenues, Expenditures, and Changes in Fund Balances – Nonmajor Governmental Funds 6 164-165
Schedules of Revenues, Expenditures, and Changes in Fund Balances – Budget and Actual:
Special Revenue Funds – Nonmajor:
Use Tax Fund 7 166
Transportation Fund 8 167
Convention and Tourism Fund 9 168
Licensed Gaming Program Fund 10 169
Assessor’s Office Fund 11 170
Lateral Sewer Program Fund 12 171
Public Safety Trust Fund 13 172
Public Safety Sales Tax Fund 14 173
Parks and Recreation Fund 15 174
Other Budgeted Special Revenue Fund 16 175
Debt Service Fund – Nonmajor 17 176
Capital Projects Fund – Major 18 177
Schedule of Reconciling Items Between Change in Fund Balances – Budget Basis and Change in Fund Balances – GAAP Basis – 19 178
Combining Statement of Net Position – Internal Service Funds 20 179-180
Combining Statement of Revenues, Expenses, and Changes in Fund Net Position – Internal Service Funds 21 181
Combining Statement of Cash Flows – Internal Service Funds 22 182
Combining Statement of Fiduciary Net Position – Pension Trust Funds 23 183-184
Combining Statement of Changes in Fiduciary Net Position – Pension Trust Funds 24 185
Combining Statement of Fiduciary Net Position – Agency Funds 25 186-187
Combining Statement of Changes in Assets and Liabilities – Agency Funds 26 188-189

CITY OF ST. LOUIS, MISSOURI Comprehensive Annual Financial Report Table of Contents June 30, 2017 STATISTICAL SECTION (Unaudited) Table Page(s)
Government-wide Information:
Net Position by Component 1 191
Changes in Net Position 2 192-193
Fund Information:
Fund Balances, Governmental Funds 3 194
Changes in Fund Balances, Governmental Funds 4 195-196
Assessed Value and Actual Value of Taxable Property 5 197
Property Tax Rates Per $100 Assessed Value – Direct and Overlapping Governments 6 198
Principal Property Taxpayers Identified by Industry Classification 7 199
General and Debt Service Funds – Property Tax Levies and Collections 8 200
Earnings and Payroll Tax 9 201
Principal Earnings and Payroll Taxpayers 10 202
Ratio of Outstanding Debt by Type 11 203
Ratio of Net General Obligation Debt Outstanding 12 204
Direct and Overlapping Governmental Activities Debt 13 205
Legal Debt Margin Calculation 14 206
Pledged Revenue Coverage 15 207-217
Demographic and Economic Statistics 16 218
Principal Employers 17 219
Full-time Equivalent City Government Employees by Function/Program 18 220
Operating Indicators by Function/Program 19 221
Capital Asset Statistics by Function/Program 20 222

II

III

IV

V

VI

VII

City of St. Louis, Missouri
Office of the Comptroller
COMPTROLLER
DARLENE GREEN
DEPUTY COMPTROLLERFinance & Development
Asset
Management
Fiscal and Economic
Development
Internal
Audit
DEPUTY
COMPTROLLER
Accounting
Services
Financial
Reporting
Federal
Grants
VIII

IX


Independent Auditors’ Report
Honorable Mayor and Members of the Board of Aldermen of the City of St. Louis, Missouri:
Report on the Financial Statements
We have audited the accompanying financial statements of the governmental activities, the business-type activities, the aggregate discretely presented component unit, each major fund, and the aggregate remaining fund information of the City of St. Louis, Missouri (the City), as of and for the year ended June 30, 2017, and the related notes to the financial statements, which collectively comprise the City’s basic financial statements as listed in the table of contents.
Management’s Responsibility for the Financial Statements
Management is responsible for the preparation and fair presentation of these financial statements in accordance with U.S. generally accepted accounting principles; this includes the design, implementation, and maintenance of internal control relevant to the preparation and fair presentation of financial statements that are free from material misstatement, whether due to fraud or error.
Auditors’ Responsibility
Our responsibility is to express opinions on these financial statements based on our audit. We did not audit the financial statements of the pension trust funds and the St. Louis Development Corporation discretely presented component unit. The assets and revenues (additions) of the pension trust funds represent 91% and 52% of the assets and revenues (additions), respectively, of the aggregate remaining fund information. The assets and revenues of the St. Louis Development Corporation represent 100% of the assets and revenues of the aggregate discretely presented component unit. The financial statements of the pension trust funds and the St. Louis Development Corporation were audited by other auditors whose reports have been furnished to us, and our opinion, insofar as it relates to the amounts included for those funds and discretely presented component unit, is based solely on the reports of the other auditors. We conducted our audit in accordance with auditing standards generally accepted in the United States of America and the standards applicable to financial audits contained in Government Auditing Standards, issued by the Comptroller General of the United States. Those standards require that we plan and perform the audit to obtain reasonable assurance about whether the financial statements are free from material misstatement. The financial statements of the Employees Retirement System of the City of St. Louis pension trust fund were not audited in accordance with Government Auditing Standards.
An audit involves performing procedures to obtain audit evidence about the amounts and disclosures in the financial statements. The procedures selected depend on the auditors’ judgment, including the assessment of the risks of material misstatement of the financial statements, whether due to fraud or error. In making those risk assessments, the auditor considers internal control relevant to the entity’s preparation and fair presentation of the financial statements in order to design audit procedures that are appropriate in the circumstances, but not for the
KPMG LLP is a Delaware limited liability partnership and the U.S. member firm of the KPMG network of independent member firms affiliated with KPMG International Cooperative (“KPMG International”), a Swiss entity.
KPMG LLPSuite 90010 South BroadwaySt. Louis, MO 63102-1761

2
purpose of expressing an opinion on the effectiveness of the entity’s internal control. Accordingly, we express no such opinion. An audit also includes evaluating the appropriateness of accounting policies used and the reasonableness of significant accounting estimates made by management, as well as evaluating the overall presentation of the financial statements.
We believe that the audit evidence we have obtained is sufficient and appropriate to provide a basis for our audit opinions.
Opinions
In our opinion, based on our audit and the reports of the other auditors, the financial statements referred to above present fairly, in all material respects, the respective financial position of the governmental activities, the business-type activities, the aggregate discretely presented component unit, each major fund, and the aggregate remaining fund information of the City of St. Louis, Missouri, as of June 30, 2017, and the respective changes in financial position and, where applicable, cash flows thereof for the year then ended in accordance with U.S. generally accepted accounting principles.
Other Matters
Required Supplementary Information
U.S. generally accepted accounting principles require that the Management’s Discussion and Analysis on pages 4 through 22, the Budgetary Comparison Information on pages 144 through 151, and the Retirement Systems and Other Postemployment Benefit Plan Information on pages 152 through 160 be presented to supplement the basic financial statements. Such information, although not a part of the basic financial statements, is required by the Governmental Accounting Standards Board who considers it to be an essential part of financial reporting for placing the basic financial statements in an appropriate operational, economic, or historical context. We and the other auditors have applied certain limited procedures to the required supplementary information in accordance with auditing standards generally accepted in the United States of America, which consisted of inquiries of management about the methods of preparing the information and comparing the information for consistency with management’s responses to our inquiries, the basic financial statements, and other knowledge we obtained during our audit of the basic financial statements. We do not express an opinion or provide any assurance on the information because the limited procedures do not provide us with sufficient evidence to express an opinion or provide any assurance.
Supplementary and Other Information
Our audit was conducted for the purpose of forming opinions on the financial statements that collectively comprise the City of St. Louis, Missouri’s basic financial statements. The Combining and Individual Fund Financial Statements and Schedules – Additional Supplementary Information, and the Introductory and Statistical Sections are presented for purposes of additional analysis and are not a required part of the basic financial statements.
The Combining and Individual Fund Financial Statements and Schedules – Additional Supplementary Information are the responsibility of management and was derived from and relates directly to the underlying accounting and other records used to prepare the basic financial statements. Such information has been subjected to the auditing procedures applied in the audit of the basic financial statements and certain additional procedures, including comparing and reconciling such information directly to the underlying accounting and other records used to prepare the basic financial statements or to the basic financial statements themselves, and other additional procedures in accordance with auditing standards generally accepted in the United States of America. In our opinion, the Combining and Individual Fund Financial Statements and Schedules – Additional Supplementary Information are fairly stated, in all material respects, in relation to the basic financial statements as a whole.

3
The Introductory and Statistical Sections have not been subjected to the auditing procedures applied in the audit of the basic financial statements, and accordingly, we do not express an opinion or provide any assurance on them.
Other Reporting Required by Government Auditing Standards
In accordance with Government Auditing Standards, we have also issued our report dated December 22, 2017 on our consideration of the City of St. Louis, Missouri’s internal control over financial reporting and on our tests of its compliance with certain provisions of laws, regulations, contracts, and grant agreements and other matters. The purpose of that report is solely to describe the scope of our testing of internal control over financial reporting and compliance and the results of that testing, and not to provide an opinion on the effectiveness of the City of St. Louis, Missouri’ internal control over financial reporting or on compliance. That report is an integral part of an audit performed in accordance with Government Auditing Standards in considering City of St. Louis, Missouri’s internal control over financial reporting and compliance.
St. Louis, Missouri December 22, 2017

CITY OF ST. LOUIS, MISSOURI MANAGEMENT’S DISCUSSION AND ANALYSIS – UNAUDITED
JUNE 30, 2017
4
As management of City of St. Louis, Missouri (the City), we offer readers of the City’s Comprehensive Annual Financial Report this narrative overview and analysis of the City for the fiscal year ended June 30, 2017. The information presented here should be read in conjunction with our letter of transmittal and the City’s basic financial statements including the notes to the financial statements. All amounts, unless otherwise indicated, are expressed in thousands of dollars. FINANCIAL HIGHLIGHTS (excluding discretely presented component unit)
• On a government-wide basis, the City’s total assets and deferred outflow of resources exceeded its liabilities for the current fiscal year by $646.5 million.
• Governmental activities and business-type activities had a net position of ($671.0) million
and $1,317.5 million, respectively.
• The cost of services for the City’s governmental activities was $861.8 million in fiscal year 2017 (excluding interest and fiscal charges).
• As of June 30, 2017, the City’s governmental funds reported combined ending fund balances
of $186.9 million. Of this amount, ($15.5) million is unassigned fund balance.
• In fiscal year 2017, the City issued $151.7 million in long-term debt to finance projects and refund debt in governmental activities and $274.6 million in long-term debt for business-type activities.
• Development and tax increment financing (TIF) debt increased liabilities in the amount of
$7.5 million. There is no related asset for TIF debt, net increases in TIF debt reduce unrestricted net position by an equal amount.

CITY OF ST. LOUIS, MISSOURI MANAGEMENT’S DISCUSSION AND ANALYSIS – UNAUDITED
JUNE 30, 2017
5
OVERVIEW OF THE FINANCIAL STATEMENTS
This discussion and analysis is intended to serve as an introduction to the City’s basic financial statements. The City’s basic financial statements include three components: 1) government-wide financial statements, 2) fund financial statements, and 3) notes to the financial statements. This report also contains required supplementary information and supplementary and other information in addition to the basic financial statements.
Government-wide Financial Statements
The government-wide financial statements are designed to provide readers with a broad overview of the City’s finances using accounting methods similar to those used by private sector business.
The Statement of Net Position presents information on all of the City’s assets, deferred outflow of resources, liabilities, deferred inflows of resources, and net position. Increases and decreases in net position may serve as a useful indicator of whether or not the financial position of the City is improving or deteriorating.
The Statement of Activities presents information showing how the City’s net position changed during the most recent fiscal year. All changes in net position are reported as soon as the underlying event giving rise to the change occurs, regardless of the timing of the related cash flows. Thus revenues and expenses reported in this statement for some items will only result in cash flows in future fiscal periods (for example, uncollected taxes and earned but unused vacation leave).
The government-wide financial statements distinguish functions of the City that are principally supported by taxes and inter-governmental revenues (governmental activities) from other functions that are intended to recover all or a significant portion of their costs through user fees or charges (business-type activities).
The governmental activities of the City include general government, convention and tourism, parks and recreation, judicial, streets, public safety (fire, police, other), health and welfare, public service, and community development, as well as, interest and fiscal charges. The business-type activities of the City include an airport, water division, and parking division.
The government-wide financial statements include not only the City itself (known as the primary government), but also a legally separate redevelopment agency. Financial information for this component unit is reported separately from the financial information presented for the primary government.
Included in the financial statements are the operations of the Public Facilities Protection Corporation (PFPC), St. Louis Municipal Finance Corporation, and St. Louis Parking Commission Finance Corporation as blended component units.
Fund Financial Statements
A fund is a grouping of related accounts that is used to maintain control over resources that have been segregated for specific activities or objectives. The City, like other state and local governments, uses fund accounting to ensure and demonstrate compliance with finance-related legal requirements. The funds of the City can be divided into three categories: governmental funds, proprietary funds and fiduciary funds.

CITY OF ST. LOUIS, MISSOURI MANAGEMENT’S DISCUSSION AND ANALYSIS – UNAUDITED
JUNE 30, 2017
6
1. Governmental Funds. Governmental funds are used to account for essentially the same functions reported as governmental activities in the government-wide financial statements. However, unlike the government-wide financial statements, governmental fund financial statements focus on near-term inflows and outflows of spendable resources, as well as on balances of spendable resources available at the end of a fiscal year. Such information may be useful in evaluating a government’s near-term financing requirements.
Because the focus of governmental funds is narrower than that of the government-wide financial statements, it is useful to compare the information presented for governmental funds with similar information presented for governmental activities in the government-wide financial statements. By doing so, readers may better understand the long-term impact of the government’s near-term financing decisions. Both the governmental fund balance sheet and the governmental fund statement of revenues, expenditures, and changes in fund balances provide a reconciliation to facilitate the comparison between governmental funds and governmental activities.
The City maintains several individual governmental funds according to their type (general, special revenue, debt service, and capital projects). Information is presented separately in the governmental fund balance sheet and in the governmental fund statement of revenues, expenditures, and changes in fund balances for the general fund, redevelopment projects fund, capital projects fund, and grants fund, which are considered to be major funds. Individual fund data for each of the non-major governmental funds is provided in the form of additional supplementary information as combining statements.
2. Proprietary Funds. Proprietary funds offer short-term and long-term financial information about services for which the City charges customers, both external customers and internal departments of the City. The City maintains the following two types of proprietary funds:
• Enterprise Funds are used to report information similar to business-type activities in the government-wide financial statements. The City uses the enterprise funds to account for the operations of the Lambert-St. Louis International Airport (Airport), Water Division, and the Parking Division.
• Internal Service Funds are used to report activities that provide supplies and services for certain City programs and activities. The City uses internal service funds to account for its mail handling services, for payment of workers’ compensation and various other claims, health insurance, and equipment service.
3. Fiduciary Funds. Fiduciary funds are used to account for resources held for the benefit of individuals or units outside of the City. The City is the trustee or fiduciary responsible for assets that can be used only for the trust beneficiaries per trust arrangements. The City is responsible for ensuring that the assets reported in these funds are used for their intended purposes. All of the City’s fiduciary activities are reported in a separate statement of fiduciary net position and a statement of changes in fiduciary net position. The City’s pension trust funds and agency funds are reported under the fiduciary funds. Since the resources of these funds are not available to support the City’s own programs, they are not reflected in the government-wide financial statements.

CITY OF ST. LOUIS, MISSOURI MANAGEMENT’S DISCUSSION AND ANALYSIS – UNAUDITED
JUNE 30, 2017
7
Notes to the Financial Statements The notes to the financial statements provide additional information that is essential to a full understanding of the data provided in the government-wide and fund financial statements. Required Supplementary Information In addition to the basic financial statements and notes to the financial statements, this report presents required supplementary information concerning the City’s budgetary comparisons for the general fund, and redevelopment projects fund, and required supplementary information pertaining to the Firemen’s Retirement System of St. Louis, the Firefighter’s Retirement Plan of the City of St. Louis, the Police Retirement System of St. Louis and the Employees Retirement System of the City of St. Louis pension trust funds and other post-employment benefits.

CITY OF ST. LOUIS, MISSOURI MANAGEMENT’S DISCUSSION AND ANALYSIS – UNAUDITED
JUNE 30, 2017
8
FINANCIAL ANALYSIS OF THE CITY AS A WHOLE
Net position: The City’s combined net position for fiscal year 2017 was $646.5 million, down from $744.7 million from fiscal year 2016. Looking at the net position of governmental and business-type activities separately provides additional information.
City of St. Louis, MissouriSchedule of Net Position Summary
June 30, 2017 and 2016(dollars in millions)
Governmental Business-typeActivities Activities Total
2017 2016 2017 2016 2017 2016
AssetsCurrent and other assets $ 394.4 374.8 656.9 364.5 1,051.3 739.3Capital assets 813.5 821.2 1,792.2 1,817.6 2,605.7 2,638.8
Deferred outflow of resources 236.9 213.6 31.4 43.1 268.3 256.7
Total assets anddeferred outflowof resources 1,444.8 1,409.6 2,480.5 2,225.2 3,925.3 3,634.8
LiabilitiesLong-term liabilities 1,927.8 1,791.9 1,105.1 856.5 3,032.9 2,648.4Other liabilities 172.2 176.2 51.9 52.8 224.1 229.0
Deferred inflow of resources 15.8 10.8 6.0 1.9 21.8 12.7
Total liabilities 2,115.8 1,978.9 1,163.0 911.2 3,278.8 2,890.1
Net positionNet investment in capital assets 506.3 522.7 785.2 918.6 1,291.5 1,441.3Restricted 63.5 27.3 419.4 277.2 482.9 304.5Unrestricted (deficit) (1,240.8) (1,119.3) 112.9 118.2 (1,127.9) (1,001.1)
Total net position $ (671.0) (569.3) 1,317.5 1,314.0 646.5 744.7
ANALYSIS OF NET POSITION
As noted earlier, net position may serve as a useful indicator of a government’s financial position. For the City, assets and deferred outflow of resources exceeded liabilities by $646.5 million at the close of the most recent fiscal year.
The largest portion of the City’s net position consists of its net investment in capital assets (for example, infrastructure, land, buildings, and equipment), less any related outstanding debt used to acquire those assets. The City uses these capital assets to provide services to citizens; consequently, these assets are not available for future spending. Although the City’s net investment in its capital

CITY OF ST. LOUIS, MISSOURI MANAGEMENT’S DISCUSSION AND ANALYSIS – UNAUDITED
JUNE 30, 2017
9
assets is reported net of related debt, it should be noted that the resources needed to repay this debt must be provided from other sources, since the capital assets themselves cannot be liquidated for these liabilities.
Included in the City’s total net position at the end of fiscal year 2017 and fiscal year 2016, respectively, is $482.9 million and $304.5 million, which represent resources that are subject to external restrictions on how they may be used.
Total unrestricted net position decreased by $126.8 million for the year ended June 30, 2017. Unrestricted governmental activities net position showed a $1,240.8 million deficit at the end of fiscal year 2017 as compared with a $1,119.3 million deficit in fiscal year 2016. This deficit does not mean that the City does not have resources available to pay its bills next year. Rather, it is the result of having long-term commitments that are greater than currently available resources. For example, the City’s policy and practice is to budget for certain long-term expenses as they come due. Specifically, the City did not include in past annual budgets the full amounts needed to finance future liabilities arising from property and casualty claims and amounts to pay for unused employee vacation and sick days. The City will continue to include these amounts in future year’s budgets as they come due.
In addition, five particular features of the City’s recent financial activity affected the deficit in unrestricted governmental net position. These activities over the past several years reflect debt to provide development stimulus for which the City received no offsetting asset. They include the following:
• Section 108 loan agreements, $22.2 million • Joint venture financing agreement for the expansion of the convention center, $24.1 million • Obligations with component unit for the convention center hotel, $22.0 million • Obligations with component units for downtown development, $15.1 million • Redevelopment and Tax increment financing debt for economic development projects in the
amount of $388.7 million Although the net position of the business-type activities account for the majority of overall net position, these resources cannot be used to make up for the unrestricted net position deficit in governmental activities. The City generally can only use the net position to finance the continuing operations of the Airport, Water Division, and the Parking Division.

CITY OF ST. LOUIS, MISSOURI MANAGEMENT’S DISCUSSION AND ANALYSIS – UNAUDITED
JUNE 30, 2017
10
Governmental Business-typeActivities Activities Total
2017 2016 2017 2016 2017 2016Revenues:Program revenues:Charges for services $ 133.7 136.5 241.7 237.4 375.4 373.9Operating grants and contributions 66.8 67.1 1.1 0.7 67.9 67.8Capital grants and contributions 15.1 6.5 11.9 9.4 27.0 15.9General revenues: Taxes 590.8 568.6 — — 590.8 568.6 Investment income 0.6 0.6 2.6 3.5 3.2 4.1 Total revenues 807.0 779.3 257.3 251.0 1,064.3 1,030.3Expenses:General government 83.0 66.4 — — 83.0 66.4Convention and tourism 5.8 5.8 — — 5.8 5.8Parks and recreation 31.7 31.4 — — 31.7 31.4Judicial 49.6 51.1 — — 49.6 51.1Streets 75.3 75.7 — — 75.3 75.7Public safety: Fire 92.4 88.0 — — 92.4 88.0 Police 280.3 226.5 — — 280.3 226.5 Other 60.7 60.6 — — 60.7 60.6Health and welfare 56.0 57.0 — — 56.0 57.0Public service 79.7 79.5 — — 79.7 79.5Community development 47.3 82.5 — — 47.3 82.5Interest and fiscal charges 58.4 60.0 — — 58.4 60.0Airport — — 176.9 165.7 176.9 165.7Water Division — — 49.0 49.7 49.0 49.7Parking Division — — 16.5 15.3 16.5 15.3 Total expenses 920.2 884.5 242.4 230.7 1,162.6 1,115.2Excess (deficiency) before extraordinary items and transfers (113.2) (105.2) 14.9 20.3 (98.3) (84.9)Extraordinary items — — 0.0 0.7 0.0 0.7Transfers 11.4 9.9 (11.4) (9.9) — — Change in net position (101.8) (95.3) 3.5 11.1 (98.3) (84.2)Net position-beginning of year (569.2) (473.9) 1,314.0 1,302.9 744.8 829.0Net position-end of year $ (671.0) (569.2) 1,317.5 1,314.0 646.5 744.8
City of St. Louis, MissouriSchedule of Changes in Net Position
For the Fiscal Years ended June 30, 2017 and 2016(dollars in millions)

CITY OF ST. LOUIS, MISSOURI MANAGEMENT’S DISCUSSION AND ANALYSIS – UNAUDITED
JUNE 30, 2017
11
Changes in net position. The City’s total revenue on a government-wide basis was $1,064.3 million, an increase of $34.0 million over the previous year. Taxes represent 55.5% of the City’s revenue as compared with 55.2% last year. Additionally, 35.3% comes from fees charged for services, as compared to 36.3% of the previous year’s revenue. The remainder is state and federal aid, interest earnings, and miscellaneous revenues.
The total cost of all programs and services was $1,162.6 million, an increase from $1,120.8 million last fiscal year. The City’s expenses cover a range of typical City/county services. The largest program was the Airport. The program with the largest burden on general revenues was public safety.
Governmental activities. As a result of this year’s operations, the net position of governmental activities decreased by $101.8 million or 17.9%. The decrease was mainly driven by costs associated with the net pension obligations of the City’s four retirement plans. The net position decrease is primarily related to the anticipated level of spending over the expected growth in revenues. Revenues increased by $27.7 million or 3.6%.
The following chart reflects the revenues by type as a percentage of total revenues for governmental activities for fiscal year 2017.
Taxes73%
Operating Grantsand Contributions
8%
Capital Grantsand Contributions
2%
Charges for Services17%
Investment Income0%

CITY OF ST. LOUIS, MISSOURI MANAGEMENT’S DISCUSSION AND ANALYSIS – UNAUDITED
JUNE 30, 2017
12
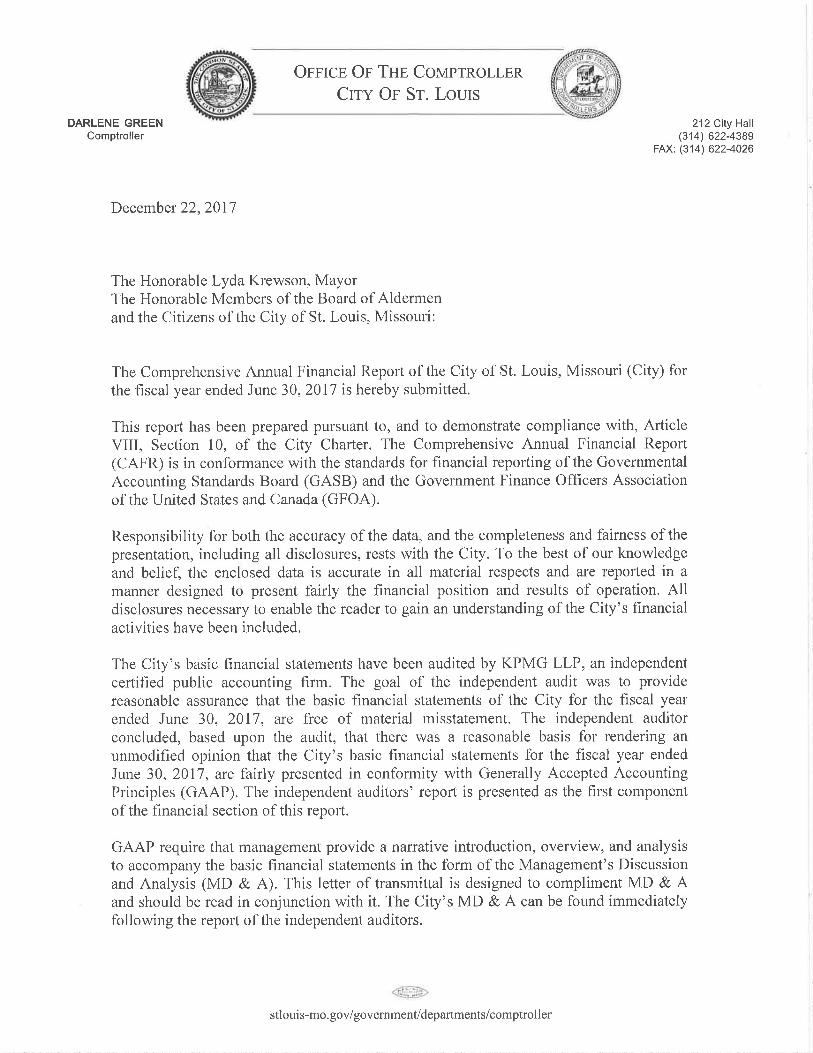
The following chart illustrates the City’s governmental activities expenses by program. Total cost of governmental activities was $920.2 million, an increase of $35.6 million or 4.0% over the prior year. As shown, public safety is the largest function in expense (47.1%). The majority of the spending was the result of funding Police of $280.3 million and Fire of $92.4 million, which includes any costs associated with their retirement plans.
General Government 83.0
Convention & Tourism 5.8
Parks & Recreation 31.7
Judicial 49.6
Streets 75.3
Public Safety 433.4
Health & Welfare 56.0
Public Service 79.7
Community Development 47.3
Interest andfiscal charges
58.4
CITY OF ST. LOUIS, MISSOURI MANAGEMENT’S DISCUSSION AND ANALYSIS – UNAUDITED
JUNE 30, 2017
13
The following chart is a comparison of expense of governmental activities for fiscal years ended 2017 and 2016.
Governmental Activities Program Expenses
2017
2016
CITY OF ST. LOUIS, MISSOURI MANAGEMENT’S DISCUSSION AND ANALYSIS – UNAUDITED
JUNE 30, 2017
14
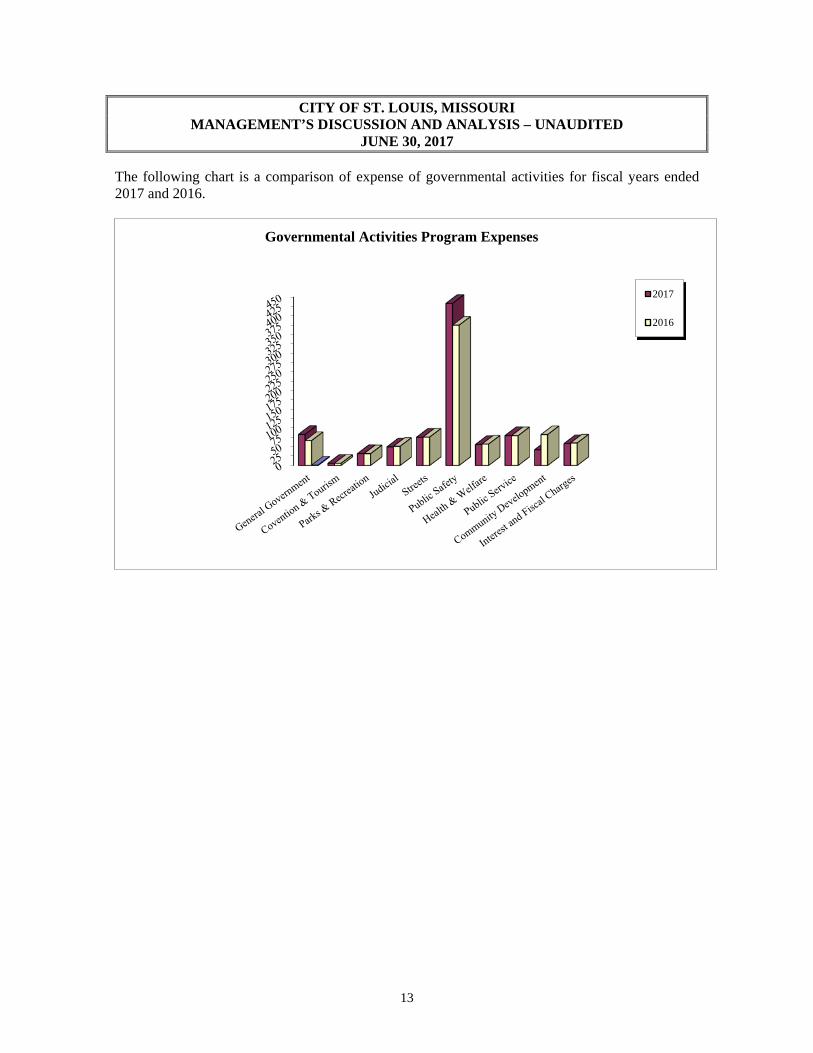
The following chart depicts the total expenses and total program revenues of the City’s governmental functions for the year ended June 30, 2017.
City of St. Louis, MissouriGovernmental Activities
(dollars in millions)
Total Cost of Services Net Costs of Services2017 2016 2017 2016
General government $ 83.0 66.4 (37.8) (23.1)Convention and tourism 5.8 5.8 (5.8) (5.8)Parks and recreation 31.7 31.4 (25.8) (25.5)Judicial 49.6 51.1 (41.1) (38.9)Streets 75.3 75.7 (47.1) (47.7)Public Safety: Fire 92.4 88.0 (79.8) (77.1) Police 280.3 226.5 (274.9) (219.8) Other 60.7 60.6 (37.1) (35.0)Health and welfare 56.0 57.1 (21.6) (19.9)Public service 79.7 79.5 (59.8) (67.6)Community development 47.3 82.5 (15.2) (54.2)
Totals $ 861.8 824.6 (646.0) (614.6)
0.025.050.075.0
100.0125.0150.0175.0200.0225.0250.0
Governmental Program Revenues and Expenses
Program Revenues Program Expenses

CITY OF ST. LOUIS, MISSOURI MANAGEMENT’S DISCUSSION AND ANALYSIS – UNAUDITED
JUNE 30, 2017
15
The preceding charts represent the cost of governmental activities this year excluding interest and fiscal charges. The cost this year was $861.8 million compared with $824.6 million last year. However, as shown in the statement of activities, the amount that our taxpayers ultimately financed for these activities through City taxes was $590.8 million. The primary difference of $265.5 million comprises charges for services ($133.7 million), operating grants and contributions ($66.8 million), and capital grants and contributions ($15.1 million). Business-Type activities. Business-type activities reflect an increase in net position of $3.5 million or 0.3%. Lambert – St. Louis International Airport. The net position of the Airport increased by $0.2 million or 0.02%. The operating income was ($1.3) million this year versus operating income of $5.5 million in 2016. Total operating revenues for 2017 was $140.1 million. Of this amount, major sources of operating revenue included aviation revenues (61.0%), concessions (18.8%), parking, net (16.5%), and lease revenue (3.7%). A significant non-operating revenue is passenger facility charges which accounts for $26.8 million. At June 30, 2017, the capital assets balance was $1,557.2 million. This amount includes buildings and structures of $243.7 million, pavings with $510.7 million, and equipment with $24.2 million, all net of accumulated depreciation. Land is $751.1 million, construction in progress is $24.0 million, and easements is $3.5 million. At June 30, 2017, the Airport had bonded debt of $906.3 million. At the end of fiscal year 2017, the airport issued $125.4 million in refunding bonds that the money is currently held in escrow, crossing fiscal years to refund the Series 2007A bond on July 3, 2017 causing the balance to show a significant increase in debt. Water Division The net position of the Water Division increased by $2.7 million or 1.5%. Operating income was $4.8 million in fiscal year 2017 and $7.0 million in fiscal year 2016. Total operating revenues for 2017 was $53.6 million. Of this amount, major sources of operating revenue included metered revenue (41.2%) and flat rate revenue (46.5%). At June 30, 2017, the capital assets balance was $161.3 million. This amount includes buildings and structures (net of accumulated depreciation) with $14 million, reservoirs and water mains, lines and accessories with $98.4 million, equipment with $32.9 million, land with $1.2 million, and construction-in-progress with $14.8 million. At June 30, 2017, the Water Division had bonded debt of $8.5 million. Parking Division. The net position of the Parking Division increased by $0.6 million or 1.6%. Operating income was $6.5 million in fiscal year 2017 and $6.1 million in fiscal year 2016. Total operating revenues for 2017 was $18.0 million. Of this amount, major sources of operating revenue included parking meter revenue (17.4%), parking violations notices revenue (24.0%), and parking facilities revenue (54.3%). At June 30, 2017, the capital assets balance was $73.7 million. This amount includes buildings and parking garages (net of accumulated depreciation) with $45.4 million, parking meters and lot equipment with $4.5 million, equipment with $0.9 million, and land with $22.9 million.

CITY OF ST. LOUIS, MISSOURI MANAGEMENT’S DISCUSSION AND ANALYSIS – UNAUDITED
JUNE 30, 2017
16
At June 30, 2017, the Parking Division had bonded debt of $64.4 million.
City of St. Louis, MissouriBalance Sheet
Governmental FundsJune 30, 2017
(dollars in millions)
2017 vs. 2016 2017 vs. 20162017 2016 $ Change % Change
Total assets $ 386.0 366.5 19.5 5.3%
Total liabilities 95.2 96.2 (1.0) -1.0%Deferred inflow of resources 104.0 97.7 6.3 6.4%Fund balance:
Restricted and Nonspendable 128.9 110.5 18.4 16.7%Committed 69.3 80.5 (11.2) -13.9%Assigned 4.1 4.8 (0.7) -14.6%Unassigned (15.5) (23.2) 7.7 33.2%
Total fund balance 186.8 172.6 14.2 8.2%Total liabilities, deferred inflow
of resources, and fund balance $ 386.0 366.5 19.5 5.3%
FINANCIAL ANALYSIS OF THE CITY’S FUNDS
Governmental Funds
The focus of the City’s governmental funds is to provide information on inflows, outflows and balances of current financial resources that are available for spending. At the end of the current fiscal year, the unassigned fund balance of the general fund was $1.5 million.
The total fund balance in the City’s general fund decreased by $4.0 million or 18% in the current fiscal year. The City’s general fund decreased by $6.4 million or 22.2% in the prior fiscal year. During fiscal year 2017, the committed balance of the fund balance was used to fund a 27th pay period the City experienced (a quirk of the biweekly pay calendar that occurs every eleven years).
The total fund balance in the redevelopment projects fund increased by $1.1 million or 3.0% in the current fiscal year. The increase is due to the increase tax revenues received this year which is from the profitability of the redevelopment.
The total fund balance in the City’s capital projects fund increased by $12.5 million or 19.7% in the current fiscal year. The City’s capital projects fund decreased by $9.7 million or 18% in the prior fiscal year. This is primarily due to the balance of general obligation bonds issued in fiscal year 2017 to be used for capital improvements.
The grants fund received $66.8 million in intergovernmental revenues that funded community development in the amount of $21.4 million, or 32.1%, and health and welfare in the amount of $34.1 million, or 51.1% in the current fiscal year. The grants fund received $67.1 million in

CITY OF ST. LOUIS, MISSOURI MANAGEMENT’S DISCUSSION AND ANALYSIS – UNAUDITED
JUNE 30, 2017
17
intergovernmental revenues that funded community development in the amount of $20.5 million, or 30.6%, and health and welfare in the amount of $35.6 million, or 53.1% in the prior fiscal year.
The total fund balance in the City’s other governmental funds increased by $4.7 million or 9.3% in the current fiscal year. The City’s other governmental funds decreased by $1.4 million or 2.7 % in the prior fiscal year.
Proprietary Funds
The City’s proprietary funds provide the same type of information found in the government-wide financial statements, but in more detail.
At the end of the fiscal year, the unrestricted net position for the Airport was $64.9 million, the Water Division was $27.0 million, and the Parking Division was $21.0 million, as compared with $71.1 million, $26.7 million, and $20.4 million, respectively in 2016. The total increase in net position for the enterprise funds was $3.5 million in the current year.
Fiduciary Funds
The City maintains fiduciary funds for the assets of the pension trust funds for the Firemen’s Retirement System, the Firefighters’ Retirement Plan, the Police Retirement System, and the Employees Retirement System. As of the end of the funds’ fiscal year ended September 30, 2016, the net position of the pension funds totaled $2.0 billion, a increase of $0.1 billion from the previous year.
The City is the custodian of the agency funds and the most common use of agency funds is for pass-through activity. Since, by definition, all assets of the agency funds are held for the benefit of other entities, there is no net position to discuss. As of the end of the current fiscal year, the combined gross assets of the agency funds totaled $55.5 million. This amount comprises activity from the collector of revenue, property tax escrow, general insurance, bail bonds, license collector, circuit clerk, police agency, treasurer’s office college fund and other miscellaneous agency activities.
General Fund Budgetary Highlights
The final budget for the City’s general fund represents the original budget plus any previously appropriated funds set aside for the purpose of honoring legally incurred obligations (prior year encumbrances and commitments) plus any additional supplemental appropriations that may occur during the fiscal year.
This discussion presents the budget information on the budgetary basis as the Board of Alderman approves the budget.
The original general fund revenue estimate including transfers in and the transfer of the 27th pay reserve, totaled $511.1 million. Actual results for the fiscal year’s revenues and transfers in were $506.1 million, which was below the original estimates by $5.0 million or 1% of the estimate.
The original general fund expense budget was $514.7 million including transfers out. This also includes prior year encumbrances and commitments of $3.7 million set aside and re-appropriated. Actual expenditures and transfers out totaled $507.0 million. This includes expenditures of $1.7 million from prior year encumbrances and commitments. The encumbrances and commitments carried over into the next fiscal year in regard to the fiscal year 2017 budget total $2.5 million. The general fund ended the fiscal year with a budget-basis-operating deficit of $0.8 million.

CITY OF ST. LOUIS, MISSOURI MANAGEMENT’S DISCUSSION AND ANALYSIS – UNAUDITED
JUNE 30, 2017
18
CAPITAL ASSETS AND DEBT ADMINISTRATION
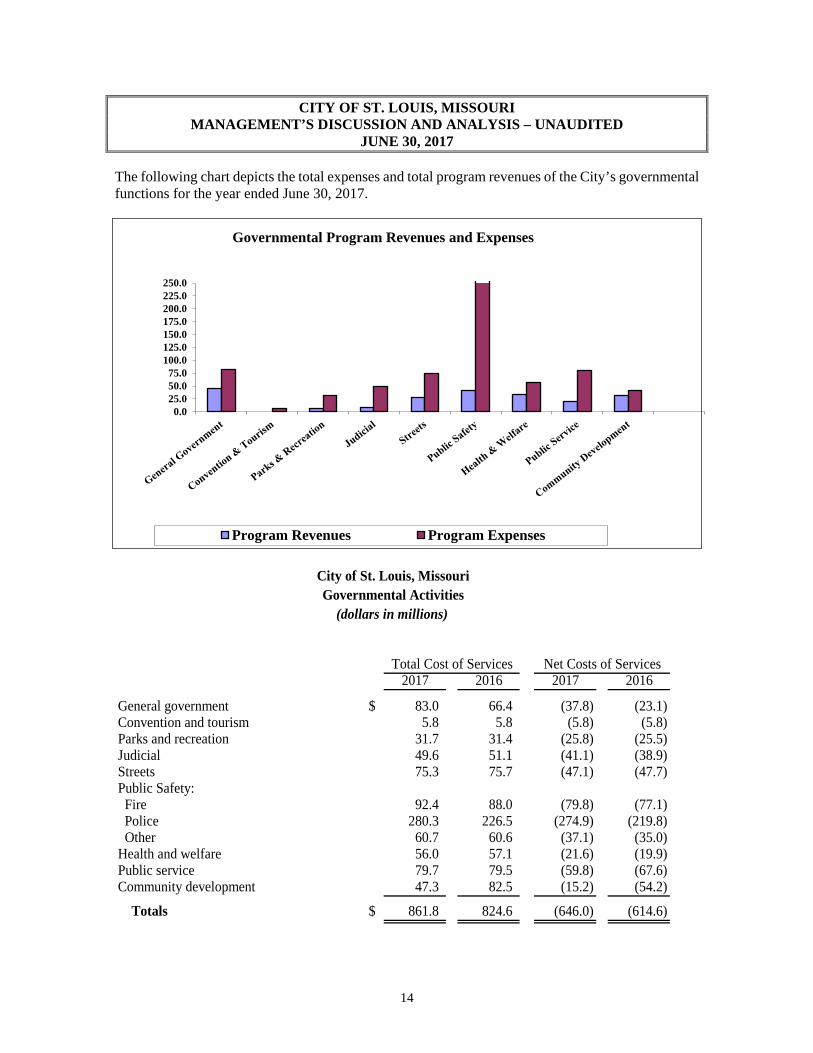
Capital Assets The City had invested $2.6 billion in a broad range of capital assets, including fire equipment, park facilities, roads, bridges, runways and water systems.
City of St. Louis, MissouriSchedule of Changes in Capital Assets
Net of Accumulated Depreciation(dollars in millions)
Governmental Business-typeActivities Activities
2017 2016 2017 2016 2017 2016
Land $ 81.7 81.7 775.2 775.2 856.9 856.9Construction in progress 33.4 13.9 38.9 24.5 72.3 38.4Equipment in progress 0.2 0.0 — — 0.2 0.0Intangibles 1.3 2.2 3.5 3.5 4.8 5.7Works of art 3.6 3.6 — — 3.6 3.6Buildings and improvements 460.1 464.5 303.0 323.1 763.1 787.6Equipment 60.4 57.8 62.5 63.6 122.9 121.4Infrastructure 172.2 196.6 — — 172.2 196.6Intangibles 0.6 0.9 — — 0.6 0.9Pavings — — 510.6 529.1 510.6 529.1Reservoirs — — 21.1 21.8 21.1 21.8Water mains, lines,
accessories — — 77.4 76.7 77.4 76.7
Total $ 813.5 821.2 1,792.2 1,817.5 2,605.7 2,638.7
Total
CITY OF ST. LOUIS, MISSOURI MANAGEMENT’S DISCUSSION AND ANALYSIS – UNAUDITED
JUNE 30, 2017
19
For government-wide financial presentation, all depreciable capital assets were depreciated from acquisition date to the end of the current fiscal year. Governmental fund financial statements record capital asset purchases as expenditures.
For additional information on capital assets, refer to note 7 in the notes to the basic financial statements.
Long-Term Debt
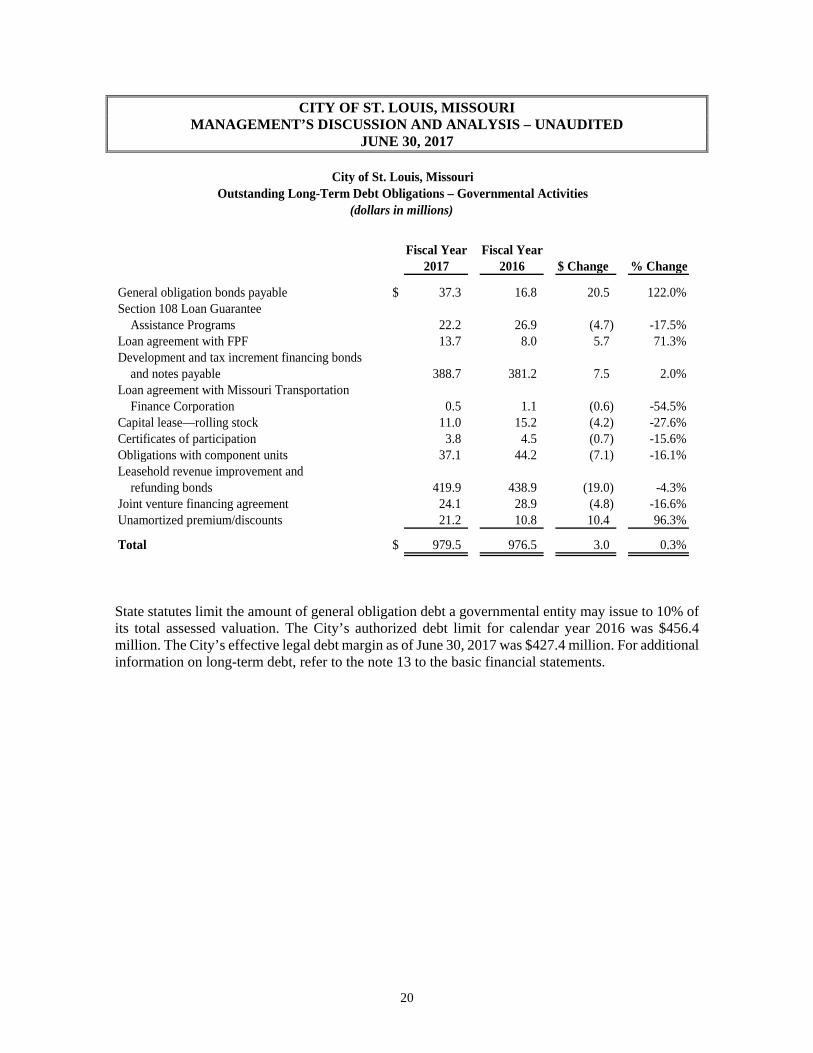
At the end of fiscal year 2017, the City had outstanding long-term debt obligations for governmental activities in the amount of $979.5 million compared with $976.5 million in fiscal year 2016. Of this amount, $37.3 million are general obligation bonds and $388.7 million are development and tax increment financing bonds and notes payable. Leasehold revenue obligations outstanding totaled $419.9 million.
0.0
100.0
200.0
300.0
400.0
500.0
600.0
700.0
800.0
900.0Capital Assets
2017
2016
CITY OF ST. LOUIS, MISSOURI MANAGEMENT’S DISCUSSION AND ANALYSIS – UNAUDITED
JUNE 30, 2017
20
City of St. Louis, MissouriOutstanding Long-Term Debt Obligations – Governmental Activities
(dollars in millions)
Fiscal Year Fiscal Year2017 2016 $ Change % Change
General obligation bonds payable $ 37.3 16.8 20.5 122.0%Section 108 Loan Guarantee Assistance Programs 22.2 26.9 (4.7) -17.5%Loan agreement with FPF 13.7 8.0 5.7 71.3%Development and tax increment financing bonds and notes payable 388.7 381.2 7.5 2.0%Loan agreement with Missouri Transportation Finance Corporation 0.5 1.1 (0.6) -54.5%Capital lease—rolling stock 11.0 15.2 (4.2) -27.6%Certificates of participation 3.8 4.5 (0.7) -15.6%Obligations with component units 37.1 44.2 (7.1) -16.1%Leasehold revenue improvement and refunding bonds 419.9 438.9 (19.0) -4.3%Joint venture financing agreement 24.1 28.9 (4.8) -16.6%Unamortized premium/discounts 21.2 10.8 10.4 96.3%
Total $ 979.5 976.5 3.0 0.3%
State statutes limit the amount of general obligation debt a governmental entity may issue to 10% of its total assessed valuation. The City’s authorized debt limit for calendar year 2016 was $456.4 million. The City’s effective legal debt margin as of June 30, 2017 was $427.4 million. For additional information on long-term debt, refer to the note 13 to the basic financial statements.

CITY OF ST. LOUIS, MISSOURI MANAGEMENT’S DISCUSSION AND ANALYSIS – UNAUDITED
JUNE 30, 2017
21
The City’s underlying general obligation credit ratings changed for fiscal year 2017. The City ratings on uninsured general obligation bonds as of June 30, 2017 were:
Moody’s Investor’s Service, Inc. A3 Standard and Poor’s Corporation A+ Fitch IBCA, Inc. Ratings A-
City of St. Louis, MissouriRevenue Bonds Outstanding
Long-Term Debt Obligations – Business-Type Activities(dollars in millions)
Fiscal Year Fiscal Year2017 2016 $ Change % Change
Airport $ 906.3 686.2 220.1 32.08%Water Division 8.5 5.1 3.4 66.67%Parking Division 64.4 67.1 (2.7) -4.02%
Total $ 979.2 758.4 220.8 29.11%
Outstanding revenue bonds of the business-type activities of the City as of June 30, 2017 and 2016 were $979.2 million and $758.4 million, respectively. The amount reflects a increase of $220.8 million, or 29.1%. This amount includes Airport bonds of $906.3 million, Water Division bonds of $8.5 million, and Parking Division bonds of $64.4 million. At the end of fiscal year 2017, the airport issued $125.4 million in refunding bonds that the money is currently held in escrow crossing fiscal years to refund the Series 2007A bond on July 3, 2017 causing the balance to show a significant increase in debt. For additional information on revenue bonds of the business-type activities, refer to notes 13 and 17 of the basic financial statements. Economic Factors and Next Year’s Budget
• The fiscal year 2018 annual operating budget allocates $1,053.5 million among all budgeted funds, a 1.2% increase over the previous year’s budget.
• The fiscal year 2018 general fund budget is $510.4 million compared with $511.1 million in
fiscal year 2017. This amount reflects a decrease of $0.7 million, or 0.1%. After adjusting for the occurrence of a 27th pay period in fiscal year, the general fund is budget will actually see an increase of 1.9%
• Total employee positions for fiscal year 2018 are 6,622 which is down 51 positions from the prior fiscal year.

CITY OF ST. LOUIS, MISSOURI MANAGEMENT’S DISCUSSION AND ANALYSIS – UNAUDITED
JUNE 30, 2017
22
Requests for Information This financial report is designed to provide our citizens, taxpayers, customers, investors, and creditors with a general overview of the City’s finances and to demonstrate the City’s accountability for the money it receives. If you have any questions about this report or need additional information, please contact the Office of the Comptroller of the City of St. Louis, 1200 Market Street, Room 311, Saint Louis, Missouri 63103.


23
City of St. Louis, MissouriStatement of Net Position
June 30, 2017(dollars in thousands)
Primary GovernmentComponent
unitGovernmental Business-type
activities activities Total SLDC
Cash and cash equivalents $ 75,779 64,291 140,070 12,157 Investments 26,545 107,029 133,574 55 Receivables, net 186,955 25,457 212,412 17,512 Inventories 1,464 4,825 6,289 — Restricted assets 89,473 463,990 553,463 — Internal balances 12,040 (12,040) — — Other assets 2,167 3,356 5,523 589 Receivable from primary government — — — 171 Property held for development, net — — — 17,250 Capital assets, net:
Nondepreciable 120,147 817,568 937,715 7,686 Depreciable 693,357 974,591 1,667,948 21,364
Total assets 1,207,927 2,449,067 3,656,994 76,784
236,904 31,399 268,303 —
Total assets and deferred outflow of resources 1,444,831 2,480,466 3,925,297 76,784
Accounts payable and accrued liabilities 19,298 21,337 40,635 1,977 Accrued salaries and other benefits 11,898 8,469 20,367 — Accrued interest payable 134,861 17,548 152,409 — Unearned revenue 3,970 4,527 8,497 — Other liabilities 2,027 — 2,027 — Payable to component unit 171 — 171 — Payable to other government agencies 3 51 54 — Long-term liabilities:
Due within one year 125,424 279,688 405,112 5,409 Due in more than one year 1,802,386 825,366 2,627,752 44,723
Total liabilities 2,100,038 1,156,986 3,257,024 52,109
15,788 5,985 21,773 —
Total liabilities and deferred inflow of resources 2,115,826 1,162,971 3,278,797 52,109
Net investments in capital assets 506,299 785,214 1,291,513 16,602 Restricted:
Debt service 37,147 390,627 427,774 — Capital projects 14 — 14 — Passenger facility charges — 28,729 28,729 — Statutory restrictions 26,330 — 26,330 —
Unrestricted (deficit) (1,240,785) 112,925 (1,127,860) 8,073 Total net position $ (670,995) 1,317,495 646,500 24,675
See accompanying notes to basic financial statements.
Assets
Liabilities
Net Position
Deferred outflow of resources
Deferred inflow of resources
24
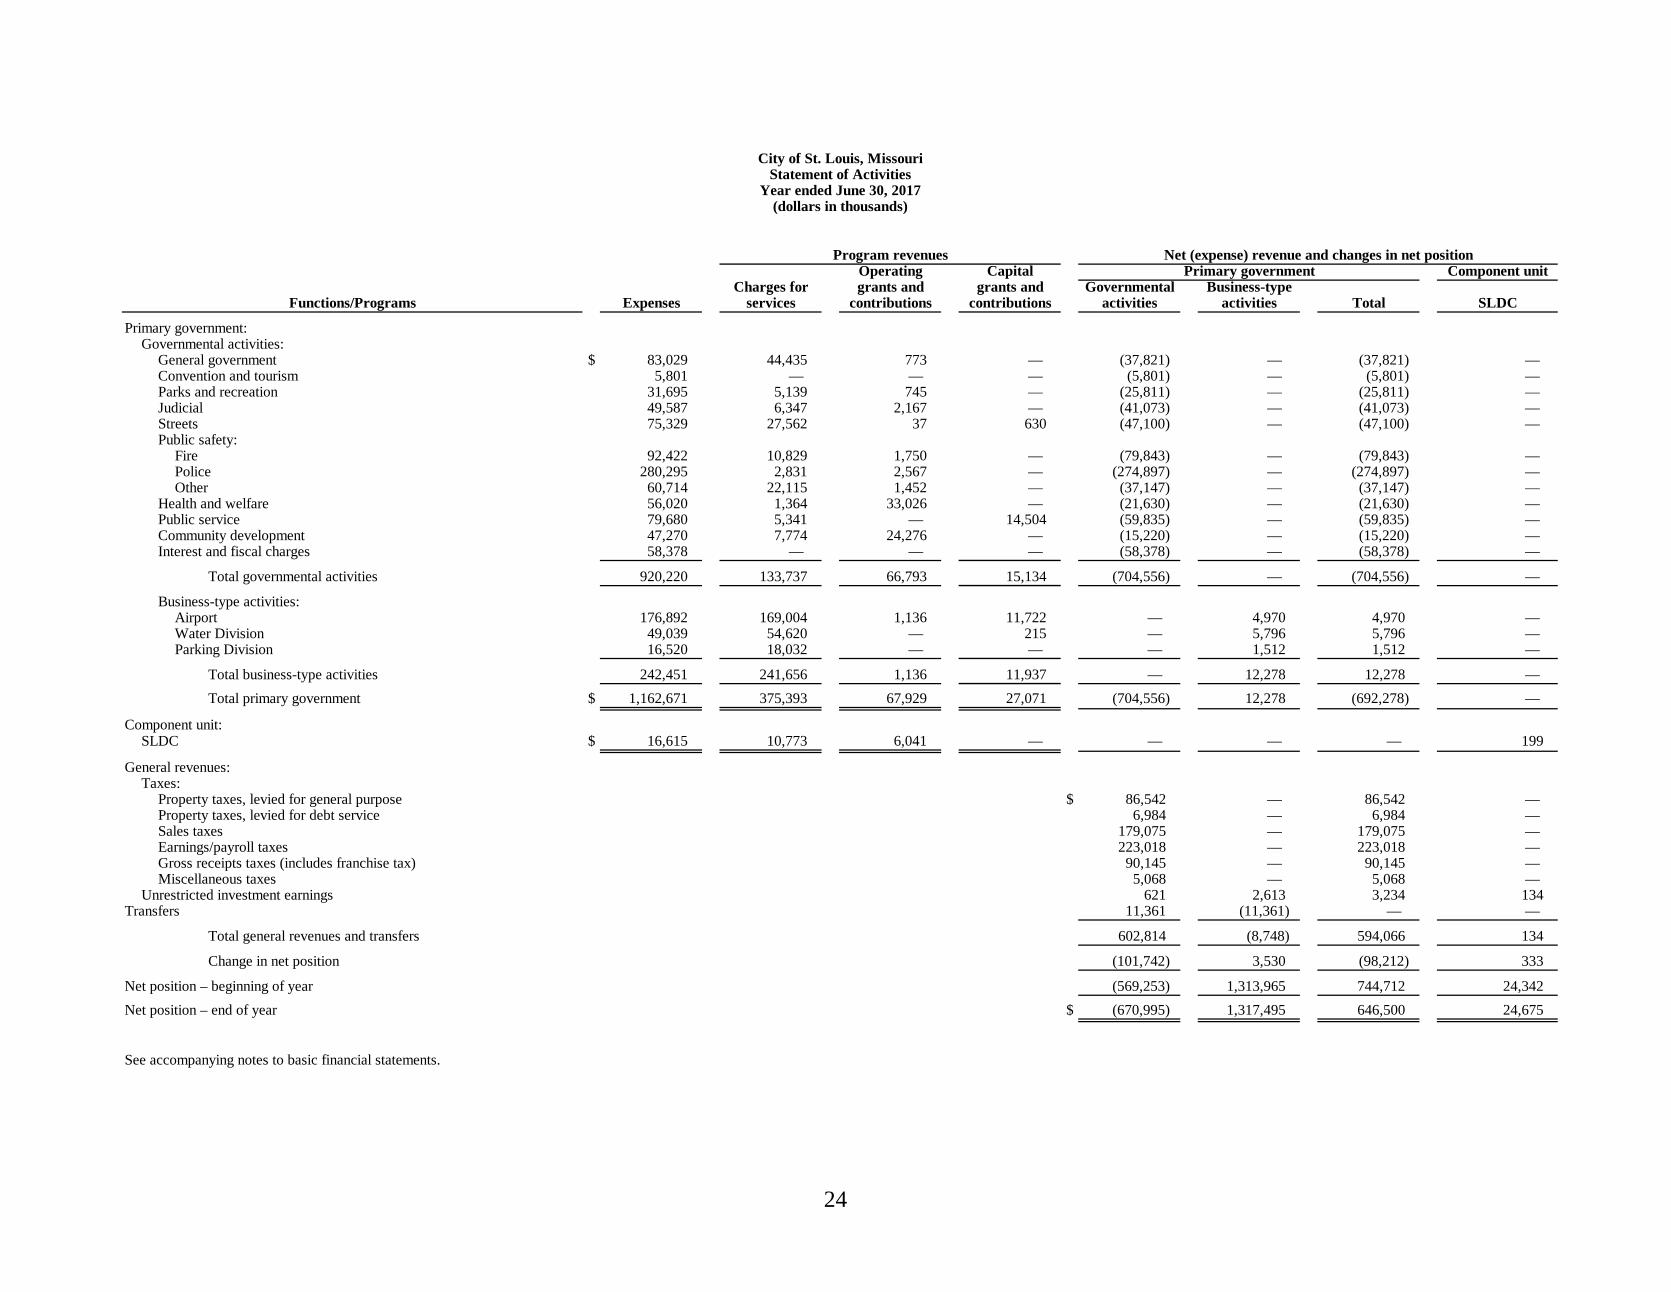
City of St. Louis, MissouriStatement of Activities
Year ended June 30, 2017(dollars in thousands)
Program revenues Net (expense) revenue and changes in net positionOperating Capital Primary government Component unit
Charges for grants and grants and Governmental Business-typeFunctions/Programs Expenses services contributions contributions activities activities Total SLDC
Primary government:Governmental activities:
General government $ 83,029 44,435 773 — (37,821) — (37,821) — Convention and tourism 5,801 — — — (5,801) — (5,801) — Parks and recreation 31,695 5,139 745 — (25,811) — (25,811) — Judicial 49,587 6,347 2,167 — (41,073) — (41,073) — Streets 75,329 27,562 37 630 (47,100) — (47,100) — Public safety:
Fire 92,422 10,829 1,750 — (79,843) — (79,843) — Police 280,295 2,831 2,567 — (274,897) — (274,897) — Other 60,714 22,115 1,452 — (37,147) — (37,147) —
Health and welfare 56,020 1,364 33,026 — (21,630) — (21,630) — Public service 79,680 5,341 — 14,504 (59,835) — (59,835) — Community development 47,270 7,774 24,276 — (15,220) — (15,220) — Interest and fiscal charges 58,378 — — — (58,378) — (58,378) —
Total governmental activities 920,220 133,737 66,793 15,134 (704,556) — (704,556) —
Business-type activities:Airport 176,892 169,004 1,136 11,722 — 4,970 4,970 — Water Division 49,039 54,620 — 215 — 5,796 5,796 — Parking Division 16,520 18,032 — — — 1,512 1,512 —
Total business-type activities 242,451 241,656 1,136 11,937 — 12,278 12,278 — Total primary government $ 1,162,671 375,393 67,929 27,071 (704,556) 12,278 (692,278) —
Component unit:SLDC $ 16,615 10,773 6,041 — — — — 199
General revenues:Taxes:
Property taxes, levied for general purpose $ 86,542 — 86,542 — Property taxes, levied for debt service 6,984 — 6,984 — Sales taxes 179,075 — 179,075 — Earnings/payroll taxes 223,018 — 223,018 — Gross receipts taxes (includes franchise tax) 90,145 — 90,145 — Miscellaneous taxes 5,068 — 5,068 —
Unrestricted investment earnings 621 2,613 3,234 134 Transfers 11,361 (11,361) — —
Total general revenues and transfers 602,814 (8,748) 594,066 134
Change in net position (101,742) 3,530 (98,212) 333
Net position – beginning of year (569,253) 1,313,965 744,712 24,342 Net position – end of year $ (670,995) 1,317,495 646,500 24,675
See accompanying notes to basic financial statements.
25
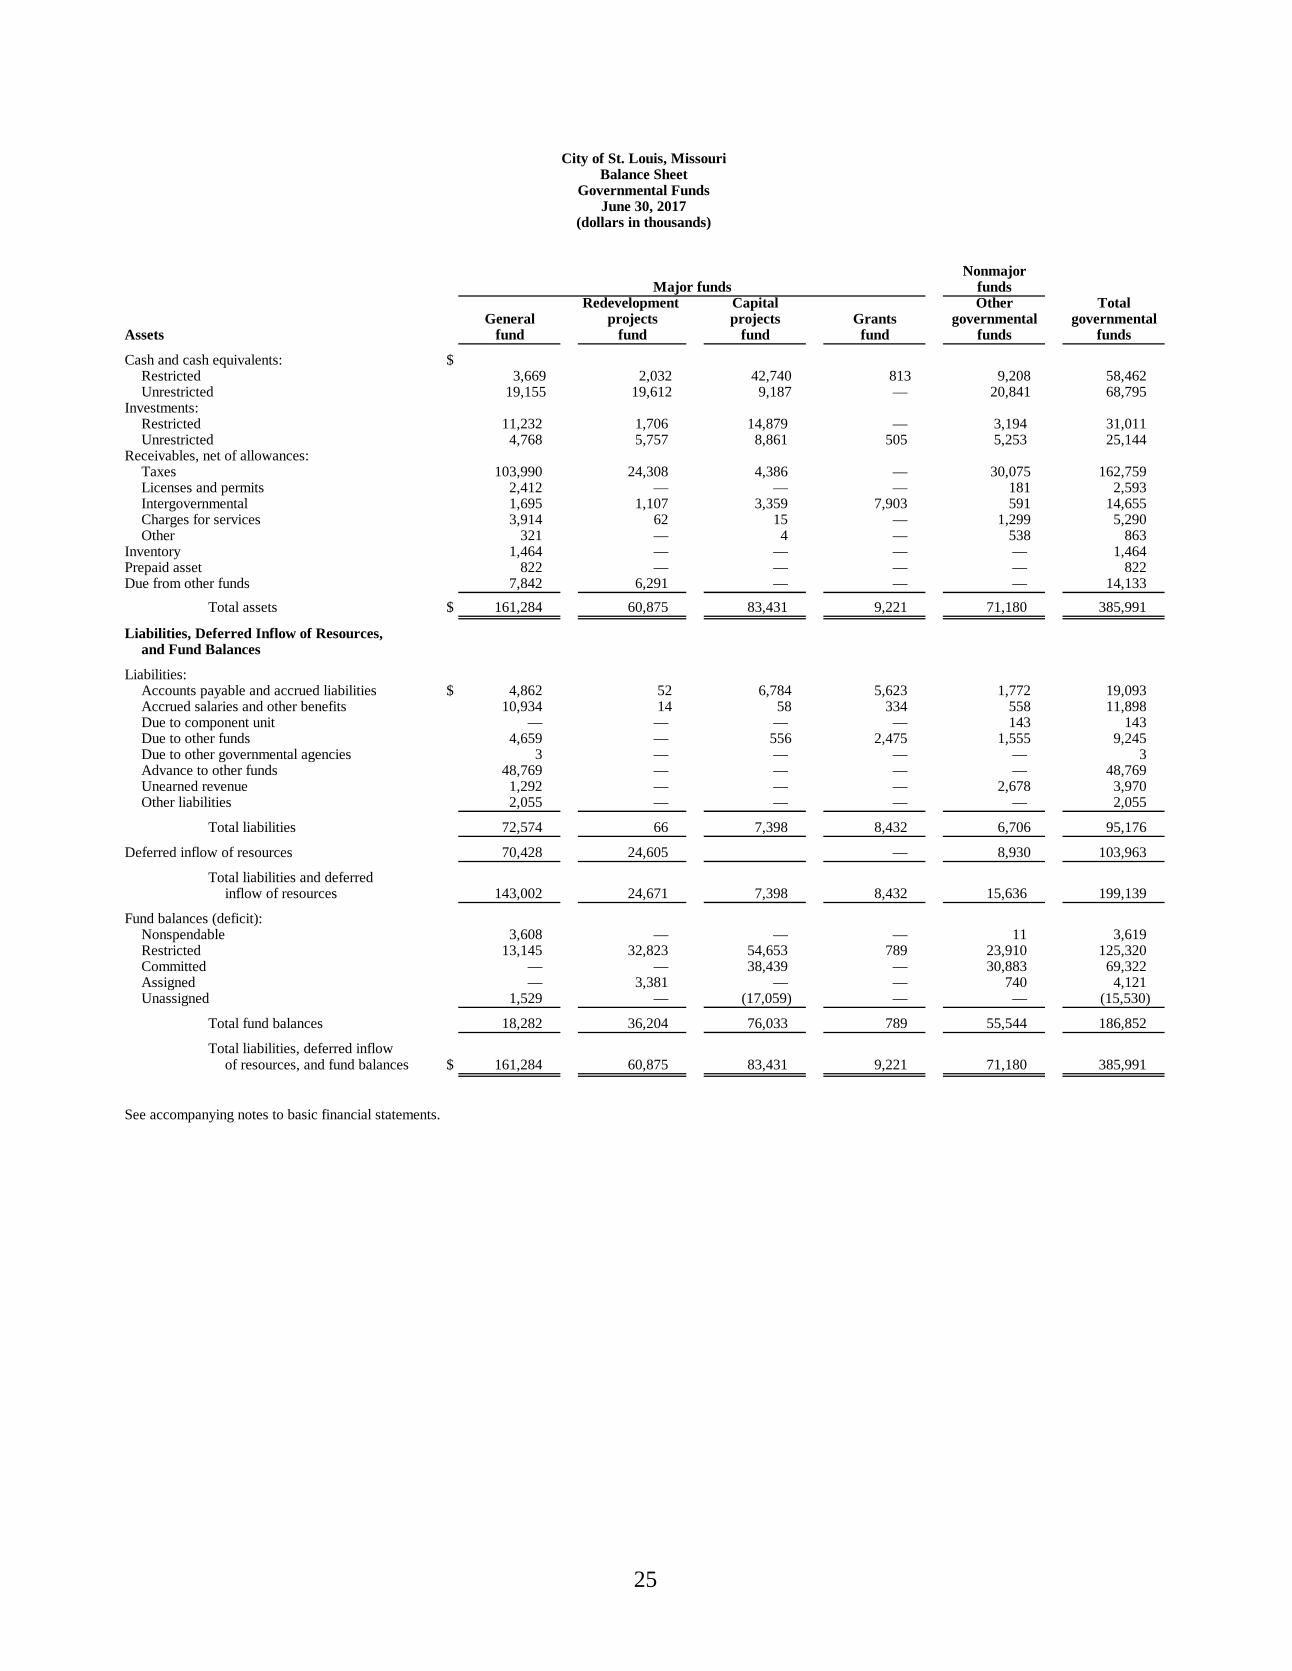
City of St. Louis, MissouriBalance Sheet
Governmental FundsJune 30, 2017
(dollars in thousands)
NonmajorMajor funds funds
Redevelopment Capital Other TotalGeneral projects projects Grants governmental governmental
fund fund fund fund funds funds
Cash and cash equivalents: $Restricted 3,669 2,032 42,740 813 9,208 58,462 Unrestricted 19,155 19,612 9,187 — 20,841 68,795
Investments:Restricted 11,232 1,706 14,879 — 3,194 31,011 Unrestricted 4,768 5,757 8,861 505 5,253 25,144
Receivables, net of allowances:Taxes 103,990 24,308 4,386 — 30,075 162,759 Licenses and permits 2,412 — — — 181 2,593 Intergovernmental 1,695 1,107 3,359 7,903 591 14,655 Charges for services 3,914 62 15 — 1,299 5,290 Other 321 — 4 — 538 863
Inventory 1,464 — — — — 1,464 Prepaid asset 822 — — — — 822 Due from other funds 7,842 6,291 — — — 14,133
Total assets $ 161,284 60,875 83,431 9,221 71,180 385,991
and Fund Balances
Liabilities:Accounts payable and accrued liabilities $ 4,862 52 6,784 5,623 1,772 19,093 Accrued salaries and other benefits 10,934 14 58 334 558 11,898 Due to component unit — — — — 143 143 Due to other funds 4,659 — 556 2,475 1,555 9,245 Due to other governmental agencies 3 — — — — 3 Advance to other funds 48,769 — — — — 48,769 Unearned revenue 1,292 — — — 2,678 3,970 Other liabilities 2,055 — — — — 2,055
Total liabilities 72,574 66 7,398 8,432 6,706 95,176
Deferred inflow of resources 70,428 24,605 — 8,930 103,963
Total liabilities and deferredinflow of resources 143,002 24,671 7,398 8,432 15,636 199,139
Fund balances (deficit):Nonspendable 3,608 — — — 11 3,619 Restricted 13,145 32,823 54,653 789 23,910 125,320 Committed — — 38,439 — 30,883 69,322 Assigned — 3,381 — — 740 4,121 Unassigned 1,529 — (17,059) — — (15,530)
Total fund balances 18,282 36,204 76,033 789 55,544 186,852
Total liabilities, deferred inflowof resources, and fund balances $ 161,284 60,875 83,431 9,221 71,180 385,991
See accompanying notes to basic financial statements.
Assets
Liabilities, Deferred Inflow of Resources,

26
City of St. Louis, MissouriReconciliation of the Balance Sheet of Governmental Funds
to the Statement of Net PositionJune 30, 2017
(dollars in thousands)
Total fund balances—governmental funds—balance sheet $ 186,852
Amounts reported for governmental activities in the statement of net position are different because:Capital assets and certain other assets used in governmental activities, which exceed capitalization threshold
amounts (excluding internal service fund capital assets), are not financial resources and, therefore, arenot reported in the fund financial statements. 813,449
Various taxes related to fiscal year 2017 will be collected beyond the 60-day period and are not recognizedas revenue in the fund financial statements. Revenue for this amount is recognized in thegovernment-wide financial statements. 9,288
Property taxes are assessed by the City on January 1st of each calendar year, but are not due untilDecember 31st. Taxes assessed on January 1, 2017 and payable on December 31, 2017 aredeferred inflows of resources within the fund financial statements. However, revenue for thisamount is recognized in the government-wide financial statements. 94,675
Internal service funds are used by management to charge the cost of risk management, mailroomservices, health and equipment services to the individual funds, generally on a cost reimbursement basis. The assets and liabilities of internal service funds are included in governmental activities in the statement of net position. 5,658
Long-term liabilities applicable to the City’s governmental activities are not due and payable in the currentperiod and, accordingly, are not reported as liabilities within the fund financial statements. Interest onlong-term debt is not accrued in governmental funds, but rather is recognized as an expenditure whendue. All liabilities—both current and long-term—are reported on the government-wide statement ofnet position. Also, during the year, the City issued new debt and refunded some of its existing debt.Discounts, premiums, and deferred amounts on refunding are reported in the governmental fundfinancial statements when the debt was issued, whereas these amounts are deferred and amortizedover the life of the debt on the government-wide financial statements.
Balances as of June 30, 2017 are:Accrued vacation and sick leave (49,219) Net OPEB Obligation (234,180) Net pension liability (604,324) Accrued interest payable (134,861) Joint venture financing agreement (24,068) Certificates of participation (3,815) Obligations with component unit (37,106) Capital leases-rolling stock (10,983) Leasehold revenue improvement and refunding revenue bonds (419,909) Development and TIF bonds and notes payable (388,669) General obligation bonds (37,345) Section 108 Loan Guarantee Assistance Programs (22,160) Other long-term debt (14,210) Deferred outflow of resources 236,904 Deferred inflow of resources (15,788) Unamortized discounts 2,444 Unamortized premiums (23,628)
Total net position—governmental activities—statement of net position $ (670,995)
See accompanying notes to basic financial statements.

27
City of St. Louis, MissouriStatement of Revenues, Expenditures, and Changes in Fund Balances
Governmental FundsYear ended June 30, 2017
(dollars in thousands)
NonmajorMajor funds funds
Redevelopment Capital Other TotalGeneral projects projects Grants governmental governmental
fund fund fund fund funds funds
Revenues:Taxes $ 382,260 39,024 23,879 — 140,610 585,773 Licenses and permits 19,521 1 — — 6,919 26,441 Intergovernmental 22,142 4,019 15,134 66,793 1,265 109,353 Charges for services, net 31,267 33 197 — 16,816 48,313 Court fines and forfeitures 3,388 — — — — 3,388 Investment income 492 (16) 109 16 20 621 Interfund services provided 4,847 — — — — 4,847 Miscellaneous 6,131 2,775 1,485 — 7,454 17,845
Total revenues 470,048 45,836 40,804 66,809 173,084 796,581
Expenditures:Current:
General government 52,471 1,528 199 845 16,529 71,572 Convention and tourism 119 — — — — 119 Parks and recreation 19,024 — 1,533 688 4,700 25,945 Judicial 44,175 — — 2,236 2,952 49,363 Streets 35,281 — 6,307 40 943 42,571 Public Safety:
Fire 69,849 — — 1,905 1,345 73,099 Police 164,912 — — 2,609 22,901 190,422 Other 49,148 — — 1,564 9,096 59,808
Health and welfare 3,574 — — 34,141 18,124 55,839 Public services 33,838 — 3,505 — 41,881 79,224 Community development — 22,635 3,207 21,428 — 47,270
Capital outlay 1,385 — 45,497 — 725 47,607 Debt service:
Principal 13,405 14,476 19,772 1,270 10,730 59,653 Interest and fiscal charges 17,015 20,456 7,535 124 7,192 52,322 Advance refunding escrow — 2,010 — — — 2,010
Total expenditures 504,196 61,105 87,555 66,850 137,118 856,824
Excess (deficiency) of revenues over expenditures (34,148) (15,269) (46,751) (41) 35,966 (60,243)
Other financing sources (uses):Sale of fixed asset — — 190 — — 190 Issuance of leasehold revenue refunding bonds 24,435 — 19,535 — 42,990 86,960 Issuance of leasehold revenue bonds — — 3,207 — — 3,207 Issuance of general obligation bonds — — 25,000 — — 25,000 Issuance of refunding development and tax increment financing notes — 9,050 — — — 9,050 Issuance of development and tax increment financing notes — 19,794 — — — 19,794 Proceeds from loan agreement with Forest Park Forever — — 7,695 — — 7,695 Payment to refunded escrow agent (26,050) — (21,569) — (44,161) (91,780) Payment of development and tax increment financing notes — (9,050) — — — (9,050) Premium on bond issuances 2,234 — 5,059 — 4,878 12,171 Discount on bond issuances — — (131) — — (131) Transfers in 40,232 — 20,536 — 4,022 64,790 Transfers out (10,707) (3,461) (283) — (38,978) (53,429)
Total other financing (uses) sources, net 30,144 16,333 59,239 — (31,249) 74,467
Net change in fund balances (4,004) 1,064 12,488 (41) 4,717 14,224
Fund balances:Fund balance, beginning of year 22,286 35,140 63,545 830 50,827 172,628 Fund balance, end of year $ 18,282 36,204 76,033 789 55,544 186,852
See accompanying notes to basic financial statements.

28
City of St. Louis, MissouriReconciliation of the Statement of Revenues, Expenditures,
and Changes in Fund Balances of Governmental Fundsto the Statement of Activities
Year ended June 30, 2017(dollars in thousands)
Net change in fund balances—governmental funds—statement of revenues, expenditures, and changes in fund balances $ 14,224
Amounts reported for governmental activities in the statement of activities are different because:
Governmental funds report capital outlays as expenditures. However, in the statement of activities, the cost of thoseassets, meeting the capitalization threshold, is allocated over their estimated useful lives and recorded asdepreciation expense. Additionally, contributions of capital assets to the City are recorded as capital contributionson the statement of activities. This is the amount by which capital outlays and capital contributions, meeting thecapitalization threshold, exceeded depreciation expense in the current year. Details of the reported amountsare as follows:
Capital outlay 47,607 Capital contribution 4,181 Loss on disposal of capital assets (1,172) Depreciation expense (58,337)
(7,721)
Revenues in the statement of activities that do not provide current financial resources are not reported as revenues inthe fund financial statements. These amounts represent the extent to which revenues not providing currentfinancial resources in the current fiscal year exceeded revenues not providing current financial resources in theprior fiscal year (which are recognized in the fund financial statements in the current year). Such amounts areattributable to the following factors:
Change in revenues received after the 60-day accrual period 2,068 Property taxes due in the fiscal year following the fiscal year in which they were assessed 4,148
6,216
Internal service funds are used by management to charge the cost of risk management and mailroom services to theindividual funds. The change in net position of internal service funds attributable to governmental activities is reported on thestatement of activities. 925
The City reports a net pension liability and deferred outflows and inflows relating to pensions on the statement of net position relating to its defined benefit pension plans. These accounts are not reported in the fund financial statements. Fluctuations in net pension liabilities and deferred outflows and inflows relating to pensions are reported in the statement of activities. (81,109)
The City reports a net other postemployment obligation on the statement of net position to the extent actual contributionsto the City’s other postemployment plan falls below the annual required contribution. This obligation is not reported in the fund financial statements. The fluctuation in the net pension obligation is reported in the statement of activities. (28,500)
Bond proceeds are reported as financing sources in governmental funds financial statements and thus contribute tothe net change in fund balance. In the statement of net position, however, issuing debt increases long-term liabilitiesand does not affect the statement of activities. Similarly, repayments of principal is an expenditure in thegovernmental funds financial statements, but reduces the liability in the statement of net position.
Debt issued during the current year:Development and Tax increment financing bonds and notes payable (28,844) General obligation bonds (25,000) Loan agreement with Forest Park Forever (7,695) Leasehold revenue bonds (90,167)
Repayments during the current year:Payments to refunded escrow agent - leasehold revenue bonds 91,780 Payment of development and tax increment financing notes 9,050 Advance refunding escrow payment to refund development and tax increment financing notes 2,010 Annual principal payments on bonds and notes payable 49,996 Annual principal payments on joint venture financing agreement 4,777 Annual principal payments on capital lease 4,205 Annual principal payments Certificates of Participation 675
10,787
Under the modified accrual basis of accounting used in the governmental funds financial statements, expenditures arenot recognized for transactions that are not normally paid with expendable available financial resources. In thestatement of activities, however, which is presented on the accrual basis of accounting, expenses and liabilitiesare reported regardless of when financial resources are available. In addition, interest on long-term debt isnot recognized under the modified accrual basis of accounting until due, rather than as it accrues.
This adjustment combines the net changes of the following:Accrued vacation and sick leave 1,532 Accrued interest payable (7,238) Unamortized discounts (680) Unamortized premiums (9,681) Deferred outflow of resources-bond refundings (497)
(16,564) Change in net position—governmental activities—statement of activities $ (101,742)
See accompanying notes to basic financial statements.

29
City of St. Louis, MissouriStatement of Fund Net Position
Proprietary FundsJune 30, 2017
(dollars in thousands)
Major funds – Enterprise fundsLambert –St. Louis Total Internal
International Water Parking Enterprise ServiceAssets Airport Division Division Funds FundsCurrent assets:
Cash and cash equivalents:Restricted cash and cash equivalents $ 352,063 311 4,954 357,328 — Unrestricted cash and cash equivalents 31,084 17,189 12,480 60,753 6,984
Investments:Unrestricted investments 44,535 19,370 10,003 73,908 1,401
Receivables, net of allowances:Intergovernmental 5,458 — — 5,458 — Charges for services 5,193 12,171 284 17,648 795 Passenger facility charges 2,223 — — 2,223 — Accrued interest 128 — — 128 —
Prepaid assets — — — — 1,345 Due from other funds — — — — 7,188 Advance from other funds — — — — 48,769 Inventories 2,303 2,522 — 4,825 — Other current assets 559 64 20 643 —
Total current assets 443,546 51,627 27,741 522,914 66,482 Noncurrent assets:
Cash and cash equivalents:Restricted cash and cash equivalents 30,943 2,796 — 33,739 — Unrestricted cash and cash equivalents — 3,538 — 3,538 —
Investments: Restricted investments 68,393 — 4,530 72,923 — Unrestricted investments 33,121 — — 33,121 —
Capital assets:Property, plant, and equipment 1,785,532 303,697 84,358 2,173,587 146
Less accumulated depreciation (1,006,968) (158,442) (33,586) (1,198,996) (91) 778,564 145,255 50,772 974,591 55
Land, infrastructure and easements 754,595 1,238 22,903 778,736 — Construction-in-progress 24,042 14,790 — 38,832 —
Capital assets, net 1,557,201 161,283 73,675 1,792,159 55 Intangibles and other assets, net 1,689 291 733 2,713 —
Total noncurrent assets 1,691,347 167,908 78,938 1,938,193 55 Deferred outflow of resources 20,789 3,881 6,729 31,399 —
Total assets and deferred outflow of resources 2,155,682 223,416 113,408 2,492,506 66,537 LiabilitiesCurrent liabilities:
Accounts payable and accrued liabilities 8,098 5,987 323 14,408 205 Accrued salaries and other benefits 3,856 412 107 4,375 — Accrued vacation and compensatory time benefits 2,098 1,847 149 4,094 — Contracts and retainage payable 6,929 — 6,929 — Accrued interest payable 17,256 108 184 17,548 — Current portion of revenue bonds 276,000 422 3,266 279,688 — Due to other funds 4,784 4,900 2,356 12,040 36 Due to other government agencies — — 51 51 — Claims payable — — — — 60,638 Unearned revenue and other deposits 1,253 1,756 1,518 4,527 —
Total current liabilities 320,274 15,432 7,954 343,660 60,879 Noncurrent liabilities:
Revenue bonds payable, net 690,449 8,063 64,195 762,707 — Net pension liability 28,077 12,536 3,170 43,783 — Customer deposits — 2,046 — 2,046 — Other liabilities 11,738 4,156 936 16,830 —
Total noncurrent liabilities 730,264 26,801 68,301 825,366 — Deferred inflow of resources 5,158 373 454 5,985 —
Total liabilities and deferred inflow of resources 1,055,696 42,606 76,709 1,175,011 60,879 Net PositionNet investments in capital assets 626,202 152,798 6,214 785,214 55 Restricted:
Debt service 380,117 1,026 9,484 390,627 — Capital projects — — — — — Passenger facility charges 28,729 — — 28,729 —
Unrestricted 64,938 26,986 21,001 112,925 5,603 Total net position $ 1,099,986 180,810 36,699 1,317,495 5,658
See accompanying notes to basic financial statements.

30
City of St. Louis, MissouriStatement of Revenues, Expenses, and
Changes in Fund Net PositionProprietary Funds
Year ended June 30, 2017(dollars in thousands)
Major funds – Enterprise fundsLambert –St. Louis Total Internal
International Water Parking Enterprise ServiceAirport Division Division Funds Funds
Operating revenues:Aviation revenues $ 85,434 — — 85,434 — Concessions 26,307 — — 26,307 — Water sales — 50,940 — 50,940 — Lease revenue 5,225 — — 5,225 — Parking, net 23,107 — 18,026 41,133 — Charges for services — — — — 48,081 Miscellaneous — 2,617 — 2,617 (95)
Total operating revenues 140,073 53,557 18,026 211,656 47,986
Operating expenses:Claims incurred — — — — 39,105 Premiums — — — — 3,099 Personnel services 40,360 17,227 5,761 63,348 325 Material and supplies 5,092 10,529 197 15,818 4,516 Purchased power — 3,480 — 3,480 — Contractual services 36,006 6,777 1,180 43,963 — Miscellaneous 66 1,427 1,383 2,876 — Depreciation 57,259 6,021 2,898 66,178 11 Interfund services used 2,627 3,262 99 5,988 —
Total operating expenses 141,410 48,723 11,518 201,651 47,056
Operating income (loss) (1,337) 4,834 6,508 10,005 930
Nonoperating revenues (expenses):Intergovernmental revenue 1,136 — — 1,136 — Investment income 1,746 132 735 2,613 (5) Interest expense (32,291) (310) (3,002) (35,603) — Passenger facility charges 26,793 — — 26,793 — Gain(loss) on disposal of capital assets 41 (6) — 35 — Special projects — — (2,000) (2,000) — Gain on extinguishment of debt 2,097 — — 2,097 — Miscellaneous, net (3,191) 1,063 6 (2,122) —
Total nonoperating revenues(expenses), net (3,669) 879 (4,261) (7,051) (5)
Income (loss) before transfers and capital contributions, net (5,006) 5,713 2,247 2,954 925
Transfers in — — 337 337 — Transfers out (6,500) (3,207) (1,991) (11,698) — Capital contributions 11,722 215 — 11,937 —
Total transfers and capital contributions, net 5,222 (2,992) (1,654) 576 —
Change in net position 216 2,721 593 3,530 925
Net position—beginning of year 1,099,770 178,089 36,106 1,313,965 4,733 Net position—end of year $ 1,099,986 180,810 36,699 1,317,495 5,658
See accompanying notes to basic financial statements.

31
City of St. Louis, MissouriStatement of Cash Flows
Proprietary FundsYear ended June 30, 2017
(dollars in thousands)
Major funds – Enterprise fundsLambert –St. Louis Total Internal
International Water Parking Enterprise ServiceAirport Division Division Funds Funds
Cash flows from operating activities:Receipts from customers and users $ 137,212 53,450 17,718 208,380 37,285 Other operating cash receipts — — 360 360 — Payments to suppliers of goods and services (39,875) (21,889) (1,919) (63,683) (36,801) Payments to employees (39,266) (16,991) (5,628) (61,885) (332) (Payments)/receipts for interfund services used (2,653) (3,285) — (5,938) —
Net cash provided by operating activities 55,418 11,285 10,531 77,234 152
Cash flows from noncapital financing activities:Interest paid on share of bond pension liability — (263) — (263) — Transfers from the State of Missouri — — 6 6 — Transfers from other funds — — 337 337 — Transfers to other funds (6,500) (3,198) (1,991) (11,689) — Special projects — — (2,000) (2,000) —
Net cash used in noncapital financing activities (6,500) (3,461) (3,648) (13,609) —
Cash flows from capital and related financing activities:Cash collections from passenger facility charges 26,793 — — 26,793 — Receipts from federal financing assistance 11,681 — — 11,681 — Acquisition and construction of capital assets (26,885) (11,547) (296) (38,728) (37) Interest on deferred outflow of resources — — (198) (198) — Proceeds from sale of surplus property 287 — — 287 — Proceeds from issuance of bonds 255,127 3,779 12,748 271,654 — Principal paid on revenue bond maturities (38,400) (412) (1,311) (40,123) — Cash paid for interest 7,822 (116) (2,779) 4,927 — Other capital and financing activities — 1,368 (13,992) (12,624) —
Net cash provided by (used in) capital and related financing activities 236,425 (6,928) (5,828) 223,669 (37)
Cash flows from investing activities:Purchase of investments (179,839) (38,180) (14,930) (232,949) (504) Proceeds from sales and maturities of investments 185,283 38,003 8,744 232,030 — Interest expense on cash and investments — 142 — 142 — Gain on extinguishment of debt 2,097 — — 2,097 — Investment income 2,850 — 747 3,597 —
Net cash provided by (used in) investing activities 10,391 (35) (5,439) 4,917 (504)
Net increase (decrease) in cash and cash equivalents 295,734 861 (4,384) 292,211 (389)
Cash and cash equivalents:Beginning of year:
Unrestricted 40,200 19,515 20,594 80,309 7,373 Restricted 78,159 3,458 1,224 82,841 —
118,359 22,973 21,818 163,150 7,373
End of year:Unrestricted 31,084 20,727 12,480 64,291 6,984 Restricted 383,006 3,107 4,954 391,067 —
$ 414,090 23,834 17,434 455,358 6,984
Reconciliation of operating income (loss) to net cash provided byoperating activities:
Operating income (loss) $ (1,337) 4,834 6,508 10,005 930
Adjustments to reconcile operating income (loss) to net cash provided byoperating activities:
Depreciation and amortization 57,259 6,021 2,898 66,178 11 Changes in assets and liabilities:
Receivables, net (2,022) 839 210 (973) 619 Inventories 17 (408) — (391) — Prepaid assets — — — — 456 Other assets, net (7) (11) (42) (60) — Accounts payable, accrued liabilities, accrued salaries, and other benefits (179) (1,005) (226) (1,410) (32) Claims payable — — — 9,487 Unearned revenue and other deposits (492) 116 (159) (535) — Due to/from other funds 98 807 1,085 1,990 (464) Advance to other funds — — — (10,855) Customer deposits — (433) — (433) — Net pension liabilities 5,311 599 296 6,206 — Other long term liabilities (3,230) (74) (39) (3,343) —
Total adjustments 56,755 6,451 4,023 67,229 (778) Net cash provided by operating activities $ 55,418 11,285 10,531 77,234 152
Supplemental disclosure for noncash activities:Unrealized loss on investments $ (940) — (7) (947) — Loss on disposal of capital assets — 6 — 6 — Capital contribution — 215 — 215 —
See accompanying notes to basic financial statements.

32
City of St. Louis, MissouriStatement of Fiduciary Net Position
Fiduciary FundsJune 30, 2017
(dollars in thousands)
PensionTrust Funds
(as ofSeptember 30, Agency
2016*) Funds
Assets
Cash and cash equivalents - unrestricted $ 10,958 28,844 Cash and cash equivalents - restricted — 1,604
Pension trust investments:Bonds 207,218 — Domestic bond funds 83,984 — Stocks 567,383 — Mortgage-backed securities 16,792 — Collective investment funds 304,334 — Real estate equities and investment trust 208,245 — Investment property 863 — Hedge funds 183,965 — Money market mutual funds and other short-term investments 60,892 — Managed master limited partnership 170,586 — Managed international equity funds 162,719 —
Total investments 1,966,981 —
Securities lending collateral 2,201 — Receivables, net of allowances:
Taxes — 21,950 Contributions 169 — Accrued interest 2,549 — Other 2,443 879
Capital assets, net 945 —
Total assets 1,986,246 53,277
Deferred outflows of resources
System's staff pension related 373 —
Total deferred outflows of resources 373 —
Total assets and deferred outflows of resources 1,986,619 53,277
Liabilities
Accounts payable and accrued liabilities 2,007 10,541 Deposits held for others 106 12,325 Due to Firefighter's Retirement Plan 255 — Due to other governmental agencies — 30,411 Securities lending collateral liability 2,201 — Other liabilities 5,245 —
Total liabilities 9,814 53,277
Deferred inflows of resources
System's staff pension related 27 —
Total deferred inflows of resources 27 —
Total liabilities and deferred inflows of resources 9,841 53,277
Net positionNet position restricted for pension benefits $ 1,976,778 —
*See note 10.See accompanying notes to basic financial statements.

33
City of St. Louis, MissouriStatement of Changes in Fiduciary Net Position
Fiduciary FundsYear ended June 30, 2017
(dollars in thousands)
PensionTrust Funds
(as of September 30,
2016*)
Additions:Contributions:
Members $ 7,249 Employer 74,827
Investment income:Interest and dividends 25,907 Class action lawsuit proceeds 537 Net appreciation in fair value of investments 142,974
Investment gain 169,418
Less investment expense (8,496)
Net investment gain 160,922
Total additions 242,998
Deductions:Benefits 153,071 Refunds of contributions 4,354 Administrative expense 3,325
Total deductions 160,750
Net increase 82,248
Net position restricted for pension benefits:Beginning of year 1,849,530 End of year $ 1,931,778
See accompanying notes to basic financial statements.
City of St. Louis, Missouri Notes to Basic Financial Statements
June 30, 2017 (dollars in thousands)
34
1. SUMMARY OF SIGNIFICANT ACCOUNTING POLICIES
The City of St. Louis, Missouri (the City) is a constitutional charter city not a part of any county, which is organized and exists under and pursuant to the constitution and laws of the State of Missouri (the State). The City’s current form of government is provided for in its charter, which first became effective in 1914 and has been subsequently amended by City voters. The City provides a wide range of municipal services as follows: fire, police, and other public safety; parks and recreation; forestry; health, welfare, and other social services; street maintenance; refuse collection; public services; community and economic development; convention and tourism; and general administrative services. The City also owns and operates a water utility, parking facilities, and an international airport as self-supporting enterprises.
The accounting policies and financial reporting practices of the City conform to U.S. generally accepted accounting principles applicable to governmental entities. The following is a summary of the more significant policies:
Reporting Entity
The City’s financial reporting entity has been determined in accordance with governmental standards for defining the reporting entity and identifying entities to be included in its basic financial statements. The City’s financial reporting entity consists of the City of St. Louis (also referred to as the Primary Government) and its component units.
1) Blended Component Units
The component units discussed below are included in the City’s reporting entity due to the significance of their operational or financial relationships with the City.
Public Facilities Protection Corporation (PFPC)
The PFPC is an internal service fund governed by a five-member board of persons in designated City positions. The PFPC is reported as if it were part of the primary government because its sole purpose is to provide the City with a defined and funded self-insurance program for claims, judgments, and other related legal matters including workers’ compensation.
St. Louis Municipal Finance Corporation (SLMFC)
The SLMFC, established in 1991, is governed by a five-member board, consisting of persons in designated City positions. The SLMFC is reported as if it were part of the primary government because its sole purpose is to lessen the burden on the City by financing, acquiring, leasing, or subleasing real property, and improvement thereon, and personal property to the City.

City of St. Louis, Missouri Notes to Basic Financial Statements
June 30, 2017 (dollars in thousands)
35
St. Louis Parking Commission Finance Corporation (SLPCFC)
The SLPCFC, established in 2003, is governed by a five-member board as appointed by the Parking Commission. The SLPCFC finances the purchase of and owns, leases and sells certain real property on behalf of the Parking Commission. SLPCFC is considered to be a component unit of the City because the Parking Division of the City of St. Louis (the Parking Division) is financially accountable for SLPCFC, as it appoints all of SLPCFC’s directors and is able to impose its will on SLPCFC. The SLPCFC provides services entirely to the Parking Division and is reported as if it were part of the Parking Division because its sole purpose is to lessen the burden on the Parking Division by coordinating real property transactions.
2) Discretely Presented Component Unit
The component unit column in the statement of net position and statement of activities include the financial data of the City’s discretely presented component unit. This is reported individually to emphasize that it is legally separate from the City.
St. Louis Development Corporation (SLDC)
The SLDC was organized in 1988 to improve the efficiency and effectiveness of the economic development activities of the City. SLDC combines the administrative staffs of seven independent development agencies for the purpose of coordinating administrative services for all seven agencies. The agencies that are considered component units of SLDC are the Land Reutilization Authority (LRA), the Land Clearance for Redevelopment Authority (LCRA), the LCRA Holdings Corporation (LCRAH), the St. Louis Industrial Development Authority (IDA), the Planned Industrial Expansion Authority (PIEA), the Local Development Company (LDC), and the St. Louis Port Authority. SLDC is included as a component unit of the City because the City is financially accountable for SLDC, as SLDC is fiscally dependent upon the City. The City realizes a financial benefit through the development activity with SLDC and the City subsidizes any deficit that SLDC has. SLDC is considered to be fiscally dependent on the City because SLDC may not legally issue bonded debt or implement a budget for its redevelopment activities until the City’s Board of Alderman has approved the redevelopment project and declared the redevelopment area blighted.
Complete financial statements of the discretely presented component unit may be obtained from their administrative offices as follows:
St. Louis Development Corporation 1520 Market Street, Suite 2000 St. Louis, Missouri 63103
3) Related Organizations
The City’s officials are also responsible for appointing the voting majority of board members for other organizations, but the City’s accountability for these organizations do not extend beyond making the appointments. Thus, no financial data for these organizations are included in the City’s basic financial statements. These related organizations include the Mental Health Board, the St. Louis Housing Authority, the St. Louis Office for Mental Retardation & Developmental Disability Resources, and the St. Louis Public Library.

City of St. Louis, Missouri Notes to Basic Financial Statements
June 30, 2017 (dollars in thousands)
36
4) Joint Venture
St. Louis Regional Convention and Sports Complex Authority (Authority)
The Authority, established in 1990 as a separate legal entity by an Act of the Missouri State legislature, is governed by an 11-member board of commissioners. The mayor of the City and the county executive of St. Louis County, Missouri (the County) each appoint three members and the governor of the State appoints the remaining five commissioners. The Authority is considered a joint venture of the City, the County, and the State because the three governments have entered into a contractual agreement with the Authority to sponsor the issuance of convention facility bonds, to repay the facility bonds through rental payments to the Authority, and to make annual preservation payments for facility maintenance and renovations, all of which create an ongoing financial responsibility of the City. The Authority is subject to joint control of the City, the County, and the State. Complete financial statements for the Authority can be obtained from the Authority’s administrative offices at 901 North Broadway, St. Louis, Missouri 63101.
5) Pension Trust Funds
Financial information for the pension trust funds has been included within the accompanying financial statements as of September 30, 2016, which is the fiscal year end of the retirement plans, which falls within the City’s current fiscal year end (also see note 10).
Government-wide and Fund Financial Statements
The government-wide financial statements (that is, the statement of net position and the statement of activities) report information on all of the non-fiduciary activities of the City and its component units. The effect of interfund activity has been removed from these statements. Governmental activities, which normally are supported by taxes and intergovernmental revenues, are reported separately from business-type activities, which rely to a significant extent on charges for services. Likewise, the City is reported separately from its legally separate component unit for which the City is financially accountable.
The statement of activities demonstrates the degree to which the direct expenses of a given function or segment are offset by program revenues. Direct expenses are those that are clearly identifiable with a specific function. Program revenues include: 1) charges for services to customers or applicants who purchase, use, or directly benefit from goods, services, or privileges provided by a given function, and 2) grants and contributions that are restricted to meeting the operational or capital requirements of a particular function. Taxes, unrestricted interest earnings, gains, and other miscellaneous revenues not properly included among program revenues are reported instead as general revenues.
Following the government-wide financial statements are separate financial statements for governmental funds, proprietary funds, and fiduciary funds. Fiduciary funds are excluded from the government-wide financial statements. Major individual governmental funds and major individual enterprise funds are reported as separate columns in the fund financial statements. The City has determined that the general fund, the redevelopment projects fund, the capital projects fund, and the grants fund are major governmental funds. All other governmental funds are reported in one column labeled “Other Governmental Funds”. The total fund balances for all governmental funds is reconciled to total net position for governmental activities as shown on the statement of net position. The net change in fund balance for all governmental funds is reconciled to the total change in net position as shown on the statement of activities in the government-wide statements. The City has three enterprise funds (business-type activities):

City of St. Louis, Missouri Notes to Basic Financial Statements
June 30, 2017 (dollars in thousands)
37
Lambert-St. Louis International Airport (the Airport), the Water Division of the City of St. Louis (the Water Division), and the Parking Division. Each of these enterprise funds is a major fund within the fund financial statements. Additionally, the City has four internal service funds (governmental activities): PFPC, mailroom services, health and equipment services. All internal service fund activity is combined into a single column on the proprietary fund statements, since major fund reporting requirements do not apply to internal service funds.
The fund financial statements of the City are organized on the basis of funds, each of which is considered a separate accounting entity with self-balancing accounts that comprise its assets, deferred outflow of resources, liabilities, deferred inflow of resources, fund balances/net position, revenues and expenditures, or expenses. Governmental resources are allocated to and accounted for in individual funds based upon the purposes for which they are to be spent and the means by which spending activities are controlled. The various funds are summarized by type in the basic financial statements. The following fund types are used by the City:
1) Governmental Fund Types
Governmental funds are those through which most governmental functions are financed. The acquisition, uses, and balances of the City’s expendable financial resources and the related liabilities (except those accounted for in proprietary funds) are accounted for through governmental funds. The measurement focus is upon determination of and changes in financial position rather than upon net income.
The following are the City’s governmental major funds:
General Fund—The general fund is the general operating fund of the City. It is used to account for all financial resources except those required to be accounted for in another fund.
Redevelopment Projects Fund—The redevelopment project fund is a special revenue fund that is used to record activity related to tax increment financing districts, funding associated with state subsidized redevelopment projects using super tax incrementing financing funds or Missouri Downtown Economic Stimulus Act (MODESA) funding or other development pledged revenues.
Capital Projects Fund—The capital projects fund is used to account for financial resources to be used for the acquisition or construction of major capital facilities, other than those financed by proprietary funds. This fund accounts for acquisition or construction of capital improvements, renovations, remodeling, and replacement for the City’s major capital projects.
Grants Fund—The grants fund is a special revenue fund that is used to account for the proceeds of specific revenue sources (other than major capital projects) that are legally restricted to expenditures for specific purposes. The grants fund accounts for the majority of the City’s federal grant programs received from the U.S. Department of Health and Human Services, U.S. Department of Housing and Urban Development, U.S. Department of Justice, U.S. Department of Labor, U.S. Department of Transportation, and various other federal agencies.

City of St. Louis, Missouri Notes to Basic Financial Statements
June 30, 2017 (dollars in thousands)
38
The other governmental funds of the City are considered nonmajor. They are special revenue funds, which account for the proceeds of specific revenue sources that are legally restricted to expenditures for specific purposes, and a debt service fund, which accounts for the accumulation of resources for, and repayment of, general obligation long-term debt principal, interest, and related costs.
2) Proprietary Fund Types
Proprietary funds are used to account for activities that are similar to those found in the private sector. The measurement focus is on the determination of net income and capital maintenance.
The following are the City’s proprietary fund types:
Enterprise—Enterprise funds are used to account for operations that are financed and operated in a manner similar to private business enterprises—where the intent of the governing body is that the costs (including depreciation) of operations are financed primarily through user charges. Enterprise funds have been established for the Airport, the Water Division, and the Parking Division. The Airport is used to account for the activities of the Airport. The principal services provided are financed primarily through landing fees and terminal concession revenues. The Water Division is used to account for sale of water to the general public and the operation of the water delivery system. The Parking Division is used to account for the operation of public parking facilities and parking meters. Each of the enterprise funds is a major fund in the fund financial statements.
Internal Service—Internal service funds are used to account for the financing of goods or services provided by one department or agency to other departments or agencies of a government, or to other governments, on a cost-reimbursement basis. An internal service fund has been established for PFPC, mailroom services, health, and equipment service. The PFPC fund is used to account for payment of workers’ compensation and various other claims against legal actions on behalf of other funds. The mailroom services fund is used to account for mail-handling services provided to other funds. The health fund is used to account for payment of health insurance claims for participants. The equipment service fund is used for the purchase and distribution of fuel to various city departments.
3) Fiduciary Fund Types
Trust and Agency—Trust and agency funds are used to account for assets held by the City in a trustee capacity or as an agent for individuals, private organizations, or other governmental units. These include pension trust funds and agency funds. Pension trust funds are accounted for and reported similar to proprietary funds. The pension trust funds account for the Firemen’s Retirement System of St. Louis (Firemen’s System), the Firefighters’ Retirement Plan (Firefighters’ Plan), the Police Retirement System of St. Louis (Police System), and the Employees Retirement System of the City of St. Louis (Employees System) pension benefits. Agency funds are accounted for using the accrual basis of accounting. Agency funds are custodial in nature (assets equal liabilities) and do not involve the measurement of results of operations. These funds account for activities of the collector of revenue, property tax escrow, general insurance, bail bonds, license collector, circuit clerk, police, treasurer and other agency operations.

City of St. Louis, Missouri Notes to Basic Financial Statements
June 30, 2017 (dollars in thousands)
39
Measurement Focus and Basis of Accounting
Basis of accounting refers to when revenues and expenditures or expenses are recognized in the accounts and reported in the basic financial statements. Basis of accounting relates to the timing of the measurements made, regardless of the measurement focus applied.
The government-wide financial statements are reported using the economic resources measurement focus and accrual basis of accounting, as are the proprietary fund, pension trust fund, and discretely presented component unit financial statements. Agency funds adhere to the accrual basis of accounting, and do not have a measurement focus. Revenues are recorded when earned and expenses are recorded when a liability is incurred, regardless of the timing of the related cash flows. Property taxes are recognized as revenues in the year for which they are levied. Grants and similar items are recognized as revenue as soon as all eligibility requirements have been met.
Governmental fund financial statements are reported using the current financial resources measurement focus and the modified accrual basis of accounting. At year-end, entries are recorded for financial reporting purposes to reflect the modified accrual basis of accounting for governmental fund types, and the accrual basis of accounting for the proprietary fund types, pension trust funds, and agency funds.
Under the modified accrual basis of accounting, revenues are recorded when both measurable and available. The term “available” is defined as collectible within the current period or soon enough thereafter to be used to pay the liabilities of the current period. For the City, available is defined as expected to be received within 60 days of fiscal year-end, except for government grants, which is within 120 days of fiscal year-end. Expenditures generally are recorded when a liability is incurred, as under accrual accounting. However, debt service expenditures, as well as expenditures related to compensated absences and claims and judgments, are recorded only when payment is due (that is, matured).
Governmental Accounting Standards Board (GASB) Statement No. 33, Accounting and Financial Reporting for Nonexchange Transactions, groups nonexchange transactions into the following four classes, based upon their principal characteristics: derived tax revenues, imposed nonexchange revenues, government mandated nonexchange transactions, and voluntary nonexchange transactions.
The City recognizes assets from derived tax revenue transactions (such as city earnings and payroll taxes, sales and utilities gross receipt taxes) in the period when the underlying exchange transaction on which the tax is imposed occurs or when the assets are received, whichever occurs first. Revenues are recognized, net of estimated refunds and estimated uncollectible amounts, in the same period that the assets are recognized, provided that the underlying exchange transaction has occurred. Resources received in advance are reported as unearned revenues until the period of the exchange.
The City recognizes assets from imposed nonexchange revenue transactions in the period when an enforceable legal claim to the assets arises or when the resources are received, whichever occurs first. Revenues are recognized in the period when the resources are required to be used for the first period that use is permitted. The City recognizes revenues from property taxes, net of estimated refunds and estimated uncollectible amounts, in the period for which the taxes are levied. Imposed nonexchange revenues also include permits, court fines, and forfeitures.

City of St. Louis, Missouri Notes to Basic Financial Statements
June 30, 2017 (dollars in thousands)
40
Intergovernmental revenues, representing grants and assistance received from other governmental units, are generally recognized as revenues in the period when all eligibility requirements, as defined by GASB Statement No. 33, have been met. Any resources received before eligibility requirements are met are reported as deferred inflows of resources.
Charges for services in the governmental funds, which are exchange transactions and are, therefore, not subject to the provisions of GASB Statement No. 33, are recognized as revenues when received in cash because they are generally not measurable until actually received, with the exception of refuse charges.
Under the accrual basis of accounting used by the proprietary fund types and pension trust funds, revenues are recognized when earned and expenses are recognized when incurred. Unbilled service revenues are accrued by the Airport and the Water Division based on estimated billings for services provided through the end of the current fiscal year.
Proprietary funds distinguish operating revenues and expenses from nonoperating items. Operating revenues and expenses generally result from providing services and producing and delivering goods in connection with a proprietary fund’s principal ongoing operations. The principal operating revenues of the Airport enterprise fund are revenues from airlines, concessions, and parking. Transactions that are capital, financing, or investing related are reported as nonoperating revenues. The principal operating revenues of the Water Division enterprise fund, the Parking Division enterprise fund, and internal service funds are charges to customers for sales and services. All expenses related to operating the Airport enterprise fund are reported as operating expenses. Interest expense, financing costs, and miscellaneous expenses are reported as nonoperating expenses. Operating expenses for the Water Division enterprise fund, the Parking Division enterprise fund, and internal service funds include the cost of sales and services, administrative expenses, and depreciation and amortization. All revenues and expenses not meeting this definition are reported as nonoperating revenues and expenses.
When both restricted and unrestricted resources are available for use, it is the City’s policy to use restricted resources first and then unrestricted resources as they are needed.
For the pension trust funds, under the accrual basis of accounting, contributions are recognized in the period in which the contributions are due and benefits are recognized when they become due and payable.
Property Taxes
Taxes are levied annually in November based on the assessed valuation of all real and personal property located in the City as of the previous January 1 and use is first permitted the following fiscal year. The City tax rate levied in November 2016 was $1.6231 per $100 (in dollars) of assessed valuation of which $1.49 (in dollars) is for the general fund and $0.1331 (in dollars) is for the debt service fund. Taxes are billed in November and are due and collectible on December 31. All unpaid taxes become delinquent on January 1 of the following year and attach as an enforceable lien on the related property at that date.
City of St. Louis, Missouri Notes to Basic Financial Statements
June 30, 2017 (dollars in thousands)
41
Cash and Investments
The City Treasurer maintains a cash and investment pool that is available for use by all funds including certain component units, except pension trust funds. In accordance with the City’s budget ordinance the majority of investment income is considered earned by the general fund except for earnings otherwise legally restricted for a specific purpose. Income from investments associated with one fund is not assigned to another fund for other than legal or contractual reasons. In addition, cash and investments are separately maintained by other City officials, several of the City’s departments and third-party trustee and fiscal agents.
Investments are recorded at fair value. Fair values for investments are determined by closing market prices at year-end based on quotations from national security exchanges. Mortgages are valued on the basis of future principal and interest payments and are discounted at prevailing interest rates for similar instruments.
The City invests in various investments. Investments are exposed to various risks such as interest rate, market, and credit risks. Due to the level of risk associated with certain investments, it is at least reasonably possible that changes in the fair values of investments will occur in the near term and that such changes could materially affect the amounts reported in the accompanying financial statements.
Inventories
Inventories are recorded at cost using a method that approximates the first-in, first-out method or the moving average cost method, and the expense is recognized when inventories are consumed in operations.
Capital Assets
1) Governmental Activities Capital Assets
Capital assets, which include buildings, improvements, equipment, and infrastructure assets (for example, roads, bridges, docks, promenade, traffic signals, and similar items), are reported in the governmental activities column in the government-wide financial statements, net of accumulated depreciation. Capital assets are defined by the City as assets with an estimated useful life in excess of one year with an initial, individual cost of $5 or more, infrastructure with a cost of $500 or more, building improvements with a cost of $100 or more, and all land, land improvements, and buildings.
Purchased or constructed capital assets are reported at cost or estimated historical cost. Donated capital assets are recorded at their estimated fair market value at the date of donation. General infrastructure assets acquired prior to July 1, 2001 consist of the road network and other infrastructure assets that were acquired or that received substantial improvements subsequent to June 30, 1980 and are reported at estimated historical cost using deflated replacement cost. The costs of normal maintenance and repairs that do not add to the value of the asset or materially extend the assets’ lives are not capitalized.
The City has determined that all works of art and historical treasures other than the City’s statues, monuments, and fountains meet the definition of a collection, and accordingly, has not capitalized these assets. A collection is defined as:
• Held for public exhibition and education
• Protected, cared for, and preserved

City of St. Louis, Missouri Notes to Basic Financial Statements
June 30, 2017 (dollars in thousands)
42
• Subject to an organizational policy that requires the proceeds from the sale to be used to acquire other items for the collection.
The City has adopted a policy related to the sale of these assets, stating that the proceeds from the sale of any City-owned collections, in part or in its entirety, will be used for the acquisition of collection items.
All City-owned statues, monuments, and fountains are capitalized at their historic cost based upon original acquisition, construction documents, or estimates of original costs. Because of the nature of these assets and the manner in which the City maintains its historic treasures, these assets are considered inexhaustible, and therefore, are not subject to depreciation.
Depreciation, including depreciation recognized on assets acquired through government grants and other aid, is computed on the straight-line method over the estimated useful lives of the various classes of assets, except for roads, which is computed using the composite method. The estimated useful lives of depreciable capital assets are as follows:
Years
Buildings 40 to 99Improvements other than buildings 3 to 40Equipment 3 to 20Police automotive equipment 3 to 15Infrastructure 18 to 50Intangibles 3 to 10
City management has evaluated prominent events or changes in circumstances affecting capital assets to determine whether any impairments of capital assets have occurred. Such events or changes in circumstances that were considered by the City management to be indicative of impairment include evidence of physical damage, enactment or approval of laws or regulations or other changes in environmental factors, technological changes or evidence of obsolescence, changes in the manner or duration of use of a capital asset, and construction stoppage.
2) Business-type Activities Capital Assets
Capital assets for the Airport, the Water Division, the Parking Division, and the mailroom are reported in the business-type activities column in the government-wide financial statements, net of accumulated depreciation.

City of St. Louis, Missouri Notes to Basic Financial Statements
June 30, 2017 (dollars in thousands)
43
3) Airport
Capital assets are recorded at cost. Depreciation, including depreciation recognized on assets acquired through government grants and other aid, is computed on the straight-line method over the estimated useful lives of the various classes of assets. Land is recorded at cost which, in addition to the purchase price, includes appraisal and legal fees, demolition, and homeowner relocation costs. Net interest costs on funds borrowed to finance the construction of capital assets are capitalized and amortized over the life of the related asset. The estimated useful lives of capital assets are as follows:
Years
Pavings 5 to 30Buildings and facilities 5 to 30Equipment 3 to 20
4) Water Division
Capital assets were originally recorded in the accounts in 1958 and were based on an engineering study of the historical cost of properties constructed by employees of the Water Division. Accumulated depreciation, at the date the assets were recorded, was established after a review by a consulting firm.
Additions to capital assets subsequent to 1958 are recorded at historical cost. Provisions for depreciation of the capital assets are computed on a straight-line basis over the estimated useful lives of the assets and are charged to operating expenses. The estimated useful lives of depreciable assets are as follows:
Years
Buildings and structures 44 to 55Pumping equipment 28 to 44Hydrants, transmission mains and
lines 50 to 100Meters 33Other equipment 5 to 25
Net interest costs on funds borrowed to finance the construction are capitalized and depreciated over the life of the related asset.

City of St. Louis, Missouri Notes to Basic Financial Statements
June 30, 2017 (dollars in thousands)
44
5) Parking Division
Capital assets are recorded at historical cost, including applicable interest incurred during the construction period. Donated capital assets are recorded at estimated fair market value at the date of donation. The contributions are reflected as capital contributions. Depreciation is computed using the straight-line method over the estimated useful lives of the various classes of assets. The estimated useful lives of assets for depreciable capital assets are as follows:
Years
Buildings, land improvements, andparking garages 5 to 40
Equipment 5 to 15Parking meters and lot equipment 5 to 10
Non-depreciable assets include land.
6) Mailroom
Capital assets are recorded at historical cost. Depreciation is computed using the straight-line method over the estimated useful lives of the various classes of assets. The estimated useful life of equipment, other than computer equipment, is 10 years. The estimated useful life of computer equipment is five years.
7) Component Unit—SLDC
SLDC’s property, plant, equipment, and infrastructure with useful lives of more than one year are stated at historical cost. Historically, SLDC has maintained infrastructure asset records consistent with all other capital assets. SLDC generally capitalizes assets with costs of $2,500 (in dollars) or more as purchase and construction outlays occur. The costs of normal maintenance and repairs that do not add to the asset value or materially extend useful lives are not capitalized. Capital assets are depreciated using the straight-line method. When capital assets are disposed, the cost and applicable accumulated depreciation are removed from the respective accounts, and the resulting gain or loss is recorded in operations. Estimated useful lives, in years, for depreciable assets are generally treated as follows:
Years
Buildings and structures 40Improvements other than buildings
(includes infrastructure) 3 to 25Furniture, fixtures, and equipment 3 to 10
Long-term Liabilities
In the government-wide financial statements and proprietary fund types in the fund financial statements, long-term debt and other long-term obligations are reported as liabilities in the applicable governmental activities, business-type activities, or proprietary fund type statement of net position/statement of fund net position.

City of St. Louis, Missouri Notes to Basic Financial Statements
June 30, 2017 (dollars in thousands)
45
Pensions
In accordance with GASB Statement No. 68, Accounting and Financial Reporting for Pensions – an amendment of GASB Statement No. 27, the net pension liability, deferred outflows of resources, deferred inflows of resources and pension expense have been recognized in the financial statements.
The net pension liability is calculated as the difference between the actuarially calculated value of the projected benefit payments attributed to past periods of service and the plans’ fiduciary net position. The total pension expense is comprised of the service cost or actuarial present value of projected benefit payments attributed to the valuation year, interest on the total pension liability, plan administrative expenses, current year benefit changes, and other changes in plan fiduciary net position less employee contributions and projected earnings on plan investments. Additionally, the total pension expense includes the annual recognition of outflows and inflows of resources due to pension assets and liabilities.
For purposes of measuring the net pension liability, deferred outflows of resources, deferred inflows of resources, pension expense and expenditures associated with the City’s contribution requirements, information about the fiduciary net position of the retirement plans, and addition to/deductions from the retirement plans’ fiduciary net position have been determined on the same basis as they are reported within the separately issued retirement plans’ financial statements. For this purpose benefit payments (including refunds of employee contributions) are recognized when due and payable in accordance with terms of the plan. Investments are reported at fair value.
Passenger Facility Charges (PFCs)
The Airport collects a $4.50 (in dollars) facility charge per enplaned passenger to fund approved Federal Aviation Administration (FAA) projects. The PFCs are withheld by the respective airlines for each ticket purchased and passenger transfer made in St. Louis and remitted to the Airport one month after the month of receipt, less an $0.11 (in dollars) per ticket operating fee retained by the airlines. PFCs represent an exchange-like transaction and are recognized as nonoperating revenue based upon passenger enplanements. Passenger facility charges receivable as of June 30, 2017 were $2,223. This amount was collected during July and August 2017.
Capital Contributions
Capital contributions to the proprietary fund type represent government grants and other aid used to fund capital projects. Capital contributions are recognized as revenue when the expenditure is made and amounts become subject to claim for reimbursement. Amounts received from other governments by the proprietary fund type, which are not restricted for capital purposes, are reflected as nonoperating intergovernmental revenue.

City of St. Louis, Missouri Notes to Basic Financial Statements
June 30, 2017 (dollars in thousands)
46
Capitalization of Interest
Net interest costs on funds borrowed to finance the construction of capital assets are capitalized and depreciated over the life of the related asset for business-type activities and proprietary fund types. Interest is not capitalized for governmental activities or governmental fund types.
Bond Premiums, Discounts, and Issuance Costs
In government-wide financial statements and the proprietary fund types in the fund financial statements, bond discounts are recorded as a reduction of the debt obligation and bond premiums are recorded as an addition to the debt obligation. Such amounts are amortized using the interest method or bonds-outstanding method over the term of the related revenue bonds. Bond issuance costs are recognized as an outflow of resources and expensed rather than amortized.
In the fund financial statements, governmental fund types recognize bond premiums and discounts, as well as bond issuance costs, during the current period. The face amount of debt issued is reported as other financing sources. Premiums received on debt issuances are reported as other financing sources, while discounts on debt issuances are reported as other financing uses. Issuance costs, whether or not withheld from the actual debt proceeds received, are included in interest expense when incurred.
Deferred Inflow/Outflow of Resources
A deferred inflow of resources is defined as an acquisition of net position by the government that is applicable to a future reporting period and a deferred outflow of resources is defined as a consumption of net position by the government that is applicable to a future reporting period. A deferred inflow of resources has a negative impact on net position similar to liabilities but is required to be reported within the statement of net position in a separate section following liabilities and the total may be added to the total for liabilities. A deferred outflow of resources has a positive effect on net position similar to assets but is required to be reported in the statement of net position in a separate section following assets and the total may be added to the total for assets.
Deferred outflows/inflows of resources include 1) unamortized losses/gains on bond refundings, which are deferred and amortized over the shorter of the remaining life of the old debt or the life of the new debt, 2) contributions made to retirement plans after the pension liability measurement date, and 3) various other pension related amounts (see note 10).

City of St. Louis, Missouri Notes to Basic Financial Statements
June 30, 2017 (dollars in thousands)
47
As of June 30, 2017 deferred outflows/inflows of resources consist of the following:
Deferred outflow of resources:Pension related:
FRS $ 40,714 FRP 19,017 PRS 132,625 ERS 52,176
Loss on bond defeasance/refunding 23,771
$ 268,303
Deferred inflow of resources:Pension related:
FRS $ 5,137 FRP 3,350 PRS 3,137 ERS 6,206
Gain on bond defeasance/refunding 3,943
$ 21,773
Vacation and Sick Leave
The vacation and sick policy for all departments of the City, except the police department are as follows:
The City grants vacation to full-time and part-time employees who work 50% of full-time or more based on years of continuous service. The entire accrued benefit liability related to the City’s vacation and sick leave has been recorded in the government-wide financial statements and in the proprietary funds in the fund financial statements. Amounts have been recorded in the governmental fund financial statements as part of accrued salaries and other benefits, since such amounts came due (that is, matured) during the fiscal year ended June 30, 2017.
Non-uniformed employees retiring after June 30, 2001 who have an unused sick leave balance may, at retirement, elect to receive payment for one-half of the sick leave balance. As an estimate of the portion of sick leave that will result in termination payments, a liability has been recorded on the government-wide financial statements and the proprietary funds in the fund financial statements representing one-half of the accumulated sick leave balance for those employees who will be eligible to retire within five years.
The vacation and sick leave policy for the employees of the police department are as follows:
Vacation and designated holiday pay is granted to full-time employees based on years of continuous service and will be paid to employees upon resignation, retirement, or death.

City of St. Louis, Missouri Notes to Basic Financial Statements
June 30, 2017 (dollars in thousands)
48
Both commissioned and civilian employees accumulate sick leave hours and will be paid a minimum of 25% of their unused sick leave upon termination of employment. The liability for accrued sick leave pay has been calculated using the vesting method. Commissioned and civilian employees retiring from St. Louis Police Department (SLPD) with 1600+ hours of sick leave accrued and 20+ years of service will be paid 25% of their unused sick leave plus one additional month’s salary. Commissioned employees retiring from SLPD with 2200+ hours of sick leave accrued and 30+ years of service will be paid 50% of their unused sick leave. Civilian employees retiring from SLPD with 2200+ hours of sick leave accrued and who have 85 points (years of service plus age) or reached age 65 will be paid 50% of their unused sick leave.
Effective June 30, 2017, at point of termination all benefit payouts for commissioned employees are paid out immediately. Effective June 30, 2016, at point of termination all benefits payouts for civilian employees are paid out at termination unless a retiring civilian employee elects to have their sick leave paid out in accordance with administrative regulation 140 which permits an employee to receive four (4) equal payments occurring every six (6) months for two (2) years following retirement from active service.
Interfund Transactions
In the fund financial statements, the City has the following types of transactions among funds:
1) Transfers
Legally authorized transfers are reported when incurred as transfers in by the recipient fund and as transfers out by the disbursing fund.
2) Interfund Services Provided/Used
Charges or collections for services rendered by one fund for another are recognized as revenues (interfund services provided) of the recipient fund and expenditures or expenses (interfund services used) of the disbursing fund. These transactions are recorded as interfund services because they would be treated as revenues and expenditures or expenses if they involved organizations external to the City.
Within the accompanying activity from the statement of activities, interfund services provided and used are not eliminated from the various functional categories. Transfers are eliminated from the various functional categories.
Certain internal payments are treated as program revenues, such as internal services provided and used. Certain internal payments are treated as a reduction of expense, such as reimbursements.
Fund Balance Designation
In the governmental fund financial statements the City maintains nonspendable, restricted, committed, assigned and unassigned fund balances.
Within the fund financial statements, the fund balance is reported as follows:
• Nonspendable: This consists of resources not in spendable form or are legally or contractually required to remain intact.

City of St. Louis, Missouri Notes to Basic Financial Statements
June 30, 2017 (dollars in thousands)
49
• Restricted: This consists of amounts that can be spent only for the specific purpose stipulated by constitution, external parties (e.g., grantors, creditors, or other governments), or enabling legislation.
• Committed: This consists of amounts that can only be used for specific purposes pursuant to formal action of the government’s highest level of decision-making authority. Committed amounts cannot be used for any other purpose unless the government removes or changes the specified use by taking the same type of action it employed to previously commit these amounts. Committed balances are classified as such as a result of the City of St. Louis Board of Aldermen taking formal action and adopting an ordinance which can only be modified or rescinded by a subsequent formal action.
• Assigned: This consists of amounts constrained by the government’s intent to be used for specific purposes, but are neither restricted nor committed. Per City policy, assigned balances are a result of the Board of Estimate and Apportionment approval and authorization of projects or actions prior to July 1, 2017.
• Unassigned: This consists of residual fund balances that do not meet the criteria of nonspendable, restricted, committed, or assigned. The General Fund is the only fund that reports a positive unassigned fund balance amount. Other governmental funds besides the General Fund can only report negative unassigned fund balance amount.
The City’s policy is to apply expenditures to restricted resources first, then committed, then assigned, and unassigned, respectively, as applicable.
Net Position
In the government-wide and proprietary fund financial statements, equity is displayed in three components as follows:
1) Net Investment in Capital Assets
This consists of capital assets, net of accumulated depreciation, less the outstanding balances of any bonds, notes, or other borrowings that are attributable to the acquisition and construction of those assets.
2) Restricted
This consists of net position that are legally restricted by outside parties or by law through constitutional provisions or enabling legislation. Net position restricted by statutory restrictions represent tax and other revenue sources that are required by statute to be expended only for a specific purpose or purposes.
3) Unrestricted
This consists of net position that do not meet the definition of “restricted” or “invested in capital assets.”
Statement of Cash Flows
For the purpose of the statement of cash flows, cash and cash equivalents are defined as all highly liquid investments (including restricted assets) with a maturity of three months or less at the date of purchase.

City of St. Louis, Missouri Notes to Basic Financial Statements
June 30, 2017 (dollars in thousands)
50
Use of Estimates
The preparation of the basic financial statements in conformity with U.S. generally accepted accounting principles requires management to make estimates and assumptions that affect the reported amounts of assets and liabilities and disclosure of contingent assets and liabilities at the date of the basic financial statements, and the reported amounts of revenue, expenses, and expenditures during the reporting period. Actual results could differ from those estimates.
Individual Fund Deficit
At June 30, 2017, the Assessor’s Office nonmajor governmental fund has a deficit fund balance of $71. This amount will be offset by future taxes.
Current Adoption of GASB Statements
GASB Statement No. 74, Financial Reporting for Postemployment Benefit Plans Other Than Pension Plans, was issued in June 2015. The objective of this statement is to improve the usefulness of information about postemployment benefits other than pensions included in the general purpose external financial reports of state and local governmental other postemployment benefit plans for making decisions and assessing accountability. The requirements of this statement are effective for the City for the year ended June 30, 2017, and had no effect on the City’s financial statements.
GASB Statement No. 77, Tax Abatement Disclosures, provides financial statement users with essential information about the nature and magnitude of the reduction in tax revenues through tax abatement programs in order to better assess the government’s financial position and results of operations. The requirements of this statement are effective for the City for the year ended June 30, 2017 and resulted in additional disclosures.
GASB Statement No. 80, Blending Requirements for Certain Component Units – an Amendment of GASB Statement No. 14, improves financial reporting by clarifying the financial statement presentation requirements for certain component units and amend the blending requirements for the financial statement presentation of component units of all state and local governments. The additional criteria requires blending of a component unit incorporated as a not-for-profit corporation in which the primary government is the sole corporate member. The additional criterion does not apply to the component units included in the financial reporting entity pursuant to the provisions of Statement No. 39, Determining Whether Certain Organizations Are Component Units. The requirements of this statement are effective for the City for the year ended June 30, 2017, and had no effect on the City’s financial statements.
GASB Statement No. 82, Pension Issues – an Amendment of GASB Statement No. 67, No. 68 and No. 73, addresses certain issues that have been raised with respect to Statement No. 67, Financial Reporting for Pension Plans, No. 68, Accounting and Financial Reporting for Pensions, and No. 73, Accounting and Financial Reporting for Pensions and Relate Assets That Are Not within the Scope of GASB 68, and Amendments to Certain Provisions if GASB Statements 67 and 68. Specifically, this Statement addresses issues regarding (1) the presentation of payroll-related measures in required supplementary information, (2) the selection of assumptions and the treatment of deviations from the guidance in an Actuarial Standard of Practice for financial reporting purposes, and (3) the classification of payments made by employers to satisfy employee (plan member) contribution requirements. The requirements of this statement are effective for the City for the year ended June 30, 2017.
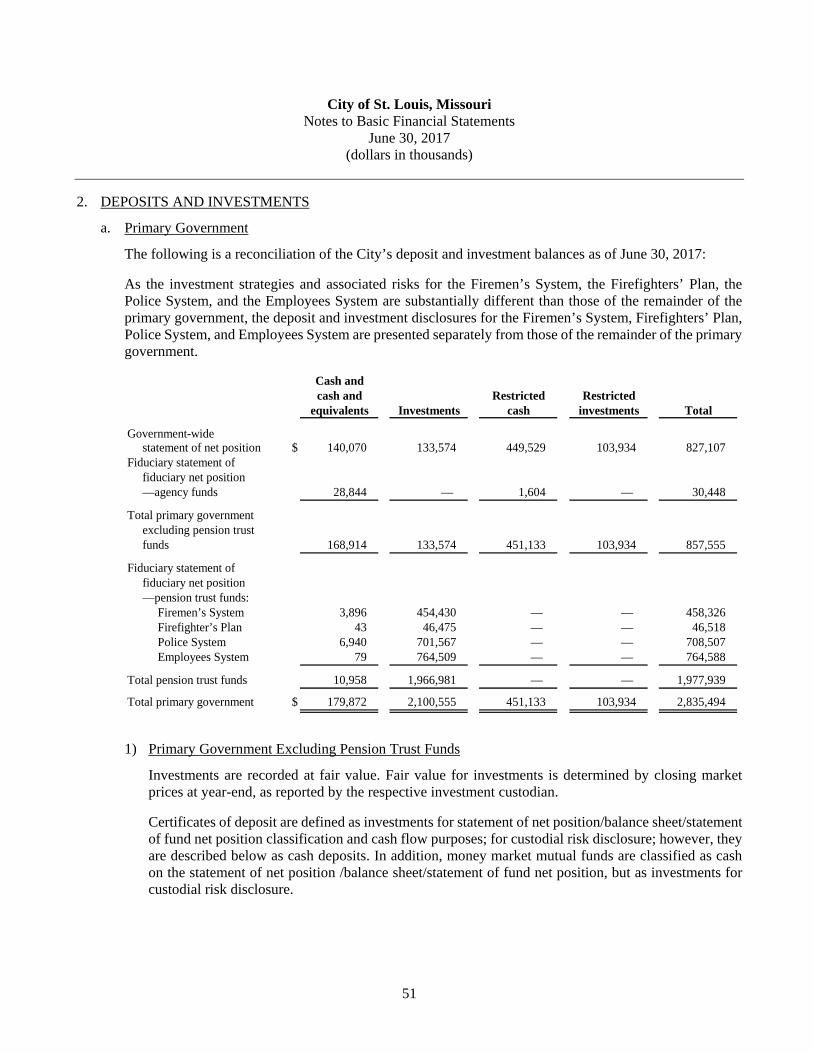
City of St. Louis, Missouri Notes to Basic Financial Statements
June 30, 2017 (dollars in thousands)
51
2. DEPOSITS AND INVESTMENTS
a. Primary Government
The following is a reconciliation of the City’s deposit and investment balances as of June 30, 2017:
As the investment strategies and associated risks for the Firemen’s System, the Firefighters’ Plan, the Police System, and the Employees System are substantially different than those of the remainder of the primary government, the deposit and investment disclosures for the Firemen’s System, Firefighters’ Plan, Police System, and Employees System are presented separately from those of the remainder of the primary government.
Cash andcash and Restricted Restricted
equivalents Investments cash investments Total
Government-widestatement of net position $ 140,070 133,574 449,529 103,934 827,107
Fiduciary statement offiduciary net position—agency funds 28,844 — 1,604 — 30,448
Total primary governmentexcluding pension trustfunds 168,914 133,574 451,133 103,934 857,555
Fiduciary statement offiduciary net position—pension trust funds:
Firemen’s System 3,896 454,430 — — 458,326 Firefighter’s Plan 43 46,475 — — 46,518 Police System 6,940 701,567 — — 708,507 Employees System 79 764,509 — — 764,588
Total pension trust funds 10,958 1,966,981 — — 1,977,939
Total primary government $ 179,872 2,100,555 451,133 103,934 2,835,494
1) Primary Government Excluding Pension Trust Funds
Investments are recorded at fair value. Fair value for investments is determined by closing market prices at year-end, as reported by the respective investment custodian.
Certificates of deposit are defined as investments for statement of net position/balance sheet/statement of fund net position classification and cash flow purposes; for custodial risk disclosure; however, they are described below as cash deposits. In addition, money market mutual funds are classified as cash on the statement of net position /balance sheet/statement of fund net position, but as investments for custodial risk disclosure.
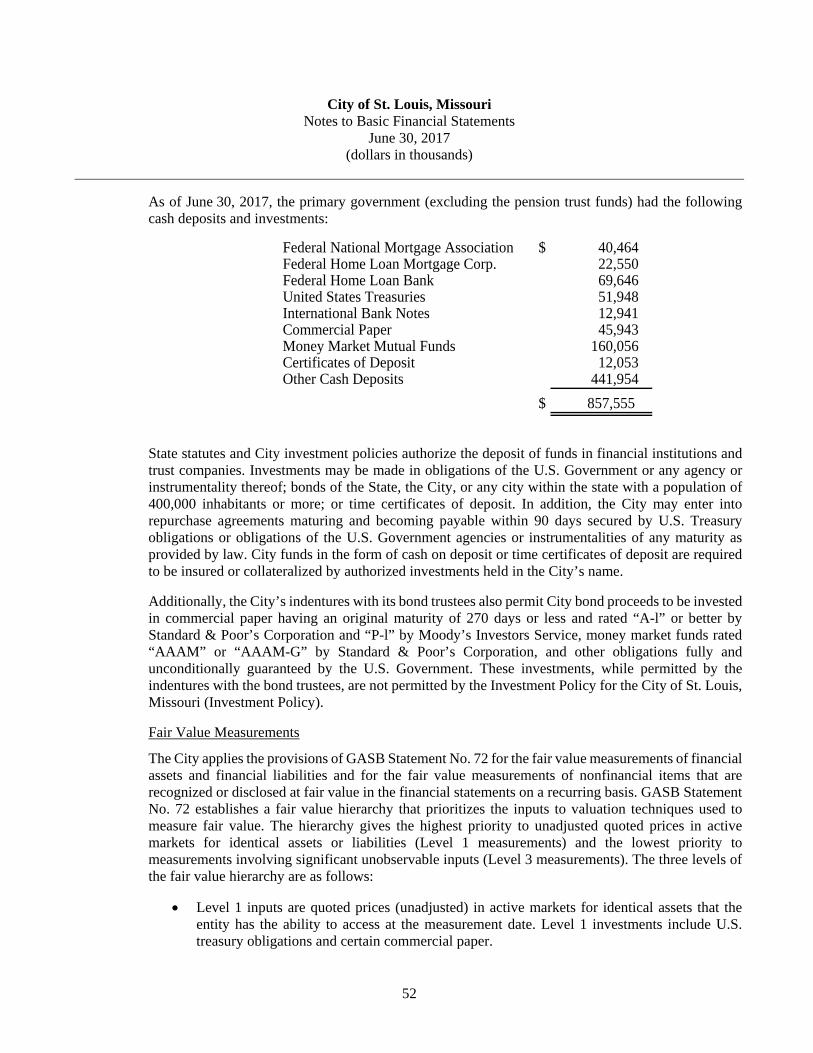
City of St. Louis, Missouri Notes to Basic Financial Statements
June 30, 2017 (dollars in thousands)
52
As of June 30, 2017, the primary government (excluding the pension trust funds) had the following cash deposits and investments:
Federal National Mortgage Association $ 40,464 Federal Home Loan Mortgage Corp. 22,550 Federal Home Loan Bank 69,646 United States Treasuries 51,948 International Bank Notes 12,941 Commercial Paper 45,943 Money Market Mutual Funds 160,056 Certificates of Deposit 12,053 Other Cash Deposits 441,954
$ 857,555
State statutes and City investment policies authorize the deposit of funds in financial institutions and trust companies. Investments may be made in obligations of the U.S. Government or any agency or instrumentality thereof; bonds of the State, the City, or any city within the state with a population of 400,000 inhabitants or more; or time certificates of deposit. In addition, the City may enter into repurchase agreements maturing and becoming payable within 90 days secured by U.S. Treasury obligations or obligations of the U.S. Government agencies or instrumentalities of any maturity as provided by law. City funds in the form of cash on deposit or time certificates of deposit are required to be insured or collateralized by authorized investments held in the City’s name.
Additionally, the City’s indentures with its bond trustees also permit City bond proceeds to be invested in commercial paper having an original maturity of 270 days or less and rated “A-l” or better by Standard & Poor’s Corporation and “P-l” by Moody’s Investors Service, money market funds rated “AAAM” or “AAAM-G” by Standard & Poor’s Corporation, and other obligations fully and unconditionally guaranteed by the U.S. Government. These investments, while permitted by the indentures with the bond trustees, are not permitted by the Investment Policy for the City of St. Louis, Missouri (Investment Policy).
Fair Value Measurements
The City applies the provisions of GASB Statement No. 72 for the fair value measurements of financial assets and financial liabilities and for the fair value measurements of nonfinancial items that are recognized or disclosed at fair value in the financial statements on a recurring basis. GASB Statement No. 72 establishes a fair value hierarchy that prioritizes the inputs to valuation techniques used to measure fair value. The hierarchy gives the highest priority to unadjusted quoted prices in active markets for identical assets or liabilities (Level 1 measurements) and the lowest priority to measurements involving significant unobservable inputs (Level 3 measurements). The three levels of the fair value hierarchy are as follows:
• Level 1 inputs are quoted prices (unadjusted) in active markets for identical assets that the entity has the ability to access at the measurement date. Level 1 investments include U.S. treasury obligations and certain commercial paper.

City of St. Louis, Missouri Notes to Basic Financial Statements
June 30, 2017 (dollars in thousands)
53
• Level 2 inputs are observable inputs other than Level 1 prices such as quoted prices for similar assets or liabilities, quoted prices in markets that are not active, or other inputs that are observable or can be corroborated by observable market data for substantially the full term of the asset or liabilities. Level 2 investments include certain commercial paper and U.S. government agency obligations.
• Level 3 inputs are significant unobservable inputs for the asset. The City had no Level 3 investments as of June 30, 2017.
The following table presents assets that are measured at fair value on a recurring basis at June 30, 2017:
Quoted pricesin active Significant
for markets other Significant identical observable unobservableassets inputs inputs
Total (Level 1) (Level 2) (Level 3)
U.S. GovernmentAgency Obligation $ 132,660 — 132,660 —
United States Treasuries 51,948 51,948 — — International Bank Notes 12,941 — 12,941 — Commercial Paper 45,943 27,916 18,027 — Certificate of Deposit 12,053 12,053 — — Money Market Mutual
Funds 160,056 — 160,056 —
$ 415,601 91,917 323,684 —
Interest Rate Risk
Interest rate risk is the risk that the fair value of investments will be adversely affected by a change in interest rates. The City seeks to minimize its exposure to fair value losses arising from changes in interest rates by selecting investments in adherence to the Investment Policy for the City of St. Louis, Missouri (Investment Policy). The Investment Policy provides that, to the extent possible, the City shall attempt to match its investments with anticipated cash flow requirements. Unless matched to a specific cash flow, the City will not directly invest in securities or make a time deposit with a stated maturity or more than five years from the date of purchase. The average maturity for collateral provided to the City for deposits in connection with a repurchase agreement shall not exceed five years without the written approval of the Treasurer. In connection with any outstanding bond issue, debt service reserve funds may be invested to a maximum maturity of the bond issue.

City of St. Louis, Missouri Notes to Basic Financial Statements
June 30, 2017 (dollars in thousands)
54
The investments of the primary government (excluding the pension trust funds) had the following maturities on June 30, 2017:
Investment Maturities (in years)Fair value Less than 1 1-5 6-10 More than 10
Federal NationalMortgage Association $ 40,464 16,996 23,468 — —
Federal Home LoanMortgage Corp. 22,550 7,955 14,595 — —
Federal Home Loan Bank 69,646 24,458 45,188 — — United States Treasuries 51,948 18,581 33,367 — — International Bank Notes 12,941 — 12,941 — — Commercial Paper 45,943 45,943 — — — Certificate of Deposit 12,053 12,053 — — — Money Market Mutual
Funds 160,056 33,960 126,096 — — $ 415,601 159,946 255,655 — —
Credit Risk
Credit risk is the risk that an issuer or other counterparty to an investment will not fulfill its obligations. The Investment Policy provides that investments of the City be rated in one of the three highest ratings categories by Moody’s Investors Service, Standard & Poor’s Corporation, or Fitch’s Ratings Service.
The investments of the primary government (excluding the pension trust funds) were rated as follows by Moody’s Investors Service, Standard & Poor’s Corporation, or Fitch’s Ratings Service as of June 30, 2017:
Fair value AAA A-1+ AA+ A-1 Not rated
Federal NationalMortgage Association $ 40,464 — — 35,850 — 4,614
Federal Home LoanMortgage Corp. 22,550 — — 22,550 — —
Federal Home Loan Bank 69,646 — 2,043 55,483 — 12,120 United States Treasuries* 51,948 — — 21,788 — 30,160 International Bank Notes 12,941 12,941 — — — Commercial Paper 45,943 — 3,496 — 36,391 6,056 Certificate of Deposit 12,053 12,003 — — — 50 Money Market Mutual
Funds 160,056 4,954 — — — 155,102
$ 415,601 29,898 5,539 135,671 36,391 208,102
*The City's investments in United States Treasuries are explicitly guaranteed by the United States government and therefore do not require a rating.

City of St. Louis, Missouri Notes to Basic Financial Statements
June 30, 2017 (dollars in thousands)
55
Custodial Credit Risk
Custodial credit risk is the risk that, in the event of the failure of a counterparty, the City will not be able to recover the value of the investments, collateral securities, or deposits that are in the possession of the counterparty. Custodial credit risk is the risk that, in the event of the failure of a counterparty, the City will not be able to recover the value of the investments or collateral securities that are in the possession of the counterparty.
The Investment Policy requires that all cash deposits, time certificates of deposit, deposits with listed institutions, and repurchase agreements be covered by adequate pledged collateral. Acceptable collateral includes U.S. Treasury obligations, other interest-bearing securities guaranteed as to principal and interest by the United States or an agency or instrumentality of the United States, bonds of the State or bonds of the City. The market value of the principal and accrued interest of the collateral must equal 103% of the deposits secured, less any amount subject to federal deposit insurance. At June 30, 2017, the City had cash accounts at a financial institution that were uncollateralized. The total amount that was uncollateralized and exposed to custodial credit risk was $529. All City securities and securities pledged as collateral must be held in a segregated account on behalf of the City by an independent third party with whom the City has a current custodial agreement and has been designated by the Treasurer and Funds Committee as eligible to serve in such a capacity.
At June 30, 2017, the following City investments are held by the counterparty’s trust department or agent, and are not in the City’s name: $3,189 of Federal National Mortgage Association securities, $1,693 of Federal Home Loan Mortgage Corporation securities, $8,661 Federal Home Loan Bank securities and $8,078 of United States Treasury Notes. All remaining City investments and collateral securities pledged against City deposits are held by the counterparty’s trust department or agent in the City’s name.
Concentration of Credit Risk
The Investment Policy provides that, with the exception of U.S. Treasury Securities and Other Cash Deposits, no more than 50% of the City’s total investment portfolio will be invested in a single security type or with a single financial institution.
At June 30, 2017, the concentration of the City’s deposits and investments was as follows:
Federal National Mortgage Association 4.72%Federal Home Loan Mortgage Corp. 2.63Federal Home Loan Bank 8.12United States Treasuries 6.06International Bank Notes 1.51Commercial Paper 5.36Money Market Mutual Funds 18.66Certificates of Deposit 1.40Other Cash Deposits 51.54
100.00%

City of St. Louis, Missouri Notes to Basic Financial Statements
June 30, 2017 (dollars in thousands)
56
2) Primary Government—Pension Trust Fund—Firemen’s System
As of September 30, 2016, the Firemen’s System had the following cash deposits and investments:
Common stock $ 175,775 Collective investment—equity 29,944 Limited partnership units 19,960 Hedge funds—equity 76,203 Collective investment—bonds 70,611 Corporate bonds 30,942 Real estate investment trust 41,979 Money market funds 9,016 Other cash deposits 3,896
$ 458,326
Marketable securities are stated at fair value. Fair values are based on the last reported sales price on September 30 or on the last reported bid price if no sale was made on that date.
Fair Value Measurement and Application. GASB 72 was issued to address accounting and financial and reporting issues related to fair value measurements. The Firemen’s System categorizes its fair value measurements within the fair value hierarchy established by accounting principles generally accepted in the United States of America. The Firemen’s System has the following recurring fair value measurements as of September 30, 2016:
Level 1 Level 2 Level 3 TotalInvestments, at fair value:
Corporate stocks:Domestic $ 116,421 — — 116,421 International 59,354 — — 59,354
Collective investment funds - governmentbonds, agencies, and mortgaged-backed securities — 5,319 — 5,319
Corporate bonds:Domestic — 30,942 — 30,942
Collective investment funds - international equity 29,944 — — 29,944
Collective investment funds - domestic fixed income — 65,292 — 65,292
Hedge funds — — — — Limited partnership units - energy — 19,960 — 19,960 Money market funds 9,016 — — 9,016
Total investments $ 214,735 121,513 — 336,248 Investments measured at NAV:
Hedge funds 76,203 Real estate investment trust 41,979
Total investments measured at NAV 118,182
Total investments measured at fair value $ 454,430

City of St. Louis, Missouri Notes to Basic Financial Statements
June 30, 2017 (dollars in thousands)
57
The Firemen’s System’s investments are continuously exposed to various types of inherent risks. These risks are mitigated by the Firemen’s System’s development and continual monitoring of sound investment policies. The investment maturities, credit rating by investment, and foreign currency exposures by asset class schedules are presented to provide an illustration of the Firemen’s System’s current level of exposure to various risks.
The following schedule provides a summary of the fixed income investment maturities by investment category, which helps demonstrate the current level of interest rate risk assumed by the Firemen’s System as of September 30, 2016:
Investment maturities (in years)Fair Less than More thanvalue 1 1-5 6-10 10
Collective investment – bonds $ 70,611 7,902 31,346 16,776 14,587Corporate bonds 30,942 — 9,479 18,221 3,242
$ 101,553 7,902 40,825 34,997 17,829
The Firemen’s System’s fixed income investments level of exposure to credit risk, or the risk that an issuer or other counterparty to an investment will not fulfill its obligations, is demonstrated by the following table as of September 30, 2016:
Collective CorporateCredit Rating Total investment bonds
AAA $ 42,356 42,356 —AA 7,076 7,076 —A 8,866 8,866 —BBB 15,164 11,430 3,734BB 14,763 456 14,307B 12,760 242 12,518Not rated 568 185 383
$ 101,553 70,611 30,942
Certain collective investment funds are classified by average credit rating levels of the portfolios.

City of St. Louis, Missouri Notes to Basic Financial Statements
June 30, 2017 (dollars in thousands)
58
Foreign currency risk is the risk that changes in exchange rates will adversely impact the fair value of an investment. The Firemen’s System’s policy is to allow the individual investment managers to decide what action to take regarding their respective portfolio’s foreign currency exposure. The following table demonstrates the Firemen’s System’s current level of foreign currency exposure as of September 30, 2016:
Real estateMoney Fixed Hedge investmentmarket Equities income fund trust Total
Australian Dollar $ — 2,133 — — — 2,133 British Pound Sterling — 8,841 — — — 8,841 Canadian Dollar — 745 — — — 745 Danish Krone — 1,607 — — — 1,607 Euro — 23,151 — — — 23,151 Hong Kong Dollar — 2,682 — — — 2,682 Japanese Yen — 5,159 — — — 5,159 Singapore Dollar — 706 — — — 706 South Korean Won — 1,480 — — — 1,480 Swedish Krona — 438 — — — 438 Swiss Franc — 5,193 — — — 5,193
Total foreigncurrency — 52,135 — — — 52,135
U.S. Dollar 9,016 173,544 101,553 76,203 41,979 402,295
Total $ 9,016 225,679 101,553 76,203 41,979 454,430
Custodial credit risk is the risk that an issuer or other counterparty to an investment will not fulfill its obligations. The Firemen’s System’s minimum credit quality rating for each issue shall be “BBB” (or its equivalent) at the time of purchase. In the event of a split-rating, the higher rating shall apply. The fixed income portfolio should have an average quality rating of at least “A” (or its equivalent). Commercial paper issues must be rated at least “Al” (or its equivalent) at the time of purchase. In the event of a split-rating, the higher rating shall apply. In the event of a downgrade below investment grade by any rating agency, the investment manager is required to notify the Board and investment consultant as soon as possible and to refrain from any further investment in the downgraded issue.
Interest rate risk is the risk that changes in interest rates will adversely affect the fair value of an investment. Investments held for longer periods are subject to increased risk of adverse interest rate changes. The effective duration of any fixed income portfolio shall not exceed 120% of the effective duration of the investment manager’s broad market benchmark.
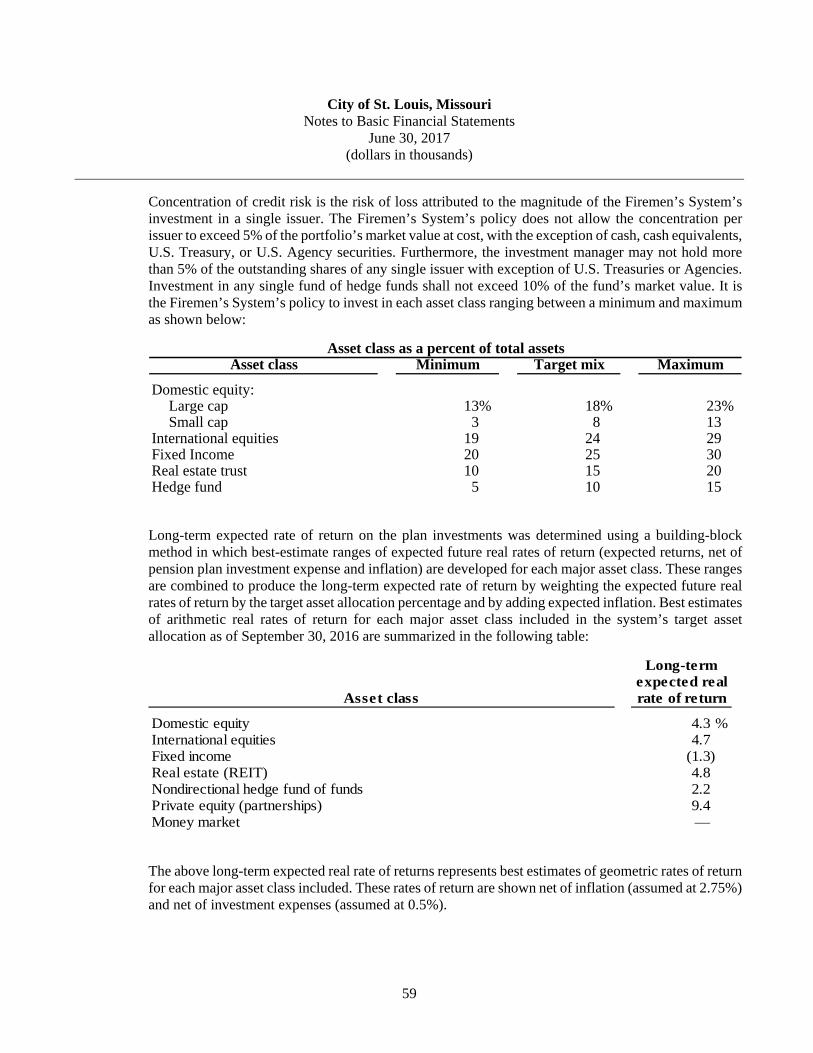
City of St. Louis, Missouri Notes to Basic Financial Statements
June 30, 2017 (dollars in thousands)
59
Concentration of credit risk is the risk of loss attributed to the magnitude of the Firemen’s System’s investment in a single issuer. The Firemen’s System’s policy does not allow the concentration per issuer to exceed 5% of the portfolio’s market value at cost, with the exception of cash, cash equivalents, U.S. Treasury, or U.S. Agency securities. Furthermore, the investment manager may not hold more than 5% of the outstanding shares of any single issuer with exception of U.S. Treasuries or Agencies. Investment in any single fund of hedge funds shall not exceed 10% of the fund’s market value. It is the Firemen’s System’s policy to invest in each asset class ranging between a minimum and maximum as shown below:
Asset class as a percent of total assetsAsset class Minimum Target mix Maximum
Domestic equity:Large cap 13% 18% 23%Small cap 3 8 13
International equities 19 24 29Fixed Income 20 25 30Real estate trust 10 15 20Hedge fund 5 10 15
Long-term expected rate of return on the plan investments was determined using a building-block method in which best-estimate ranges of expected future real rates of return (expected returns, net of pension plan investment expense and inflation) are developed for each major asset class. These ranges are combined to produce the long-term expected rate of return by weighting the expected future real rates of return by the target asset allocation percentage and by adding expected inflation. Best estimates of arithmetic real rates of return for each major asset class included in the system’s target asset allocation as of September 30, 2016 are summarized in the following table:
Long-termexpected real
Asset class rate of return
Domestic equity 4.3 %International equities 4.7Fixed income (1.3)Real estate (REIT) 4.8Nondirectional hedge fund of funds 2.2Private equity (partnerships) 9.4Money market —
The above long-term expected real rate of returns represents best estimates of geometric rates of return for each major asset class included. These rates of return are shown net of inflation (assumed at 2.75%) and net of investment expenses (assumed at 0.5%).

City of St. Louis, Missouri Notes to Basic Financial Statements
June 30, 2017 (dollars in thousands)
60
Liquidity risk is the risk that redemption notice periods are required and longer periods may be imposed before payment of redemption proceeds are settled for the following investments:
AJO, LP (Hedge Fund) EnTrust Capital Diversified Fund QP, Ltd. (Hedge Fund) Magnitude Institutional, LLC Class A (Hedge Fund) The Principle U.S. Property Account (REIT) Investments that exceed 5% or more of net assets held in trust for pension benefits for the Firemen’s System at September 30, 2016 are as follows:
Aberdeen Core Plus Fixed Income Portfolio $ 65,292The Principal US Property Account 41,979Acadian International Small Cap Fund 29,944CF AJO Emergeing Mkts All- Cap Offshore Fund 28,449Magnitude Institutional Ltd. Class A Hedge Fund 25,864
The Firemen’s System participates in securities lending programs in order to enhance investment yield. In a securities lending transaction, the Firemen’s System transfers possession—but not title—of the security to the borrower. Borrowers shall be rated AA, A, or higher by Moody’s or Standard & Poor’s. Collateral consisting of cash, letter of credit, U.S. government or agency securities, or floating rate notes of U.S. issuers is received and held by a financial institution. The collateral maintained is at least 102% of loan value for domestic securities and 105% of loan value for international securities of the market value of the securities lent. The Firemen’s System maintains all the rights in the collateral of a secured lender under the Uniform Commercial Code. The Firemen’s System continues to earn income on the loaned security. In addition, the Firemen’s System receives 70% of the net lending fees generated by each loan of securities. The financial institution receives the remaining 30% of the net lending fees as compensation for its services provided in the securities lending program. The financial institution indemnifies operation risk and counter party risk. The Firemen’s System authorizes the lending and loans of the following: domestic securities, U.S. Treasuries, corporate bonds, and equities. The Firemen’s System does not have the ability to pledge or sell collateral securities without borrower default. Therefore, for accounting purposes, the financial statements do not reflect an increase in assets or liabilities associated with securities lent. At September 30, 2016, $66,680 in loans were outstanding to borrowers. The Firemen’s System earned income of $274 for its participation in the securities lending program for the year ended September 30, 2016.
3) Primary Government—Pension Trust Fund—Firefighters’ Plan
As of September 30, 2016, the Firefighters’ Plan had the following cash deposits and investments:
Equities $ 19,908 Fixed income 7,751 Collective investment funds 10,559 Money market funds 8,257 Other cash deposits 43
$ 46,518
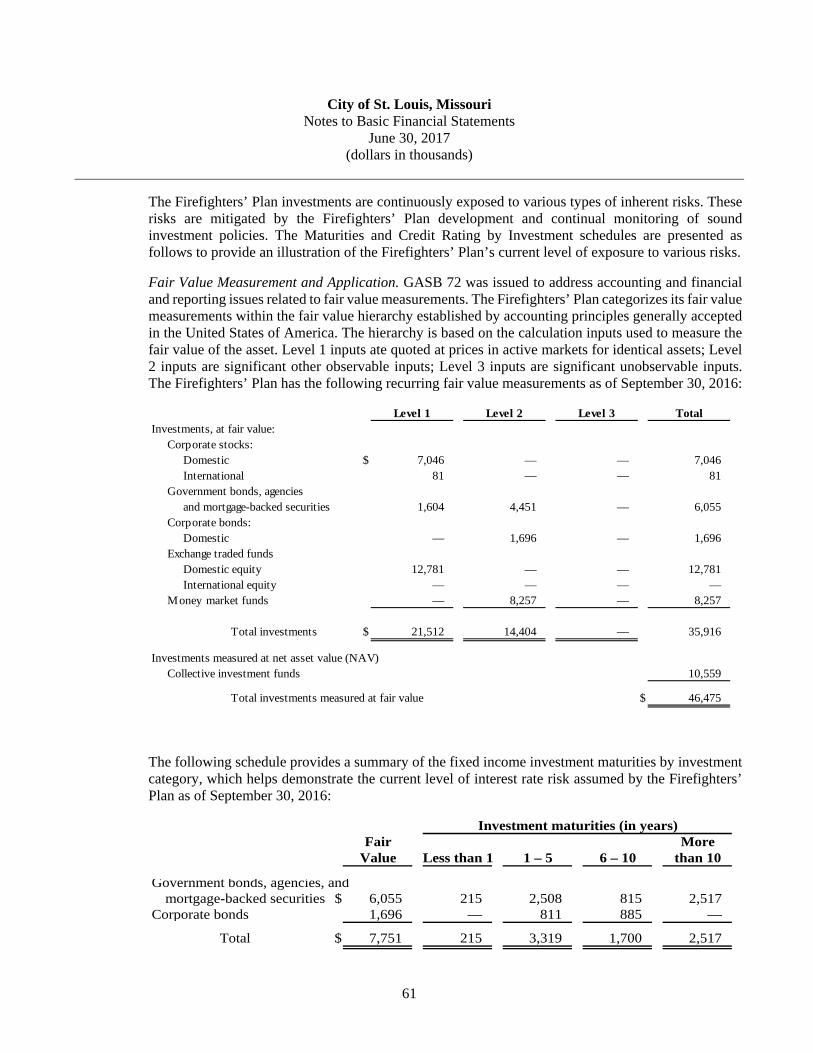
City of St. Louis, Missouri Notes to Basic Financial Statements
June 30, 2017 (dollars in thousands)
61
The Firefighters’ Plan investments are continuously exposed to various types of inherent risks. These risks are mitigated by the Firefighters’ Plan development and continual monitoring of sound investment policies. The Maturities and Credit Rating by Investment schedules are presented as follows to provide an illustration of the Firefighters’ Plan’s current level of exposure to various risks.
Fair Value Measurement and Application. GASB 72 was issued to address accounting and financial and reporting issues related to fair value measurements. The Firefighters’ Plan categorizes its fair value measurements within the fair value hierarchy established by accounting principles generally accepted in the United States of America. The hierarchy is based on the calculation inputs used to measure the fair value of the asset. Level 1 inputs ate quoted at prices in active markets for identical assets; Level 2 inputs are significant other observable inputs; Level 3 inputs are significant unobservable inputs. The Firefighters’ Plan has the following recurring fair value measurements as of September 30, 2016:
Level 1 Level 2 Level 3 TotalInvestments, at fair value:
Corporate stocks:Domestic $ 7,046 — — 7,046 International 81 — — 81
Government bonds, agenciesand mortgage-backed securities 1,604 4,451 — 6,055
Corporate bonds:Domestic — 1,696 — 1,696
Exchange traded fundsDomestic equity 12,781 — — 12,781 International equity — — — —
Money market funds — 8,257 — 8,257
Total investments $ 21,512 14,404 — 35,916
Investments measured at net asset value (NAV)Collective investment funds 10,559
Total investments measured at fair value $ 46,475
The following schedule provides a summary of the fixed income investment maturities by investment category, which helps demonstrate the current level of interest rate risk assumed by the Firefighters’ Plan as of September 30, 2016:
Investment maturities (in years)Fair More
Value Less than 1 1 – 5 6 – 10 than 10
Government bonds, agencies, andmortgage-backed securities $ 6,055 215 2,508 815 2,517
Corporate bonds 1,696 — 811 885 —
Total $ 7,751 215 3,319 1,700 2,517

City of St. Louis, Missouri Notes to Basic Financial Statements
June 30, 2017 (dollars in thousands)
62
The Firefighters’ Plan fixed income investments current level of exposure to credit risk, or the risk that an issuer or other counterparty to an investment will not fulfill its obligations, is demonstrated by the following table as of September 30, 2016:
Credit Rating Level Total
AA+ $ 4,397 A- 643 BBB+ 639 BBB 344 Note rated 1,728
$ 7,751
Custodial credit risk is the risk that an issuer or other counterparty to an investment will not fulfill its obligations. The Firefighters’ Plan’s minimum credit quality for each issue shall be “BBB” (or its equivalent) at the time of purchase. The fixed income portfolio should have an average quality rating of at least “A” (or its equivalent). In the event of a downgrade below investment grade by any rating agency, the Investment Manager is required to notify the Firefighters’ Plan and provide a plan for holding or disposition of said securities.
Interest rate risk is the risk that changes in interest rate will adversely affect the fair value of an investment. Investments held for longer periods are subject to increased risk of adverse interest rate changes. The effective duration of any fixed income portfolio shall not exceed 120% of the effective duration of the Investment Manager’s broad market benchmark.
Concentration of credit risk is the risk of loss attributed to the magnitude of the Firefighters’ Plan’s investment in a single issuer. The Firefighters’ Plan policy does not allow the concentration per issuer to exceed 5% of the portfolio’s market value, with the exception of U.S. government obligations. Furthermore, the investment manager may not hold more than 5% of the outstanding shares of any single issuer. It is the Firefighters’ Plan policy to invest in each asset class ranging between a minimum and maximum as shown below:
Asset class as a percent of total assetsAsset class Minimum Target mix Maximum
Domestic large cap equity 25% 30% 35%Domestic mid cap equity 15 20 25International equity 20 25 30Real Estate — 5 10Fixed income 15 20 25
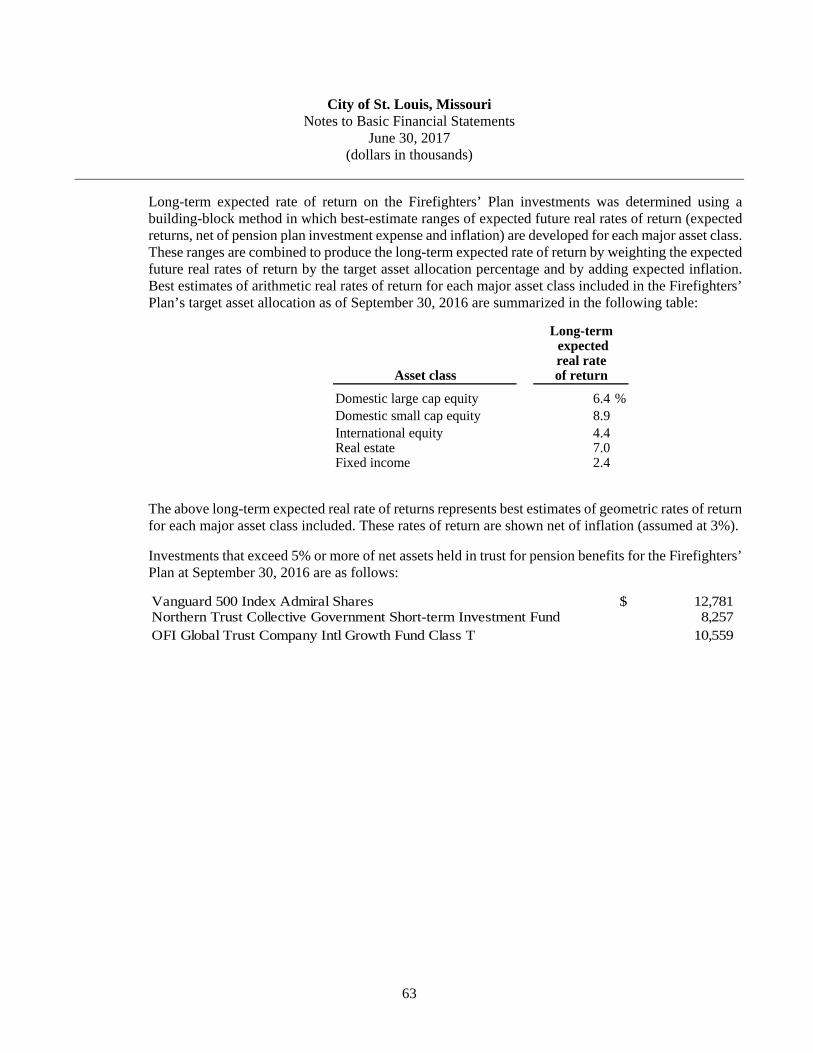
City of St. Louis, Missouri Notes to Basic Financial Statements
June 30, 2017 (dollars in thousands)
63
Long-term expected rate of return on the Firefighters’ Plan investments was determined using a building-block method in which best-estimate ranges of expected future real rates of return (expected returns, net of pension plan investment expense and inflation) are developed for each major asset class. These ranges are combined to produce the long-term expected rate of return by weighting the expected future real rates of return by the target asset allocation percentage and by adding expected inflation. Best estimates of arithmetic real rates of return for each major asset class included in the Firefighters’ Plan’s target asset allocation as of September 30, 2016 are summarized in the following table:
Long-term expectedreal rate
Asset class of return
Domestic large cap equity 6.4 %Domestic small cap equity 8.9International equity 4.4Real estate 7.0Fixed income 2.4
The above long-term expected real rate of returns represents best estimates of geometric rates of return for each major asset class included. These rates of return are shown net of inflation (assumed at 3%).
Investments that exceed 5% or more of net assets held in trust for pension benefits for the Firefighters’ Plan at September 30, 2016 are as follows:
Vanguard 500 Index Admiral Shares $ 12,781Northern Trust Collective Government Short-term Investment Fund 8,257OFI Global Trust Company Intl Growth Fund Class T 10,559

City of St. Louis, Missouri Notes to Basic Financial Statements
June 30, 2017 (dollars in thousands)
64
4) Primary Government—Pension Trust Fund—Police System
As of September 30, 2016, the Police System had the following cash deposits and investments:
Equities:Common stock $ 167,904 Collective investment funds 178,090 Real estate securities fund 73,502
Mortgaged-backed securities-government 1,662 Mortgaged-backed securities-non-government 15,131 Fixed income collective investment fund 15,130 Corporate bonds 57,885 Hedge funds of funds 34,102 Government securities 24,795 Money market funds 33,969 Investment property 863 Partnership interest 98,534 Other cash deposits 6,940
$ 708,507
The Police System’s bank deposits were fully secured or collateralized at September 30, 2016. The Police System’s bank deposits and repurchase agreements were insured by the FDIC, collateralized with securities held by the Federal Reserve Bank in the Police System’s name.
Marketable securities are stated at fair value. Fair values are based on the last reported sales price on September 30 or on the last reported bid price if no sale was made on that date. The real estate investment fund is valued by the fund manager based on independent real estate appraisals of the fund’s holdings. The hedge fund of funds are carried at the value reported by the funds custodians based upon underlying investments. Investment property is reported at estimated fair value as determined by an independent real estate appraisal of the property.

City of St. Louis, Missouri Notes to Basic Financial Statements
June 30, 2017 (dollars in thousands)
65
Fair Value Measurement and Application. GASB 72 was issued to address accounting and financial and reporting issues related to fair value measurements. The Police System categorizes its fair value measurements within the fair value hierarchy established by accounting principles generally accepted in the United States of America. The hierarchy is based on the calculation inputs used to measure the fair value of the asset. Level 1 inputs ate quoted at prices in active markets for identical assets; Level 2 inputs are significant other observable inputs; Level 3 inputs are significant unobservable inputs. The Police System has the following recurring fair value measurements as of September 30, 2016:
Level 1 Level 2 Level 3 Total
Investments, at fair value:Corporate stocks:
Domestic $ 127,150 — — 127,150 International 40,590 — — 40,590
Government bonds, agenciesand mortgage-backed securities — 41,588 — 41,588
Corporate bonds:Domestic — 50,883 — 50,883 International — 7,001 — 7,001
Collective investment funds:International equity 85,120 — — 85,120 Domestic equity 92,970 — — 92,970 Domestic fixed income — 15,130 — 15,130
Limited partnership units:Venture Capital — — 88,085 88,085 Energy — — 10,450 10,450
Derivatives:Commodity fund 164 — — 164
Money market funds 33,969 — — 33,969 Investment property — — 863 863
Total investments $ 379,963 114,602 99,398 593,963
Investments measured at net asset value (NAV):Hedge funds 34,102 Real estate investment trust 73,502
Total investments measured at NAV 107,604
Total investments measured at fair value $ 701,567
For the investments measured at NAV at September 30, 2016:
• There were no unfunded purchase commitments;
• Redemption frequency, when currently eligible, is quarterly;
• Notice period for redemptions is 1 to 90 days.

City of St. Louis, Missouri Notes to Basic Financial Statements
June 30, 2017 (dollars in thousands)
66
The Police System’s investments are continuously exposed to various types of inherent risks. These risks are mitigated by the Police System’s development and continual monitoring of sound investment policies. The investment maturities, credit rating by investment, and foreign currency exposures by asset class schedules are presented below to provide an illustration of the Police System’s current level of exposure to various risks.
The following schedule provides a summary of the fixed income investment maturities by investment type, which helps demonstrate the current level of interest rate risk assumed by the Police System as of September 30, 2016:
Investment maturities (in years)Fair Morevalue Less than 1 1 – 5 6 – 10 than 10
Mortgaged-backed securities – government $ 1,662 — 58 47 1,557 Mortgaged-backed securities – nongovernment 15,131 — 3,139 815 11,177 Collective investment funds 15,130 3,564 3,453 3,383 4,730 Corporate bonds 57,885 9,469 13,911 19,671 14,834 Government Securities 24,795 3,030 16,607 1,567 3,591
$ 114,603 16,063 37,168 25,483 35,889
The Police System’s fixed income investments current level of exposure to credit risk, or the risk that an issuer or other counterparty to an investment will not fulfill its obligations, is demonstrated by the following table as of September 30, 2016:
GovernmentNongovernmentmortgage- mortgage- Collective
backed backed investment Corporate GovernmentCredit rating level Total securities securities funds bonds securities
AAA $ 17,590 1,662 3,288 — 1,825 10,815 AA 33,561 — 731 15,130 6,514 11,186 A 34,552 — 4,385 — 30,167 — BBB 10,429 — — — 10,429 — BB — — — — — — CCC 167 — 167 — — — CC — — — — — — D 199 — 199 — — — Not Rated 18,105 — 6,361 — 8,950 2,794
$ 114,603 1,662 15,131 15,130 57,885 24,795

City of St. Louis, Missouri Notes to Basic Financial Statements
June 30, 2017 (dollars in thousands)
67
Foreign currency risk is the risk that changes in exchange rates will adversely impact the fair value of an investment. The Police System’s policy is to allow the individual investment managers to decide what action to take regarding their respective portfolio’s foreign currency exposure. The following table demonstrates the Police System’s current level of foreign currency exposure as of September 30, 2016:
InvestmentHedge property
Fixed Money Commodity funds andEquities income market fund of funds partnership Total
Australian Dollar $ — — — — — — — British Pound Sterling 625 937 — — — — 1,562 Canadian Dollar 874 2,855 — — — — 3,729 Euro 1,191 2,131 — — — — 3,322 Indian Rupee 961 — — — — — 961 Israeli Shekel 656 — — — — — 656 Japanese Yen — 1,079 — — — — 1,079 Norwegian Kron 13 — — — — — 13 Swiss Franc 862 — — — — — 862
Total foreigncurrency 5,182 7,002 — — — — 12,184
U.S. Dollar 414,150 107,601 33,969 164 34,102 99,397 689,383
Total $ 419,332 114,603 33,969 164 34,102 99,397 701,567
Custodial credit risk is the risk that an issuer or other counterparty to an investment will not fulfill its obligations. The Fixed Income Portfolio must have an average rating of “A” or better in the aggregate as measured by at least one credit rating service. In cases where the yield spread adequately compensates for additional risk, securities rated lower than “A” may be purchased, provided overall fixed income quality is maintained. All issues will be of investment grade quality (BBB or Baa rated) or higher at the time of purchase. Up to 15% of the total market value of fixed income securities may be invested in BBB or Baa rated securities. In cases where credit rating agencies assign different quality ratings to a security, the lower rating will be used. Should the rating of a fixed income security fall below minimum investment grade, the investment manager may continue to hold the security if they believe the security will be upgraded in the future, there is low risk of default, and buyers will continue to be available throughout the anticipated holding period. The investment manager has the responsibility of notifying the Board of Trustees through their designee whenever an issue falls below investment grade.
Interest rate risk is the risk that changes in interest rates will adversely affect the fair value of an investment. Investments held for longer periods are subject to increased risk of adverse interest rate changes. The average effective duration of the aggregate portfolio, reflecting all instruments including Collateralized Mortgage Obligations and Asset-Backed Securities, must be maintained at plus or minus one year of the duration of the respective investment manager’s benchmark index.
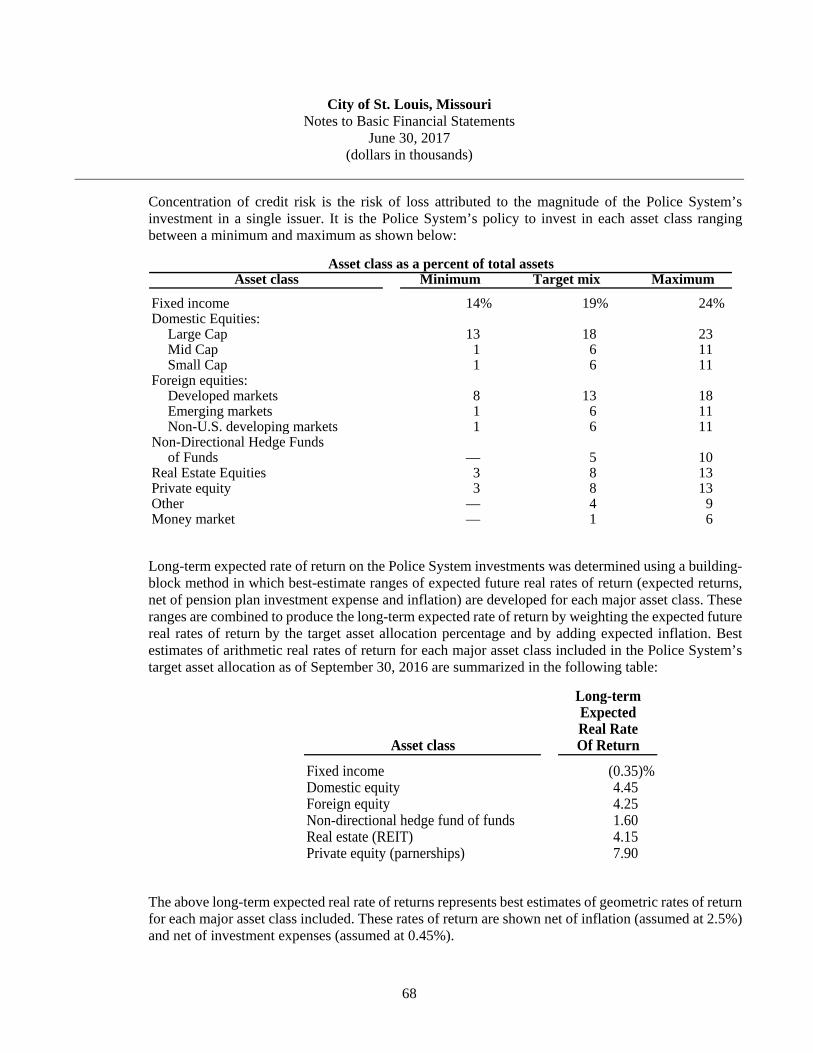
City of St. Louis, Missouri Notes to Basic Financial Statements
June 30, 2017 (dollars in thousands)
68
Concentration of credit risk is the risk of loss attributed to the magnitude of the Police System’s investment in a single issuer. It is the Police System’s policy to invest in each asset class ranging between a minimum and maximum as shown below:
Asset class as a percent of total assetsAsset class Minimum Target mix Maximum
Fixed income 14% 19% 24%Domestic Equities:
Large Cap 13 18 23Mid Cap 1 6 11Small Cap 1 6 11
Foreign equities:Developed markets 8 13 18Emerging markets 1 6 11Non-U.S. developing markets 1 6 11
Non-Directional Hedge Fundsof Funds — 5 10
Real Estate Equities 3 8 13Private equity 3 8 13Other — 4 9Money market — 1 6
Long-term expected rate of return on the Police System investments was determined using a building-block method in which best-estimate ranges of expected future real rates of return (expected returns, net of pension plan investment expense and inflation) are developed for each major asset class. These ranges are combined to produce the long-term expected rate of return by weighting the expected future real rates of return by the target asset allocation percentage and by adding expected inflation. Best estimates of arithmetic real rates of return for each major asset class included in the Police System’s target asset allocation as of September 30, 2016 are summarized in the following table:
Long-termExpectedReal Rate
Asset class Of Return
Fixed income (0.35)%Domestic equity 4.45Foreign equity 4.25Non-directional hedge fund of funds 1.60Real estate (REIT) 4.15Private equity (parnerships) 7.90
The above long-term expected real rate of returns represents best estimates of geometric rates of return for each major asset class included. These rates of return are shown net of inflation (assumed at 2.5%) and net of investment expenses (assumed at 0.45%).

City of St. Louis, Missouri Notes to Basic Financial Statements
June 30, 2017 (dollars in thousands)
69
Liquidity risk is the risk that redemption notice periods are required and longer periods may be imposed before payment of redemption proceeds are settled for the following investments:
Bank of New York Mellon EB Global Real Estate Securities Fund EnTrust Capital Diversified Fund QP, Ltd. Falcon E&P Opportunities Fund, L.P. GAM US Institutional Diversity, Inc. Neuberger Berman Secondary Opportunities Fund III, L.P. Principal U.S. Property Account Wellington Trust Company International Opportunities Fund
Investments which exceed 5% or more of net assets held in trust for pension benefits for the Police System are as follows:
Collective funds:MFB Northern Trust Company Daily S&P 500 Equity Index Fund $ 50,964Brandes Non-U.S. Small Cap Portfolio Fund 46,468Trilogy International Group Trust I 43,696MFB Northern Trust Collective Russell 1,000 Growth Index Fund 42,006Wellington Trust Company International Opportunities Fund 41,424Lazard Emerging Markets Core Equity Trust 40,590Principal Real Estate Investment Trust 38,859Crescent Capital High Income Fund 37,181
The Police System participates in securities lending programs in order to enhance investment yield. In a securities lending transaction, the Police System transfers possession—but not title—of the security to the borrower. Collateral consisting of cash, letter of credit, or government securities is received and held by a financial institution. The broker/dealer collateralizes their borrowing (usually in cash) to 102% of the security value plus accrued interest, and this collateral is adjusted daily to maintain the 102% level. The Police System maintains all the rights in the collateral of a secured lender under the Uniform Commercial Code. The Police System continues to earn income on the loaned security. In addition, the Police System receives 70% of the net lending fees generated by each loan of securities. The financial institution receives the remaining 30% of the net lending fees as compensation for its services provided in the securities lending program. The financial institution indemnifies operational risk and counterparty risk. The Police System authorizes the lending of domestic securities, U.S. Treasuries, corporate bonds, and equities. The Police System does not have the ability to pledge or sell collateral securities without borrower default. Therefore, for accounting purposes, the financial statements do not reflect an increase in assets or liabilities associated with securities lent. Outstanding loans to borrowers at September 30, 2016 were $67,526. The Police System earned income of $250 for its participation in the securities lending program for the year ended September 30, 2016.

City of St. Louis, Missouri Notes to Basic Financial Statements
June 30, 2017 (dollars in thousands)
70
5) Primary Government—Pension Trust Fund—Employees System
As of September 30, 2016, the Employees System had the following cash deposits and investments:
Common stocks $ 183,836 Managed international equity funds 162,719 Managed master limited partnerships 72,051 Bonds 85,845 Domestic bond funds 83,984 Real estate funds 92,764 Temporary cash investments 9,650 Managed hedge fund of funds 73,660 Other cash deposits 79
$ 764,588
The bank balances of the Employees System at September 30, 2016 were insured by the Federal Deposit Insurance Corporation up to $250. The remaining balances were collateralized by securities held by the pledging financial institution’s trust department in the Employees System’s name.
Investments are reported at fair market value. Securities traded on a national or international exchange funds are valued at the unit value quoted by the investee entity. Security transactions and any resulting realized gains or losses are accounted for on a completed transaction basis. Commingled funds are valued at the unit value quoted by the investee entity based on the underlying asset values. Real estate funds and other managed funds are valued based on valuations of underlying investments as reported by fund managers.
Fair Value Measurement and Application. GASB 72 was issued to address accounting and financial and reporting issues related to fair value measurements. The Employees System categorizes its fair value measurements within the fair value hierarchy established by accounting principles generally accepted in the United States of America. The hierarchy is based on the calculation inputs used to measure the fair value of the asset. Level 1 inputs ate quoted at prices in active markets for identical assets; Level 2 inputs are significant other observable inputs; Level 3 inputs are significant unobservable inputs.

City of St. Louis, Missouri Notes to Basic Financial Statements
June 30, 2017 (dollars in thousands)
71
The Employees System has the following recurring fair value measurements as of September 30, 2016:
Level 1 Level 2 Level 3 TotalInvestments, at fair value:
Fixed income securitiesU.S. Government securities $ 20,439 3,242 — 23,681 Corporate bonds — 29,987 — 29,987 Domestic bond funds 20,473 — — 20,473 International bonds and securities 1,276 30,262 — 31,538 Other debt obligations 10,289 — — 10,289 Common stocks 183,836 — — 183,836 Managed master limited partnerships 46,154 — — 46,154
Total investments $ 282,467 63,491 — 345,958
Investments measured at the net asset value (NAV)Loomis High Yield Conservative Trust (B) 27,789 SSGA Passive Bond Market Index (NL) Fund 35,722 Principal Real Estate Group Annuity Contract 92,764 Acadian Emerging Markets Mutual Equity Fund II 46,633 Kabouter International Opportunities Fund II 25,897 Silchester International Value Equity Group Trust 75,518 Walter Scott Group Trust International 40,568 Entrust Capital Diversified Fund 33,984 Weatherlow Offshore Fund I 39,676
Total investments measured at NAV 418,551
Total investments measured at fair value 764,509
Investment derivative instrumentsForeign exchange contracts $ 33,914 $ 33,914
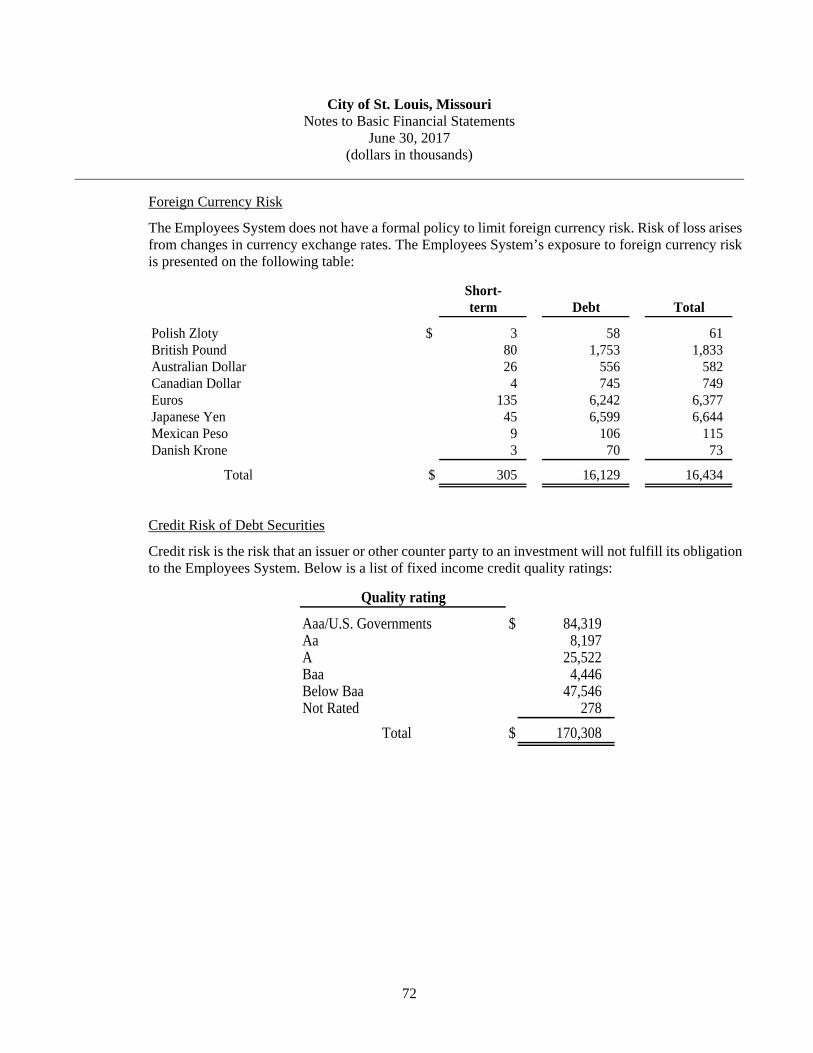
City of St. Louis, Missouri Notes to Basic Financial Statements
June 30, 2017 (dollars in thousands)
72
Foreign Currency Risk
The Employees System does not have a formal policy to limit foreign currency risk. Risk of loss arises from changes in currency exchange rates. The Employees System’s exposure to foreign currency risk is presented on the following table:
Short-term Debt Total
Polish Zloty $ 3 58 61 British Pound 80 1,753 1,833 Australian Dollar 26 556 582 Canadian Dollar 4 745 749 Euros 135 6,242 6,377 Japanese Yen 45 6,599 6,644 Mexican Peso 9 106 115 Danish Krone 3 70 73
Total $ 305 16,129 16,434
Credit Risk of Debt Securities
Credit risk is the risk that an issuer or other counter party to an investment will not fulfill its obligation to the Employees System. Below is a list of fixed income credit quality ratings:
Quality rating
Aaa/U.S. Governments $ 84,319 Aa 8,197 A 25,522 Baa 4,446 Below Baa 47,546 Not Rated 278
Total $ 170,308

City of St. Louis, Missouri Notes to Basic Financial Statements
June 30, 2017 (dollars in thousands)
73
All temporary cash investments held by the Employees Retirement System at September 30, 2016 were unrated.
Interest Rate Risk
The Employees System does not have a formal policy to limit interest rate risk. Interest rate risk is the risk that changes in interest rates will adversely affect the fair values of an investment. Duration is a measure of debt instrument’s exposure to a change in interest rate and the related sensitivity of market price to parallel shifts in the yield curve. It uses the present value of cash flows, weighted for those cash flows as a percentage of the instrument’s full price.
Fair EffectiveInvestment value duration
Payden and Rygel $ 31,764 6.58 yearsAllegiant (PNC) 54,560 6.58 yearsSSGA 35,722 5.52 yearsLoomis 27,789 4.36 yearsVanguard 20,473 6.80 years
$ 170,308
The Employees System participates in a securities lending program administered by a financial institution. Brokers who borrow the securities provide collateral, usually in the form of cash valued at 102% for domestic securities loaned, resulting in no credit risk for the system. At September 30, 2016, the term to maturity of the securities on loan is matched with the term to maturity of the investment of the cash collateral. These loans can be terminated on demand by either the lender or borrower. The Employees System cannot pledge or sell non-cash collateral unless the borrower defaults. As of September 30, 2016, the Employees System has lending arrangements outstanding with a market value for securities lent of $2,173.

City of St. Louis, Missouri Notes to Basic Financial Statements
June 30, 2017 (dollars in thousands)
74
Concentration of Credit Risk
At September 30, 2016, the Employees System has the following concentrations, defined as investments (other than those issued or guaranteed by the U.S. Government) in any one organization, that represent five percent or more of total investments to the Employees System:
Acadian Asset ManagementEmerging Market Fund $ 46,633
INTECH Investment ManagementU.S. Large Cap Core Equity 48,340
LSV Asset ManagementU.S. Large Cap Value Equity 38,928
PNC Capital AdvisorsU.S. Broad Market Core Fixed Income 54,811
Principal Global InvestorsReal Estate Group Annuity Contract 92,765
Silchester International AdvisorsInternational Value Equity Group Trust 75,518
Evanston Weatherlow OffshoreHedge fund 39,676
Walter Scott & Partners Limited Group TrustInternational Equity Fund 40,568
b. Component Unit—SLDC
State statutes and SLDC investment policies are the same as for the primary government. SLDC funds, in the form of cash on deposit or certificates of deposit, are required to be insured or collateralized by authorized investments held in SLDC’s name. At June 30, 2017, all of SLDC’s cash deposits were covered by federal depository insurance or collateral held by the pledging institution’s trust department or agent in SLDC’s name. At June 30, 2017, the market value of investments approximated the carrying value of $55.

City of St. Louis, Missouri Notes to Basic Financial Statements
June 30, 2017 (dollars in thousands)
75
3. RECEIVABLES, NET
Intergovern- Charges for TotalTaxes mental Services Other Receivables
Governmental activities:General fund $ 103,990 1,695 3,914 2,733 112,332 Redevelopment project fund 24,308 1,107 62 — 25,477 Capital projects fund 4,386 3,359 15 4 7,764 Grants fund — 7,903 — — 7,903 Other governmental funds 30,075 591 1,299 719 32,684 Internal service funds — — 795 — 795
Total governmentalactivities $ 162,759 14,655 6,085 3,456 186,955
Business-type activities:Airport $ — 5,458 5,193 2,351 13,002 Water Division — — 12,171 — 12,171 Parking Division — — 284 — 284
Total business-typeactivities $ — 5,458 17,648 2,351 25,457
All amounts are scheduled for collection during the subsequent fiscal year.
4. ALLOWANCE FOR UNCOLLECTIBLE ACCOUNTS
The allowance for uncollectible accounts, which has been deducted from the related receivable in the government-wide statement of net position and fund financial statements, consists of the following balances:
Governmental activities:Taxes receivable—general fund $ 748 Taxes receivable—redevelopment projects funds 6 Taxes receivable—other governmental funds 91 License and permits receivable—general fund 24 Charges for services receivable—general fund 2,497 Charges for services receivable—other governmental funds 113
Business-type activities:Charges for services receivable—Airport 43 Charges for services receivable—Water Division 3,929
$ 7,451

City of St. Louis, Missouri Notes to Basic Financial Statements
June 30, 2017 (dollars in thousands)
76
5. COMPONENT UNIT—SLDC RECEIVABLES
SLDC notes and loans receivable consist principally of small business loans made to facilitate business growth. The commercial loans are primarily financed utilizing funds provided by the Community Development Administration (CDA) of the City, Economic Development Administration, Environmental Protection Agency, and the State of Missouri. The proceeds from any repayment of these loans are generally payable back to the funding source or re-loaned in accordance with the lending program. Grantor funds received for these lending programs are recorded as a liability and categorized as due to other governmental agencies.
6. RESTRICTED ASSETS
a. Airport
Cash and investments, restricted in accordance with bond provisions, are as follows at June 30, 2017:
Airport bond fund:Debt service account $ 352,063 Debt service reserve account 27,926
Airport renewal and replacement fund 3,500 Passenger facility charge fund 26,506 Airport debt service stabilization fund 38,211 Airport construction fund 986 Drug enforcement agency funds 2,207
$ 451,399
Bond provisions require that revenues derived from the operation of the Airport be deposited into the unrestricted Airport Revenue Fund. From this fund, the following allocations are made (as soon as practicable in each month after the deposit of revenues, but no later than five business days before the end of each month) in the following order of priority, and as applicable:
1) Unrestricted Airport Operation and Maintenance Fund: an amount sufficient to pay the estimated operation and maintenance expenses during the next month.
2) Airport Bond Fund: for credit to the Debt Service Account, if and to the extent required, so that the balance in said account shall equal the accrued aggregate debt service on the bonds, to the last day of the then current calendar month. This account shall be used only for payment of bond principal and interest as the same shall become due.
3) Airport Bond Fund: for credit to the Debt Service Reserve Account: an amount sufficient to maintain a balance in such account equal to the debt service reserve requirement (an amount equal to the greatest amount of principal and interest due in any future fiscal year). This account shall be available for deficiencies in the Debt Service Account on the last business day of any month, and the balance shall be transferred to the Debt Service Account whenever the balance in the Debt Service Account (before the transfer) is not sufficient to pay fully all outstanding bonds.
4) Arbitrage Rebate Fund: an amount necessary to fund the Arbitrage Rebate in order to pay the Rebate Amount when due and payable.

City of St. Louis, Missouri Notes to Basic Financial Statements
June 30, 2017 (dollars in thousands)
77
5) Subordinated Indebtedness: an amount sufficient to pay Subordinated Indebtedness in accordance with the authorizing and implementing documents for such Subordinated Indebtedness.
6) Airport Renewal and Replacement Fund: an amount equal to $57, provided that no deposit shall be required to be made into said fund whenever and as long as uncommitted moneys in said fund are equal to or greater than $3,500 or such larger amount as the City shall determine is necessary for purposes of said fund; and provided further that, if any such monthly allocation to said fund shall be less than the required amounts, the amount of the next succeeding monthly payments shall be increased by the amount of such deficiency. This fund shall be used for paying costs of renewal or replacement of capital items used in connection with the operation of the Airport.
7) A sub-account in the Airport Revenue Fund: an amount determined from time-to-time by the City, such that if deposits were made in amounts equal to such amount in each succeeding month during each Airport fiscal year, the balance in such sub-account shall equal the amounts payable to the City with respect to such Airport fiscal year for the payment of 5% of gross receipts from operations of the Airport. A maximum of 80% of the monthly transfer to this sub-account may be paid to the City during the Airport’s fiscal year. The final installment may only be paid to the City upon delivery of the Airport’s audited financial statements to the Airport Bond Fund Trustee.
8) Airport Debt Service Stabilization Fund and the Airport Development Fund: various amounts for fiscal years 2006 through 2011, achieved a balance of $38,211 at the end of fiscal year 2011. Beginning in fiscal year 2012, the Airport will allocate an amount sufficient to bring the amount on deposit in the Debt Stabilization Fund equal to the Debt Stabilization Fund Requirement (or such lesser amount as is available in the Revenue Fund for such transfer).
9) The remaining balance in the Revenue Fund shall be deposited into the Airport Development Fund. This fund shall be used for extensions and improvements to the Airport, including equipment acquisition.
Bond provisions provide that, in the event the sums on deposit in the Airport Bond Fund—Debt Service and Debt Service Reserve Accounts are insufficient to pay accruing interest, maturing principal or both, Airport Development Fund, and Airport Renewal and Replacement Fund may be drawn upon, to the extent necessary, to provide for the payment of such interest, principal, or both. Any sums so withdrawn from these accounts for said purposes shall be restored thereto in the manner provided for in their original establishment. Bond provisions also provide that the principal proceeds from the sale of Airport revenue bonds shall be held in the Airport Construction Fund from which they shall be disbursed for the purposes contemplated in the related bond provisions and City ordinances.
Passenger Facility Charge Fund and Drug Enforcement Agency Funds are restricted in accordance with program agreements.

City of St. Louis, Missouri Notes to Basic Financial Statements
June 30, 2017 (dollars in thousands)
78
b. Water Division
Cash restricted in accordance with bond provisions and City ordinances at June 30, 2017 is as follows:
Bond funds:Waterworks bond fund $ 276 Water replacement and improvement account 750
Total bond funds 1,026
Customer deposits 2,046 Service line maintenance 35
Total restricted cash $ 3,107
Bond fund provisions require that revenues derived from the operation of the Waterworks System be deposited in the Waterworks Revenue Account. From this account, the following allocations are made on the first business day of each month in the following order of priority:
Series 2013 Water Revenue Refunding Bond Funds
1. To the unrestricted Waterworks Operations and Maintenance Fund, an amount sufficient to pay the estimated operation and maintenance expenses during the next month.
2. To the Waterworks Bond Fund, an amount at least equal to 1/6 of the amount of interest that will come due on the next interest payment date, plus an amount at least equal to 1/6 of the aggregate principal amount of bonds that will come due on the next bond maturity date. This account shall be used only for the payment of bond principal and interest, as the same shall become due.
3. To the Water Replacement and Improvement Fund, an amount equal to $25 per month until the account balance aggregates $750. This account shall be used for making replacements, extensions, and improvements to the Waterworks System, and for the purpose of meeting unforeseen contingencies and emergencies arising in the operation of the Waterworks System of the City.
4. The remaining balance in the Waterworks Revenue Fund is deposited into the unrestricted Water Contingent Fund. This money shall be used for paying the cost of the operation, maintenance, and repair of the Waterworks System; paying the cost of extending, improving, or making replacements to the Waterworks System; preventing default in, anticipating payments into, or increasing the amounts in the other accounts; paying any gross receipts tax now or hereafter levied by the City; paying the principal or the interest on any subordinate or junior lien bonds; paying any redemption premium due on the bonds; or any other lawful purpose for use by the Waterworks System.

City of St. Louis, Missouri Notes to Basic Financial Statements
June 30, 2017 (dollars in thousands)
79
c. Parking Division
Cash and investments restricted in accordance with bond indentures at June 30, 2017 are as follows:
Series 2015B bonds:Debt service $ 775
Total series 2015B bonds 775
Series 2015A bonds:Debt service reserve 515 Debt service 175 Series 2015A project account 17
Total series 2015A bonds 707
Series 2013A bonds:Debt service reserve 84
Total series 2013A bonds 84
Series 2007 bonds:Debt service reserve 443 Debt service 203 Repair and replacement 2,664 Net project revenues 24 Parking trust—Parking Division accounts 1,929
Total series 2007 bonds 5,263
Series 2016 bonds:Debt service 214 Transferred debt service 2,017
Total series 2016 bonds 2,231
Series 2003A and 2003B bonds:Gross revenues 156 Bond 117 Repair and replacement 29 Operating reserve 100 Redemption 22
Total series 2003A and 2003B bonds 424 Total restricted cash and investments $ 9,484
Descriptions of the funds required by the Series 2016 Subordinated Bond Indentures are as follows:
1) Debt service – Maintains funds from the proceeds of the respective bond series to be available to pay principal of and interest on the respective bonds if other funds are not available.

City of St. Louis, Missouri Notes to Basic Financial Statements
June 30, 2017 (dollars in thousands)
80
Descriptions of the funds required by the Series 2015B Subordinated Bond Indentures are as follows:
1) Debt service – Maintains funds from the proceeds of the respective bond series to be available to pay principal of and interest on the respective bonds if other funds are not available.
Descriptions of the funds required by the Series 2015A Subordinated Bond Indentures are as follows:
1) Debt service reserve – Maintains funds from the proceeds of the respective bond series to be available to pay principal of and interest on the respective bonds if other funds are not available.
2) Debt service – Maintains funds from the proceeds of the respective bond series to be available to pay principal of and interest on the respective bonds if other funds are not available.
3) Series 2015A project account – Maintains funds used to fund the debt service account.
Descriptions of the funds required by the Series 2013A Subordinated Bond Indentures are as follows:
1) Debt service account – Maintains funds from the proceeds of the respective bond series to be available to pay principal of and interest on the respective bonds if other funds are not available.
2) Series 2013A project account – Maintains funds used to fund the debt service account.
Descriptions of the funds required by the Series 2007 Bond Indentures are as follows:
1) Debt service reserve – Maintains funds from the proceeds of the respective bond series to be available to pay principal of and interest on the respective bonds if other funds are not available.
2) Debt service – Moneys deposited into this account pay principal and accrued and unpaid interest on the respective bonds.
3) Net project revenues – Maintains funds used to fund the debt service account.
4) Argyle TIF revenues – Argyle TIF revenues are used for the payment of debt service on the Series 2016 Bonds.
5) Parking trust – Parking Division accounts—Maintains funds transferred from the respective bond account to be available to pay principal and interest on the respective refunded bonds if other funds are not available.
6) Repair and replacement – Provides for the repair and upkeep of parking garages.
Descriptions of the funds required by the Series 2003A and 2003B Bond Indenture are as follows:
1) Gross revenues – Maintains revenues resulting from the operations of the Cupples Garage and uses these to pay the operating and debt service costs associated with the Cupples Garage.
2) Bond – Moneys deposited into this account pay principal and accrued and unpaid interest on the Series 2003A and 2003B bonds.
3) Repair and replacement – Provides for the repair and upkeep of the Cupples Garage.

City of St. Louis, Missouri Notes to Basic Financial Statements
June 30, 2017 (dollars in thousands)
81
4) Operating reserve – Maintains operating reserve as required by the Bond Indenture.
5) Redemption – Maintains funds set aside for the future redemption of the Series 2003A and 2003B bonds.
7. CAPITAL ASSETS
a. Primary Government
The following is a summary of changes in capital assets—governmental activities for the year ended June 30, 2017
Balance BalanceJune 30, June 30,
2016 Additions Retirements Transfers 2017
Governmental activities:Capital assets not being depreciated:
Land $ 81,671 — (7) — 81,664 Construction in progress 13,890 24,129 — (4,605) 33,414 Equipment in progress — 204 — — 204 Works of art 3,561 73 (23) — 3,611 Intangibles 2,240 146 (1,132) — 1,254
Total capital assets not beingdepreciated 101,362 24,552 (1,162) (4,605) 120,147
Capital assets being depreciated:Buildings 663,803 5,420 — 1,998 671,221 Improvements other than buildings 100,727 6,969 — — 107,696 Equipment 174,831 9,239 (3,205) 2,409 183,274 Infrastructure 670,144 5,640 — 198 675,982 Intangibles 2,018 5 — — 2,023
Total capital assets beingdepreciated 1,611,523 27,273 (3,205) 4,605 1,640,196
Less accumulated depreciation for:Buildings 262,996 16,362 — — 279,358 Improvements other than buildings 37,030 2,472 — — 39,502 Equipment 117,015 9,061 (3,195) — 122,881 Infrastructure 473,544 30,198 — — 503,742 Intangibles 1,112 244 — — 1,356
Total accumulated depreciation 891,697 58,337 (3,195) — 946,839
Total capital assets beingdepreciated, net 719,826 (31,064) (10) 4,605 693,357
Governmental activities capitalassets, net $ 821,188 (6,512) (1,172) — 813,504
Construction in progress consists primarily of park renovations and street and bridge projects.

City of St. Louis, Missouri Notes to Basic Financial Statements
June 30, 2017 (dollars in thousands)
82
The following is a summary of changes in capital assets – business-type activities for the year ended June 30, 2017. Business-type activities for the City include the Airport, Water Division, and Parking Division.
Balance BalanceJune 30, June 30,
2016 Additions Retirements Transfers 2017
Business-type activities:Combined:
Capital assets not being depreciated:Land $ 775,232 — (2) — 775,230 Construction-in-progress 24,520 33,121 (37) (18,772) 38,832 Intangibles 3,506 — — — 3,506
Total capital assets not beingdepreciated 803,258 33,121 (39) (18,772) 817,568
Capital assets being depreciated:Buildings and structures 768,584 354 (95) 3,388 772,231 Equipment 106,568 3,054 (1,964) 1,151 108,809 Pavings 1,026,809 85 — 13,939 1,040,833 Parking meters and lot equipment 8,229 (68) — — 8,161 Reservoirs 35,172 — — — 35,172 Boiler plant equipment 661 — — — 661 Pumping equipment 11,177 — — 38 11,215 Purification basins and equipment 43,753 — — — 43,753 Water mains, lines, and accessories 138,551 2,500 (105) — 140,946 Motor vehicle equipment 10,671 1,882 (1,003) 256 11,806
Total capital assets beingdepreciated 2,150,175 7,807 (3,167) 18,772 2,173,587
Less accumulated depreciation for:Buildings and structures 445,516 23,721 (36) — 469,201 Equipment 79,023 4,901 (1,912) — 82,012 Pavings 497,660 32,511 — — 530,171 Parking meters and lot equipment 3,099 544 — — 3,643 Reservoirs 13,360 731 — — 14,091 Boiler plant equipment 650 3 — — 653 Pumping equipment 9,649 250 — — 9,899 Purification basins and equipment 19,335 937 — — 20,272 Water mains, lines, and accessories 61,887 1,798 (91) — 63,594 Motor vehicle equipment 5,674 782 (996) — 5,460
Total accumulated depreciation 1,135,853 66,178 (3,035) — 1,198,996
Total capital assets beingdepreciated, net 1,014,322 (58,371) (132) 18,772 974,591
Business-type activities capital assets, net $ 1,817,580 (25,250) (171) — 1,792,159
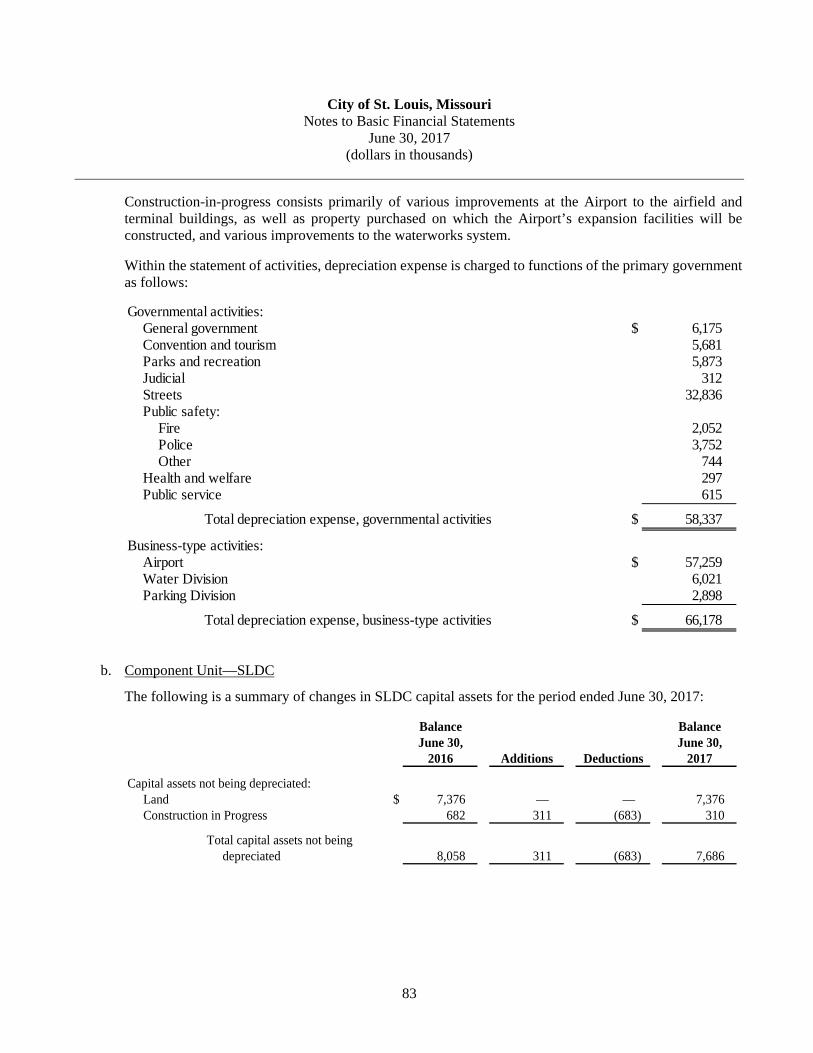
City of St. Louis, Missouri Notes to Basic Financial Statements
June 30, 2017 (dollars in thousands)
83
Construction-in-progress consists primarily of various improvements at the Airport to the airfield and terminal buildings, as well as property purchased on which the Airport’s expansion facilities will be constructed, and various improvements to the waterworks system.
Within the statement of activities, depreciation expense is charged to functions of the primary government as follows:
Governmental activities:General government $ 6,175 Convention and tourism 5,681 Parks and recreation 5,873 Judicial 312 Streets 32,836 Public safety:
Fire 2,052 Police 3,752 Other 744
Health and welfare 297 Public service 615
Total depreciation expense, governmental activities $ 58,337
Business-type activities:Airport $ 57,259 Water Division 6,021 Parking Division 2,898
Total depreciation expense, business-type activities $ 66,178
b. Component Unit—SLDC
The following is a summary of changes in SLDC capital assets for the period ended June 30, 2017:
Balance BalanceJune 30, June 30,
2016 Additions Deductions 2017
Capital assets not being depreciated:Land $ 7,376 — — 7,376 Construction in Progress 682 311 (683) 310
Total capital assets not beingdepreciated 8,058 311 (683) 7,686
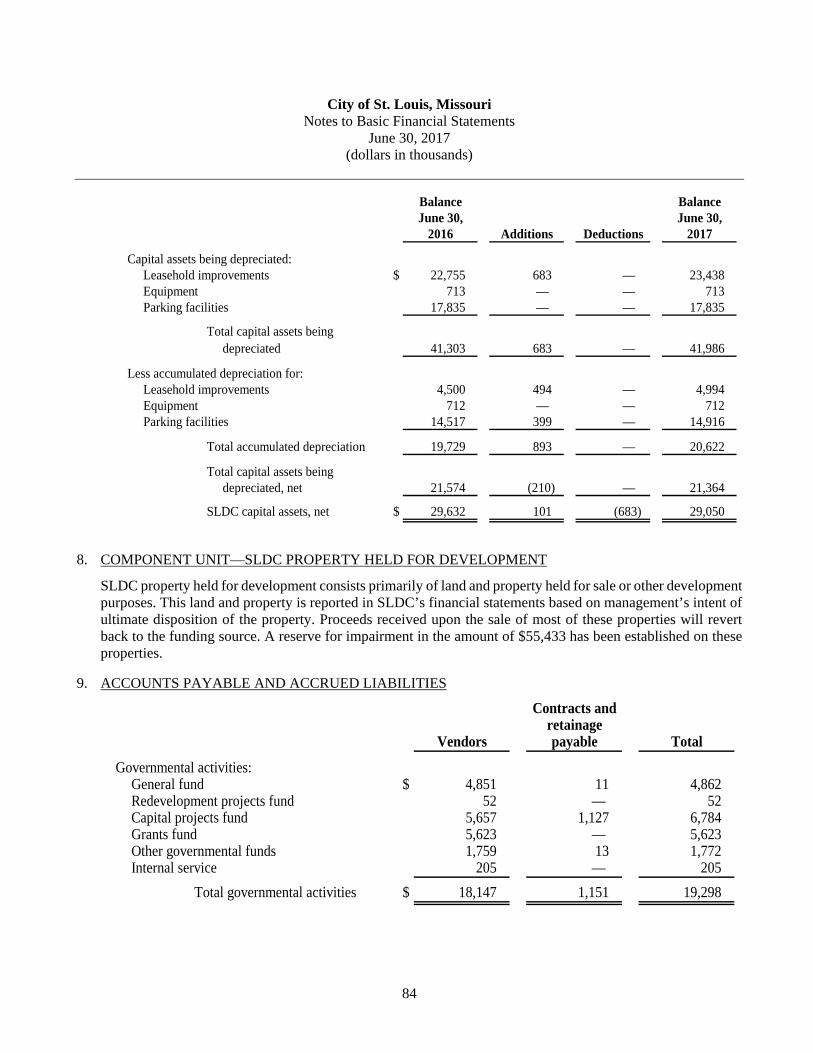
City of St. Louis, Missouri Notes to Basic Financial Statements
June 30, 2017 (dollars in thousands)
84
Balance BalanceJune 30, June 30,
2016 Additions Deductions 2017
Capital assets being depreciated:Leasehold improvements $ 22,755 683 — 23,438 Equipment 713 — — 713 Parking facilities 17,835 — — 17,835
Total capital assets beingdepreciated 41,303 683 — 41,986
Less accumulated depreciation for:Leasehold improvements 4,500 494 — 4,994 Equipment 712 — — 712 Parking facilities 14,517 399 — 14,916
Total accumulated depreciation 19,729 893 — 20,622
Total capital assets beingdepreciated, net 21,574 (210) — 21,364
SLDC capital assets, net $ 29,632 101 (683) 29,050
8. COMPONENT UNIT—SLDC PROPERTY HELD FOR DEVELOPMENT
SLDC property held for development consists primarily of land and property held for sale or other development purposes. This land and property is reported in SLDC’s financial statements based on management’s intent of ultimate disposition of the property. Proceeds received upon the sale of most of these properties will revert back to the funding source. A reserve for impairment in the amount of $55,433 has been established on these properties.
9. ACCOUNTS PAYABLE AND ACCRUED LIABILITIES
Contracts andretainage
Vendors payable Total
Governmental activities:General fund $ 4,851 11 4,862 Redevelopment projects fund 52 — 52 Capital projects fund 5,657 1,127 6,784 Grants fund 5,623 — 5,623 Other governmental funds 1,759 13 1,772 Internal service 205 — 205
Total governmental activities $ 18,147 1,151 19,298

City of St. Louis, Missouri Notes to Basic Financial Statements
June 30, 2017 (dollars in thousands)
85
Contracts andretainage
Vendors payable Total
Business-type activities:Airport $ 10,196 6,929 17,125 Water Division 5,987 — 5,987 Parking Division 323 — 323
Total business-type activities $ 16,506 6,929 23,435
10. RETIREMENT PLANS
The City contributes to the following defined benefit retirement plans: The Firemen’s System, the Firefighters’ Plan and the Police System, which are single –employer plans. The Employees System is a cost-sharing multiple-employer plan.
Effective February 1, 2013, the City passed Ordinances #69149 and #69245 (amended by #69353) and Judge Dierker’s ruling (Board Bill 109) replaced the Firemen’s System with a new retirement system, the Firefighters’ Plan. All other employees are covered by the Employees System, a cost-sharing, multiple-employer, public defined benefit retirement plan. Each system is administered by a separate Board of Trustees, members of which are appointed by City officials and plan participants.
Each system is administered by a separate board of trustees, who are partially appointed by City officials, plan participants, and the governor of the State (Police System only). For financial reporting purposes, these retirement systems are included as fiduciary pension trust funds of the City. Financial information taken directly from the financial statements, that were audited by other auditors and whose reports have been furnished to us, for these funds has been included within the accompanying basic financial statements as of each System’s fiscal year-end, which falls within the City’s current fiscal year-end as follows:
System System fiscal year-end
Firemen’s September 30, 2016Firefighters’ September 30, 2016Police September 30, 2016Employees September 30, 2016
a. Firemen’s Retirement System of St. Louis (Firemen’s System or FRS)
1) System Description (FRS)
The Firemen’s System issues a publicly available financial report that includes financial statements and supplementary information. That information may be obtained by writing to the Firemen’s Retirement System of St. Louis; 1601 S. Broadway; St. Louis, Missouri, 63104.

City of St. Louis, Missouri Notes to Basic Financial Statements
June 30, 2017 (dollars in thousands)
86
The following disclosures are based on the September 30, 2016 FRS financial statements and the October 1, 2016 actuarial valuation. The valuation as of October 1, 2016, reflects the changes attributable to Ordinance #69245 and #69353, and Judge Dierker’s subsequent ruling (Board Bill 109). Key changes to the Firemen’s System is as follows:
• Firemen’s System is frozen as of February 1, 2013. That is, benefits paid from Firemen’s System will be based on the member’s service and salary earned as of February 1, 2013. Participants with benefit service in Firemen’s System are classified as “grandfathered” members.
• Firefighters hired after February 1, 2013, are not members of Firemen’s System.
• Vesting and eligibility service earned after February 1, 2013, in the newly established Firefighters’ Plan will count towards vesting and eligibility service in Firemen’s System.
• Ancillary benefits, for disability or death occurring after February 1, 2013, are assumed to be paid form the newly established Firefighters’ Plan to the extent that benefits do not depend on service earned prior to February 1, 2013.
• Employer contributions to the frozen Firemen’s System will continue to be calculated under the Frozen Initial Liability cost method.
• Member contributions after February 1, 2013, from “grandfathered” participants in Firemen’s System will be paid to the Firefighters’ Plan.
• Grandfathered members with 20 or more years of service as of February 1, 2013, are eligible to retire with unreduced Firefighters’ Plan benefits if retirement commences before age 55.
• Grandfathered members with less than 20 years of service as of February 1, 2013, are eligible to retire with actuarially reduced Firefighters’ Plan benefits if retirement commences before age 55.
As a result of Board Bill 109, the following assumptions were made:
• Since benefits paid under Firemen’s System will no longer depend on future salary increases, future salary increase assumptions have been eliminated in the projection of pay and valuation of benefits. Costs will continue to be spread over the present value of future salary which includes future salary increases.
• It is assumed that grandfathered members with less than 20 years of service as of February 1, 2013 will not retire prior to age 55. The retirement rates were adjusted to reflect accelerated retirement when these members first become eligible at age 55.
• It was assumed the Firemen’s System frozen benefit relating to service and pay as of February 1, 2013, will be used to offset post-retirement survivor benefits paid under Firefighters’ Plan.
• The overall rates of disability were not changed, but the proportion of ordinary accidental disabilities was changed from 20 percent ordinary and 80 percent accidental to 60 percent ordinary and 40 percent accidental.

City of St. Louis, Missouri Notes to Basic Financial Statements
June 30, 2017 (dollars in thousands)
87
Plan liabilities for Firemen’s System after Board Bill 109 are predominantly for retired members and their beneficiaries. That is, the proportion of retired liabilities to total plan liabilities is projected to be over 80 percent within 10 years.
An agreement between the City and Firemen’s System was reached regarding the recognition of City contributions under Board Bill 109. The City made contributions to Firemen’s System from February 1, 2013, to September 30, 2013. The contributions for this period recognize the impact of Board Bill 109, certain excess Firefighters’ Plan City contributions were transferred from Firemen’s System to Firefighters’ Plan in the amount of $6,883 equal to the Firefighters’ Plan City required contribution for the period February 1, 2013, to September 30, 2013 and a portion of the excess Firemen’s System City contribution was credited towards the Firemen’s System Entry Age Normal Agreement (Fireman’s Retirement EAN Note) with the City in the amount of $3,396.
The Firemen’s System, in accordance with Ordinance #62994 of the City, initiated during the Firemen’s System’s fiscal year ended August 31, 1994, the Deferred Retirement Option Plan (DROP). The DROP plan is available to members of the system who have achieved at least 20 years of creditable service and have eligibility for retirement. Those members who elect to participate will continue active employment, will have a service retirement allowance credited monthly into the DROP account of the member, and the member’s contribution will be reduced to 1% from the normal 8%. During participation in the DROP plan, the member will not receive credit for employer contributions or credit for service. A member may participate in the DROP only once for any period up to five years. At retirement, the funds in the member’s DROP account plus interest and accrued sick leave, if elected, is available to the member in a lump sum or in installments.
The Fireman’s System membership consisted of the following as of September 30, 2016:
Retirees and beneficiaries currently receiving benefits 944
Current members:Vested – DROP 62Vested – Non-DROP 184Nonvested 294
Total current members 540
Total membership 1,484
2) Funding Policy (FRS)
Firefighters contributed 8% of their salary to the Firemen’s System, as mandated per State statute and adopted by City ordinance through February 1, 2013 (date frozen). The City is required to contribute the remaining amounts necessary to fund the Firemen’s System.

City of St. Louis, Missouri Notes to Basic Financial Statements
June 30, 2017 (dollars in thousands)
88
3) Net Pension Liability (FRS)
The City’s net pension liability as of June 30, 2017 was measured as of September 30, 2016 and the total pension liability used to calculate the net pension liability was determined by an actuarial valuation as of October 1, 2016.
Net pensionTotal pension Fiduciary net liability (asset)liability (TPL) position (FNP) (NPL)
(a) (b) (a)-(b)
Balances at July 1, 2016 $ 495,019 447,058 47,961Changes for the year:
Interest 34,916 — 34,916Refunds of member contributions (1,278) (1,278) —Benefit payments (32,155) (32,155) —Difference between expected and
and actual experience (6,984) — (6,984)Assumption changes — — —Employer contributions — 2,715 (2,715)Net investment income — 38,228 (38,228)Transfer in due to settlement
agreement — 167 (167)Administrative expenses — (1,095) 1,095
Net changes (5,501) 6,582 (12,083)
Balances at June 30, 2017 $ 489,518 453,640 35,878
The Firemen’s System net pension liability is recorded within the accompanying financial statements as follows:
Governmental Activities $ 32,290 Airport 3,588
$ 35,878

City of St. Louis, Missouri Notes to Basic Financial Statements
June 30, 2017 (dollars in thousands)
89
Significant actuarial assumptions used in the valuation of the Firemen’s System are as follows:
Date of actuarial valuation October 1, 2016Actuarial cost method
GASB 67 reporting Entry Age NormalFunding Entry Age - frozen initial liability
Amortization method/period 30-year closed period from establishmentRemaining amortization period VariousAsset valuation method 3-year smoothed average of market valueInflation 2.75%Investment rate of return 7.3%, net of investment and administrative expensesProjected salary increases Benefits frozen as of February 1, 2013; therefore no
salary increases have been assumedMortality RP-2014 mortality table, sex distinct
The long-term expected rate of return on the Firemen’s System investments was determined using a building-block method in which expected future real rates of return (expected returns, net of pension plan investment expense and inflation) are developed for each major asset class. These real rates of return are combined to produce the long-term expected rate of return by weighting the expected future real rates of return by the target asset allocation percentage and by adding expected inflation. For each major asset class that is included in the pension plan’s target asset allocation as of October 1, 2016, these best estimates are summarized in the following table:
Long-termTarget expected real
Asset class allocation rate of return
Fixed income 25 % (1.30)%Domestic equity 26 4.30International equity 24 4.70Private equity — 9.40Real estate 15 4.80Hedge funds 10 2.20
Total 100 %

City of St. Louis, Missouri Notes to Basic Financial Statements
June 30, 2017 (dollars in thousands)
90
The discount rate used to measure the total pension liability (asset) was 7.30%. The projection of cash flows used to determine the discount rate assumed that the City would make the required contributions as defined by statute. Based on these assumptions, the pension plan’s fiduciary net position was projected to be available to make all projected future benefit payments of current active and inactive employees and their beneficiaries. Therefore, the long-term expected rate of return on pension plan investments was applied to all periods of projected benefit payments to determine the total pension liability (asset). For the October 1, 2016 actuarial valuation, a 7.30% discount rate was used. The sensitivity of the net pension liability to changes in the discount rate for the year ended June 30, 2017 for the City is as follows:
Discount Net pensionrate liability (asset)
1% decrease 6.30 % $ 86,387 Current rate 7.30 35,878 1% increase 8.30 (6,434)
Pension Plan Fiduciary Net Position – Detailed information about the pension plan’s fiduciary net position is available in the separately issued Firemen’s System financial report.
4) Pension Expense (FRS)
For the fiscal year ended June 30, 2017, the City recognized pension expense of $19,982. Annual pension expense consists of service cost, interest and administrative expenses on the pension liability less employee contributions and projected earnings on pension plan investments. The difference between actual and expected earnings is recorded as a deferred outflow/inflow of resources recognized in pension expense over a five year period. The pension expense for the City’s fiscal year ended June 30, 2017 is summarized as follows:
Service cost $ —Interest 34,916Administrative expenses 1,095Other changes – transfer due to settlement agreement (167)Projected earnings on pension plan investments (31,480)Recognition of outflow due to assumption changes 11,290Recognition of outflow due to investment experience 6,169Recognition of outflow due to liability experience (1,841)
Pension expense for year ended June 30, 2017 $ 19,982

City of St. Louis, Missouri Notes to Basic Financial Statements
June 30, 2017 (dollars in thousands)
91
5) Deferred Outflows/Inflows of Resources Related to Pension (FRS)
In accordance with GASB Statements No. 67 and 68, the City recognizes differences between actual and expected experience with regard to economic or demographic factors, changes of assumptions about future economic or demographic factors, the difference between actual and expected investment returns, changes in proportion, and contributions subsequent to the measurement date as deferred outflows/inflows of resources. At June 30, 2017, the City reported deferred outflows of resources and deferred inflows of resources related to pensions from the following sources as follows:
Deferred Deferredoutflows of inflows ofresources resources
Net difference between projected and actual earnings on pension plan investments $ 19,372 — Difference between expected and actual liability experience 7 5,137 Change in assumption 21,335 —
Total $ 40,714 5,137
The City recognizes differences between actual and expected investment performance included in deferred outflows/inflows of resources on a straight-line basis over five years. Differences between expected and actual experience on actuarial assumptions are amortized over the average expected remaining service life of Firemen’s System employees. The following table summarizes the future recognition of these items:
Year ended June 30 Recognition
2018 $ 15,618 2019 14,369 2020 6,939 2021 (1,349)
$ 35,577
b. Firefighters’ Retirement Plan (Firefighters’ Plan or FRP)
1) System Description (FRP)
The Firefighters’ Plan administers a single employer defined benefit pension plan providing pension benefits to the City of St. Louis firemen.
The Firefighters’ Plan issues a publicly available financial report that includes financial statements and supplementary information. That report may be obtained by writing to the Firefighters’ Retirement Plan of the City of St. Louis; 1114 Market Street, Suite 900; St. Louis, Missouri 63101.

City of St. Louis, Missouri Notes to Basic Financial Statements
June 30, 2017 (dollars in thousands)
92
Effective February 1, 2013, benefit accruals under the Firemen’s System were frozen. The Firefighters’ Plan was established as of that date to provide retirement, disability and death benefits for service rendered after the effective date. Credited service accrued under the Firemen’s System counts toward benefit accruals under the Firefighters’ Plan, but benefits attributable to such services are offset by the benefits payable by the Firemen’s System. Under the Firefighters’ Plan, the plan provisions for members who were active as of February 1, 2013 (Grandfathered Participants) are substantially the same as the plan provisions for the Firemen’s System.
The Firefighters’ Plan provides retirement benefits as well as death and disability benefits. Grandfathered members are those who were employed prior to February 1, 2013. Members can voluntarily retire after a minimum of 20 years of service and upon reaching the normal retirement age of 55. A member who has 20 years of service but has not yet reached the age of 55 may elect an early retirement with the normal retirement benefit deferred until reaching the age of 55. In lieu of a deferred retirement benefit, the member may elect to receive his/her retirement benefit beginning on his/her early retirement date or on the first day of any month thereafter prior to reaching age 55 with such benefit actuarially reduced from age 55. A member hired on or after the effective date of February 1, 2013 who terminates employment after completing 10 years of service, but before completing 20 years of service, is eligible for a full unreduced pension beginning at age 62. Such a member may elect to receive a refund of his/her contributions, plus interest, in lieu of a pension benefit.
The monthly allowance is determined by the average final monthly compensation over the last 5 years of service. For grandfathered members, the average is over the last 2 years of service. The monthly allowance consists of 40% of the applicable final average monthly compensation at 20 years of service, plus 2% of such final average compensation for each of the next five years of service, plus 5% of final average compensation for each additional year of service after 25 years with a maximum pension of 75%. Unused accrued sick pay accumulated before September 20, 2010 may increase the maximum pension beyond this limitation.
A grandfathered member with 20 or more years of credited service may elect to enter the DROP program and defer retirement for up to five years while continuing active employment. The benefit payments the participant would have received during that period are deposited into the DROP account and earn interest at a rate equal to the percentage rate of return of the Trust Fund’s investment portfolio for that year. After five years or termination from the DROP plan, the participant may retire or return to regular active service. Upon termination of employment, the participant can choose to receive the DROP account with interest earned. If the participant dies prior to termination of employment, the DROP account is paid as a lump sum to the participant’s beneficiary or estate. Active service while in the DROP program is not included in the credited service used to calculate the participant’s final benefit amount.
Those members who elect to participate will continue active employment, will have a service retirement allowance credited monthly in the DROP account of the member, and the member's contributions will be reduced to 1% from the normal contribution percentage. During participation in the DROP, the member will not receive credit for City contributions or credit for service. A member may participate in the DROP only once for any period up to five years. At retirement the funds in the member's DROP account plus: 1) interest and 2) accrued sick leave if elected is available to the member in a lump sum or in installments.

City of St. Louis, Missouri Notes to Basic Financial Statements
June 30, 2017 (dollars in thousands)
93
The Firefighters’ Plan membership consisted of the following as of September 30, 2016:
Retirees and beneficiaries currently receiving benefits 47
Current active members:Vested – Non-DROP 407Vested – participating DROP 62Nonvested 158
Total current active members 627
Total membership 674
2) Funding Policy (FRP)
A grandfathered member with at least 20 years of service as of February 1, 2013, contribute 8% of their salary, after-tax. All other members contribute 9% of their salary, pre-tax. The City is required to contribute the remaining amounts necessary to fund Firefighters’ Plan. All members who terminate employment before becoming eligible to receive a retirement benefit will receive a refund of all contributions plus interest. Members hired after February 1, 2013 who terminate employment before reaching age 55 and elect a refund of contributions in lieu of a pension benefit will also receive a refund of their contributions plus interest, as will grandfathered members who terminate employment before completing 20 years of service. Contributions to the Firefighters’ Plan made on or after the inception of the Firefighters’ Plan are not refundable to a member who receives a service retirement benefit, ordinary disability benefit, or a service connected disability benefit; except that contributions to the Firefighters’ Plan by a grandfathered member with at least 20 years of service as of inception who receives a service retirement benefit are refundable without interest.
An agreement between the City and the Firemen’s System was reached regarding the recognition of City contributions under Board Bill 109. The City made contributions to the Firemen’s System from February 1, 2013, to September 30, 2013. The contributions for this period recognize the impact of Board Bill 109, certain excess Firemen’s System City contributions were transferred from the Firemen’s System to the Firefighters’ Plan in the amount of $6,883 equal to the Firefighters’ Plan City required contribution for the period February 1, 2013, to September 30, 2013 and a portion of the excess Firemen’s System City contribution was credited towards the Firemen’s System Entry Age Normal Agreement (Fireman’s Retirement EAN Note) with the City in the amount of $3,396.

City of St. Louis, Missouri Notes to Basic Financial Statements
June 30, 2017 (dollars in thousands)
94
3) Net Pension Liability (FRP)
The City’s net pension liability for Firefighters’ Plan as of June 30, 2017 was measured as of September 30, 2016 and the total pension liability used to calculate the net pension liability was determined by an actuarial valuation as of October 1, 2016.
Total pension Fiduciary net Net pensionliability (TPL) position (FNP) liability (NPL)
(a) (b) (a)-(b)
Balances at July 1, 2016 $ 88,780 29,776 59,004Changes for the year:
Service cost 6,033 — 6,033Interest 7,215 — 7,215Difference between expected
and actual experience 337 — 337Change in benefits — — —Change in assumptions — — —Benefit payments (381) (381) —Contributions – employer — 9,148 (9,148)Contributions – transfer from FRS — — —Contributions – employee — 2,919 (2,919)Net investment income — 2,892 (2,892)Administrative expenses — (405) 405
Net changes 13,204 14,173 (969)
Balances at June 30, 2017 $ 101,984 43,949 58,035
The Firefighters’ Plan net pension liability is recorded within the accompanying financial statements as follows:
Governmental Activities $ 52,232 Airport 5,803
$ 58,035

City of St. Louis, Missouri Notes to Basic Financial Statements
June 30, 2017 (dollars in thousands)
95
The following were some of the significant actuarial assumptions used in the valuation of the Firefighters’ Plan:
Date of actuarial valuation October 1, 2016Actuarial cost method 30-year closed period from establishmentGASB 67 reporting Entry Age NormalFunding Entry Age NormalRemaining amortization period Started February 1, 2013Asset valuation method 5 - year smoothed marketInflation 3.00%Investment rate of return 7.625%, net of investment and administrative expensesProjected salary increases Varies based on employee's years of serviceMortality RP-2000 mortality table, sex distinct, with rates projected to 2015
The long-term expected rate of return on the Firefighters’ Plan investments was determined using a building-block method in which expected future real rates of return (expected returns, net of pension plan investment expense and inflation) are developed for each major asset class. These real rates of return are combined to produce the long-term expected rate of return by weighting the expected future real rates of return by the target asset allocation percentage and by adding expected inflation. For each major asset class that is included in the pension plan’s target asset allocation as of September 30, 2016, these best estimates are summarized in the following table:
Long-termTarget expected real
Asset class allocation rate of return
Domestic large cap equity 30% 6.40%Domestic mid cap equity 20 8.90International equity 25 4.40Real estate 5 7.00Fixed income 20 2.40
Total 100%
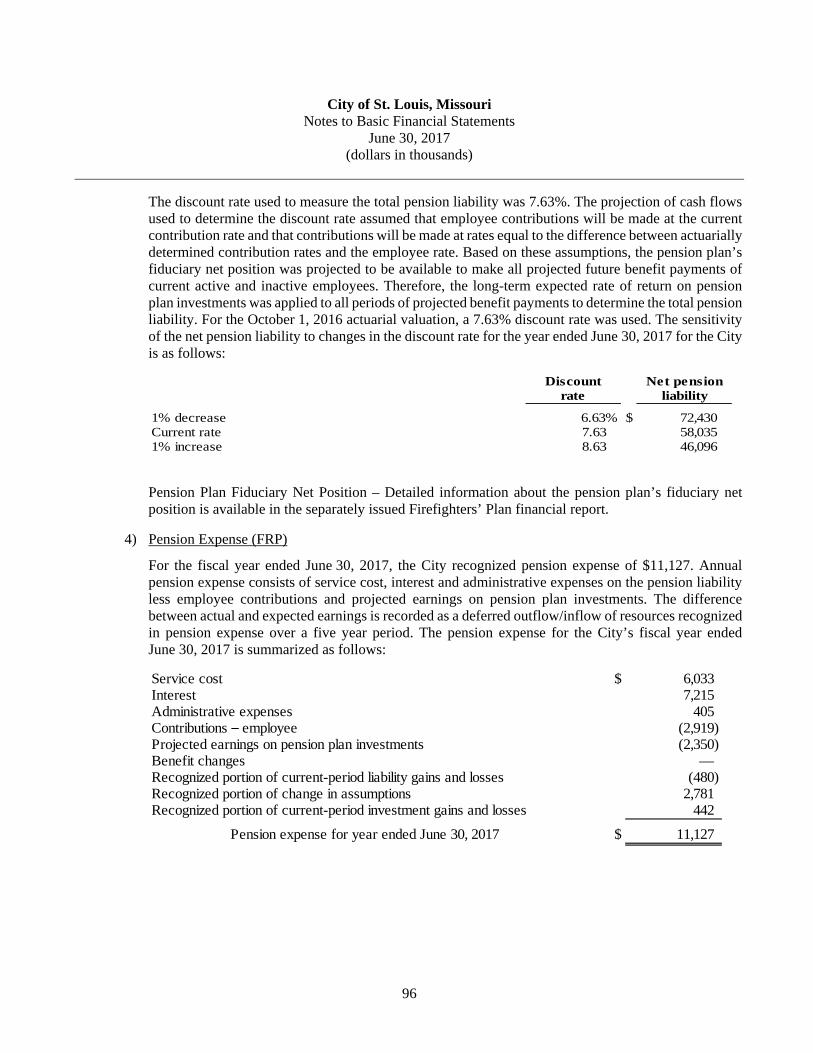
City of St. Louis, Missouri Notes to Basic Financial Statements
June 30, 2017 (dollars in thousands)
96
The discount rate used to measure the total pension liability was 7.63%. The projection of cash flows used to determine the discount rate assumed that employee contributions will be made at the current contribution rate and that contributions will be made at rates equal to the difference between actuarially determined contribution rates and the employee rate. Based on these assumptions, the pension plan’s fiduciary net position was projected to be available to make all projected future benefit payments of current active and inactive employees. Therefore, the long-term expected rate of return on pension plan investments was applied to all periods of projected benefit payments to determine the total pension liability. For the October 1, 2016 actuarial valuation, a 7.63% discount rate was used. The sensitivity of the net pension liability to changes in the discount rate for the year ended June 30, 2017 for the City is as follows:
Discount Net pensionrate liability
1% decrease 6.63% $ 72,430 Current rate 7.63 58,035 1% increase 8.63 46,096
Pension Plan Fiduciary Net Position – Detailed information about the pension plan’s fiduciary net position is available in the separately issued Firefighters’ Plan financial report.
4) Pension Expense (FRP)
For the fiscal year ended June 30, 2017, the City recognized pension expense of $11,127. Annual pension expense consists of service cost, interest and administrative expenses on the pension liability less employee contributions and projected earnings on pension plan investments. The difference between actual and expected earnings is recorded as a deferred outflow/inflow of resources recognized in pension expense over a five year period. The pension expense for the City’s fiscal year ended June 30, 2017 is summarized as follows:
Service cost $ 6,033Interest 7,215Administrative expenses 405Contributions – employee (2,919)Projected earnings on pension plan investments (2,350)Benefit changes —Recognized portion of current-period liability gains and losses (480)Recognized portion of change in assumptions 2,781Recognized portion of current-period investment gains and losses 442
Pension expense for year ended June 30, 2017 $ 11,127

City of St. Louis, Missouri Notes to Basic Financial Statements
June 30, 2017 (dollars in thousands)
97
5) Deferred Outflows/Inflows of Resources Related to Pension (FRP)
In accordance with GASB Statements No. 67 and 68, the City recognizes differences between actual and expected experience with regard to economic or demographic factors, changes of assumptions about future economic or demographic factors, the difference between actual and expected investment returns, changes in proportion, and contributions subsequent to the measurement date as deferred outflows/inflows of resources. At June 30, 2017, the City reported deferred outflows of resources and deferred inflows of resources related to pensions from the following sources as follows:
Deferred Deferredoutflows of inflows ofresources resources
Net difference between projected and actual earnings on pension plan investments $ 1,156 —
Differences between expected and actualexperience 1,178 3,350
Change in assumptions 16,683 —
Total $ 19,017 3,350
The City recognizes differences between actual and expected investment performance included in deferred outflows/inflows of resources on a straight-line basis over five years. Differences between expected and actual experience on actuarial assumptions are amortized over the average expected remaining service life of the Firefighters’ Plan employees. The following table summarizes the future recognition of these items:
Year ended June 30 Recognition
2018 $ 2,742 2019 2,742 2020 2,680 2021 2,191 2022 2,300 Thereafter 3,012
$ 15,667
c. Police Retirement System of St. Louis (Police System or PRS)
1) System Description (PRS)
All persons who become police officers and all police officers that enter or reenter SLPD after October 1, 1957 become members of the Police System and are thereby eligible to participate from their date of hire. The Police System issues a publicly available financial report that includes financial statements and supplementary information. That information may be obtained by writing to the Police Retirement System of St. Louis; 2020 Market Street, St. Louis, Missouri 63103.

City of St. Louis, Missouri Notes to Basic Financial Statements
June 30, 2017 (dollars in thousands)
98
The Police System provides retirement benefits as well as death and disability benefits. Members can voluntarily retire after a minimum of 20 years of service or attaining age 55. The monthly allowance consists of 40% of the two-year average final compensation for the first 20 years of services, plus 2% of such final average compensation for each of the next five years of service, plus 4% of average final compensation for each additional year of service after 25 years up to a maximum of 30 years. The monthly allowance of members who have in excess of 30 years of service is increased by 5%. The maximum pension is 75% of average final compensation. Such benefits are established by the State statute.
The Police System implemented a DROP feature during the Police System’s fiscal year ended September 30, 1996. The DROP option is available to members of the Police System who have at least 20 years of creditable service and have achieved eligibility for retirement. Those members who elect to participate will continue active employment, will have a service retirement allowance credited monthly in the DROP account, and will no longer make contributions to the Police System. During participation in the DROP, the member will not receive credit for service and the member shall not share in any benefit improvement that is enacted or becomes effective while such member is participating in the DROP. A member may participate in the DROP only once for any period up to five years, at which point the member may reenter the Police System. At retirement, the funds in the member’s DROP account plus interest are available to the member in a lump sum or in installments.
The Police System membership consisted of the following as of September 30, 2016:
Retirees and beneficiaries currently receiving benefits 1,904
Current active members:Vested – in DROP 147Vested – not in DROP 214
Total vested 361
Nonvested 908
Total current active members 1,269
Total members 3,173
2) Funding Policy (PRS)
Police officers are required to contribute 7% of their compensation to the Police System per State statute. The City is required to contribute the remaining amounts necessary to fund the Police System, determined in accordance with City ordinances. Upon leaving employment due to service retirement, death, or disability due to an accident in the actual performance of duty, the member’s contributions are refunded. Members whose employment terminates prior to retirement are entitled to a lump-sum distribution of their contribution plus interest thereon.

City of St. Louis, Missouri Notes to Basic Financial Statements
June 30, 2017 (dollars in thousands)
99
3) Net Pension Liability (PRS)
The City’s net pension liability for Police System as of June 30, 2017 was measured as of September 30, 2016 and the total pension liability used to calculate the net pension liability was determined by an actuarial valuation as of October 1, 2015.
Total pension Fiduciary net Net pensionliability (TPL) position (FNP) liability (NPL)
(a) (b) (a)-(b)
Balances at July 1, 2016 $ 944,138 684,895 259,243Changes for the year:
Service cost 12,618 — 12,618Interest 67,036 — 67,036Difference between expected
and actual experience (3,684) — (3,684)Change in assumption 131,846 — 131,846Contributions – employer — 30,779 (30,779)Contributions – employee — 4,377 (4,377)Net investment income — 52,927 (52,927)Benefit payments (62,637) (62,637) —Administrative expenses — (1,103) 1,103
Net changes 145,179 24,343 120,836
Balances at June 30, 2017 $ 1,089,317 709,238 380,079
The Police System net pension liability is recorded within governmental activities with the accompanying financial statements.
Significant actuarial assumptions used in the valuation of the Police System are as follows:
Date of actuarial valuation October 1, 2015Actuarial cost methodGASB 67 reporting Entry Age NormalFunding Aggregate, reduced by employee contributionsAmortization method/period None - aggregate is funded over the future
working lifetime of current participantsAsset valuation method 5-year smoothed average of market valueInflation 2.5%Investment rate of return 7.50%, net of 0.15% administrative expensesProjected salary increases 3.0% – 6.5%, varying by ageMortality (Ordinary) RP-2000 Blue Collar Combined projected to 2018Mortality (Accidental) 0.03% per year for all ages in addition to ordinary
mortalityMortality (Disabled) RP-2000 Disabled Retiree Mortality projected to 2018

City of St. Louis, Missouri Notes to Basic Financial Statements
June 30, 2017 (dollars in thousands)
100
The long-term expected rate of return on the Police System investments was determined using a building-block method in which expected future real rates of return (expected returns, net of pension plan investment expense and inflation) are developed for each major asset class. These real rates of return are combined to produce the long-term expected rate of return by weighting the expected future real rates of return by the target asset allocation percentage and by adding expected inflation. For each major asset class that is included in the pension plan’s target asset allocation as of September 30, 2016, these best estimates are summarized in the following table:
Long-termTarget expected real
Asset class allocation rate of return
Fixed income 19% (0.35)%Domestic equity 30 4.45Foreign equity 25 4.25Non-directional hedge fund of funds 5 1.60Real estate (REIT) 8 4.15Private equity (partnerships) 8 7.90Other/Money market 5 —
Total 100%
The discount rate used to calculate the present value of future benefit payments for reporting purposes is based upon the projected plan net position (PNP) using actuarial assumptions about contributions, benefit payments, and the long-term rate of return. If the projected PNP is not sufficient to cover projected benefit payments, a blended discount rate is required using both the weighted average of the long-term rate of return and the high grade bond muni-bond rate for periods after the PNP is exhausted. The plan currently uses the long-term discount rate of 7.65% and expects assets will be sufficient to cover PNP until 2054. The muni-bond rate used in the valuation was 3.06% and is based on the Bond Buyers General Obligation 20 Year High Grade Rate Municipal Bond Index (AA/Aa or higher). Since the PNP was projected to be insufficient to make all projected benefit payments of current plan members, a blended discount rate of 6.19% was used to calculate the plan’s present value of future benefit payments. The sensitivity of the net pension liability to changes in the discount rate for the year ended June 30, 2017 for the City is as follows:
Discount Net pensionrate liability
1% decrease 5.19% $ 511,385Current rate 6.19 380,0791% increase 7.19 272,500
Pension Plan Fiduciary Net Position – Detailed information about the pension plan’s fiduciary net position is available in the separately issued Police System financial report.

City of St. Louis, Missouri Notes to Basic Financial Statements
June 30, 2017 (dollars in thousands)
101
4) Pension Expense (PRS)
For the fiscal year ended June 30, 2017, the City recognized pension expense of $89,465. Annual pension expense consists of service cost, interest and administrative expenses on the pension liability less employee contributions and projected earnings on pension plan investments. The difference between actual and expected earnings is recorded as a deferred outflow/inflow of resources recognized in pension expense over a five year period. The pension expense for the fiscal year ended June 30, 2017 is summarized as follows:
Service cost $ 12,618 Interest 67,036 Administrative expenses 1,103 Contributions – employee (4,377) Projected earnings on pension plan investments (50,314) Recognized portion of change in assumptions 51,582 Recognized portion of current-period liability gains and losses (1,909) Recognized portion of current-period difference between projected
and actual earnings on pension plan investments 13,726
Pension expense for year ended June 30, 2017 $ 89,465
5) Deferred Outflows/Inflows of Resources Related to Pension (PRS)
In accordance with GASB Statements No. 67 and 68, the City recognizes differences between actual and expected experience with regard to economic or demographic factors, changes of assumptions about future economic or demographic factors, the difference between actual and expected investment returns, changes in proportion, and contributions subsequent to the measurement date as deferred outflows/inflows of resources. At June 30, 2017, the City reported deferred outflows of resources and deferred inflows of resources related to pensions from the following sources as follows:
Deferred Deferredoutflows of inflows ofresources resources
Difference between expected and actualliability experience $ — 3,137
Net difference between projected and actual earnings on pension plan investments 39,311 —
Change in assumptions 93,314 —
Total $ 132,625 3,137

City of St. Louis, Missouri Notes to Basic Financial Statements
June 30, 2017 (dollars in thousands)
102
The City recognizes differences between actual and expected investment performance included in deferred outflows/inflows of resources on a straight-line basis over five years. Differences between expected and actual experience on actuarial assumptions are amortized over the average expected remaining service life of the Police System’s employees. The following table summarizes the future recognition of these items:
Year ended June 30 Recognition
2018 $ 61,1822019 56,4472020 12,3822021 (523)
$ 129,488
d. Employees Retirement System of the City of St. Louis (Employees System or ERS)
1) System Description (ERS)
All non-uniformed employees of the City and certain other public entities funded by or providing services to residents of the City become members of the Employees Retirement System upon employment with the exception of employees hired after attaining age 60.
The Employees System issues a publicly available financial report that includes financial statements and supplementary information. That report may be obtained by writing to the Employees Retirement System of the City of St. Louis; 1114 Market Street, Suite 900; St. Louis, Missouri 63101.
The Employees System provides for defined benefit payments for retirement, death, or disability to eligible employees or their beneficiaries based upon creditable service, final average compensation, and a benefit compensation base. Benefits vest with employees covered by the Employees System after the employee has attained five years of creditable service. Employees retire with full retirement benefits after the age of 65 or if the employee’s age and creditable service combined equal or exceed 85. Employees may retire and receive a reduced benefit after age 60 with five years of creditable service; age 55 with at least 20 years of creditable service; or at any age with 30 years of creditable service. The monthly pension benefits of all retirees or their beneficiaries are adjusted accordingly to the changes in the Consumer Price Index of the U.S. Department of Labor. Increases are limited each year, with total increases to retirees or their beneficiaries limited to 25%.

City of St. Louis, Missouri Notes to Basic Financial Statements
June 30, 2017 (dollars in thousands)
103
On June 8, 2000, the Mayor of the City approved an ordinance passed by the Board of Aldermen, authorizing a Deferred Retirement Option Plan (DROP), which became effective January 1, 2001. This plan states that when members reach retirement age, they are allowed to work for five additional years and defer receipt of their retirement allowance. The calculation of average salary for retirement benefits will not include the additional years of service after normal retirement age. The amount that would have been received as retirement benefit is put in a special DROP account monthly. The DROP account will not be adjusted for cost of living increases as the normal retirement benefits are. The DROP account earns interest at the actuarial valuation rate of return and at the 10 year U.S. Treasury Bond yield as of September 30, for DROP participants enrolling February 1, 2003 and thereafter. After the member completely terminates employment, the member can withdraw amounts from the DROP account in a lump sum or according to a deferred retirement payment plan.
2) Funding Policy (ERS)
The Employees System’s funding policy provides for periodic employer contributions at actuarially determined rates that, expressed as percentages of annual covered payroll, are sufficient to accumulate assets to pay benefits due. If contributions are necessary, level percentage of payroll employer contribution rates are determined using the projected unit credit actuarial cost method. Employer contribution rates are established annually by the Board of Trustees of the Employees System based on an actuarial study. Deductions from plan assets are financed from plan additions. The Board of Trustees established the required employer contributions rate based on active member payroll of 12.51% effective July 1, 2016 and 13.93% of active member payroll effective July 2015.
Employees who became members of the Employees System prior to October 14, 1977, and continued to make contributions, may make voluntary contributions to the Employees System equal to 3% of their compensation until the employee’s compensation equals the maximum annual taxable earnings under the Federal Social Security Act. Thereafter, employees may contribute 6% of their compensation for the remainder of the calendar year.
The City’s contributions to Employees System for the year ended June 30, 2017 were $25,823.
3) Net Pension Liability (ERS)
The City reported a liability of $174,115 for its proportionate share of the net pension liability as of June 30, 2017. The Employees Systems net pension liability is recorded within the accompanying financial statements as follows:
Governmental Activities $ 139,723 Airport 18,686 Water Division 12,536 Parking Division 3,170
$ 174,115

City of St. Louis, Missouri Notes to Basic Financial Statements
June 30, 2017 (dollars in thousands)
104
The net pension liability was measured as of September 30, 2016 and the total pension liability used to calculate the net pension liability was determined by an actuarial valuation as of October 1, 2016. The City’s proportion of the net pension liability was based on the City’s share of contributions to the Employees System relative to the contributions of all Employees System participating employers. At September 30, 2016, the City’s collective proportion was 83.2%, which was a decrease of 0.3% from its proportion measured as of September 30, 2015 of 83.5%.
Significant actuarial assumptions used in the valuation of the Employees System are as follows:
Date of actuarial valuation October 1, 2016Actuarial cost method Entry age normalAmortization method Fixed 20 year period as of October 2016 as a
level percentage of payrollRemaining amortization period 20 yearsAsset valuation method 5-year smoothed marketInflation 2.50%Discount rate 7.50%Projected salary increases Varies by service, ranging from 3.00% to 4.25%Mortality Healthy RP-2000 Healthy Mortality 3-year set-forward with
generational projections using Scale AAMortality Disabled RP-2000 Disabled Mortality 3-year set-forward with
generational projections using Scale AA
The long-term expected rate of return on the Employees System investments was determined using a building-block method in which expected future real rates of return (expected returns, net of pension plan investment expense and inflation) are developed for each major asset class. These real rates of return are combined to produce the long-term expected rate of return by weighting the expected future real rates of return by the target asset allocation percentage and by adding expected inflation.
For each major asset class that is included in the pension plan’s target asset allocation as of September 30, 2016, these best estimates are summarized in the following table:
Long-termTarget expected real
Asset class allocation rate of return
Private equity 5.00% 8.25%Real estate 10.00 5.00Hedge funds 10.00 4.50Master limited partnerships 7.50 6.00International equity 21.50 6.84Domestic equity 21.00 5.05Fixed income 25.00 2.25
Total 100.00%

City of St. Louis, Missouri Notes to Basic Financial Statements
June 30, 2017 (dollars in thousands)
105
The discount rate used to measure the total pension liability was 7.50%. The projection of cash flows used to determine the discount rate assumed that employee contributions will be made at the current contribution rate and that contributions will be made at rates equal to the difference between actuarially determined contribution rates and the employee rate. Based on these assumptions, the pension plan’s fiduciary net position was projected to be available to make all projected future benefit payments of current active and inactive employees. Therefore, the long-term expected rate of return on pension plan investments was applied to all periods of projected benefit payments to determine the total pension liability. For the October 1, 2016 actuarial valuation, a 7.50% discount rate was used. The sensitivity of the net pension liability to changes in the discount rate for the year ended June 30, 2017 for the City is as follows:
Discount Net pensionrate liability
1% decrease 6.50% $ 256,156Current rate 7.50 174,1151% increase 8.50 103,992
Pension Plan Fiduciary Net Position – Detailed information about the pension plan’s fiduciary net position is available in the separately issued Employees System financial report.
4) Pension Expense (ERS)
For the fiscal year ended June 30, 2017, the City recognized pension expense of $32,374. Annual pension expense consists of service cost, interest and administrative expenses on the pension liability less employee contributions and projected earnings on pension plan investments. The difference between actual and expected earnings is recorded as a deferred outflow/inflow of resources recognized in pension expense over a five year period.

City of St. Louis, Missouri Notes to Basic Financial Statements
June 30, 2017 (dollars in thousands)
106
5) Deferred Outflows/Inflows of Resources Related to Pension (ERS)
In accordance with GASB Statements No. 67 and 68, the City recognizes differences between actual and expected experience with regard to economic or demographic factors, changes of assumptions about future economic or demographic factors, the difference between actual and expected investment returns, changes in proportion, and contributions subsequent to the measurement date as deferred outflows/inflows of resources. At June 30, 2017, the City reported deferred outflows of resources and deferred inflows of resources related to pensions from the following sources as follows:
Deferred Deferredoutflows of inflows ofresources resources
Differences between expected and actual experience $ — 3,510 Net difference between projected and actual
earnings on pension plan investments 32,707 — Changes in proportion 394 1,280 Changes in assumptions — 1,416 Contributions subsequent to the measurement date 19,075 —
Total $ 52,176 6,206
The $19,075 reported as deferred outflows of resources related to pensions resulting from the City’s contributions subsequent to the measurement date will be recognized as a reduction of the net pension liability in the year ending June 30, 2018.
The City recognizes differences between actual and expected investment performance included in deferred outflows/inflows of resources on a straight-line basis over five years. Differences between expected and actual experience on actuarial assumptions are amortized over the average expected remaining service life of the Employee System’s employees. The following table summarizes the future recognition of these items:
Year ended June 30 Recognition
2018 $ 6,325 2019 9,797 2020 12,928 2021 (2,155)
$ 26,895

City of St. Louis, Missouri Notes to Basic Financial Statements
June 30, 2017 (dollars in thousands)
107
e. Component Unit—SLDC
The SLDC Employees Retirement Plan and Trust (SLDC plan) became effective January 1, 1989. Required year-ended June 30, 2017 contributions of $304, which amount to 9% of current covered payroll, were made by SLDC. For the year ended June 30, 2017, SLDC’s current covered payroll was $3,380 and total payroll amounted to $3,793. Employees are not required to contribute to the SLDC Plan; however, they can contribute up to 5-½% of their monthly compensation if they so elect. In order to be eligible under the SLDC Plan, the participant must be a full-time employee, have attained the age of 18, and completed at least six months of active service. The employees vest at a rate of 33% per annum with full vesting occurring after the end of their third year of service. The SLDC Plan does not hold any employer or related-party securities. All plan investments are self-directed by the respective plan participants, within the limitations of the plan.
11. OTHER POSTEMPLOYMENT BENEFITS PLAN
Plan Description
The City is obligated under Chapter 84.160 RSMo to provide medical and life insurance benefits for former civilian and commissioned Police employees who retire subsequent to 1969. The City provides these other postemployment benefits (OPEB) under a single-employer, defined benefit postemployment plan. The OPEB plan does not issue a separate financial report.
Commissioned Police employees may retire and receive benefits under the OPEB plan after 20 years of creditable service, regardless of age. Civilian Police employees may retire and receive benefits under the OPEB plan after attaining age 55 with 20 years of service, or after attaining age 60 with five years of service. The disability eligibility for officers for a service disability has no minimum age or service requirements and for an ordinary disability is 10 years of service. The disability eligibility for civilians is 5 years of service.
For eligible retired employees and disabled employees under age 65, the OPEB plan pays the full cost of a base healthcare plan. Retirees may elect to pay costs associated with a buy-up healthcare plan, which provides coverage in excess of the base healthcare plan. For eligible retired employees and disabled employees over 65, the OPEB plan pays the costs of a Medicare Supplement Plan. Retirees pay the full cost of spouse healthcare coverage. Additionally, the OPEB plan provides a postretirement death benefit of $3.
The City has elected to have an actuarial valuation performed biennially, unless significant changes occur that affect the results of the most recent valuation. At July 1, 2015, the date of the latest actuarial valuation, plan membership consisted of the following:
Retirees and beneficiaries receiving benefits 1,564 Terminated plan members entitled to, but not
yet receiving benefits 103 Active members 1,579
Total plan members 3,246

City of St. Louis, Missouri Notes to Basic Financial Statements
June 30, 2017 (dollars in thousands)
108
Funding Policy
Contributions made to the OPEB plan are established and may be amended by the Board of Aldermen. For the year ended June 30, 2017, the City contributed $11,655, which was based upon pay-as-you-go financing requirements.
Annual Other Postemployment Benefit Cost and Net Other Postemployment Benefit Obligation
The annual OPEB cost (expense) is calculated based on the annual required contribution (ARC) of the employer, an amount actuarially determined in accordance with the parameters of GASB Statement No. 45, Accounting and Financial Reporting by Employers for Postemployment Benefits Other than Pensions. The annual required contribution represents a level of funding that, if paid on an on-going basis, is projected to cover normal costs each year and amortize any unfunded actuarial liabilities (or funding excess) over a period not to exceed 30 years.
The following table shows the components of the annual OPEB cost for the year, the amount actually contributed to plan, and changes in the net OPEB obligation:
Annual required contribution $ 44,478 Interest on net OPEB obligation 6,170 Adjustment to annual required contribution (10,493)
Annual OPEB cost 40,155
Contribution made 11,655
Increase in net OPEB obligation 28,500
Net OPEB obligation, beginning of year 205,680 Net OPEB obligation, end of year $ 234,180
Historical trend information about the OPEB Plan is as follows:
Annual Percentage NetOPEB of AOC OPEB
Fiscal year cost (AOC) contributed obligation
2017 $ 40,155 29.00 % $ 234,180 2016 39,154 29.00 205,680 2015 40,133 28.00 177,727
Funding Status and Funding Progress
As of July 1, 2015, the most recent actuarial valuation date, the plan was 0% funded. The July 1, 2015 actuarial valuation stated the actuarial accrual liability for benefits was $501,968, and the actuarial value of assets was $0. The covered payroll (annual payroll of active employees covered by the plan) was $89,182, and the ratio of the unfunded actuarial accrued liability to the covered payroll was 562.9%.

City of St. Louis, Missouri Notes to Basic Financial Statements
June 30, 2017 (dollars in thousands)
109
Actuarial valuations of an ongoing plan involve estimates for the value of reported amounts and assumptions about the probability of occurrence of events far into the future. Examples include assumptions about future employment, mortality, and the healthcare trend. Amounts determined regarding the funded status of the plan and annual required contributions of the employer are subject to continual revision as actual results are compared with past expectations and new estimates are made throughout the future.
The schedule of funding progress, presented as required supplementary information following the notes to the basic financial statements, presents multiyear trend information about whether the actuarial value of plan assets is increasing or decreasing over time relative to the actuarial accrued liabilities for benefits.
Actuarial Methods and Assumptions
The projection of future benefit payments for financial reporting purposes are based on the substantive plan (the plan as understood by the employer and the plan members) and includes the types of benefits provided at the time of each valuation, as amended for significant changes to the plan that would impact the valuation. The actuarial methods and assumptions used include techniques that are designed to reduce the effects of short-term volatility in actuarial accrued liabilities and the actuarial value of assets, consistent with the long-term perspective of the calculations.
In the July 1, 2015 actuarial valuation, the projected unit credit cost method was used. The actuarial assumptions include a 3% discount rate and an annual healthcare cost trend rate of 7.4% for Pre-Medicare and 8.7% for Post Medicare initially, reduced by decrements to an ultimate rate of 4.5% for Pre- Medicare and 4.9% for Post-Medicare after eight years. The unfunded actuarial accrued liability is being amortized as a level dollar amount on an open basis over a 30-year amortization period.
12. DEFERRED COMPENSATION PLAN
The City offers its employees a deferred compensation plan created in accordance with Internal Revenue Code Section 457. The plan, available to all City employees, permits them to defer a portion of their salary until future years. The deferred compensation is not available to employees until termination, retirement, death, or unforeseeable emergency.
All amounts of compensation deferred under the plan, all property and rights purchased with those amounts, and all income attributable to those amounts, property, or rights are (until paid or made available to the employees or other beneficiary) held in trust for the exclusive benefit of the employees. As such, the trust account and related liability are not included in the basic financial statements.
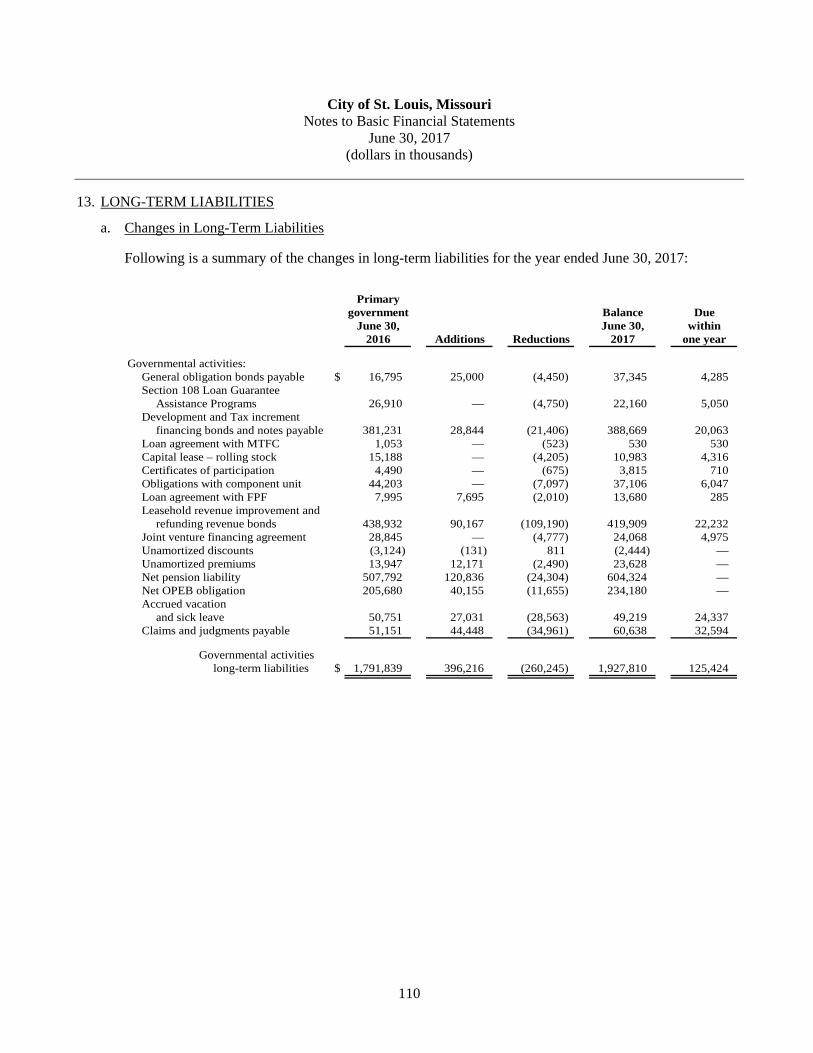
City of St. Louis, Missouri Notes to Basic Financial Statements
June 30, 2017 (dollars in thousands)
110
13. LONG-TERM LIABILITIES
a. Changes in Long-Term Liabilities
Following is a summary of the changes in long-term liabilities for the year ended June 30, 2017:
Primarygovernment Balance Due
June 30, June 30, within2016 Additions Reductions 2017 one year
Governmental activities:General obligation bonds payable $ 16,795 25,000 (4,450) 37,345 4,285 Section 108 Loan Guarantee
Assistance Programs 26,910 — (4,750) 22,160 5,050 Development and Tax increment
financing bonds and notes payable 381,231 28,844 (21,406) 388,669 20,063 Loan agreement with MTFC 1,053 — (523) 530 530 Capital lease – rolling stock 15,188 — (4,205) 10,983 4,316 Certificates of participation 4,490 — (675) 3,815 710 Obligations with component unit 44,203 — (7,097) 37,106 6,047 Loan agreement with FPF 7,995 7,695 (2,010) 13,680 285 Leasehold revenue improvement and
refunding revenue bonds 438,932 90,167 (109,190) 419,909 22,232 Joint venture financing agreement 28,845 — (4,777) 24,068 4,975 Unamortized discounts (3,124) (131) 811 (2,444) — Unamortized premiums 13,947 12,171 (2,490) 23,628 — Net pension liability 507,792 120,836 (24,304) 604,324 — Net OPEB obligation 205,680 40,155 (11,655) 234,180 — Accrued vacation
and sick leave 50,751 27,031 (28,563) 49,219 24,337 Claims and judgments payable 51,151 44,448 (34,961) 60,638 32,594
Governmental activitieslong-term liabilities $ 1,791,839 396,216 (260,245) 1,927,810 125,424

City of St. Louis, Missouri Notes to Basic Financial Statements
June 30, 2017 (dollars in thousands)
111
Internal service funds predominantly serve the governmental funds. Accordingly, long-term liabilities for them are included as part of the above totals for governmental activities. Also, for the governmental activities claims and judgments payable, accrued vacation and sick leave benefits, net pension obligations, and landfill closure costs are generally liquidated by the general fund.
Balance Balance DueJune 30, June 30, Within
2016 Additions Reductions 2017 One Year
Business-type activities:Airport:
Revenue bonds payable $ 686,225 258,430 (38,400) 906,255 276,000 Net pension liability 30,885 — (2,808) 28,077 — Pension funding project 4,945 — (117) 4,828 124 Other 375 — (3) 372 — Accrued vacation, compensatory,
and sick time benefits 5,416 3,279 (3,368) 5,327 3,294 Unamortized discounts and premiums 27,447 43,227 (10,480) 60,194 — Unearned lease revenues 4,909 — (280) 4,629 —
Total airport 760,202 304,936 (55,456) 1,009,682 279,418
Water Division:Revenue bonds payable 5,118 3,779 (412) 8,485 422 Customer deposits 2,479 576 (1,009) 2,046 — Net pension liability 13,273 — (737) 12,536 — Pension funding project 2,865 — (74) 2,791 — Accrued vacation
and sick time benefits 3,396 229 (413) 3,212 1,847
Total water division 27,131 4,584 (2,645) 29,070 2,269
Parking Division:Revenue bonds payable 67,113 12,365 (15,091) 64,387 3,266 Net pension liability 3,522 — (352) 3,170 — Pension funding project 797 — (19) 778 — Other 177 — (20) 157 — Unamortized discounts and premiums, net 2,988 383 (297) 3,074 —
Total parking division 74,597 12,748 (15,779) 71,566 3,266
Business-type activities long-termliabilities $ 861,930 322,268 (73,880) 1,110,318 284,953
Less amounts recorded in:Accrued salaries and other benefits (5,141) (5,141) Accounts payable and accrued liabilities (124) (124)
$ 1,105,053 279,688
b. General Obligation Bonds
On November 10, 2016, the City issued $25,000 in General Obligation Bonds, Series 2016, with an average interest rate of 4.23%. A deposit of $26,885 (after the addition of a $2,528 premium and less a payment of $309 in issuance costs and a $334 discount) was placed with the Trustee to be applied various City projects.

City of St. Louis, Missouri Notes to Basic Financial Statements
June 30, 2017 (dollars in thousands)
112
Principal and interest requirements are as follows:
TIF Bonds and NotesPrincipal Interest Total
Year ending June 30:2018 $ 20,063 25,531 45,594 2019 21,335 24,281 45,616 2020 22,673 23,029 45,702 2021 24,117 21,610 45,727 2022 25,656 20,097 45,753 2023–2027 135,723 75,629 211,352 2028–2032 88,387 37,184 125,571 2033–2037 41,271 16,735 58,006 2038–2042 5,210 3,006 8,216 2043–2045 4,234 695 4,929
$ 388,669 247,797 636,466
c. Section 108 Loan Guarantee Assistance Programs
Principal and interest requirements for the combined Section 108 program notes are as follows:
Principal Interest Total
Year ending June 30:2018 $ 5,050 399 5,449 2019 5,360 312 5,672 2020 5,700 207 5,907 2021 6,050 74 6,124
$ 22,160 992 23,152
d. Development and Tax Increment Financing Bond and Notes Payable
On April 6, 2017, the City issued $9,050 Tax Increment Refunding Revenue Bonds Series 2017 to refinance the Tax Increment and Community Improvement District Refunding Revenue Bonds Series 2007 for the Loughborough Commons Redevelopment Project, with an average interest rate of 3.35%. A deposit of $11,345 (includes $2,636 from the special allocation fund of the project and less $341 in issuance costs) was placed with the Trustee for current refunding. Due to the private placement of the new bonds, the debt service reserve of $1,516 was able to be released to pay debt. Also the decrease of the interest rate from 5.05/5.75% to 3.35% will enable the TIF bonds to be paid off prior to the expiration of the TIF district.
During fiscal year 2017, the City issued an additional $19,794 in TIF bonds and notes payable.

City of St. Louis, Missouri Notes to Basic Financial Statements
June 30, 2017 (dollars in thousands)
113
Principal and interest requirements for the development and tax increment financing debt issues are as follows:
TIF Bonds and NotesPrincipal Interest Total
Year ending June 30:2018 $ 20,063 25,531 45,594 2019 21,335 24,281 45,616 2020 22,673 23,029 45,702 2021 24,117 21,610 45,727 2022 25,656 20,097 45,753 2023 – 2027 135,723 75,629 211,352 2028 – 2032 88,387 37,184 125,571 2033 – 2037 41,271 16,735 58,006 2038 – 2042 5,210 3,006 8,216 2043 – 2045 4,234 695 4,929
$ 388,669 247,797 636,466
e. Loan Agreement With Missouri Transportation Finance Corporation (MTFC)
Principal and interest requirements under the loan agreement with the MTFC are as follows:
Principal Interest Total
Year ending June 30:2018 $ 530 22 552
$ 530 22 552
f. Capital Lease—Rolling Stock
The following is a schedule of future minimum lease payments as of June 30, 2017.
Year ending June 30:2018 $ 4,572 2019 4,104 2020 2,750
Total future minimum lease payments 11,426
Amount representing interest (443) Present value of net minimum lease payments $ 10,983

City of St. Louis, Missouri Notes to Basic Financial Statements
June 30, 2017 (dollars in thousands)
114
g. Certificates of Participation
The City has a master lease agreement with SLDC, whereby the City has leased Stadium East Redevelopment Project and related property and portions of the City Block 210 (the Kiel Premises) to SLDC.
The following is a schedule, by years, of the future minimum payments together with the present value of the net minimum payments for the obligation, which supports the Kiel Premises, as of June 30, 2017.
Year ending June 30:2018 $ 821 2019 821 2020 816 2021 818 2022 818
Total future minimum obligation payments 4,094
Amount representing interest (279) Present value of net minimum obligation payments $ 3,815
No capital assets are recorded by the City on its statement of net position in conjunction with this obligation due to the proceeds being used for demolition and site preparation.
h. Obligations with Component Unit
1) Convention Center – SLDC Series 2000 Bonds
In 2000, SLDC issued Series 2000 Compound Interest Leasehold Revenue Bonds (Series 2000 Bonds) in the amount of $40,000 for the purpose of providing funding for the construction of a convention center hotel within the vicinity of the Convention Center. Under the Agreement, SLMFC has assigned its rights under the lease relative to the Series 2000 Bonds to SLDC. The City is required, beginning on July 15, 2011, to make lease payments to SLDC to fund the annual debt service payments for the Series 2000 Bonds.
The following is a schedule, by years, of the future minimum payments together with the present value of the net minimum payments for the obligation as of June 30, 2017.
Year ending June 30:2018 $ 15,295 2019 15,295 2020 15,295 2021 15,295
Total future minimum obligation payments 61,180
Amount representing interest (39,200) Present value of net minimum obligation payments $ 21,980

City of St. Louis, Missouri Notes to Basic Financial Statements
June 30, 2017 (dollars in thousands)
115
No capital assets are recorded by the City on its statement of net position in conjunction with this obligation due to the proceeds of this obligation being used for construction of a convention center hotel that is not owned by the City.
2) 600 Washington Project – SLDC Series 2010 Bonds
On March 5, 2010, The Land Clearance for Redevelopment Authority (LCRA) issued $16,960 Recovery Zone Facility Special Obligation Redevelopment Bonds Series 2010 (LCRA Series 2010 bonds) for the 600 Washington Project, a contractual obligation of the City.
The following is a schedule, by years, of the future minimum payments together with the present value of the net minimum payments for the obligation as of June 30, 2017.
Year ending June 30:$ 994
1,014 1,044 1,064 1,095
2023 – 2027 5,936 2028 – 2032 6,876 2033 – 2037 7,777 2038 – 2040 3,353
Total future minimum obligation payments 29,153
Amount representing interest (14,027) Present value of net minimum obligation payments $ 15,126
20182019202020212022

City of St. Louis, Missouri Notes to Basic Financial Statements
June 30, 2017 (dollars in thousands)
116
i. Loan agreement with Forest Park Forever
During fiscal year 2017, the SLMFC issued $7,695 in additional Forest Park Taxable Subordinate Leasehold Revenue Bonds.
Principal Interest Total
Year ending June 30:2018 $ 285 625 910 2019 298 612 910 2020 311 599 910 2021 326 584 910 2022 340 570 910 2023 – 2027 1,950 2,599 4,549 2028 – 2032 2,439 2,111 4,550 2033 – 2037 3,049 1,500 4,549 2038 – 2042 3,812 737 4,549 2043 870 40 910
$ 13,680 9,977 23,657
14. LEASEHOLD REVENUE IMPROVEMENT AND REFUNDING REVENUE BONDS
a. Pension Funding Project 2007
The long-term liability for the Pension Funding Project Series 2007 debt is reflected as a long-term liability within the accompanying basic financial statements as follows as of June 30, 2017:
Governmental activities $ 114,229 Business-type activities 8,471
$ 122,700
b. Recreation Center
On July 27, 2016, the SLMFC issued Recreation Sales Tax Leasehold Refunding Revenue Bonds Series 2016 in the amount of $42,990 with interest rate ranging from 2.00% of 5.00% to refund the Recreation Center Series 2007 Bonds. The net proceeds of $47,559 (after the addition of $4,878 premium less $308 issuance cost) was deposited with an escrow agent under the escrow deposit agreement to refund the Recreation Center Series 2007 Bonds. The current and advanced refunding decreased the total debt service payment by $4,064 and resulted in an economic gain (difference between present value of old and new debt service payments) of $5,547. As a result, $42,225 of the Series 2007 Bonds are considered defeased, and the liability removed from the financial statements

City of St. Louis, Missouri Notes to Basic Financial Statements
June 30, 2017 (dollars in thousands)
117
c. Justice Center
On April 4, 2017, the SLMFC issued $5,355 in City Justice Center Leasehold Revenue Refunding Bonds, Series 2017, with an average interest rate of 1.90% to refund $5,170 in outstanding Series 2005 with an average interest rate of 4.00%. A deposit of $5,215 (less payment of $138 in issuance costs and additional use of proceeds of $2), were placed with the Escrow Agent to be applied to the redemption of the Series 2005. The current and advanced refunding decreased the total debt service payment by $45 and resulted in an economic gain (difference between present value of old and new debt service payments) of $43. As a result, $5,170 of the Series 2005 Bonds are considered defeased, and the liability removed from the financial statements.
d. Police Capital Improvements and Juvenile Detention Bonds
On June 29, 2017, the SLMFC issued a total of $38,615 in refunding revenue bonds, Series 2017 A and B.
Series 2017A, in the amount of $19,535, refunded the portion of the Police Capital Improvement Sales Tax Leasehold Revenue Bonds, Series 2007 maturing February 15, 2019 through and including February 15, 2037 with average interest rate of 4.62%. The net proceeds of $21,569 (including $2,531 premium less in $496 issuance costs) was deposited with an escrow agent under the escrow deposit agreement to refund the callable Series 2007 bonds. The refunding decreased the total debt service payment of the Series 2017A by $1,608 and results in an economic gain (difference between present value of old and new debt service payments) of $1,482. As a result, $20,795 of the Police Series 2007 are considered defeased, and the liability removed from the financial statements.
Series 2017B, in the amount of $19,080 refunded the portion of the Tax Exempt Juvenile Center Leasehold Revenue Bonds, Series 2008B maturing from June 1, 2019 through June 1, 2038 with an average interest rate of 4.47% The net proceeds of $20,835 (including $2,234 premium less $479 issuance cost) was deposited with an escrow agent under the escrow deposit agreement to refund the Juvenile Detention Center, Series 2008B bonds. The refunding decreased the total debt service payment of the Series 2017B by $1,037 and results in an economic gain (difference between present value of old and new debt service payments) of $1,236. As a result, $20,180 of the Juvenile Detention Center Series 2008B are considered defeased, and the liability removed from the financial statements.
e. 1520 Market Street
On September 1, 2015, the SLMFC issued 1520 Market Street Taxable Leasehold Revenue Bonds, Series 2015B in the amount not to exceed $13,000 with interest rate of 4.25%. The proceeds of this issuance will be loaned to the LCRA for the purpose of completing NGA preparation work. A line of credit enables LCRA to draw money from the bank as needed. During fiscal year ended June 30, 2017, an additional $3,207 was drawn down.

City of St. Louis, Missouri Notes to Basic Financial Statements
June 30, 2017 (dollars in thousands)
118
f. Principal and Interest Requirements
Principal and interest requirements for the Leasehold Revenue Improvement and Refunding Bonds are as follows:
City Parks Convention CenterPrincipal Interest Principal Interest
Year ending June 30:2018 $ 530 1,074 $ 140 2,243 2019 555 1,053 145 2,239 2020 575 1,030 145 2,235 2021 605 1,002 150 2,230 2022 630 977 9,545 8,128 2023 – 2027 3,580 4,447 38,541 49,835 2028 – 2032 4,355 3,674 32,135 56,279 2033 – 2037 5,370 2,662 17,967 70,582 2038 – 2042 6,800 1,229 25,568 12,314 2043 1,545 62 — —
$ 24,545 17,210 $ 124,336 206,085
Justice Center Forest ParkPrincipal Interest Principal Interest
Year ending June 30:2018 $ 10,025 578 $ 1,065 230 2019 3,690 146 1,105 187 2020 1,810 34 1,150 143 2021 — — 1,205 86 2022 — — 1,270 25
$ 15,525 758 $ 5,795 671

City of St. Louis, Missouri Notes to Basic Financial Statements
June 30, 2017 (dollars in thousands)
119
1520 Market Street/Carnahan Courthouse/QEBC NGA
Principal Interest Principal Interest
Year ending June 30:2018 $ 970 936 $ 770 726 2019 1,540 909 795 702 2020 1,595 849 820 679 2021 1,540 788 845 652 2022 1,605 726 875 625 2023 – 2027 9,955 2,345 4,815 2,679 2028 – 2032 3,635 592 5,880 1,605 2033 – 2035 — — 4,104 312
$ 20,840 7,145 $ 18,904 7,980
Police CapitalRecreation sales tax Improvement sales tax
Principal Interest Principal Interest
Year ending June 30:2018 $ 1,305 1,720 $ 625 586 2019 1,345 1,681 310 902 2020 1,375 1,627 315 893 2021 1,465 1,559 730 880 2022 1,540 1,485 755 851 2023 – 2027 8,935 6,192 4,400 3,648 2028 – 2032 11,285 3,844 5,615 2,432 2033 – 2037 13,730 1,407 7,150 902
$ 40,980 19,515 $ 19,900 11,094

City of St. Louis, Missouri Notes to Basic Financial Statements
June 30, 2017 (dollars in thousands)
120
Public Safety Sales TaxPension Funding Project 2008 Juvenile Detention Center
Principal Interest Principal Interest
Year ending June 30:2018 $ 2,165 261 $ 635 815 2019 2,290 134 610 856 2020 — — 630 837 2021 — — 645 819 2022 — — 675 793 2023 – 2027 — — 3,875 3,461 2028 – 2032 — — 4,945 2,390 2033 – 2037 — — 6,285 1,044 2038 — — 1,415 50
$ 4,455 395 $ 19,715 11,065
Pension Funding Project 2007 Refuse and Municipal GaragePrincipal Interest Principal Interest
Year ending June 30:2018 $ 3,160 7,976 $ 1,060 399 2019 3,365 7,770 1,080 380 2020 3,585 7,551 1,100 359 2021 3,820 7,318 1,125 335 2022 4,065 7,070 1,150 308 2023 – 2027 24,650 31,026 5,170 662 2028 – 2032 33,775 21,903 — — 2033 – 2037 46,280 9,403 — —
$ 122,700 100,017 $ 10,685 2,443
15. JOINT VENTURE FINANCING AGREEMENT
In April 1990, the St. Louis Regional Convention and Sports Complex Authority (Authority) was established as a separate legal entity by an act of the Missouri State legislature to acquire, purchase, or lease, and construct, operate, and maintain convention centers, sports stadiums, field houses, indoor and outdoor convention, recreational, and entertainment facilities, and to do all things incidental or necessary to facilitate these purposes.
The Authority entered into a Project Financing Construction and Operation Agreement (Financing Agreement) dated August 1, 1991 with the City, State, and County (collectively, the Sponsors) providing for the application of the proceeds of Project Bonds, for the repayment of the Project Bonds, and for the operation and maintenance of the Project. On August 1 and February 1 of each year, the City is obligated (subject to appropriations) to make rental payments of $2,500 and preservation payments of $500 regardless of the principal and interest payments due.

City of St. Louis, Missouri Notes to Basic Financial Statements
June 30, 2017 (dollars in thousands)
121
At June 30, 2017, the City’s obligation for the Series C Bonds and net preservation payments (after deposits to the bond fund) payable from the general fund under the Financing Agreement is as follows:
PreservationPrincipal Interest payments Total
Year ending June 30:2018 $ 3,865 1,025 1,110 6,000 2019 4,070 817 1,113 6,000 2020 4,280 598 1,122 6,000 2021 4,505 367 1,128 6,000 2022 4,740 125 (1,865) 3,000
$ 21,460 2,932 2,608 27,000
16. COMPONENT UNIT—LONG-TERM LIABILITIES
a. Component Unit – SLDC Long-Term Liabilities
The following is a summary of changes in long-term liabilities for SLDC for the year ended June 30, 2017:
Balance BalanceJune 30, June 30, Within
2016 Additions Reductions 2017 O ne Year
Due to other governmentalagencies $ 4,856 1,913 (1,049) 5,720 968
Notes payable 20,080 1,762 (2,658) 19,184 705Bank line of credit 17,076 12,296 (12,336) 17,036 1,911Other liabilit ies 8,579 4,754 (5,141) 8,192 1,825
$ 50,591 20,725 (21,184) 50,132 5,409
Maturities on notes payable and bank line of credit are as follows:
Principal Interest Total
Year ending June 30:2018 $ 2,617 1,417 4,034 2019 2,667 1,275 3,942 2020 13,563 924 14,487 2021 229 711 940 2022 239 657 896 2023 – 2035 16,905 8,130 25,035
$ 36,220 13,114 49,334

City of St. Louis, Missouri Notes to Basic Financial Statements
June 30, 2017 (dollars in thousands)
122
17. REVENUE BONDS PAYABLE
a. Airport
Bonds outstanding at June 30, 2017 are summarized as follows:
Bond Series 2005, interest rate of 5.50%,payable in varying amounts through 2032 $ 209,730
Bond Series 2007A, interest rate ranging from 5.00% to 5.25%,payable in varying amounts through 2027 187,195
Bond Series 2007B, interest rate of 5.00%,payable in varying amounts through 2018 91,930
Bond Series 2009A, interest rate ranging from 5.25% to 6.625%,payable in varying amounts through 2035 104,045
Bond Series 2012, interest rate ranging from 3.00% to 5.00%,payable in varying amounts through 2033 24,170
Bond Series 2013, interest rate of 5.00%,payable in varying amounts through 2019 13,445
Bond Series 2015, interest rate of 5.00%, payable in varyingamounts through 2024 17,310
Bond Series 2017A, interest rate ranging from 4.00% to 5.00%,payable in varying amounts through 2033 125,410
Bond Series 2017B, interest rate ranging from 4.00% to 5.00%,payable in varying amounts through 2028 74,715
Bond Series 2017C, interest rate of 5.00%,payable in varying amounts through 2048 31,700
Bond Series 2017D, interest rate of 5.00%,payable in varying amounts through 2038 26,605
906,255
Less:Current maturities (276,000) Unamortized discounts and premiums 60,194
(215,806) $ 690,449
Interest payments on the above issues are due semiannually on January 1 and July 1.
On June 30, 2017, the Airport issued $125,410 Series 2017A and $74,715 Series 2017B Revenue Refunding Bonds maturing in varying amounts from 2024 through 2028 with interest rates of 4% to 5%. Proceeds from the bonds plus additional Airport cash of $10,335 were used to refund $150,445 Series 2007A and $85,080 Series 2007B Revenue Refunding bonds on July 3, 2017 and paid costs incidental to the issuance of the bonds. The refunding of the 2007A Airport Revenue Refunding Bonds resulted in the termination and extinguishment of a Forward Purchase obligation totaling $2,097, which is recorded as a gain on extinguishment of debt in non-operating revenue.
City of St. Louis, Missouri Notes to Basic Financial Statements
June 30, 2017 (dollars in thousands)
123
At June 30, 2017, the Series 2007A and Series 2007B Bonds are reflected within current maturities of revenue bonds payable. The Airport also issued $58 million of Series 2017C and 2017D Revenue Bonds to finance certain airfield, terminal, and parking projects.
The Airport completed the advance refunding on July 3, 2017 to reduce its total debt service payments over the next 15 years by $46,646 and to obtain an economic gain (difference between the present value of the old and new debt service payments) of $35,495.
As of June 30, 2017, the Airport’s aggregate debt service requirements for the next five years and in five-year increments thereafter are as follows:
Principal Interest Total
Year ending June 30:2018 $ 276,000 28,177 304,177 2019 35,780 32,508 68,288 2020 36,315 30,631 66,946 2021 36,695 28,905 65,600 2022 38,310 27,119 65,429 2023 – 2027 191,730 106,166 297,896 2028 – 2032 209,840 52,293 262,133 2033 – 2037 46,605 13,421 60,026 2038 – 2042 14,145 6,954 21,099 2043 – 2047 16,925 3,177 20,102 2048 3,910 98 4,008
$ 906,255 329,449 1,235,704
b. Water Division
Water revenue bonds outstanding at June 30, 2017 are payable solely from and secured by, a pledge of net revenues from the operation of the Water Division and are as follows:
Series 2013 Water Revenue Refunding Bonds,1.56%, drawdown loan, payable in varyingamounts through January 1, 2034 $ 8,485
Less:Current maturities (422)
$ 8,063
Series 2013 Water Revenue Bonds
In November 2013, the Water Division issued $9,500 (not to exceed) in Water Revenue Bonds (Series 2013 Bonds) through the Missouri Department of National Resources Direct Loan Program. This bond issue is a drawdown loan with a fixed interest rate of 1.56% to fund various projects at the water treatment plants and throughout the distribution system. During fiscal year 2017, the Water Division drew down $3,779 of the loan. The final drawdown relating to the program was completed in fiscal year 2017.

City of St. Louis, Missouri Notes to Basic Financial Statements
June 30, 2017 (dollars in thousands)
124
Debt service requirements to maturity of the 2013 Series Water Revenue Bonds are as follows:
Principal Interest Total
For the year ending June 30:2018 $ 422 131 553 2019 430 124 554 2020 439 117 556 2021 448 110 558 2022 458 103 561 2023 - 2034 6,288 637 6,925
$ 8,485 1,222 9,707
Principal and interest payments are due semiannually on January 1 and July 1.
c. Parking Division
Revenue bonds outstanding at June 30, 2017 are as follows:
SLPCFC Series 2003A tax-exempt revenue bonds, interest ratesvariable, not to exceed 12%, payable in varying amountsthrough 2024 $ 1,970
SLPCFC Series 2003B taxable revenue bonds interest ratesvariable, not to exceed 5%, payable in varying amountsthrough 2038 5,712
Series 2007B revenue bonds, interest rates variable, not to exceed6.00%, payable in varying amounts through 2018 835
Series 2013A subordinated parking revenue bond interest rates variable,not to exceed 2.30%, payable in varying amounts through 2022 1,000
Series 2015A subordinated parking revenue bond interest rates variable,not to exceed 3.50%, payable in varying amounts through 2031 6,095
Series 2015B subordinated parking revenue bond interest rates variable,not to exceed 5.00%, payable in varying amounts through 2033 36,410
Series 2016 revenue bond interest ranging from 3% to 4% payable in varying amounts through 2031 12,365
64,387
Less:Current portion of revenue bonds payable (3,266) Unamortized discount and premium 3,074
$ 64,195

City of St. Louis, Missouri Notes to Basic Financial Statements
June 30, 2017 (dollars in thousands)
125
On November 25, 2016, the Parking Division issued $12,365 in Series 2016 Parking Revenue Tax Exempt Bonds. The bonds were issued for the purpose of advance refunding the remaining portion of the outstanding Series 2006A parking revenue bonds, funding a debt service reserve with respect to the Series 2016 and paying the bond insurance premium and other costs of issuance with respect to the Series 2016 Bonds. The 2006A bond series refunded and the amount outstanding was $13,780.
Pursuant to the provisions of the Refunding Indenture, the Issuer has deposited into a refunding account the amount of $14,094, consisting of (1) $12,347 from the proceeds of the Refunding Bonds and (2) $1,747 representing portions of (i) the amount that was on deposit in the Series 2006A Account in the Debt Service Reserve Fund of $1,457, and (ii) the termination of the Forward Delivery Agreement of $290.
The advance refunding resulted in a difference between the reacquisition price and the net carrying amount of the old debt of $1,551. In accordance with GASB Statement No. 65, the gain on bond defeasance associated with the outstanding balance of the unamortized deferred outflow of resources for the 2006A series and the transfer of debt service reserves from 2006A of $1,747, have been recorded as a net increase to deferred outflow of resources. This will be recognized as a component of interest expense over its deemed remaining life. In addition, $324 was recorded as a deferred inflow of resources as part of the recognized gain on bond defeasance. These funds were deposited into an irrevocable trust with an escrow agent to provide for all future debt service payments on the 2006A bond series. As a result, the 2006A bond series are considered to be defeased and the liability for those bonds was removed from the statement of net position.
The advance refunding decreases total debt service payments over the life of the Series 2016 bond issuance by $3,136, and results in an economic gain (difference between the present values of the old and new debt service payments) of $1,200.
Debt service requirements of the revenue bonds at June 30, 2017 are as follows:
Principal Interest Total
Year ending June 30:2018 $ 3,266 2,485 5,751 2019 3,384 2,350 5,734 2020 3,517 2,212 5,729 2021 3,664 2,068 5,732 2022 3,807 1,919 5,726 2023 – 2027 19,458 7,079 26,537 2028 – 2032 23,944 2,908 26,852 2033 – 2037 2,939 449 3,388 2038 – 2039 408 20 428
$ 64,387 21,490 85,877

City of St. Louis, Missouri Notes to Basic Financial Statements
June 30, 2017 (dollars in thousands)
126
18. PLEDGED REVENUES
The City has pledged specific revenue streams to secure the repayment of certain outstanding debt issues. The following narratives list those revenues by source along with the general purpose of the debt, the amount of the pledge remaining, the term of the pledge commitment, the amount of pledged revenue collected during the current fiscal year, and the approximate percentage of the revenue stream that has been committed, if estimable:
a. Governmental activities
The City has pledged an ad valorem tax levied upon all taxable, tangible property, real and personal (property tax revenue) related to various general obligation revenue bonds. The general purpose of the various general obligation revenue bonds is the purpose of refunding renovation of fire and police buildings and demolition of unsafe or condemned buildings and communications equipment for fire police and EMS and police infrastructure improvements. The bonds are payable, in part, from a tax rate that is set annually based on revenue required to pay debt. The term of commitments related to such pledged revenues vary by issuances and extend to fiscal year 2036. Annual principal and interest payments on the bonds are expected to require 100% of estimated related net revenues. As of June 30, 2017, the total principal and interest remaining to be paid on the debt is $52,531. Principal and interest paid was $5,180 for the year ended June 30, 2017, as well as $1,620 contributed to defease principal and interest of the Series 2016 refinancing. The pledged net revenue recognized for the year ended June 30, 2017 was $6,610. During fiscal year 2017, the proportion of pledged revenues needed for debt service to revenues collected was 100%.
The City has pledged all payments in lieu of taxes (PILOTs) and fifty per cent of the economic activity taxes (EATS) captured in specified TIF districts to pay debt outstanding. The general purpose of the TIFS is to assist in development of blighted properties. The debt outstanding is payable from the related pledged revenues through year 2036. Annual principal and interest outstanding on the various TIF bonds and notes outstanding is paid based on the amount of revenue captured in each particular district. It has also been pledged to pay debt on the Section 108 Loan for the Convention Center Hotel and the 600 Washington obligation with component unit. Annual principal and interest payments on the bonds are expected to require 100% of estimated related net revenues. As of June 30, 2017, the total principal and interest remaining is $682,596. Principal and interest paid was $36,904 for the year ended June 30, 2017. The pledged net revenue recognized for the year ended June 30, 2017 was $39,916. During fiscal year 2017, the proportion of pledged revenues needed to revenues collected was 92.45%.
A $45 (in dollars) surcharge on civil cases in the circuit court is imposed by state statute to be used for courthouse restoration. A city ordinance also imposes a $5 (in dollars) court cost on all municipal ordinance violation cases to be used for courthouse restoration. The funds are used as pledges for the Carnahan Courthouse Leasehold Revenue Refunding Bond Series, with purposes of financing renovations at the Carnahan Courthouse. The term of commitment related to such pledged revenues extend to fiscal year 2027. Annual principal and interest payments on the bonds are expected to require 100% of estimated related net revenues. As of June 30, 2017, the total principal and interest remaining on these financings is $21,924. Principal and interest paid was $610 for the year ended June 30, 2017. The pledged net revenue recognized for the year ended June 30, 2017 was $1,203. During fiscal year 2017, the proportion of pledged revenues needed to revenues collected was 50.71%.

City of St. Louis, Missouri Notes to Basic Financial Statements
June 30, 2017 (dollars in thousands)
127
The City has pledged State per diem prisoner reimbursements for boarding of State prisoners to Justice Center debt issuances. The purpose of the financings was to construct a new Justice Center. The term of commitment related to such pledged revenues extend to fiscal year 2020. Annual principal and interest payments on the bonds are expected to require 100% of estimated related net revenues. As of June 30, 2017, total principal and interest remaining on the debt is $16,283. Principal and interest paid was $10,621 for the year ended June 30, 2017. The pledged net revenue recognized for the year ended June 30, 2017 was $7,450. During fiscal year 2017, the proportion of pledged revenues needed to revenues collected was 100%.
The City has pledged a portion of the one half cent capital improvement sales tax to fund the Forest Park Leasehold Revenue Refunding Bonds, whose purpose was to finance improvements to Forest Park. As legally committed by ordinance, 10.4% of the revenue collected from this sales tax is allocated for Forest Park. The annual debt payment is appropriated from this source of funds. The term of commitment related to such pledged revenues extend to fiscal year 2022. Annual principal and interest payments on the bonds are expected to require less than 80% of estimated related net revenues. Forest Park Taxable Subordinate Leasehold Revenue Bonds issued pledge the remainder of the tax as well as any revenue generated in the park. As of June 30, 2017, total principal and interest remaining on the debt is $30,123. Principal and interest paid was $3,679 for the year ended June 30, 2017. The pledged net revenue recognized for the year ended June 30, 2017 was $3,700. During fiscal year 2017, the proportion of pledged revenues needed to revenues collected was 99.43%.
The City has pledged the one eighth cent parks and recreation sales tax to fund the Recreation Sales Tax Leasehold Revenue Bonds Revenue Bonds whose purpose was the construction of two new recreation centers. The annual debt payment is appropriated from this source of funds. The term of commitment related to such pledged revenues extend to fiscal year 2037. Annual principal and interest payments on the bonds are expected to require less than 80% of estimated related net revenues. As of June 30, 2017, total principal and interest remaining on the debt is $60,495. Principal and interest paid was $2,978 for the year ended June 30, 2017. The pledged net revenue recognized for the year ended June 30, 2017 was $4,689. During fiscal year 2017, the proportion of pledged revenues needed to revenues collected was 63.5%.
The City has pledged a portion of the one half cent capital improvement sales tax to fund the Police Capital Improvements Sales Tax Leasehold Revenue Bonds Series 2007 and 2017, whose purpose was capital improvements to police buildings and certain interoperable communications equipment to be used by the police, fire and EMS. As legally committed by ordinance, 10% of the revenue collected from this sales tax is allocated for police capital improvements. The annual debt payment is appropriated from this source of funds. The term of commitment related to such pledged revenues extend to fiscal year 2037. Annual principal and interest payments on the bonds are expected to require less than 90% of estimated related net revenues. As of June 30, 2017 total principal and interest remaining on the debt is $30,994. Principal and interest paid was $1,308 for the year ended June 30, 2017. The pledged net revenue recognized for the year ended June 30, 2017 was $1,856. During fiscal year 2017, the proportion of pledged revenues needed to revenues collected was 70.47%.
City of St. Louis, Missouri Notes to Basic Financial Statements
June 30, 2017 (dollars in thousands)
128
Sales tax revenues dedicated to City Parks have been pledged to pay debt outstanding on the City Parks Leasehold Improvement Dedicated Revenue Bonds. Debt payments will be made from dedicated revenues for parks in the Capital Improvement Sales Tax, Metropolitan Park and Recreation District Capital Improvement Sales Tax, and Arch-Metro Parks Sales Tax. Annual principal and interest payments on the bonds are expected to require less than 75% of estimated related revenues. As of June 30, 2017, total principal and interest remaining on the debt is $41,755. Principal and interest paid was $1,604 for the year ended June 30, 2017. The pledged net revenue recognized for the year ended June 30, 2017 was $3,074. During fiscal year 2017, the proportion of pledged revenues needed to revenue collected was 52.18%.
The City has pledged all payments in lieu of taxes (PILOTs) and fifty per cent of the economic activity taxes (EATS) captured in the Argyle TIF district to pay debt outstanding on a portion of the Parking Revenue Bonds Series 2006, as well as any refinancing there after associated with the Argyle parking garage construction. The term of commitment related to such pledged revenues extend to fiscal year 2022. Annual principal and interest payments on the bonds are expected to require less than 100% of estimated related net revenues. As of June 30, 2017, total principal and interest outstanding on this portion of the debt is $4,480. The pledged net revenue recognized for the year ended June 30, 2017 related to the collection of PILOTs and EATs was $1,707. During fiscal year 2017, none of the pledge revenues were used to meet the debt service requirements.
The City has pledged all payments in lieu of taxes (PILOTs) and fifty per cent of the economic activity taxes (EATS) captured in the Euclid-Buckingham TIF district to pay debt outstanding on a portion of the Parking Revenue Bonds Series 2006 as well as any refinancing of the bonds hereafter associated with the Euclid-Buckingham parking garage construction. The term of commitment related to such pledged revenues extend to fiscal year 2022. Annual principal and interest payments on the bonds are expected to require less than 100% of estimated related net revenues. As of June 30, 2017, total principal and interest outstanding on this portion of the debt is $5,595. The pledged net revenue recognized for the year ended June 30, 2017 related to the collection of PILOTs and EATs was $343. During fiscal year 2017, none of the pledge revenues were used to meet the debt service requirements.
The City has pledged general fund police parking ticket revenues to the Parking Revenue Bonds Series 2006 and Series 2007 in parity with the Parking Division to make up any shortfall of other committed sources. The term of commitment related to such pledged revenues extend to fiscal year 2038. As of June 30, 2017, total principal and interest remaining on the debt is $37,008. During fiscal year 2017, revenue from the police parking ticket revenues totaled $535. During fiscal year 2017, none of general fund revenues were used to meet the debt service requirements and the Parking Division has a payable to the City for this payment. See note 18b.

City of St. Louis, Missouri Notes to Basic Financial Statements
June 30, 2017 (dollars in thousands)
129
b. Business-type activities
Airport
The Airport has pledged future specific revenue streams, net of specified operating expenses, to secure the repayment of $906,255 in various long-term debt issuances. The general purpose of the various long-term debt issuances is for land acquisition and construction of the capital assets at the Airport. The bonds are payable from Airport net revenues and are payable through July 2034. Annual principal and interest payments on the bonds are expected to require less than 80% of estimated Airport net revenues. As of June 30, 2017, the total principal and interest remaining to be paid on the bonds is $1,235,704. Principal and interest paid was $$73,922 for the year ended June 30, 2017. The pledged net revenue recognized for the year ended June 30, 2017 was $84,760.
Water Division
The Water Division has pledged specific revenue streams to secure the repayment of Series 2013 Bonds. As of June 30, 2017, the remaining principal and interest requirement is $9,707 payable through January 2034 (fiscal year 2034). Principal and interest paid for the Series 2013 Bonds was $486. The proportion of pledged revenue to revenue collected is estimated at 0.9% at June 30, 2017. The pledged net revenue recognized for the year ended June 30, 2017 was $53,557.
Parking Division
The Parking Division has pledged specific net Parking Division project revenues and net Parking Division revenues, net of specified operating expenses, to secure the repayment of the City of St. Louis Parking Revenue Bonds, Series 2007B, 2013A, 2015A, 2015B and 2016. The general purpose of the bonds is to build parking facilities in the City. As of June 30, 2017 the remaining principal and interest requirement is $74,015 payable through fiscal year 2039. Principal and interest paid for the Series 2007B, 2013A, 2015A, 2015B and 2016 Parking Revenue Bonds was $2,917 for the year ended June 30, 2017. The pledged net revenue recognized for the year ended June 30, 2017 was $9,783.
19. SHORT-TERM DEBT
a. City
The City issued $60,000 of general fund Tax and Revenue Anticipation notes dated July 6, 2016 and redeemed June 1, 2017. The purpose of the notes is to improve cash flow to allow more prompt vendor payments and encourage additional vendors to bid on City business.
Short-term debt activity for the year ended June 30, 2017 was as follows:
Balance BalanceJune 30, June 30,
2016 Issued Redeemed 2017
Tax and revenue anticipation notes $ — 60,000 (60,000) —
$ — 60,000 (60,000) —

City of St. Louis, Missouri Notes to Basic Financial Statements
June 30, 2017 (dollars in thousands)
130
20. OPERATING LEASES
a. At June 30, 2017, the City was committed under miscellaneous operating leases for office space and equipment. Future minimum base rental payments under terms of the operating leases are as follows:
Year ending June 30:2018 $ 994 2019 633 2020 395 2021 236 2022 344 2023 – 2027 116
$ 2,718
Rental and lease expenditures for the fiscal year 2017 totaled $5,014.
b. Airport – Use Agreements and Leases with Signatory Air Carriers
Effective July 1, 2016, the Airport entered into long-term use and lease agreements with signatory air carriers that will expire on June 30, 2021. Under the terms of the use and lease agreements, the air carriers have agreed to pay airfield landing fees; terminal and concourse rentals; hangar, cargo, and maintenance facility rentals; and certain miscellaneous charges in consideration for use of the Airport. The use and lease agreements also require the Airport to make certain capital improvements and to provide maintenance of certain Airport facilities. Payments by the air carriers are determined as follows:
• Landing fees are calculated based on estimated operating and maintenance expenses of the airfield, and allocated to the air carriers on the basis of landing weights. Landing fee revenues are adjusted each year by retroactive rate adjustment, that is calculated as the difference between estimated and actual costs incurred and estimated and actual landing weights. These revenues are included in aviation revenue—airfield.
• Rentals are calculated based on estimated operating and maintenance expenses of the terminal and concourse areas and hangars, cargo, and maintenance facilities, and allocated to the air carriers on the basis of square footage utilized. Rental revenue is adjusted each year by retroactive rate adjustment, that is calculated as the difference between estimated and actual costs incurred. These revenues are included in aviation revenue terminal and concourses, hangars, and other buildings or cargo buildings, respectively.
• Miscellaneous income is derived from the air carriers for their use of sanitary disposal facilities and airline service buildings.
During fiscal year 2017, revenues from signatory air carriers accounted for 52.3% of total Airport operating revenues.
Minimum future rentals for each year in the next five years and in the aggregate are not determinable given the method of calculation.

City of St. Louis, Missouri Notes to Basic Financial Statements
June 30, 2017 (dollars in thousands)
131
The following is a summary of aviation revenue by category and source from signatory and non-signatory air carriers for the year ended June 30, 2017:
Non-Signatory signatory Total
Airfield $ 47,731 10,570 58,301 Terminal and concourses 24,817 473 25,290 Hangars and other buildings 535 815 1,350 Cargo buildings 215 278 493
$ 73,298 12,136 85,434
No assurance can be given as to the levels of aviation activity that will be achieved at the Airport in future fiscal years. Future traffic at the Airport is sensitive to a variety of factors including: (1) the growth in the population and the economy of the area served by the Airport (2) national and international political and economic conditions, including the effects of any past or future terrorist attacks; (3) air carrier economics and air fares; (4) the availability and price of aviation fuel; (5) air carrier service and route networks; (6) the capacity of the air traffic control system; and (7) the capacity of the Airport/airways system.
The level of aviation activity at the Airport can have a material impact on the amount of total revenues generated at the Airport. However, Airport management believes the risk of significant variance in Airport revenues is mitigated by the Airport Use Agreements, concession agreements, and other leases, which contain minimum annual revenue guarantees. Effective July 1, 2016, the Airport entered into a new long-term Airport Use and Lease Agreement (AUA) with signatory air carriers which will expire June 30, 2021. Contemporaneously, the Airport also adopted a new companion Airline Operating Agreement and Terminal Building Space Permit (AOA), which the Airport will make available to airlines that elect not to enter into an AUA. The new agreements retain most of the provisions of the prior master agreements which expired June 30, 2016.
The Airport leases facilities and land with varying renewal privileges to various non-signatory air carriers, concessionaires, and others. These leases, for periods ranging from 1 to 50 years, require the payment of minimum annual rentals. The following is a schedule by year of minimum future rentals on non-cancelable operating leases, other than leases with signatory airlines, pursuant to long-term use agreements:
Year ending June 30:$ 23,949
22,848 16,957 9,848 7,661
2023 – 2027 15,253 2028 – 2032 11,147 2033 – 2037 3,074
Total minimum future rentals $ 110,737
20182019202020212022

City of St. Louis, Missouri Notes to Basic Financial Statements
June 30, 2017 (dollars in thousands)
132
The above amounts do not include contingent rentals that may be received under certain leases. Such contingent rentals amounted to $3,805 for the year ended June 30, 2017.
Unearned lease revenues included in Airport other long-term liabilities in the amount of $4,629 as of June 30, 2017 represent the upfront lease revenues received by the Airport for the lease of certain land.
The Airport leases computer and other equipment and has service agreements under non-cancelable arrangements that expire at various dates through April 2020. Expenses for operating leases and service agreements were $34 for the year ended June 30, 2017. Future minimum payments are as follows:
Year ending June 30:$ 42
35 31 15
Total minimum future rentals $ 123
2018201920202021
c. Component Unit—SLDC
During the year ended June 30, 2011, SLDC signed a sub-lease agreement with the City that commenced March 1, 2012 until June 30, 2031 with rental payments of $620 per year for the first 10 years and variable amounts for the remaining 10 years. SLDC also has sublease agreements with Community Development Agency (CDA), Affordable Housing Commission (AHC), and Planning and Urban Design Development Agency (PDA) and in effect through June 30, 2031.
Future minimum base rents under the terms of the lease agreements net of sublease rents anticipated from CDA and PDA as of June 30, 2017 are as follows:
Year ending June 30:$ 336
335 336
2021 335 $ 1,342
201820192020
Additionally, at June 30, 2017, SLDC was committed through a 25-year operating lease with the City, which requires annual rental payments of $1 (in dollars) for property at the City terminal site. Under the lease agreement, SLDC shall make improvements to the leased premises and award subleases for all or a portion of the leased premises. Sublease revenue is retained by SLDC for use at the terminal site.
SLDC entered into an agreement with the City to facilitate the acquisition and development of property for future use. As of June 30, 2017, SLDC has incurred debt of $14,844 and capitalized $59,467 of land and site improvements recorded as property held for development related to this project. $46,346 has been recorded as an allowance against this property given the contract with the National Geospatial Agency providing for a minimal purchase amount.

City of St. Louis, Missouri Notes to Basic Financial Statements
June 30, 2017 (dollars in thousands)
133
21. INTERFUND BALANCES
Individual fund interfund receivable and payable balances as of June 30, 2017 are as follows:
Receivable fund Payable fund Amount
General fund Special revenue—Grants fund $ 2,475 Other governmental nonmajor funds 4 Internal service fund 36 Enterprise: Airport 1,872 Water Division 1,242 Parking Division 2,213
7,842
Redevelopment projectsfund General fund 4,186
Capital projects fund 556 Other governmental nonmajor funds 1,549
6,291
Internal service funds General fund 473 Other governmental nonmajor funds 2 Enterprise: Airport 2,912 Water Division 3,658 Parking Division 143
7,188 $ 21,321
All of these interfund balances are due to either timing differences or due to the elimination of negative cash balances within the various funds. All interfund balances are expected to be repaid during the fiscal year ending June 30, 2018.
Advances to/from other funds as of June 30, 2017 are as follows:
Advance from Advance to AmountGeneral fund Internal service fund $ 48,769

City of St. Louis, Missouri Notes to Basic Financial Statements
June 30, 2017 (dollars in thousands)
134
22. INTERFUND TRANSFERS
Interfund transfers for the year ended June 30, 2017 consisted of the following:
Transfer ToOther
Capital Govern-General Projects mental Parking
Fund Fund Funds Division TotalGeneral fund $ — 8,667 2,040 — 10,707 Redevelopment projects fund 1,714 269 1,141 337 3,461 Capital Projects fund 283 — — — 283
Transfer Other Governmental funds 26,847 11,600 531 — 38,978 From Grants fund — — — — —
Parking Division 1,681 — 310 — 1,991 Airport 6,500 — — — 6,500 Water Division 3,207 — — — 3,207
$ 40,232 20,536 4,022 337 65,127
Interfund transfers were used to: (1) move revenues from the fund that ordinance or budget requires to collect them to the fund that ordinance or budget requires to expend them, (2) use unrestricted revenues collected in the general fund to finance capital improvements and other funds in accordance with budgetary authorization, or (3) move revenues in excess of current year expenditures to other funds. Additionally, gross receipt payments from the Airport and the Water Division are handled as transfers from each respective enterprise fund to the general fund.
23. COMMITMENTS AND CONTINGENCIES
a. Grants
In connection with various federal, state, and local grant programs, the City is obligated to administer related programs and spend the grant moneys in accordance with regulatory restrictions and is subject to audit by the grantor agencies. In cases of noncompliance, the agencies involved may require the City to refund program moneys. Through June 30, 2017, claims have been made on the City to make refunds under certain programs and other programs are still open as to compliance determination by the respective agencies. In the opinion of City officials, settlement of these matters will not result in a material liability to the City.
SLPD was exposed to various risks of loss related to torts; theft of, damage to, and destruction of assets; errors and omissions; injuries to employees; and natural disasters. A number of legal suits originally against SLPD are presently pending for alleged wrongful personal injuries, civil rights violations, and negligence in the line of duty.

City of St. Louis, Missouri Notes to Basic Financial Statements
June 30, 2017 (dollars in thousands)
135
During fiscal year 2005, the Court of Appeals for the State of Missouri affirmed that under Missouri State Statutes, Chapter 84, the SLPD was an agency of the state. As an agency of the state, the SLPD was covered by the State of Missouri’s legal expense fund for most general liability and various other claims and legal actions occurring prior to August 28, 2005. On August 28, 2005, Missouri legislation became effective modifying the coverage provided to the SLPD by the State of Missouri for general liability and various other claims and legal actions. State of Missouri Bill No. 420 provides that the State of Missouri was liable annually for funding general liability claims on an equal share basis per claim with the Public Facilities Protection Corporation (PFPC), an internal service fund of the City, up to a maximum of $1,000. The SLPD was covered by PFPC for most self-insured risks, including general liability and various other claims and legal actions, exceeding the limitations set forth by the enacted legislation. Of these suits, $425 is included in the self-insurance claim liability of $60,638 and $2,075 is included as the estimate of reasonably possible within the $15,392.
b. Commitments
At June 30, 2017, the City had outstanding commitments amounting to approximately $11,198, resulting primarily from service agreements.
Additionally, at June 30, 2017, the Airport had outstanding commitments amounting to approximately $20,378 resulting primarily from contracts for construction projects. In addition, the Airport has $21,225 in outstanding commitments resulting from service agreements.
c. Encumbrances
Encumbrances are commitments related to unperformed contracts for goods or services. Encumbrances outstanding at year end are not accounted for as expenditures and liabilities. As of June 30, 2017 encumbrances of $759 were reported in the general fund, $44,358 in the capital projects services fund and $4,329 in the other governmental funds.
d. American Airlines and Southwest Airlines
American Airlines, Inc. (American) and Southwest Airlines (Southwest) represent the major air carriers providing air passenger service at the Airport.
American provided 9.8% of the Airport’s total operating revenues and 18.7% of total revenues from signatory air carriers for the fiscal year ended June 30, 2017. Accounts receivable at June 30, 2017 contained $2,518 relating to amounts owed to the Airport by American. This amounts include $1,035 of unbilled aviation revenue credits at June 30, 2017.
Southwest provided 27.9% of the Airport’s total operating revenues and 53.3% of total revenues from participating air carriers for the fiscal year ended June 30, 2017. Accounts receivable at June 30, 2017 contained $1,130 relating to unused credits issued by the Airport to Southwest. This amount includes $1,037 of unbilled aviation revenue credits at June 30, 2017.

City of St. Louis, Missouri Notes to Basic Financial Statements
June 30, 2017 (dollars in thousands)
136
e. Asbestos Removal
The Water Division has identified certain of its structures as having asbestos in place. As part of its continuing process of upgrading facilities, the costs for removal of the asbestos material and restoration or replacement of the affected areas are being included in budgets for capital projects. No mandatory time requirement is in effect. The removal plan would be accelerated by changes in plans for remodeling, if any.
f. Component Unit—SLDC
SLDC has entered into various cooperative agreements with the CDA as a subrecipient/administrator of the Community Development Block Grant Programs. The purpose of these grants and contracts is to provide support for economic development in the City. Revenues from these contracts amounted to $2,541 during the year ended June 30, 2017.
SLDC has received eight allocation awards of New Market Tax Credit (NMTC) investment authority pursuant to Section 45D of the Internal Revenue Code: a Round 2, $52,000 allocation received in 2005, a Round 6, $45,000 allocation in October 2008, a Round 7, $65,000 allocation received in October 2009, a Round 8, $21,000 allocation in February 2011, a Round 9, $50,000 allocation received in February 2012, a Round 10, $30,000 allocation received in April 2013 and a Round 12, $45,000 allocation received in June 2015 and a Round 13, $75,000 allocation awarded in 2016 from the Department of the Treasury’s Community Development Financial Institutions Fund (CDFI). The NMTC program allows individuals and corporate taxpayers to receive a credit against federal income taxes in exchange for making a qualified entity investment in a qualified active low-income community business (QALICB). In order to qualify for the credits various federal requirements must be complied with.
SLDC was required to create Community Development Entities (CDE) so as to demonstrate its mission of serving low-income residents and its accountability to the low income community. The NMTC program requires the credits to be transferred to the QALICB’s by for-profit partnerships or corporations for federal tax purposes. To comply with this provision, SLDC created 60 subsidiary CDEs – St. Louis New Markets Tax Credit Fund, LLC I through XL and 41 – 60 with the intent that each project to be allocated would be assigned its own CDE. All of SLDC’s first 6 allocations have been fully deployed into 37 projects. The Round 12 allocation still has $14,000 available; however two transactions totaling $9,000 are currently in underwriting and expected to close within the month which will complete the funding from Round 12. The recently awarded Round 13 allocation of $75,000 has had three transactions close totaling $28,000 which leaves $47,000 all of which is committed to transactions that are expected to close no later than the 2nd quarter of 2018.
SLDC receives financial assistance from several federal, state, and local government agencies in the form of grants and contracts. The disbursements of funds received under these programs generally require compliance with terms and conditions specified in the contract and grant agreements and are subject to audit by the grantor agencies. Any disallowed claims resulting from such audits could become an SLDC liability. However, in the opinion of their management, any such disallowed claims will not have a material effect on the basic financial statements of SLDC at June 30, 2017.
City of St. Louis, Missouri Notes to Basic Financial Statements
June 30, 2017 (dollars in thousands)
137
24. RISK MANAGEMENT
The City is exposed to various risks of loss related to torts; theft of, damage to, and destruction of assets; errors and omissions; injuries to employees; and natural disasters. The City is self-insured with respect to its obligation to provide workers’ compensation, general liability, unemployment benefits, and prescription drug coverage. Effective February 1, 2003, the City became self-insured for property damage caused by garbage and refuse trucks. The City has sovereign tort immunity from liability and suit for compensatory damages for negligent acts or omissions, except in the case of injuries arising out of the operation of City motor vehicles or caused by the condition of City property. The maximum claim settlement established by state statute for such claims is $300 per person and $2,000 per occurrence. Various claims and legal actions involving the City are presently pending. Additionally, a number of legal suits against SLPD are presently pending for alleged wrongful personal injuries, civil rights violations, and negligence in the line of duty. The City’s policy is to record these claims in its government-wide financial statements when it is probable that a liability has been incurred and the amount can be reasonably estimated.
For workers’ compensation and general liability, the estimated liability for payment of incurred (both reported and unreported) but unpaid claims and claim adjustment expenditures of $60,638 at June 30, 2017, relating to these matters is recorded in the self-insurance internal service fund—PFPC. Of total workers’ compensation liability, $3,708 has been accrued for benefits to be paid for long-term medical care for officers seriously injured in the line of duty. Benefit payments for these cases amounted to approximately $468 for the year ended June 30, 2017. The City obtains periodic funding valuations from a claims-servicing company managing the appropriate level of estimated claims liability. Enterprise funds reimburse PFPC on a cost-reimbursement basis.
The City is self-insured for the prescription drug coverage provided to employees and retirees. The estimated liability for payment of incurred but unpaid claims and claim adjustment expenditures of $1,627 at June 30, 2017 relating to such matters is recorded in the self-insurance internal service fund—health.
Additionally, as of June 30, 2017, the following claims were recorded/accrued within the noted funds because the claims are not accounted for within the PFPC internal service fund; General fund in the amount of $215.
The City maintains a blanket surety bond covering all City employees through PFPC. In addition, the City purchases commercial insurance for property damage for large City buildings and some contents. Damage and liability coverage is applicable to the Airport. There were no significant changes in coverage for the year ended June 30, 2017 and, for the years ended June 30, 2017 and 2016 settlements did not exceed coverage.

City of St. Louis, Missouri Notes to Basic Financial Statements
June 30, 2017 (dollars in thousands)
138
Changes in the self-insurance claims liability for the years ended June 30, 2017 and 2016 are as follows:
Currentyear claims
Beginning and changes Claim Endingbalance in estimates payments balance
2017 $ 51,151 44,448 (34,961) 60,638 2016 50,279 30,650 (29,778) 51,151
Additionally, there is an estimate of general liability claims outstanding of $15,392 which the City Counselor’s office has determined there is a reasonable possibility that a loss contingency may be incurred but no accrual has been made within the government-wide financial statements or fund financial statements because the loss is not both probable and estimateable.
25. GRANT LOAN PROGRAMS
The City’s general fund and grants fund include the activities of the CDA that, among other activities, makes loans to developers under the Housing Implementation Program. This program, which is administered for the City by certain financial institutions, provides funds to rehabilitate housing units for low- and moderate-income families. These loans typically are noninterest bearing, due in 25 years, and secured by a second deed of trust. CDA also made loans under the Urban Development Action Grant (UDAG) program to assist organizations with development projects within the City. These loans typically have a lower-than-market interest rate and payback periods ranging from 10 to 40 years after completion of the projects.
Any funds received from the repayments of these loans are to be spent by the City in accordance with Community Development Block Grant program regulations. Since repayment of the loans is dependent on the success of projects that involve considerable risk, collectability is not assured, and accordingly, the City reflects these loans as an expenditure of the grants fund in the year the loans are made. Any loan repayments are reflected as intergovernmental revenue (or deferred revenue if moneys have not been spent) in the year of receipt.
26. COMPONENT UNIT—SLDC CONDUIT DEBT
SLDC facilitates the issuance of tax-exempt bonds for various private enterprises and government agencies. After the bonds are sold, the proceeds are typically used to purchase real estate or fund capital improvements for the respective entity. Since the entity is responsible for the repayment of the bonds, no liability is established on the SLDC’s books. Therefore, transactions related to the leases and the related bond liability are not presented in SLDC’s basic financial statements.

City of St. Louis, Missouri Notes to Basic Financial Statements
June 30, 2017 (dollars in thousands)
139
27. FUND BALANCE
The following table displays the breakdown of fund balance by purpose in accordance with GASB Statement No. 54:
Redevelopment Capital Other General projects projects Grant governmental
fund fund fund funds fund Total
Nonspendable:Health and welfare $ — — — — 10 10 Parks and recreation — — — — 1 1 Public safety 2,286 — — — — 2,286 Other 1,322 — — — — 1,322
Total 3,608 — — — 11 3,619
Restricted:Redevelopment — 11,359 — — — 11,359 Streets and bridges — — 4,008 — 44 4,052 Public safety — — — 789 348 1,137 Parks and recreation — — 18,928 — 2,232 21,160 Convention and tourism — — 1,584 — — 1,584 Transportation — — — — 6,685 6,685 Debt service 13,145 21,464 5,189 — 13,347 53,145 Capital improvement — — 21,905 — — 21,905 Other — — 3,039 — 1,254 4,293
Total 13,145 32,823 54,653 789 23,910 125,320
Committed:Health and welfare — — — — 12,929 12,929 Streets and bridges — — 5,134 — 668 5,802 Public safety — — 513 — 7,088 7,601 Parks and recreation — — 11,526 — 2,131 13,657 Convention and tourism — — — — 3,358 3,358 Capital improvement — — 21,266 — 4,709 25,975
Total — — 38,439 — 30,883 69,322
Assigned:Redevelopment — 3,381 — — — 3,381 Health and welfare — — — — 14 14 Public safety — — — — 510 510 Parks and recreation — — — — 86 86 Other — — — — 130 130
Total — 3,381 — — 740 4,121
Unassigned 1,529 (17,059) — — (15,530)
Total $ 18,282 36,204 76,033 789 55,544 186,852

City of St. Louis, Missouri Notes to Basic Financial Statements
June 30, 2017 (dollars in thousands)
140
28. TAX ABATEMENTS
The City implemented GASB 77, Tax Abatement Disclosures for the year ended June 30, 2017. The following table represents the abated revenues at June 30, 2017:
Name of Program Chapter 353 - ResidentialChapter 353 - Residential
PILO T Chapter 99 - ResidentialPurpose of Program Tax abatement incentive to improve
blighted property.Tax abatement incentive to improve blighted property.
Tax abatement incentive to improve blighted property and possibly assist in property acquisition and issuance of bonds.
Abated tax Real Property Tax Real Property Tax Real Property TaxAuthorizing Statute/O rdinance
Sections 353.010 - 353.190 RSMo Sections 353.010 - 353.190 RSMo
Sections 99.700 to 99.715 RSMo or Sections 353.010 - 353.190 RSMo; City Ordinance 45977 approved 2/18/52
Eligibility requirement
Determination by governing body that area is blighted. Municipality must hold a public hearing and adopt an ordinance approving the Development Plan and may approve Development Agreement. Property must be transferred to an Urban Redevelopment Corp. for a moment in time.
Determination by governing body that area is blighted. Municipality must hold a public hearing and adopt an ordinance approving the Development Plan and may approve Development Agreement. Property must be transferred to an Urban Redevelopment Corp. for a moment in time.
Establishment of Land Clearance for Redevelopment Authority (LCRA) under Sections 99.300 to 99.715 RSMo. Determination by governing body that area is blighted. LCRA adopts redevelopment plan. Municipality must hold public hearing and adopt ordinance approving redevelopment plan. LCRA may enter redevelopment agreement with redeveloper. Effectuated through either tit le transfer or affidavit, depending upon statutory authority.
How tax is reduced Land assessments based on the year prior to urban redevelopment corp transfer.
Chapter 353 payments in lieu of taxes (PILOTs) established by city ordinance.
Assessments are set at predeveloped levels. PILOTs may be required by ordinance or agreement.
Determination of abated amount
By statute By statute, ordinance and redevelopment agreement (if any)
By statute, ordinance and redevelopment agreement with LCRA (if any)
Recapture provisions None None NoneO ther types of commitments by City
None None None
Gross dollar of reduced tax revenues 954$ 88$ 1,634$
* Dollar amounts per calendar year

City of St. Louis, Missouri Notes to Basic Financial Statements
June 30, 2017 (dollars in thousands)
141
Name of ProgramEnhanced Enterprise Zone Tax
Incentives Chapter 353 - CommercialPlanned Industrial Expansion
(PIE)Purpose of Program Provide tax credits and/or real estate
tax abatement to new or expanding businesses in Enhanced Enterprise Zone.
Tax abatement incentive to improve blighted property.
Tax abatement incentive to improve blighted property and possibly assist in property acquisition and issuance of bonds.
Abated tax Real Property Tax Real Property Tax Real Property Tax
Authorizing Statute/O rdinance
Sections 135.950 to 135.973, RSMo; City Ordinance 67350 approved 12/11/06
Sections 353.010 - 353.190 RSMo
Sections 353.010 - 353.190 RSMo; City Ordinance 54788 approved 12/11/67
Eligibility requirement Establishment of Enhanced Enterprise Zone Board (EEZB) by governing body. EEZB recommends project to governing body. Governing body adopts resolution authorizing project/abatement. EEZB enters redevelopment agreement with redeveloper.
Determination by governing body that area is blighted. Municipality must hold a public hearing and adopt an ordinance approving the Development Plan and may approve Development Agreement. Property must be transferred to an Urban Redevelopment Corp. for a moment in time.
Establishment of Land Clearance for Redevelopment Authority (LCRA) under Sections 99.300 to 99.715 RSMo. Determination by governing body that area is blighted. LCRA adopts redevelopment plan. Municipality must hold public hearing and adopt ordinance approving redevelopment plan. LCRA may enter redevelopment agreement with redeveloper. Effectuated through either tit le transfer or affidavit, depending upon statutory authority.
How tax is reduced City authorizing resolution shall specify the percent of the exemption to be granted, the duration of the exemption to be granted, and the political subdivisions to which such exemption is to apply and any other terms, conditions or stipulations otherwise required.
Land assessments based on the year prior to urban redevelopment corp transfer.
Land assessments based on the year prior to urban redevelopment corp transfer; Chapter 353 PILOT established by city ordinance.
Determination of abated amount
By statute, resolution and redevelopment agreement with EEZB
By statute, ordinance and redevelopment agreement (if any)
By statute, ordinance, and redevelopment agreement with PIEA (if any)
Recapture provisions None None NoneO ther types of commitments by City
None None None
Gross dollar of reduced tax revenues 1,859$ 4,873$ 152$
* Dollar amounts per calendar year

City of St. Louis, Missouri Notes to Basic Financial Statements
June 30, 2017 (dollars in thousands)
142
Name of ProgramChapter 353 - Commercial
PILO T Chapter 99 - Commercial
Chapter 100 - Industrial Revenue Bonds/Merchants &
Manufacturer's Tax CreditPurpose of Program Tax abatement incentive to
improve blighted property.Tax abatement incentive to improve blighted property and possibly assist in property acquisition and issuance of bonds
Tax abatement incentive to provide economic development benefits to municipality.
Abated tax Real Property Tax Real Property Tax Personal and/or Real Property TaxAuthorizing Statute/O rdinance
Sections 353.010 - 353.190 RSMo
Sections 99.700 to 99.715 RSMo or Sections 353.010 - 353.190 RSMo; City Ordinance 45977 approved 2/18/52
Sections 100.010 to 100.200 RSMo
Eligibility requirement Determination by governing body that area is blighted. Municipality must hold a public hearing and adopt an ordinance approving the Development Plan and may approve Development Agreement. Property must be transferred to an Urban Redevelopment Corp. for a moment in time.
Establishment of Land Clearance for Redevelopment Authority (LCRA) under Sections 99.300 to 99.715 RSMo. Determination by governing body that area is blighted. LCRA adopts redevelopment plan. Municipality must hold public hearing and adopt ordinance approving redevelopment plan. LCRA may enter redevelopment agreement with redeveloper. Effectuated through either tit le transfer or affidavit, depending upon statutory authority.
Preparation and approval of an Industrial Development Plan by the governing body of the municipality.
How tax is reduced Chapter 353 payments in lieu of taxes (PILOTs) established by city ordinance.
Assessments are set at predeveloped levels. PILOTs may be required by ordinance or agreement.
T itle of real or personal property to be abated is transferred to tax-exempt governmental body.
Determination of abated amount
By statute, ordinance and redevelopment agreement (if any)
By statute, ordinance and redevelopment agreement with LCRA (if any)
Property is tax exempt by virtue of public ownership; PILOT established by development agreement
Recapture provisions None None by agreementO ther types of commitments by City
None None None
Gross dollar of reduced tax revenues 129$ 6,159$ 995$
* Dollar amounts per calendar year

City of St. Louis, Missouri Notes to Basic Financial Statements
June 30, 2017 (dollars in thousands)
143
29. SUBSEQUENT EVENTS
a. Tax and Revenue Anticipation Notes
The City issues tax and revenue anticipation notes in advance of property tax collections, depositing the proceeds in its general fund. On July 10, 2017, the City issued $66,000 in Tax and Revenue Anticipation Notes payable from the general fund. The notes mature on June 1, 2018 and bear interest at a rate of 3.00% per year.
b. Development and Tax Increment Revenue Notes
Subsequent to June 30, 2017, the City issued development and tax increment revenue notes totaling $2,997 with interest rates of 6.55%.
c. Airport Advance Refunding
On June 30, 2017, the Airport issued $125,410 Series 2017A and $74,715 Series 2017B Revenue Refunding Bonds for the refunding of the 2007A Airport Revenue Refunding Bonds. The Airport completed the advance refunding on July 3, 2017.
d. Economic Development Sales Tax
On April 4, 2017 voters approved a one half cents sales tax which went into effect on October 1, 2017.
e. Property Taxes
The City tax rate levied in November 2017 was $1.5933 per $100 (in dollars) of assessed valuation of which $1.46 (in dollars) is for the general fund and $0.1331 (in dollars) is for the debt service fund.
f. Proposition P Sales Tax
On November 7, 2017, voters passed a one half cent sales tax earmarked for Public Safety. The tax will go into effect April 1, 2018.
g. Scottrade Bonds
In February 2017, the Board of Aldermen approved an ordinance to issue $64,000 in bonds for renovations at the Scottrade Center. Due to litigation, the financing was delayed.
h. Missouri Department of Economic Development Promissory Note
On November 9, 2017, a promissory note was issued to the City by the Missouri Department of Economic Development-Division of Energy in the amount of $979 to fund the upgrade of LED street lighting. The debt will be funded by cost savings.

144
Schedule 1
Variance withFinal Final Budget
Original Revised PositiveBudget Budget Actual (Negative)
REVENUES
Taxes: Gross receipts $ 6,129 6,129 6,372 243 City earnings 171,177 171,177 171,529 352 Franchise 52,619 52,619 49,748 (2,871) Sales 54,610 54,610 52,098 (2,512) Property 59,192 59,192 58,868 (324) Payroll 39,639 39,639 38,115 (1,524) Motor vehicle 3,313 3,313 3,253 (60) Other 637 637 1,004 367
Total taxes 387,316 387,316 380,987 (6,329)
Licenses and permits:Graduated business 6,506 6,506 6,634 128 Cigarette 1,658 1,658 1,721 63 Building division 7,840 7,840 6,658 (1,182) Communication transmission 1,620 1,620 1,767 147 Liquor 559 559 562 3 Other 612 612 587 (25) Motor vehicle 1,373 1,373 1,435 62
Total licenses and permits 20,168 20,168 19,364 (804)
Intergovernmental:Motor fuel tax allocation 8,450 8,450 8,566 116 Juvenile detention center 2,022 2,022 2,048 26 Public safety 6,416 6,416 5,458 (958) Other intergovernmental 374 374 363 (11)
Total intergovernmental 17,262 17,262 16,435 (827)
Charges for services:Parks and recreation 320 320 298 (22) Streets 16,940 16,940 17,040 100 Public safety 5,996 5,996 6,514 518 Health 799 799 779 (20) Fee offices 4,124 4,124 4,119 (5) Other 7 7 2 (5) Services provided to other funds 4,832 4,832 5,083 251
Total charges for services 33,018 33,018 33,835 817
Court fines and forfeitures 3,046 3,046 2,639 (407) Interest - - 1 1 Miscellaneous 2,899 2,899 2,907 8
Total revenues 463,709 463,709 456,168 (7,541)
EXPENDITURES 504,882 504,882 497,467 7,415
Excess of revenues over expenditures (41,173) (41,173) (41,299) (126)
Other financing sources (uses):Transfers in 37,269 37,269 39,799 2,530 Transfer from 27th pay reserve 10,100 10,100 10,136 36 Transfers out (9,854) (9,854) (9,504) 350
Total other financing sources (uses), net 37,515 37,515 40,431 2,916
Excess (deficiency) of revenues andother financing sources overexpenditures and other financing uses $ (3,658) (3,658) (868) 2,790
See accompanying independent auditors' report.
(dollars in thousands)
City of St. Louis, MissouriSchedule of Revenues, Expenditures, and Changes in Fund Balances -
Budget and Actual - General FundUNAUDITED
For the year ended June 30, 2017

145
Schedule 1, Continued
Variance withFinal Actual Final Budget
Original Revised Personal Other Total PositiveBudget Budget Services Expenditures Expenditures (Negative)
General government:
110 Board of Alderman $ 3,126 3,126 2,851 172 3,023 103 120 Mayor's Office 1,912 1,912 1,482 145 1,627 285 123 Department of Personnel 4,087 4,087 3,088 227 3,315 772 124 Registrar 176 176 168 6 174 2 126 Civil Rights Enforcement Agency 338 338 339 3 342 (4) 127 Information Technology Service Agency 6,030 6,030 3,746 2,068 5,814 216 137 Division of the Budget 463 463 455 5 460 3 139 City Counselor 7,743 7,743 4,039 2,475 6,514 1,229 141 Planning and Urban Design 495 495 405 83 488 7 160 Comptroller 6,609 6,595 3,696 2,284 5,980 615 162 Municipal Garage 327 341 302 35 337 4 163 Microfilm Section 316 316 260 30 290 26 170 Supply Commissioner 756 756 697 7 704 52 171 Multigraph Section 956 956 663 222 885 71 330 Tax Equalization Board 11 11 5 - 5 6 333 Recorder of Deeds 2,848 2,848 2,541 321 2,862 (14) 334 Election and Registration 4,016 4,016 2,702 1,337 4,039 (23) 340 Treasurer 738 738 666 39 705 33
Prior year encumbrance 1,964 1,964 - 415 415 1,549
Sub total general government 42,911 42,911 28,105 9,874 37,979 4,932
190 City-Wide Accounts 4,952 4,952 886 3,602 4,488 464 Prior year encumbrance 380 380 - 380 380 -
Sub total city-wide accounts 5,332 5,332 886 3,982 4,868 464
Total general government 48,243 48,243 28,991 13,856 42,847 5,396
Convention and tourism:
930 Soldier's Memorial Building 128 128 123 2 125 3
Total convention and tourism 128 128 123 2 125 3
City of St. Louis, Missouri
(dollars in thousands)
Schedule of Expenditures - Budget and Actual - General Fund
UNAUDITEDFor the year ended June 30, 2017

146
Schedule 1, Continued
Variance withFinal Actual Final Budget
Original Revised Personal Other Total PositiveBudget Budget Services Expenditures Expenditures (Negative)
City of St. Louis, Missouri
(dollars in thousands)
Schedule of Expenditures - Budget and Actual - General Fund
UNAUDITEDFor the year ended June 30, 2017
Parks and recreation:
210 Director of Parks, Recreation and Forestry $ 688 688 617 36 653 35 213 Division of Recreation 1,649 1,649 1,500 129 1,629 20 214 Division of Forestry 8,767 8,767 7,881 739 8,620 147 220 Division of Parks 7,697 7,697 7,351 529 7,880 (183) 225 Soulard Market 229 229 136 80 216 13 250 Tower Grove Park 725 725 - 725 725 -
Prior year encumbrance - - - - - -
Total parks and recreation 19,755 19,755 17,485 2,238 19,723 32
Judicial:
311 Circuit Court (General) 10,231 10,231 5,328 3,774 9,102 1,129 312 Circuit Attorney 7,695 7,695 7,137 522 7,659 36 315 Sheriff 9,415 9,415 8,914 259 9,173 242 316 City Courts 2,679 2,679 1,921 445 2,366 313 318 Public Administrator 75 75 63 - 63 12 320 Probation Department and Juvenile
Detention Center 17,173 17,173 14,770 1,459 16,229 944 321 Drug Court 527 527 - 255 255 272
Prior year encumbrance 1,180 1,180 - 824 824 356
Total judicial 48,975 48,975 38,133 7,538 45,671 3,304
Streets:
510 Director of Streets 1,268 1,268 1,267 44 1,311 (43) 511 Transportation and Traffic Division 10,062 10,062 5,292 4,437 9,729 333 513 Auto Towing and Storage 1,853 1,853 1,601 285 1,886 (33) 514 Street Division 7,184 7,184 5,730 1,587 7,317 (133) 516 Refuse Division 14,680 14,680 8,613 7,093 15,706 (1,026)
Prior year encumbrance - - - - - -
Total streets 35,047 35,047 22,503 13,446 35,949 (902)

147
Schedule 1, Continued
Variance withFinal Actual Final Budget
Original Revised Personal Other Total PositiveBudget Budget Services Expenditures Expenditures (Negative)
City of St. Louis, Missouri
(dollars in thousands)
Schedule of Expenditures - Budget and Actual - General Fund
UNAUDITEDFor the year ended June 30, 2017
Public safety - fire:
611 Fire Department Operations $ 59,651 59,651 57,402 3,258 60,660 (1,009) 612 Firemen's Retirement System 10,489 10,489 10,489 - 10,489 -
Prior year encumbrance 59 59 - 59 59 -
Total public safety - fire 70,199 70,199 67,891 3,317 71,208 (1,009)
Public safety - police:
650 Police Department 134,566 134,566 126,031 13,499 139,530 (4,964) 651 Police Retirement System 28,715 28,715 28,707 - 28,707 8
Prior year encumbrance 53 53 - 11 11 42
Total public safety - police 163,334 163,334 154,738 13,510 168,248 (4,914)
Public safety - other:
610 Director of Public Safety 744 744 543 127 670 74 614 Office of Special Events 194 194 195 - 195 (1) 616 Excise Commissioner 461 461 299 23 322 139 620 Building Commissioner 8,426 8,426 7,876 482 8,358 68 622 Neighborhood Stabilization 2,772 2,772 2,501 132 2,633 139 625 City Emergency Management Agency 203 203 116 42 158 45 632 Medium Security Institution 16,491 16,491 10,657 5,025 15,682 809 633 City Jail 23,562 23,562 16,499 5,976 22,475 1,087 635 Civilian Oversight Board 312 312 250 18 268 44
Prior year encumbrance 27 27 - 19 19 8
Total public safety-other 53,192 53,192 38,936 11,844 50,780 2,412
Health and welfare:
335 Medical Examiner 2,219 2,219 1,005 1,199 2,204 15 800 Director of Human Services 1,547 1,547 1,318 136 1,454 93
Total health and welfare 3,766 3,766 2,323 1,335 3,658 108

148
Schedule 1, Continued
Variance withFinal Actual Final Budget
Original Revised Personal Other Total PositiveBudget Budget Services Expenditures Expenditures (Negative)
City of St. Louis, Missouri
(dollars in thousands)
Schedule of Expenditures - Budget and Actual - General Fund
UNAUDITEDFor the year ended June 30, 2017
Public services:
900 President's Office, Board of Public Services 2,762 2,762 2,211 225 2,436 326 903 Building Operations 17,114 16,519 4,147 11,044 15,191 1,328 910 Equipment Services Division 15,893 16,488 8,041 7,869 15,910 578
Total public services 35,769 35,769 14,399 19,138 33,537 2,232
Debt service:
Principal 13,245 13,249 - 12,606 12,606 643 Interest and fiscal charges 13,229 13,225 - 13,115 13,115 110
Total debt service 26,474 26,474 - 25,721 25,721 753 Total expenditures $ 504,882 504,882 385,522 111,945 497,467 7,415
See accompanying independent auditors' report.

149
Schedule 2
Variance withFinal Final Budget
Original Revised PositiveBudget Budget Actual (Negative)
Revenues:Taxes $ 38,345 38,345 38,345 — Licenses and permits 1 1 1 — Intergovernmental 4,066 4,066 4,066 — Charges for service, net — — — — Court fines and forfeitures — — — — Investment income 8 8 8 — Miscellaneous 2,775 2,775 2,775 —
Total revenues 45,195 45,195 45,195 —
Expenditures:Current:
General government 1,745 1,745 1,553 (192) Convention and tourism — — — — Parks and recreation — — — — Judicial — — — — Streets — — — — Public safety:
Fire — — — — Police — — — — Other — — — —
Health and welfare — — — — Public service — — — — Community Development 22,588 22,588 22,588 —
Capital outlay — — — — Debt service 36,997 36,997 36,997 —
Total expenditures 61,330 61,330 61,138 192
Excess (deficiency) of revenuesover (under) expenditures (16,135) (16,135) (15,943) 192
Other financing sources (uses):Proceeds net of refunding 19,794 19,794 19,794 — Transfers in — — — — Transfers out (3,419) (3,419) (3,476) (57)
16,375 16,375 16,318 (57) Net change in fund balances $ 240 240 375 135
See accompanying independent auditors’ report.
(dollars in thousands)
City of St. Louis, MissouriSchedule of Revenues, Expenditures, and Changes in Fund Balances -
Budget and Actual - Redevelopment Projects Fund
For the year ended June 30, 2017UNAUDITED

Schedule 3 City of St. Louis, Missouri
Notes to Schedule of Revenues, Expenditures, and Changes in Fund Balances Budget and Actual – General Fund and Redevelopment Projects Fund – UNAUDITED
For the Year ended June 30, 2017 (Dollars in thousands)
150
1. EXPLANATION OF BUDGETARY PROCESS
The City prepares annual budgets for the general fund, the redevelopment projects fund, the debt service fund, the capital projects fund, and the following nonmajor special revenue funds: use tax fund, transportation fund, convention and tourism fund, licensed gaming program fund, assessor’s office fund, lateral sewer program fund, public safety trust fund, public safety sales tax fund, parks and recreation and other budgeted special revenue fund. An annual budget is not prepared for the grants major special revenue fund.
The City follows the procedures outlined below in establishing the budgetary data:
1) On or before 60 days prior to the start of each fiscal year, the Budget Director submits to the Board of Estimate and Apportionment (E&A), which consists of the Mayor, the Comptroller, and the President of the Board of Aldermen, for approval and submission to the Board of Aldermen (Board), a proposed annual operating budget for the fiscal year commencing the following July 1. The operating budgets include proposed expenditures and the means of financing them at the sub-fund level. A public hearing is held by E&A in order to afford citizens an opportunity to be heard on the proposed budget. The Board may reduce any item, except amounts fixed by state statute or for the payment of principal or interest of the City debt or for meeting any ordinance obligations, but may not increase such amount nor insert new items. Expenditures may not legally exceed appropriations at the fund level; however, supplemental appropriations may be made by the Board.
2) The annual operating budgets are adopted by the affirmative vote of a majority of the members of the Board and approval by the Mayor on or before the last day of the preceding budget year. In the event the Board has not acted upon the proposed budget ordinance by this time, the budgets, as recommended by E&A or in its absence, the submission by the Budget Director, shall be considered to be adopted and approved by the Board.
3) During the year, with the approval of E&A, the City may transfer part or all of any encumbered appropriation balance among programs within a department, office, or agency, without approval of the Board. Legislative action is required by the Board when the budget for an entire fund is to be increased. The amount of such transfers during the year was not significant.
4) If it is determined that there are revenues in excess of those estimated in the budget that are available for appropriation, the Board may, by ordinance, make supplemental appropriations for the year up to the amount of such excess.
5) At the end of each budget period, all unencumbered appropriated balances lapse, with the exception of appropriations for capital improvements that lapse upon completion of the related capital improvement project.
Schedule 3, Continued City of St. Louis, Missouri
Notes to Schedule of Revenues, Expenditures, and Changes in Fund Balances Budget and Actual – General Fund and Redevelopment Projects Fund – UNAUDITED (continued)
For the year ended June 30, 2017 (Dollars in thousands)
151
2. EXPLANATION OF THE DIFFERENCES BETWEEN THE EXCESS/(DEFICIENCY) OF REVENUES AND OTHER FINANCING SOURCES OVER EXPENDITURES AND OTHER FINANCING USES— BUDGET BASIS AND NET CHANGE IN FUND BALANCE—GAAP BASIS
The City’s budgetary process is based upon accounting for certain transactions on a basis other than accounting principles generally accepted for governmental entities in the United States of America (GAAP). To provide a meaningful comparison of actual results with the budget, the actual results of operations are presented in the Schedule of Revenues, Expenditures, and Changes in Fund Balances—Budget and Actual—General Fund in accordance with the budget basis of accounting.
The major differences between the budget and GAAP bases of accounting are:
1) Revenues are recorded when received in cash (budget), as opposed to when they are measurable and available (GAAP).
2) Expenditures are recorded when paid (budget), as opposed to when the obligation is incurred (GAAP).
3) Certain activities and funds of the general, special revenue, and capital projects fund types are not included in the annual operating budgets adopted by the Board.
Adjustments necessary to reconcile the excess (deficiency) of revenues and other financing sources over expenditures and other financing uses from the GAAP basis to the budget basis of accounting are as follows:
Redevelopment projects
General fund fundBudget basis $ (868) 375Increase (decrease) due to:
Revenue accruals (6,024) 663Expenditure accruals 14,738 26Unbudgeted activities and funds (11,850) —
GAAP basis $ (4,004) 1,064
See accompanying independent auditors’ report.

Schedule 4 City of St. Louis, Missouri
Retirement Systems and Other Postemployment Benefit Plans Required Supplementary Information –
UNAUDITED June 30, 2017
(dollars in thousands)
See accompanying independent auditors’ report. 152
Police Retirement System of St. Louis.
Total Pension Liability 2017 2016 2015 2014 2013 2012 2011 2010 2009 2008
Service Cost 12,618 12,978 12,992 Interest 67,036 66,579 65,906 Difference between expected and actual experience (3,684) (2,041) - (Historical information prior to implementation of GASB 67/68 is not required)Change in benefit - - - Change of assumptions 131,846 16,249 6,650 Benefit payments (62,637) (69,533) (60,973)
Net change in total pension liability 145,179 24,232 24,575 Total pension liability - beginning 944,138 919,906 895,331
Total pension liability - ending (a) 1,089,317$ 944,138$ 919,906$
System Fiduciary Net PositionContributions - employer 30,779 30,600 32,325 Contributions - employee 4,377 4,488 4,438 Net investment income 52,927 (8,325) 48,095 Benefit payments (62,637) (69,533) (60,973) Administrative expenses (1,103) (1,125) (1,096)
Net change in fiduciary net position 24,343 (43,895) 22,789 System fiduciary net position - beginning 684,895 728,790 706,277
System fiduciary net position - ending (b) 709,238$ 684,895$ 729,066$
Net pension liability - ending: (a)-(b) 380,079$ 259,243 190,840$ System's fiduciary net position as a percentage of the
total pension liability 65.11% 72.54% 79.25%Covered-employee payroll* 72,684 72,325 72,151 Net pension liability as a percentage of covered-
employee payroll 522.92% 358.44% 264.50%
* Covered-employee payroll as reported in the October 1, 201X funding valuation report
Schedule of Changes in the Net Pension Liability and Related Ratios - Last Ten Fiscal Years (In Thousands)Fiscal Year End June 30,

Schedule 4, Continued City of St. Louis, Missouri
Retirement Systems and Other Postemployment Benefit Plans Required Supplementary Information –
UNAUDITED June 30, 2017
(dollars in thousands)
See accompanying independent auditors’ report. 153
Police Retirement System of St. Louis, continued
Contributions Contributions as % of in relation to
Covered covered- Actuarially the actuarially Contribution Employee employee determined determined deficiency
Payroll payroll contribution contribution (excess)Fiscal Year Ended June 30,
2017 72,684 42.35% 30,779 30,779 - 2016 72,325 42.31% 30,600 30,600 - 2015 72,151 44.80% 32,325 32,325 - 2014 70,328 41.96% 29,513 32,629 (3,116) 2013 70,077 31.60% 22,146 28,474 (6,328) 2012 67,594 26.80% 18,116 20,037 (1,921) 2011 71,095 21.25% 15,108 17,476 (2,368) 2010 68,573 16.58% 11,368 14,318 (2,950) 2009 63,835 18.99% 12,123 10,384 1,739 2008 62,179 25.95% 16,136 42,289 (26,153)
Valuation Date October 1, 2015Methods and assumptions used to determine contribution rates:
Actuarial Cost Method Entry Age NormalAmortization Method/Period None - aggregate is funded over the future working lifetime of current participantsAsset Valuation Method 5-year smoothed average of market value
Actuarial Assumptions:Investment Rate of Return 7.5%, net of 0.15% administrative expensesInflation 2.5%Projected Salary Increases 3.0% – 6.5%, varying by ageMortality (ordinary) RP-2014 Blue collar projected generally with MP-2015 with 1.15 adjustmentMortality (accidental) 0.03% per year for all ages in addition to ordinary mortalityMortality (disabled) RP-2000 Disabled Retiree Mortality projected to 2018
Notes to Required Supplementary Information for Contributions
Schedule of Contributions - Last Ten Fiscal Years (In Thousands)

Schedule 4, Continued City of St. Louis, Missouri
Retirement Systems and Other Postemployment Benefit Plans Required Supplementary Information –
UNAUDITED June 30, 2017
(dollars in thousands)
See accompanying independent auditors’ report. 154
Firemen’s Retirement System of St Louis
Total Pension Liability 2017 2016 2015 2013 2012 2011 2010 2009 2008 2007
Service Cost - - - Interest 34,916 34,403 34,450 Difference between expected and actual experience (6,984) 15 - Change in benefit - - - (Historical information prior to implementation of GASB 67/68 is not required)Change in assumptions - 43,915 - Refunds (1,278) (1,294) (1,205) Benefit payments (32,155) (33,562) (34,002)
Net change in total pension liability (5,501) 43,477 (757) Total pension liability - beginning 495,019 451,542 452,299
Total pension liability - ending (a) 489,518$ 495,019$ 451,542$
System Fiduciary Net PositionContributions - employer 2,715 - 1,008 Refunds (1,278) (1,294) (1,205) Net investment income 38,228 (10,932) 48,270 Benefit payments (32,155) (33,562) (34,002) Transfer out due to settlement agreement - - (10,279) Transfer from future benefit fund 167 - - Administrative expenses (1,095) (1,594) (1,424)
Net change in fiduciary net position 6,582 (47,382) 2,368 System fiduciary net position - beginning 447,058 494,440 492,222
System fiduciary net position - ending (b) 453,640$ 447,058$ 494,590$
Net pension liability - ending: (a)-(b) 35,878$ 47,961$ (43,048)$ System's fiduciary net position as a percentage of the
total pension liability 92.67% 90.31% 109.53%Covered-employee payroll* 30,219 30,288 29,768 Net pension liability as a percentage of covered-
employee payroll 118.73% 158.35% -144.61%
* Covered-employee payroll as reported in the October 1, 201X funding valuation report
Schedule of Changes in the Net Pension Liability and Related Ratios - Last Ten Fiscal Years (In Thousands)Fiscal Year End June 30,
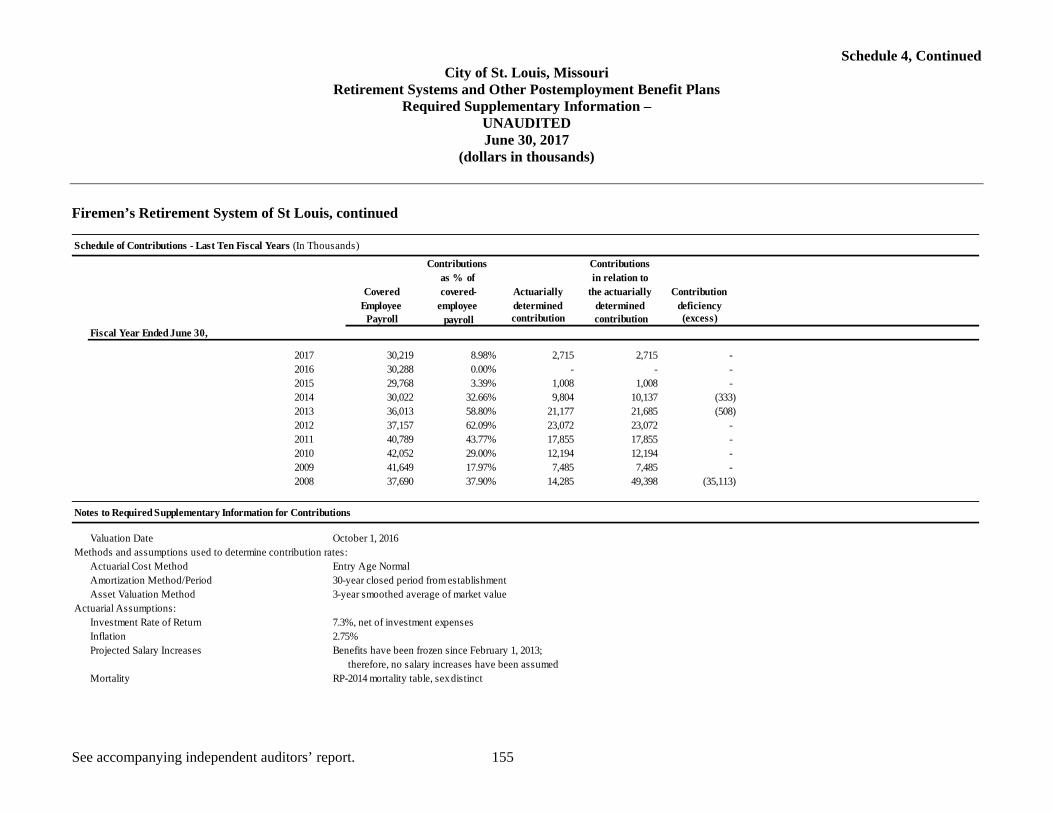
Schedule 4, Continued City of St. Louis, Missouri
Retirement Systems and Other Postemployment Benefit Plans Required Supplementary Information –
UNAUDITED June 30, 2017
(dollars in thousands)
See accompanying independent auditors’ report. 155
Firemen’s Retirement System of St Louis, continued
Contributions Contributions as % of in relation to
Covered covered- Actuarially the actuarially Contribution Employee employee determined determined deficiency
Payroll payroll contribution contribution (excess)Fiscal Year Ended June 30,
2017 30,219 8.98% 2,715 2,715 - 2016 30,288 0.00% - - - 2015 29,768 3.39% 1,008 1,008 - 2014 30,022 32.66% 9,804 10,137 (333) 2013 36,013 58.80% 21,177 21,685 (508) 2012 37,157 62.09% 23,072 23,072 - 2011 40,789 43.77% 17,855 17,855 - 2010 42,052 29.00% 12,194 12,194 - 2009 41,649 17.97% 7,485 7,485 - 2008 37,690 37.90% 14,285 49,398 (35,113)
Valuation Date October 1, 2016Methods and assumptions used to determine contribution rates:
Actuarial Cost Method Entry Age NormalAmortization Method/Period 30-year closed period from establishmentAsset Valuation Method 3-year smoothed average of market value
Actuarial Assumptions:Investment Rate of Return 7.3%, net of investment expensesInflation 2.75%Projected Salary Increases Benefits have been frozen since February 1, 2013;
therefore, no salary increases have been assumedMortality RP-2014 mortality table, sex distinct
Notes to Required Supplementary Information for Contributions
Schedule of Contributions - Last Ten Fiscal Years (In Thousands)

Schedule 4, Continued City of St. Louis, Missouri
Retirement Systems and Other Postemployment Benefit Plans Required Supplementary Information –
UNAUDITED June 30, 2017
(dollars in thousands)
See accompanying independent auditors’ report. 156
Firefighters’ Retirement Plan
Total Pension Liability 2017 2016 2015 2013 2012 2011 2010 2009 2008 2007
Service Cost 6,033 6,227 6,411 Interest 7,215 6,146 4,088 Difference between expected and actual experience 337 1,179 (5,360) Change in benefit - 979 - (Historical information prior to implementation of GASB 67/68 is not required)Change of assumptions - 22,244 - Benefit payments (381) (263) (133)
Net change in total pension liability 13,204 36,512 5,006 Total pension liability - beginning 88,780 52,268 47,262
Total pension liability - ending (a) 101,984$ 88,780$ 52,268$
Plan Fiduciary Net PositionContributions - employer 9,148 8,507 15,825 Contributions - employee 2,919 2,829 2,813 Net investment income 2,892 (843) (92) Benefit payments (381) (263) (133) Administrative expenses (405) (313) (207)
Net change in fiduciary net position 14,173 9,917 18,206 Plan fiduciary net position - beginning 29,776 19,859 1,653
Plan fiduciary net position - ending (b) 43,949$ 29,776$ 19,859$
Net pension liability - ending: (a)-(b) 58,035$ 59,004$ 32,409$ Plan's fiduciary net position as a percentage of the
total pension liability 43.09% 33.54% 37.99%Covered-employee payroll* 36,637 35,531 34,939 Net pension liability as a percentage of covered-
employee payroll 158.41% 166.06% 92.76%
* Covered-employee payroll as reported in the October 1, 201X funding valuation report
Schedule of Changes in the Net Pension Liability and Related Ratios - Last Ten Fiscal Years (In Thousands)Fiscal Year End June 30,

Schedule 4, Continued City of St. Louis, Missouri
Retirement Systems and Other Postemployment Benefit Plans Required Supplementary Information –
UNAUDITED June 30, 2017
(dollars in thousands)
See accompanying independent auditors’ report. 157
Firefighters’ Retirement Plan, continued
Contributions Contributions as % of in relation to
Covered covered- Actuarially the actuarially Contribution Employee employee determined determined deficiency
Payroll payroll contribution contribution (excess)Fiscal Year Ended June 30,
2017 36,637 24.97% 9,148 9,148 - 2016 35,531 23.94% 7,436 8,507 (1,071) 2015 34,939 25.59% 8,942 8,942 - 2014 22,642 30.40% 6,883 6,883 - 201220112010200920082007
Valuation Date October 1, 2016Methods and assumptions used to determine contribution rates:
Actuarial Cost Method Entry Age NormalAmortization Method/Period 30-year closed period from establishmentAsset Valuation Method 5-year smoothed market
Actuarial Assumptions:Investment Rate of Return 7.625%, net of investment expensesInflation 3%Projected Salary Increases Varies based on employee's years of serviceMortality RP-2000 mortality table, sex distinct, with rates projected to 2015
Notes to Required Supplementary Information for Contributions
Schedule of Contributions - Last Ten Fiscal Years (In Thousands)

Schedule 4, Continued City of St. Louis, Missouri
Retirement Systems and Other Postemployment Benefit Plans Required Supplementary Information –
UNAUDITED June 30, 2017
(dollars in thousands)
See accompanying independent auditors’ report. 158
Employees Retirement System of the City of St Louis
2017 2016 2015 2013 2012 2011 2010 2009 2008 2007
Proportion of the net pension liability 83.20% 83.50% 83.90%Proportionate share of the net pension liability 174,115$ 189,264$ 129,712$ Covered-employee payroll 237,354 238,385 237,795 (Historical information prior to implementation of GASB 67/68 is not required)Proportionate share of the net pension liability
as a percentage of its covered-employee payroll 73.36% 79.39% 54.55%Plan fiduciary net position as a percentage of
the total pension liability 78.52% 76.22% 83.54%
Contributions Contributions as % of in relation to
Covered covered- Actuarially the actuarially Contribution Employee employee determined determined deficiency
Payroll payroll contribution contribution (excess)Fiscal Year Ended June 30,
2017 237,354 13.54% 28,534 32,128 (3,594) 2016 238,385 14.87% 31,605 35,436 (3,831) 2015 237,795 15.47% 34,061 36,788 (2,727) 2014 192,141 0.00% 29,601 - 29,601 2013 191,099 13.52% 27,064 25,837 1,227 2012 189,602 13.13% 25,073 24,900 173 2011 197,584 11.67% 24,224 23,049 1,175 2010 204,348 11.34% 22,162 23,164 (1,002) 2009 202,896 12.71% 21,495 25,798 (4,303) 2008 196,375 30.86% 25,159 60,606 (35,447)
Schedule of Proportionate Share of the Net Pension Liability - Last Ten Fiscal Years (In Thousands)Fiscal Year End June 30,
Schedule of Contributions - Last Ten Fiscal Years (In Thousands)

Schedule 4, Continued City of St. Louis, Missouri
Retirement Systems and Other Postemployment Benefit Plans Required Supplementary Information –
UNAUDITED June 30, 2017
(dollars in thousands)
See accompanying independent auditors’ report. 159
Employees Retirement System of the City of St Louis, continued
Valuation Date October 1, 2016Methods and assumptions used to determine contribution rates:
Actuarial Cost Method Entry Age NormalAmortization Method Layered 20-year amortization of unfunded liabilityAsset Valuation Method 5-year smoothed market
Actuarial Assumptions:Investment Rate of Return 7.5%Inflation 2.5Projected Salary Increases 3% plus merit component based on years of serviceMortality RP-2000 Healthy Mortality 3-year set-forward with generational
projections using Scale AA
Notes to Required Supplementary Information for Contributions

Schedule 4, Continued City of St. Louis, Missouri
Retirement Systems and Other Postemployment Benefit Plans Required Supplementary Information –
UNAUDITED June 30, 2017
(dollars in thousands)
See accompanying independent auditors’ report. 160
Other Postemployment Benefits Plan
The following required supplementary information relates to postemployment benefits plan.
UAALUnfunded as a
Actuarial Actuarial PercentageValue of Actuarial Accrued Annual of
Actuarial System Accrued Liability Funded Covered CoveredValuation Assets Liability (UAAL) Ratio Payroll Payroll
Date (a) (b) (b-a) (a/b) (c) (b-a/c)
7/1/15 — 501,968 501,968 0.0 89,182 562.9%7/1/13 — 490,773 490,773 0.0 88,828 552.5 7/1/11 — 443,392 443,392 0.0 93,289 475.3


Nonmajor Governmental Funds
161
Special Revenue Funds Special revenue funds are used to account for specific revenues that are legally restricted to expenditure for particular purposes.
Use Tax – Used to record revenue received from the local use tax and expenditures made to promote health and welfare activities.
Transportation – Used to record sales tax revenue and expenditures for transportation purposes.
Convention and Tourism – Used to record revenue received from the one-cent restaurant tax, 3½% hotel tax, and football admission gross receipts and expenditures made to promote convention and tourism activities.
Licensed Gaming Program – Used to record revenue received from adjusted gross receipts and admissions taxes imposed on riverboat gaming excursion boats.
Assessor’s Office – Used to account for financial assistance received from the State of Missouri, commissions received from the collection of property taxes, and expenditures made to operate the Assessor’s office.
Lateral Sewer Program – Used to account for revenue received from charges on specific residential support within the boundaries of the City of St. Louis and expenditures made to repair lateral sewer service lines leading from the residential properties to any sewer main that is maintained by the Metropolitan St. Louis Sewer District.
Collector of Revenue – Used to account for operating receipts and disbursements of the Collector of Revenue’s office.
License Collector – Used to account for the operating receipts and disbursements of the License Collector’s office.
Public Safety Trust Fund – Used to account for revenues derived from an increase in the graduated business license to be used for enhanced public safety.
Public Safety Sales Tax – Used to account for revenues received from an increase of sales tax to be used for public safety.
Parks and Recreation – Used to account for revenues designated for parks and recreation.
Other Budgeted Special Revenue – Used to account for the activities of other less significant special revenue sources for which annual budgets are adopted.
Other Nonbudgeted Special Revenue – Used to account for the activities of other less significant special revenue sources for which annual budgets are not adopted.
Debt Service Fund The debt service fund is used to account for the accumulation of resources for, and the payment of, long-term debt principal, interest, and related costs.
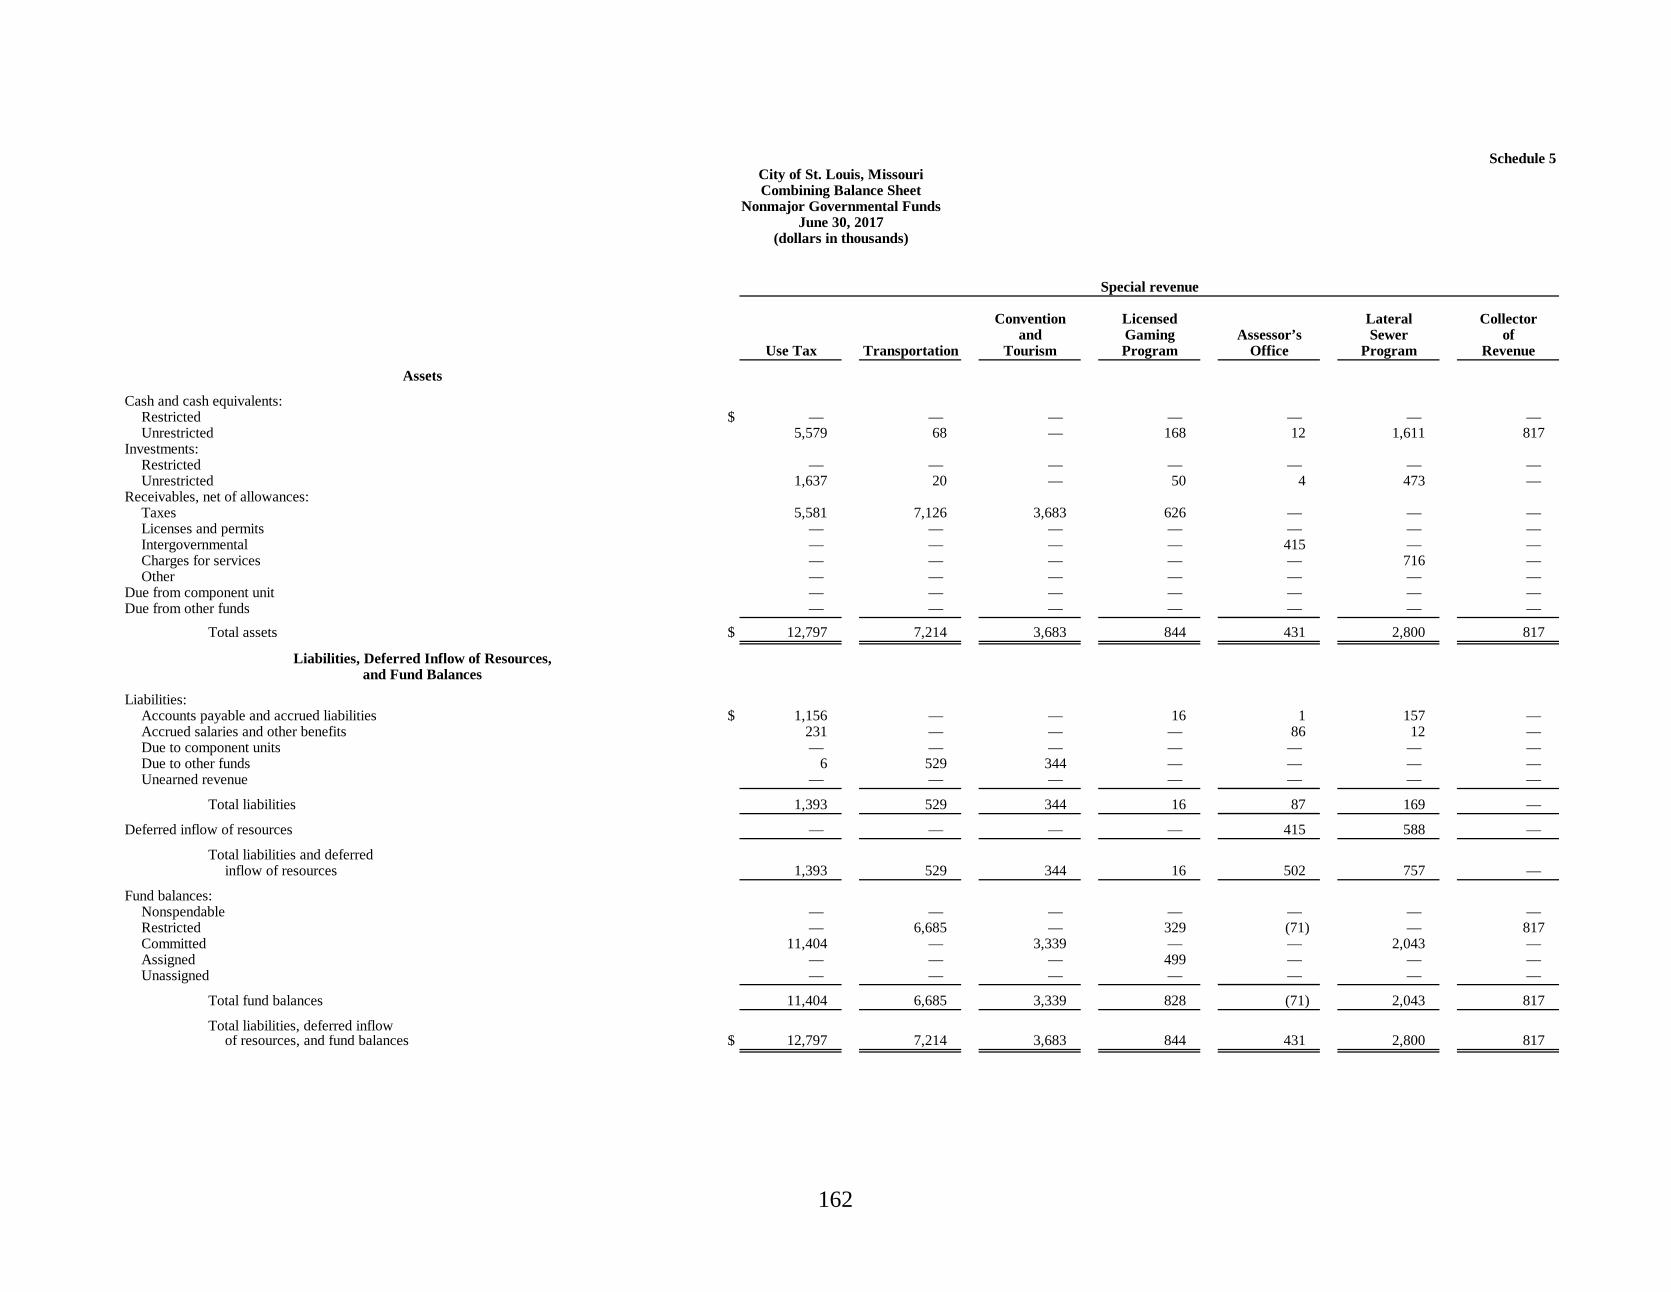
162
Schedule 5City of St. Louis, Missouri Combining Balance Sheet
Nonmajor Governmental Funds June 30, 2017
(dollars in thousands)
Special revenue
Convention Licensed Lateral Collectorand Gaming Assessor’s Sewer of
Use Tax Transportation Tourism Program Office Program Revenue
Assets
Cash and cash equivalents:Restricted $ — — — — — — — Unrestricted 5,579 68 — 168 12 1,611 817
Investments:Restricted — — — — — — — Unrestricted 1,637 20 — 50 4 473 —
Receivables, net of allowances:Taxes 5,581 7,126 3,683 626 — — — Licenses and permits — — — — — — — Intergovernmental — — — — 415 — — Charges for services — — — — — 716 — Other — — — — — — —
Due from component unit — — — — — — — Due from other funds — — — — — — —
Total assets $ 12,797 7,214 3,683 844 431 2,800 817
Liabilities, Deferred Inflow of Resources, and Fund Balances
Liabilities:Accounts payable and accrued liabilities $ 1,156 — — 16 1 157 — Accrued salaries and other benefits 231 — — — 86 12 — Due to component units — — — — — — — Due to other funds 6 529 344 — — — — Unearned revenue — — — — — — —
Total liabilities 1,393 529 344 16 87 169 —
Deferred inflow of resources — — — — 415 588 —
Total liabilities and deferredinflow of resources 1,393 529 344 16 502 757 —
Fund balances:Nonspendable — — — — — — — Restricted — 6,685 — 329 (71) — 817 Committed 11,404 — 3,339 — — 2,043 — Assigned — — — 499 — — — Unassigned — — — — — — —
Total fund balances 11,404 6,685 3,339 828 (71) 2,043 817
Total liabilities, deferred inflowof resources, and fund balances $ 12,797 7,214 3,683 844 431 2,800 817

163
Schedule 5, ContinuedCity of St. Louis, MissouriCombining Balance Sheet
Nonmajor Governmental FundsJune 30, 2017
(dollars in thousands)
Special revenueOther Other Total
Public Public Parks Budgeted Nonbudgeted Total Debt OtherLicense Safety Safety and Special Special Special Service Governmental
Collector Trust Sales Tax Recreation Revenue Revenue Revenue Fund Fund
Assets
Cash and cash equivalents:Restricted $ — — — 1,373 — — 1,373 7,835 9,208 Unrestricted 1,949 74 775 1,616 4,311 3,861 20,841 — 20,841
Investments: — Restricted — — — 2,694 — — 2,694 500 3,194 Unrestricted — 22 227 474 1,261 1,085 5,253 — 5,253
Receivables, net of allowances: — Taxes — — 3,561 890 1,382 — 22,849 7,226 30,075 Licenses and permits — 167 — — 14 — 181 — 181 Intergovernmental — — — — 176 — 591 — 591 Charges for services — — — — 577 6 1,299 — 1,299 Other — — — — 266 272 538 — 538
Due from component unit — — — — — — — — — Due from other funds — — — — — — — — —
Total assets $ 1,949 263 4,563 7,047 7,987 5,224 55,619 15,561 71,180
Liabilities, Deferred Inflow of Resources,and Fund Balances
Liabilities:Accounts payable and accrued liabilities $ — — 96 75 154 117 1,772 — 1,772 Accrued salaries and other benefits — 9 1 81 138 — 558 — 558 Due to component units — — — — 48 95 143 — 143 Due to other funds — 534 142 — — 1,555 — 1,555 Unearned revenue — — — — 2,406 272 2,678 — 2,678
Total liabilities — 9 631 298 2,746 484 6,706 — 6,706
Deferred inflow of resources — 64 — — 657 — 1,724 7,206 8,930
Total liabilities and deferredinflow of resources — 73 631 298 3,403 484 8,430 7,206 15,636
Fund balances:Nonspendable — — — — — 11 11 — 11 Restricted 1,949 — — 4,940 (125) 1,031 15,555 8,355 23,910 Committed — 190 3,932 1,809 4,617 3,549 30,883 — 30,883 Assigned — — — — 92 149 740 — 740 Unassigned — — — — — — — —
Total fund balances 1,949 190 3,932 6,749 4,584 4,740 47,189 8,355 55,544
Total liabilities, deferred inflowof resources, and fund balances $ 1,949 263 4,563 7,047 7,987 5,224 55,619 15,561 71,180
See accompanying independent auditors’ report.

164
Schedule 6City of St. Louis, Missouri
Combining Statements of Revenues, Expenditures, and Changes in Fund Balances Nonmajor Governmental Funds
Year ended June 30, 2017 (dollars in thousands)
Special revenue
Convention Licensed Lateral Collectorand Gaming Assessor’s Sewer of
Use Tax Transportation Tourism Program Office Program Revenue
Revenues:Taxes $ 29,585 39,725 15,155 6,712 2,365 — — Licenses and permits — — — — — — — Intergovernmental — — — — 448 — — Charges for services, net — — — — 2 2,645 7,707 Investment income (8) — — — — (2) 16 Miscellaneous 262 — — — — — 246
Total 29,839 39,725 15,155 6,712 2,815 2,643 7,969
Expenditures:General government — — 165 — 4,221 — 8,215 Parks and recreation — — — — — — — Judicial — — — — — — — Streets 621 — — — — — — Public safety:
Fire — — — 19 — — — Police 8,538 — — 2,700 — — — Other 3,236 — — — — — —
Health and welfare 17,449 — — — — — — Public services — 39,052 — — — 2,366 — Capital outlay 6 — — — — — — Debt service: —
Principal — — — — — — — Interest and fiscal charges — — — — — — — Advance refunding escrow — — — — — — —
Total expenditures 29,850 39,052 165 2,719 4,221 2,366 8,215
Excess (deficiency) of revenues over expenditures (11) 673 14,990 3,993 (1,406) 277 (246)
Other financing sources (uses):Issuance of general obligation bonds — — — — — — — Payment to refunded escrow agent — — — — — — — Premium on bonds — — — — — — — Transfers in — 363 486 — 1,600 — — Transfers out (606) — (15,306) (4,400) (48) (6) (79)
Total other financing sources (uses), net (606) 363 (14,820) (4,400) 1,552 (6) (79)
Net change in fund balances (617) 1,036 170 (407) 146 271 (325)
Fund balances:Beginning of year 12,021 5,649 3,169 1,235 (217) 1,772 1,142 End of year $ 11,404 6,685 3,339 828 (71) 2,043 817

165
Schedule 6, ContinuedCity of St. Louis, Missouri
Combining Statements of Revenues, Expenditures, and Changes in Fund BalancesNonmajor Governmental Funds
Year ended June 30, 2017(dollars in thousands)
Other Other TotalPublic Public Parks Budgeted Nonbudgeted Total Debt Other
License Safety Safety and Special Special Special Service GovernmentalCollector Trust Sales Tax Recreation Revenue Revenue Revenue Fund Fund
Revenues:Taxes $ — — 19,293 4,799 16,380 — 134,014 6,596 140,610 Licenses and permits — 2,998 — — 3,918 3 6,919 — 6,919 Intergovernmental — — — — 759 58 1,265 — 1,265 Charges for services, net 1,840 — — 12 3,836 774 16,816 — 16,816 Investment income — — (2) (7) (6) (5) (14) 34 20 Miscellaneous — — 646 2,000 2,538 1,762 7,454 — 7,454
Total 1,840 2,998 19,937 6,804 27,425 2,592 166,454 6,630 173,084
Expenditures:General government 1,833 187 — — 1,546 362 16,529 — 16,529 Parks and recreation — — — 3,890 709 101 4,700 — 4,700 Judicial — 363 1 — 2,235 353 2,952 — 2,952 Streets — — — — 277 45 943 — 943 Public safety:
Fire — — 1,275 — — 51 1,345 — 1,345 Police — 2,300 9,571 — 27 (235) 22,901 — 22,901 Other — — 878 — 3,332 1,650 9,096 — 9,096
Health and welfare — — — — 636 39 18,124 — 18,124 Public services — — — 436 27 41,881 — 41,881 Capital outlay — — — 655 64 — 725 — 725 Debt service:
Principal — — 3,983 2,010 287 — 6,280 4,450 10,730 Interest and fiscal charges — — 5,393 985 83 — 6,461 731 7,192 Advance refunding escrow — — — — — — — — —
Total expenditures 1,833 2,850 21,101 7,540 9,632 2,393 131,937 5,181 137,118
Excess (deficiency) of revenues over expenditures 7 148 (1,164) (736) 17,793 199 34,517 1,449 35,966
Other financing sources (uses):Issuance of general obligation bonds — — — 42,990 — — 42,990 42,990 Payment to refunded escrow agent — — — (44,161) — (44,161) (44,161) Premium on bonds — — — 4,878 — — 4,878 4,878 Transfers in — — 224 456 890 — 4,019 3 4,022 Transfers out (20) (7) — (135) (18,316) (55) (38,978) — (38,978)
Total other financing sources (uses), net (20) (7) 224 4,028 (17,426) (55) (31,252) 3 (31,249)
Net change in fund balances (13) 141 (940) 3,292 367 144 3,265 1,452 4,717
Fund balances:Beginning of year 1,962 49 4,872 3,457 4,217 4,596 43,924 6,903 50,827 End of year $ 1,949 190 3,932 6,749 4,584 4,740 47,189 8,355 55,544
See accompanying independent auditors’ report.

166
Schedule 7
Variance withFinal Final Budget
Original Revised PositiveBudget Budget Actual (Negative)
Revenues:Taxes $ 29,500 29,500 28,443 1,057 Licenses and permits — — — — Intergovernmental — — — — Charges for service, net — — — — Court fines and forfeitures — — — — Investment income — — — — Miscellaneous 25 25 282 (257)
Total revenues 29,525 29,525 28,725 800
Expenditures:Current:
General government — — — — Convention and tourism — — — — Parks and recreation — — — — Judicial — — — — Streets 742 742 650 92 Public safety:
Fire — — — — Police 8,538 8,538 8,538 — Other 3,238 3,267 3,257 10 Health and welfare 25,834 25,805 18,108 7,697 Public service — — — —
Capital outlay — — — — Debt service — — — —
Total expenditures 38,352 38,352 30,553 7,799
Excess (deficiency) of revenuesover (under) expenditures (8,827) (8,827) (1,828) 8,599
Other financing sources (uses):Transfers in — — — — Transfers out (500) (500) (500) —
(500) (500) (500) — Net change in fund balances $ (9,327) (9,327) (2,328) 8,599
See accompanying independent auditors’ report.
(dollars in thousands)For the year ended June 30, 2017
City of St. Louis, MissouriUse Tax Special Revenue Fund - Nonmajor Fund
Schedule of Revenues, Expenditures, and Changes in Fund Balances -Budget and Actual

167
Schedule 8
Variance withFinal Final Budget
Original Revised PositiveBudget Budget Actual (Negative)
Revenues:Taxes $ 44,329 44,329 38,777 (5,552) Licenses and permits — — — — Intergovernmental — — — — Charges for service, net — — — — Court fines and forfeitures — — — — Investment income — — — — Miscellaneous — — — —
Total revenues 44,329 44,329 38,777 (5,552)
Expenditures:Current:
General government — — — — Convention and tourism — — — — Parks and recreation — — — — Judicial — — — — Streets — — — — Public safety:
Fire — — — — Police — — — — Other — — — —
Health and welfare — — — — Public service 44,329 44,329 39,052 5,277
Capital outlay — — — — Debt service — — — —
Total expenditures 44,329 44,329 39,052 5,277
Excess (deficiency) of revenuesover (under) expenditures — — (275) (275)
Other financing sources (uses):Transfers in — — 363 363 Transfers out — — — —
— — 363 363 Net change in fund balances $ — — 88 88
See accompanying independent auditors’ report.
(dollars in thousands)For the year ended June 30, 2017
City of St. Louis, MissouriTransportation Special Revenue Fund - Nonmajor Fund
Schedule of Revenues, Expenditures, and Changes in Fund Balances -Budget and Actual

168
Schedule 9
Variance withFinal Final Budget
Original Revised PositiveBudget Budget Actual (Negative)
Revenues:Taxes $ 15,113 15,113 14,985 (128) Licenses and permits — — — — Intergovernmental — — — — Charges for service, net — — — — Court fines and forfeitures — — — — Investment income — — — — Miscellaneous — — — —
Total revenues 15,113 15,113 14,985 (128)
Expenditures:Current:
General government 165 165 165 — Convention and tourism — — — — Parks and recreation — — — — Judicial — — — — Streets — — — — Public safety:
Fire — — — — Police — — — — Other — — — —
Health and welfare — — — — Public service — — — —
Capital outlay — — — — Debt service — — — —
Total expenditures 165 165 165 —
Excess (deficiency) of revenuesover (under) expenditures 14,948 14,948 14,820 (128)
Other financing sources (uses):Transfers in — — 486 (486) Transfers out (15,241) (15,306) (15,306) —
(15,241) (15,306) (14,820) (486) Net change in fund balances $ (293) (358) — (614)
See accompanying independent auditors’ report.
(dollars in thousands)For the year ended June 30, 2017
City of St. Louis, MissouriConvention and Tourism Special Revenue Fund - Nonmajor Fund
Schedule of Revenues, Expenditures, and Changes in Fund Balances -Budget and Actual

169
Schedule 10
Variance withFinal Final Budget
Original Revised PositiveBudget Budget Actual (Negative)
Revenues:Taxes $ 6,700 6,700 6,702 2 Licenses and permits — — — — Intergovernmental — — — — Charges for service, net — — — — Court fines and forfeitures — — — — Investment income — — — — Miscellaneous — — — —
Total revenues 6,700 6,700 6,702 2
Expenditures:Current:
General government — — — — Convention and tourism — — — — Parks and recreation — — — — Judicial — — — — Streets — — — — Public safety:
Fire 25 25 3 22 Police 2,700 2,700 2,700 — Other — — — —
Health and welfare — — — — Public service — — — —
Capital outlay — — Debt service — — — —
Total expenditures 2,725 2,725 2,703 22
Excess (deficiency) of revenuesover (under) expenditures 3,975 3,975 3,999 24
Other financing sources (uses):Transfers in — — — — Transfers out (4,400) (4,400) (4,400) —
(4,400) (4,400) (4,400) — Net change in fund balances $ (425) (425) (401) 24
See accompanying independent auditors’ report.
(dollars in thousands)For the year ended June 30, 2017
City of St. Louis, MissouriLicensed Gaming Program Special Revenue Fund - Nonmajor Fund
Schedule of Revenues, Expenditures, and Changes in Fund Balances -Budget and Actual

170
Schedule 11
Variance withFinal Final Budget
Original Revised PositiveBudget Budget Actual (Negative)
Revenues:Taxes $ 2,177 2,177 2,365 188 Licenses and permits — — — — Intergovernmental 436 436 448 12 Charges for service, net 5 5 2 (3) Court fines and forfeitures — — — — Investment income — — — — Miscellaneous — — — —
Total revenues 2,618 2,618 2,815 197
Expenditures:Current:
General government 4,579 4,579 4,399 180 Convention and tourism — — — — Parks and recreation — — — — Judicial — — — — Streets — — — — Public safety:
Fire — — — — Police — — — — Other — — — —
Health and welfare — — — — Public service — — — —
Capital outlay — — — — Debt service — — — —
Total expenditures 4,579 4,579 4,399 180
Excess (deficiency) of revenuesover (under) expenditures (1,961) (1,961) (1,584) 377
Other financing sources (uses):Transfers in 1,950 1,950 1,600 (350) Transfers out — — — —
1,950 1,950 1,600 (350) Net change in fund balances $ (11) (11) 16 27
See accompanying independent auditors’ report.
(dollars in thousands)For the year ended June 30, 2017
City of St. Louis, MissouriAssessor's Office Special Revenue Fund - Nonmajor Fund
Schedule of Revenues, Expenditures, and Changes in Fund Balances -Budget and Actual

171
Schedule 12
Variance withFinal Final Budget
Original Revised PositiveBudget Budget Actual (Negative)
Revenues:Taxes $ — — — — Licenses and permits — — — — Intergovernmental — — — — Charges for service, net 2,690 2,690 2,639 (51) Court fines and forfeitures — — — — Investment income — — — — Miscellaneous — — — —
Total revenues 2,690 2,690 2,639 (51)
Expenditures:Current:
General government — — — — Convention and tourism — — — — Parks and recreation — — — — Judicial — — — — Streets — — — — Public safety:
Fire — — — — Police — — — — Other — — — —
Health and welfare — — — — Public service 2,748 2,748 2,700 48
Capital outlay — — — — Debt service — — — —
Total expenditures 2,748 2,748 2,700 48
Excess (deficiency) of revenuesover (under) expenditures (58) (58) (61) (3)
Other financing sources (uses):Transfers in — — — — Transfers out — — — —
— — — — Net change in fund balances $ (58) (58) (61) (3)
See accompanying independent auditors’ report.
(dollars in thousands)For the year ended June 30, 2017
City of St. Louis, MissouriLateral Sewer Program Special Revenue Fund - Nonmajor Fund
Schedule of Revenues, Expenditures, and Changes in Fund Balances -Budget and Actual

172
Schedule 13
Variance withFinal Final Budget
Original Revised PositiveBudget Budget Actual (Negative)
Revenues:Taxes $ — — — — Licenses and permits 2,992 2,992 3,042 50 Intergovernmental — — — — Charges for service, net — — — — Court fines and forfeitures — — — — Investment income — — — — Miscellaneous — — — —
Total revenues 2,992 2,992 3,042 50
Expenditures:Current:
General government 295 295 198 97 Convention and tourism — — — — Parks and recreation — — — — Judicial 443 443 394 49 Streets — — — — Public safety:
Fire — — — — Police 2,300 2,300 2,300 — Other — — — —
Health and welfare — — — — Public service — — — —
Capital outlay — — — — Debt service — — — —
Total expenditures 3,038 3,038 2,892 146
Excess (deficiency) of revenuesover (under) expenditures (46) (46) 150 196
Other financing sources (uses):Transfers in — — — — Transfers out — — — —
— — — — Net change in fund balances $ (46) (46) 150 196
See accompanying independent auditors’ report.
(dollars in thousands)For the year ended June 30, 2017
City of St. Louis, MissouriPublic Safety Special Revenue Fund - Nonmajor Fund
Schedule of Revenues, Expenditures, and Changes in Fund Balances -Budget and Actual

173
Schedule 14
Variance withFinal Final Budget
Original Revised PositiveBudget Budget Actual (Negative)
Revenues:Taxes $ 19,768 19,768 18,848 (920) Licenses and permits — — — — Intergovernmental — — — — Charges for service, net — — — — Court fines and forfeitures — — — — Investment income — — — — Miscellaneous — — — —
Total revenues 19,768 19,768 18,848 (920)
Expenditures:Current:
General government — — — — Convention and tourism — — — — Parks and recreation — — — — Judicial 24 24 11 13 Streets — — — — Public safety:
Fire 1,275 1,275 1,275 — Police 9,572 9,572 9,572 — Other 1,735 1,735 900 835
Health and welfare — — — — Public service — — — —
Capital outlay — — — — Debt service 8,728 8,728 8,729 (1)
Total expenditures 21,334 21,334 20,487 847
Excess (deficiency) of revenuesover (under) expenditures (1,566) (1,566) (1,639) (73)
Other financing sources (uses):Transfers in — — 223 223 Transfers out — — — —
— — 223 223 Net change in fund balances $ (1,566) (1,566) (1,416) 150
See accompanying independent auditors’ report.
(dollars in thousands)For the year ended June 30, 2017
City of St. Louis, MissouriCity Public Safety Sales Tax Special Revenue Fund - Nonmajor FundSchedule of Revenues, Expenditures, and Changes in Fund Balances -
Budget and Actual

174
Schedule 15
Variance withFinal Final Budget
Original Revised PositiveBudget Budget Actual (Negative)
Revenues:Taxes $ 4,923 4,923 4,689 (234) Licenses and permits — — — — Intergovernmental — — — — Charges for service, net — — 12 12 Court fines and forfeitures — — — — Investment income — — 1 1 Miscellaneous 2,000 2,000 2,000 —
Total revenues 6,923 6,923 6,702 (221)
Expenditures:Current:
General government — — — — Convention and tourism — — — — Parks and recreation 4,732 4,732 4,023 709 Judicial — — — — Streets — — — — Public safety:
Fire — — — — Police — — — — Other — — — —
Health and welfare — — — — Public service — — — —
Capital outlay — — — — Debt service 3,274 3,274 2,995 279
Total expenditures 8,006 8,006 7,018 988
Excess (deficiency) of revenuesover (under) expenditures (1,083) (1,083) (316) 767
Other financing sources (uses):Transfers in 400 400 456 56 Transfers out — — (117) (117)
400 400 339 (61) Net change in fund balances $ (683) (683) 23 706
See accompanying independent auditors’ report.
(dollars in thousands)For the year ended June 30, 2017
City of St. Louis, MissouriParks & Recreation Special Revenue Fund - Nonmajor Fund
Schedule of Revenues, Expenditures, and Changes in Fund Balances -Budget and Actual

175
Schedule 16City of St. Louis, Missouri
Other Budgeted Special Revenue Fund - Nonmajor FundSchedule of Revenues, Expenditures, and Changes in Fund Balances -
Budget and ActualFor the year ended June 30, 2017
(dollars in thousands)
Variance withFinal Final Budget
Original Revised PositiveBudget Budget Actual (Negative)
Revenues:Taxes $ 13,920 16,620 16,526 (94) Licenses and permits 4,622 4,622 3,907 (715) Intergovernmental 887 887 768 (119) Charges for service, net 3,496 3,496 4,102 606 Court fines and forfeitures 1,160 1,160 1,152 (8) Investment income — — — — Miscellaneous 3,220 3,220 2,145 (1,075)
Total revenues 27,305 30,005 28,600 (1,405)
Expenditures:Current:
General government 1,833 1,833 1,613 220 Convention and tourism — — — — Parks and recreation 1,176 1,176 713 463 Judicial 2,641 2,641 2,213 428 Streets 370 370 314 56 Public safety:
Fire — — — — Police 900 900 30 870 Other 4,057 4,057 3,601 456
Health and welfare 943 943 650 293 Public service 889 992 282 710
Capital outlay — — — — Debt service — — — —
Total expenditures 12,809 12,912 9,416 3,496
Excess (deficiency) of revenuesover (under) expenditures 14,496 17,093 19,184 2,091
Other financing sources (uses):Transfers in 540 540 580 40 Transfers out (16,890) (19,590) (19,449) 141
(16,350) (19,050) (18,869) 181 Net change in fund balances $ (1,854) (1,957) 315 2,272
See accompanying independent auditors’ report.

176
Schedule 17City of St. Louis, Missouri
Debt Service Fund – Nonmajor FundSchedule of Revenues, Expenditures, and Changes in Fund Balances –
Budget and ActualYear ended June 30, 2017
(dollars in thousands)
Variance withFinal Final Budget
Original Revised PositiveBudget Budget Actual (Negative)
Revenues:Taxes $ 6,452 6,452 6,571 119 Licenses and permits — — — — Intergovernmental — — — — Charges for service, net — — — — Court fines and forfeitures — — — — Investment income 18 18 39 21 Miscellaneous — — — —
Total revenues 6,470 6,470 6,610 140
Expenditures:Current:
General government 40 40 40 — Convention and tourism — — — — Parks and recreation — — — — Judicial — — — — Streets — — — — Public safety:
Fire — — — — Police — — — — Other — — — —
Health and welfare — — — — Public service — — — —
Capital outlay — — — — Debt service 3,609 5,230 5,181 49
Total expenditures 3,649 5,270 5,221 49
Excess (deficiency) of revenuesover (under) expenditures 2,821 1,200 1,389 189
Other financing sources (uses):Transfers in — — 3 3 Transfers out — — — —
— — 3 3 Net change in fund balances $ 2,821 1,200 1,392 192
See accompanying independent auditors’ report.

177
Schedule 18City of St. Louis, Missouri
Capital Projects Fund – Major FundSchedule of Revenues, Expenditures, and Changes in Fund Balances –
Budget and ActualYear ended June 30, 2017
(dollars in thousands)
Variance withFinal Final Budget
Original Revised PositiveBudget Budget Actual (Negative)
Revenues:Taxes $ 24,428 24,428 23,256 (1,172) Licenses and permits — — — — Intergovernmental 630 630 630 — Charges for service, net — — — — Court fines and forfeitures — — — — Investment income — — (11) (11) Miscellaneous 901 901 921 20
Total revenues 25,959 25,959 24,796 (1,163)
Expenditures:Current:
General government 906 664 197 467 Convention and tourism — — — — Parks and recreation 4,405 4,572 1,508 3,064 Judicial — — — — Streets 7,838 8,656 5,322 3,334 Public safety:
Fire — — — — Police — — — — Other — — — —
Health and welfare — — — — Public service 13,290 13,223 3,202 10,021
Capital outlay 24,838 29,718 9,067 20,651 Debt service 21,618 21,471 21,267 204
Total expenditures 72,895 78,304 40,563 37,741
Excess (deficiency) of revenuesover (under) expenditures (46,936) (52,345) (15,767) 36,578
Other financing sources (uses):Sale of general fixed assets 400 400 190 (210) Transfers in 14,763 17,463 18,393 930 Transfers out (3,395) (3,386) (4,320) (934)
11,768 14,477 14,263 (214) Net change in fund balances $ (35,168) (37,868) (1,504) 36,364
See accompanying independent auditors’ report.

178
Schedule 19City of St. Louis, Missouri
Schedule of Reconciling Items Between Change in Fund Balances—Budget Basis and Change in Fund Balances—GAAP BasisYear ended June 30, 2017
(dollars in thousands)
PublicLicensed Lateral Safety Public Other Budgeted Debt Capital
Convention Gaming Assessor’s Sewer Trust Safety Parks and Special Service ProjectsUse Tax Transportation and Tourism Program Office Program Fund Sales Tax Recreation Revenue Fund Fund
Net change in fund balances—budget basis $ (2,328) 88 — (401) 16 (61) 150 (1,416) 23 315 1,392 (1,504)
Differences—budge t to GAAP:Revenues are recorded when
received in cash on a budget basis.However, revenues are recorded whenmeasurable and available ona GAAP basis. 1,114 948 170 10 — 4 (44) 1,090 107 (212) 21 599
Expenditures are recorded whenpaid in cash on a budget basis.However, expenditures are recordedwhen the obligation is incurredon a GAAP basis. 597 — — (16) 130 328 35 (614) 115 2,670 39 (22)
Certain activities and accounts,which are included within thefunds on a GAAP basis, are notincluded within the annualoperating budgets adoptedby the Board of Alderman. — — — — — — — — 3,047 (2,406) — 13,415
Net change in fund balances—GAAP basis $ (617) 1,036 170 (407) 146 271 141 (940) 3,292 367 1,452 12,488
See accompanying independent auditors’ report.

Internal Service Funds
179
Internal service funds are used to account for the financing of goods or services provided by one department or agency to other departments or agencies of a government, or to other governments, on a cost-reimbursement basis.
Public Facilities Protection Corporation – Used to account for payment of workers’ compensation and various other claims against legal actions on behalf of other funds.
Mailroom Services – Used to account for mail handling services provided to other funds.
Health – Used to account for payment of prescription drug claims for participants. Equipment Services – Used to account for fuel services provided to other funds.

180
Schedule 20City of St. Louis, Missouri
Combining Statement of Net PositionInternal Service Funds
June 30, 2017(dollars in thousands)
Public FacilitiesProtection Mailroom Equipment
Corporation Services Health Services Total
AssetsCurrent assets:
Cash and cash equivalents – unrestricted $ 2,212 — 4,555 217 6,984 Investments – unrestricted — — 1,337 64 1,401
Receivables, net of allowances:Charges for services — 4 791 — 795 Prepaid assets 1,322 23 — — 1,345 Due from other funds 6,708 5 166 309 7,188 Advance from other funds 48,769 — — — 48,769
Total current assets 59,011 32 6,849 590 66,482
Noncurrent assets:Capital assets — 146 — — 146
Less accumulated depreciation — (91) — — (91)
Total capital assets (net ofaccumulated depreciation) — 55 — — 55
Total assets 59,011 87 6,849 590 66,537
Liabilities
Current liabilities:Accounts payable and accrued liabilities — 38 — 167 205 Due to other funds — 36 — — 36 Claims payable 59,011 — 1,627 — 60,638
Total current liabilities 59,011 74 1,627 167 60,879
Total liabilities 59,011 74 1,627 167 60,879
Net Position
Net investment in capital assets — 55 — — 55 Unrestricted — (42) 5,222 423 5,603
Total net position $ — 13 5,222 423 5,658
See accompanying independent auditors’ report.

181
Schedule 21City of St. Louis, Missouri
Combining Statement of Revenues, Expenses, and Changes in Fund Net PositionInternal Service Funds
Year ended June 30, 2017(dollars in thousands)
Public FacilitiesProtection Mailroom Equipment
Corporation Services Health Services Total
Operating revenues:Charges for services $ 28,651 564 15,367 3,499 48,081 Miscellaneous (95) — — — (95)
Total operating revenues 28,556 564 15,367 3,499 47,986
Operating expenses:Claims incurred 24,887 — 14,218 — 39,105 Premiums 3,099 — — — 3,099 Personnel services — 325 — — 325 Material and supplies 570 259 — 3,687 4,516 Depreciation — 11 — — 11
Total operating expenses 28,556 595 14,218 3,687 47,056
Operating income (loss) — (31) 1,149 (188) 930
Nonoperating revenues (expenses):Investment income (loss) — — (5) — (5)
Total nonoperating revenues(expenses), net — — (5) — (5)
Income (loss) before capitalcontributions — (31) 1,144 (188) 925
Changes in net position — (31) 1,144 (188) 925
Net position – beginning of year — 44 4,078 611 4,733 Net position – end of year $ — 13 5,222 423 5,658
See accompanying independent auditors’ report.

182
Schedule 22City of St. Louis, Missouri
Combining Statement of Cash FlowsInternal Service Funds
Year ended June 30, 2017(dollars in thousands)
Public FacilitiesProtection Mailroom Equipment
Corporation Services Health Services Total
Cash flows from operating activities:Receipts from interfund services provided $ 16,985 599 16,176 3,525 37,285 Payments to suppliers of goods and services (18,869) (235) (13,988) (3,709) (36,801) Payments to employees — (332) — — (332)
Net cash provided by (used in) operating activities (1,884) 32 2,188 (184) 152
Cash flows from capital and related financing activities:Acquisition and construction of capital assets — (37) — — (37) Other capital and financing activities — — — — —
Net cash provided by (used in) capital and related financing — (37) — — (37)
Cash flows from investing activities:Purchase of investments — 1 (541) 36 (504)
Net cash (used in) provided by investing activities — 1 (541) 36 (504)
Net increase (decrease) in cash and cash equivalents (1,884) (4) 1,647 (148) (389)
Cash and cash equivalents beginning of year 4,096 4 2,908 365 7,373 Cash and cash equivalents end of year $ 2,212 — 4,555 217 6,984
Reconciliation of operating income (loss) to net cashprovided by (used in) operating activities:
Operating income (loss) $ — (31) 1,149 (188) 930
Adjustment to reconcile operating income (loss) to net cashprovided by (used in) operating activities:
Depreciation — 11 — — 11 Change in assets and liabilities:
Receivables, net 98 (4) 525 — 619 Due to/from other funds (813) 39 284 26 (464) Advance to other funds (10,855) — — — (10,855) Prepaid assets 432 24 — — 456 Accounts payable and accrued liabilities — (7) (3) (22) (32) Claims payable 9,254 — 233 — 9,487
Total adjustments (1,884) 63 1,039 4 (778) Net cash provided by (used in) operating activities $ (1,884) 32 2,188 (184) 152
See accompanying independent auditors’ report.

Pension Trust Funds
183
Pension trust funds are used to account for the activity of the three public employee retirement systems for which the City acts as a trustee.
Firemen’s System – The frozen single employer public employee retirement system fund used to account for the accumulation of resources to be used for the pension and other benefit payments for City firefighters.
Firefighters’ Plan - A single employer public employee retirement system fund used to account for the accumulation of resources to be used for the pension and other benefit payments for City firefighters replacing the Firemen’s System.
Police System – A single employer public employee retirement system fund used to account for the accumulation of resources to be used for pension and other benefit payments for City police officers.
Employees System – A multi-employer public employee retirement system used to account for the accumulation of resources to be used for pension and other benefit payments for employees of the City (excluding firefighters and police officers) and other anticipating governmental agencies. City employees account for greater than 99% of total plan participants.

184
Schedule 23City of St. Louis, Missouri
Combining Statement of Fiduciary Net PositionPension Trust Funds
June 30, 2017(dollars in thousands)
Firemen’s Firefighter's Police EmployeesSystem Plan System System Total(as of (as of (as of (as of (as of
September 30, September 30, September 30, September 30, September 30,2016*) 2016*) 2016*) 2016*) 2016*)
Assets
Current assets:Cash and cash equivalents – unrestricted $ 3,896 43 6,940 79 10,958
Investments – unrestricted:Bonds 30,942 7,751 82,680 85,845 207,218 Domestic bond funds — — — 83,984 83,984 Stocks 195,735 19,908 167,904 183,836 567,383 Mortgage-backed securities — — 16,792 — 16,792 Collective investment funds 100,555 10,559 193,220 — 304,334 Real estate equities and investment trust 41,979 — 73,502 92,764 208,245 Investment property — — 863 — 863 Hedge funds 76,203 — 34,102 73,660 183,965 Money market mutual funds and other short
term investments 9,016 8,257 33,969 9,650 60,892 Managed master limited partnership — — 98,535 72,051 170,586 Managed international equity funds — — — 162,719 162,719
Total investments 454,430 46,475 701,567 764,509 1,966,981
Securities lending collateral — — — 2,201 2,201 Receivables, net of allowances:
Contributions — — — 169 169 Accrued interest 764 32 1,040 713 2,549 Other 1,081 12 1,350 — 2,443
Capital assets, net 504 145 296 — 945
Total assets 460,675 46,707 711,193 767,671 1,986,246
Deferred Outflows of Resources
System's staff pension related 149 65 125 34 373
Total deferred outflows of resources 149 65 125 34 373
Total assets and deferred outflowsof resources 460,824 46,772 711,318 767,705 1,986,619
Liabilities
Accounts payable and accrued liabilities 481 91 832 603 2,007 Deposits held for others — — 106 — 106 Securities lending collateral liability — — — 2,201 2,201 Due to The Firefighter's Retirement Plan 255 — — — 255 Other liabilities 1,389 2,731 1,125 — 5,245
Total liabilities 2,125 2,822 2,063 2,804 9,814
Deferred Inflows of ResourcesSystem's staff pension related 8 2 17 — 27
Total deferred inflows of resources 8 2 17 — 27
Total liabilities and deferred inflowsof resources 2,133 2,824 2,080 2,804 9,841
Net position
Net position restricted forpension benefits $ 458,691 43,948 709,238 764,901 1,976,778
*See note 10.
See accompanying independent auditors’ report.
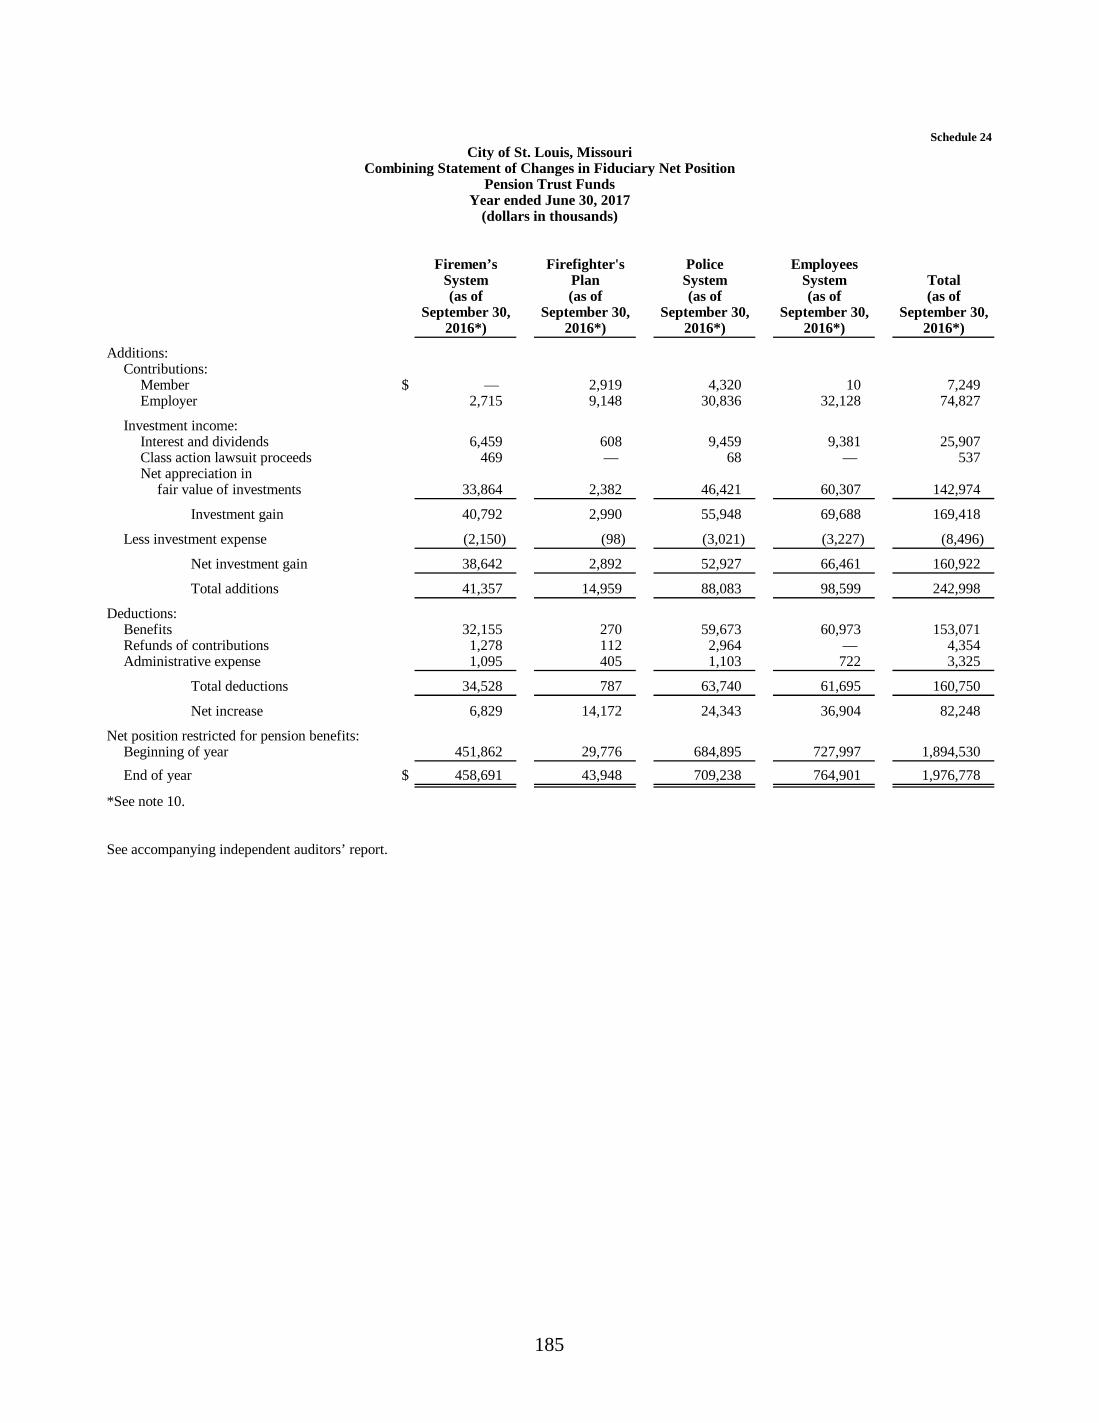
185
Schedule 24City of St. Louis, Missouri
Combining Statement of Changes in Fiduciary Net PositionPension Trust Funds
Year ended June 30, 2017(dollars in thousands)
Firemen’s Firefighter's Police EmployeesSystem Plan System System Total(as of (as of (as of (as of (as of
September 30, September 30, September 30, September 30, September 30,2016*) 2016*) 2016*) 2016*) 2016*)
Additions:Contributions:
Member $ — 2,919 4,320 10 7,249 Employer 2,715 9,148 30,836 32,128 74,827
Investment income:Interest and dividends 6,459 608 9,459 9,381 25,907 Class action lawsuit proceeds 469 — 68 — 537 Net appreciation in
fair value of investments 33,864 2,382 46,421 60,307 142,974
Investment gain 40,792 2,990 55,948 69,688 169,418
Less investment expense (2,150) (98) (3,021) (3,227) (8,496)
Net investment gain 38,642 2,892 52,927 66,461 160,922
Total additions 41,357 14,959 88,083 98,599 242,998
Deductions:Benefits 32,155 270 59,673 60,973 153,071 Refunds of contributions 1,278 112 2,964 — 4,354 Administrative expense 1,095 405 1,103 722 3,325
Total deductions 34,528 787 63,740 61,695 160,750
Net increase 6,829 14,172 24,343 36,904 82,248
Net position restricted for pension benefits:Beginning of year 451,862 29,776 684,895 727,997 1,894,530 End of year $ 458,691 43,948 709,238 764,901 1,976,778
*See note 10.
See accompanying independent auditors’ report.

Agency Funds
186
Agency funds are used to account for assets which the City holds on behalf of other entities. Agency funds are custodial in nature (assets equal liabilities) and do not involve the measurement of results of operations.
Collector of Revenue – Used to account for the receipt and disbursement of various taxes and other charges that are collected by the Collector of Revenue and remitted to various City funds and other governmental agencies that levy taxes on residents of the City and on corporations located within the City limits and the employees.
Property Tax Escrow – Used to account for property taxes paid under protest whose disposition is still pending and duplicate payments of property taxes which have not been claimed.
General Insurance – Used to control funds for payroll withholdings and other City deposits to be used for the payment of insurance premiums due from employees and the City.
Bail Bonds – Used to account for bail bonds deposited by court defendants. The bonds are held until court orders are issued to refund the bonds to the defendants or others.
License Collector – Used to account for the receipt and disbursement of municipal manufacturer’s and hotel taxes that are collected by the License Collector and remitted to various City funds and other governmental agencies.
Circuit Clerk – Used to account for funds held in a fiduciary capacity by the Circuit Clerk’s Office. These funds include various litigation fees, garnishments, and bail bonds, in addition to funds related to the parent locator program.
Police Agency – Used to account for funds held for police athletic league.
Treasurer’s Office – Used to account for funds held to be used for the College Kids Children’s Savings Account Program.
Other Agency – Used to account for contracts and other deposits, union dues, land auction sales, circuit attorney and probate court funds.
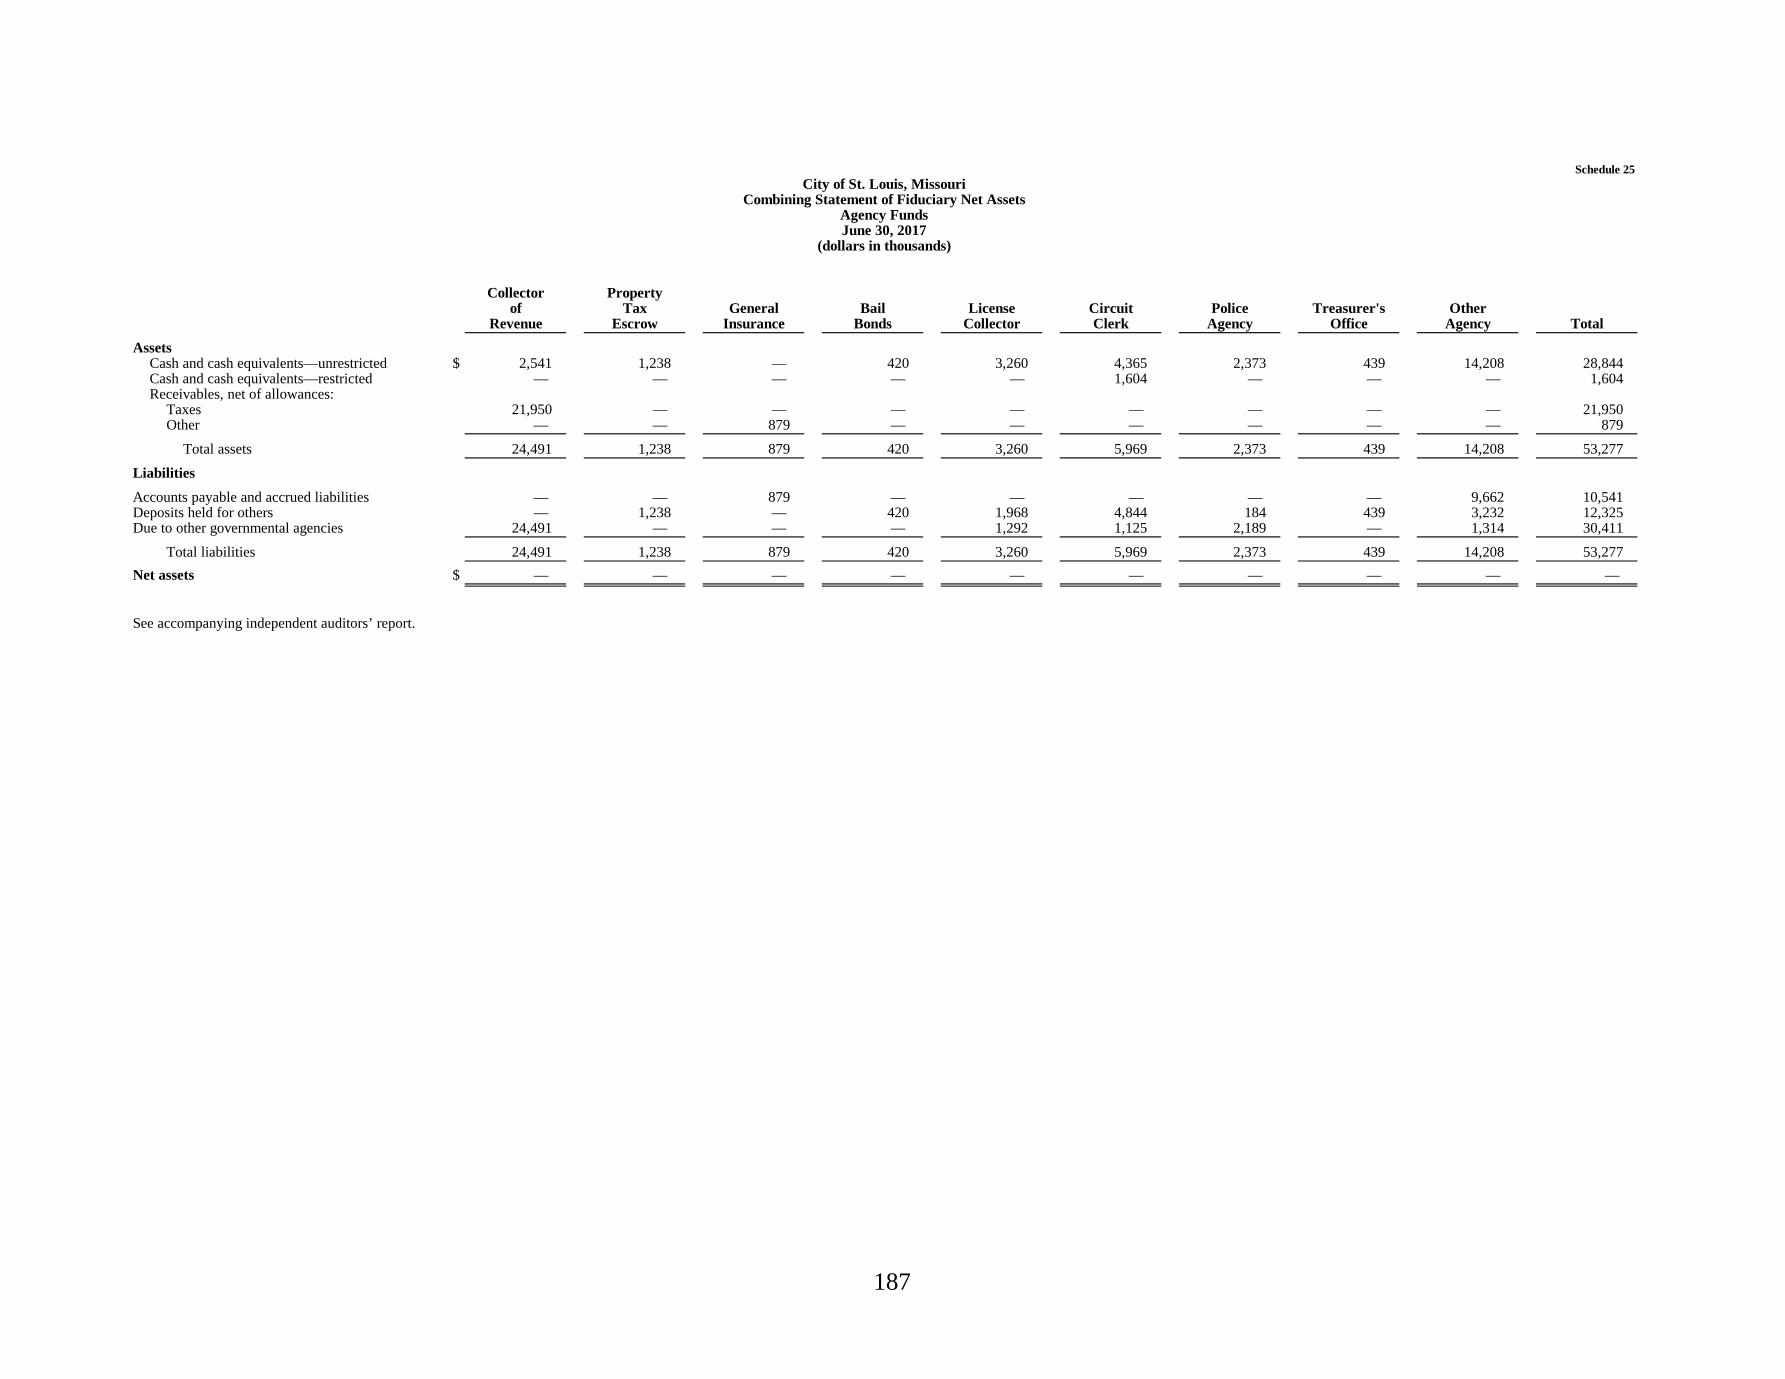
187
Schedule 25City of St. Louis, Missouri
Combining Statement of Fiduciary Net AssetsAgency FundsJune 30, 2017
(dollars in thousands)
Collector Propertyof Tax General Bail License Circuit Police Treasurer's Other
Revenue Escrow Insurance Bonds Collector Clerk Agency Office Agency TotalAssets
Cash and cash equivalents—unrestricted $ 2,541 1,238 — 420 3,260 4,365 2,373 439 14,208 28,844 Cash and cash equivalents—restricted — — — — — 1,604 — — — 1,604 Receivables, net of allowances:
Taxes 21,950 — — — — — — — — 21,950 Other — — 879 — — — — — — 879
Total assets 24,491 1,238 879 420 3,260 5,969 2,373 439 14,208 53,277 LiabilitiesAccounts payable and accrued liabilities — — 879 — — — — — 9,662 10,541 Deposits held for others — 1,238 — 420 1,968 4,844 184 439 3,232 12,325 Due to other governmental agencies 24,491 — — — 1,292 1,125 2,189 — 1,314 30,411
Total liabilities 24,491 1,238 879 420 3,260 5,969 2,373 439 14,208 53,277 Net assets $ — — — — — — — — — —
See accompanying independent auditors’ report.

188
Schedule 26City of St. Louis, Missouri
Combining Statement of Changes inAssets and Liabilities—Agency Funds
For the Year ended June 30, 2017(dollars in thousands)
Balance BalanceJune 30, June 30,
2016 Additions Deductions 2017
Collector of Revenue
Assets:Cash and cash equivalents—unrestricted $ 1,784 408,642 (407,885) 2,541 Receivables, net of allowances—taxes 19,184 10,504 (7,738) 21,950
Total assets $ 20,968 419,146 (415,623) 24,491
Liabilities—due to other governmental agencies $ 20,968 419,146 (415,623) 24,491 Total liabilities $ 20,968 419,146 (415,623) 24,491
Property Tax EscrowAssets—cash and cash equivalents—unrestricted $ 1,123 1,663 (1,548) 1,238
Liabilities—deposits held for others $ 1,123 1,663 (1,548) 1,238
General Insurance
Assets:Cash and cash equivalents—unrestricted $ — 37,191 (37,191) — Receivables, net of allowances—other 1,951 879 (1,951) 879
Total assets $ 1,951 38,070 (39,142) 879
Liabilities—accounts payable and accrued liabilities $ 1,951 38,070 (39,142) 879
Bail BondsAssets—cash and cash equivalents—unrestricted $ 454 262 (296) 420
Liabilities—deposits held for others $ 454 262 (296) 420
License CollectorAssets—cash and cash equivalents—unrestricted $ 2,667 21,532 (20,939) 3,260
Liabilities:Deposits held for others 1,981 15 (28) 1,968 Due to other governmental agencies 686 21,517 (20,911) 1,292
Total liabilities $ 2,667 21,532 (20,939) 3,260
Circuit Clerk
Assets:Cash and cash equivalents—unrestricted $ 5,949 20,161 (21,745) 4,365 Cash and cash equivalents—restricted 2,471 286 (1,153) 1,604
Total assets $ 8,420 20,447 (22,898) 5,969
Liabilities:Deposits held for others 6,888 17,053 (19,097) 4,844 Due to other governmental agencies 1,532 3,394 (3,801) 1,125
Total liabilities $ 8,420 20,447 (22,898) 5,969

189
Schedule 26, ContinuedCity of St. Louis, Missouri
Combining Statement of Changes inAssets and Liabilities—Agency Funds
For the Year ended June 30, 2017(dollars in thousands)
Balance BalanceJune 30, June 30,
2016 Additions Deductions 2017
Police Agency
Assets:Cash and cash equivalents—unrestricted $ 2,538 793 (958) 2,373
Total assets $ 2,538 793 (958) 2,373
Liabilities:Deposits held for others 238 432 (486) 184 Due to other governmental agencies 2,300 361 (472) 2,189
Total liabilities $ 2,538 793 (958) 2,373
Treasurer's Office
Assets:Cash and cash equivalents—unrestricted $ — 439 — 439
Total assets $ — 439 — 439
Liabilities:Deposits held for others — 439 — 439
Total liabilities $ — 439 — 439
Other Agency
Assets:Cash and cash equivalents—unrestricted $ 10,990 45,313 (42,095) 14,208
Total assets $ 10,990 45,313 (42,095) 14,208
Liabilities:Accounts payable and accrued liabilities 6,599 6,857 (3,794) 9,662 Deposits held for others 3,449 10,160 (10,377) 3,232 Due to other governmental agencies 942 28,297 (27,925) 1,314
Total liabilities $ 10,990 45,314 (42,096) 14,208
Total—All Agency Funds
Assets:Cash and cash equivalents—unrestricted $ 25,505 535,996 (532,657) 28,844 Cash and cash equivalents—restricted 2,471 286 (1,153) 1,604 Receivables, net of allowances:
Taxes 19,184 10,504 (7,738) 21,950 Other 1,951 879 (1,951) 879
Total assets $ 49,111 547,665 (543,499) 53,277
Liabilities:Accounts payable and accrued liabilities 8,550 44,927 (42,936) 10,541 Deposits held for others 14,133 30,024 (31,832) 12,325 Due to other governmental agencies 26,428 472,715 (468,732) 30,411
Total liabilities $ 49,111 547,666 (543,500) 53,277
See accompanying independent auditors’ report.

190
STATISTICAL SECTION This part of the City of St. Louis’ (the City’s) comprehensive annual financial report presents detailed information as a context for understanding what the information in the financial statements, note disclosures, and required supplementary information says about The City’s overall financial health. Contents Table Numbers Primary Government: Financial Trends 1-4 These tables contain trend information to help the reader understand how
the City’s financial performance and well-being have changed over time. Revenue Capacity 5-10 These tables contain information to help the reader assess the City’s most
significant local revenue sources. Debt Capacity 11-15 These tables present information to help the reader assess the affordability
of the City’s current levels of outstanding debt and the City’s ability to issue additional debt in the future.
Demographic and Economic Information 16 These tables offer demographic and economic indicators to help the
reader understand the environment with which the City’s financial activities take place.
Operating Information 17-20 These tables contain service and infrastructure data to help the reader
understand how the information in the City’s financial report relates to the services the government provides and the activities it performs.
Sources: Unless otherwise noted, the information in these schedules is derived from the comprehensive annual financial reports for the relevant year.
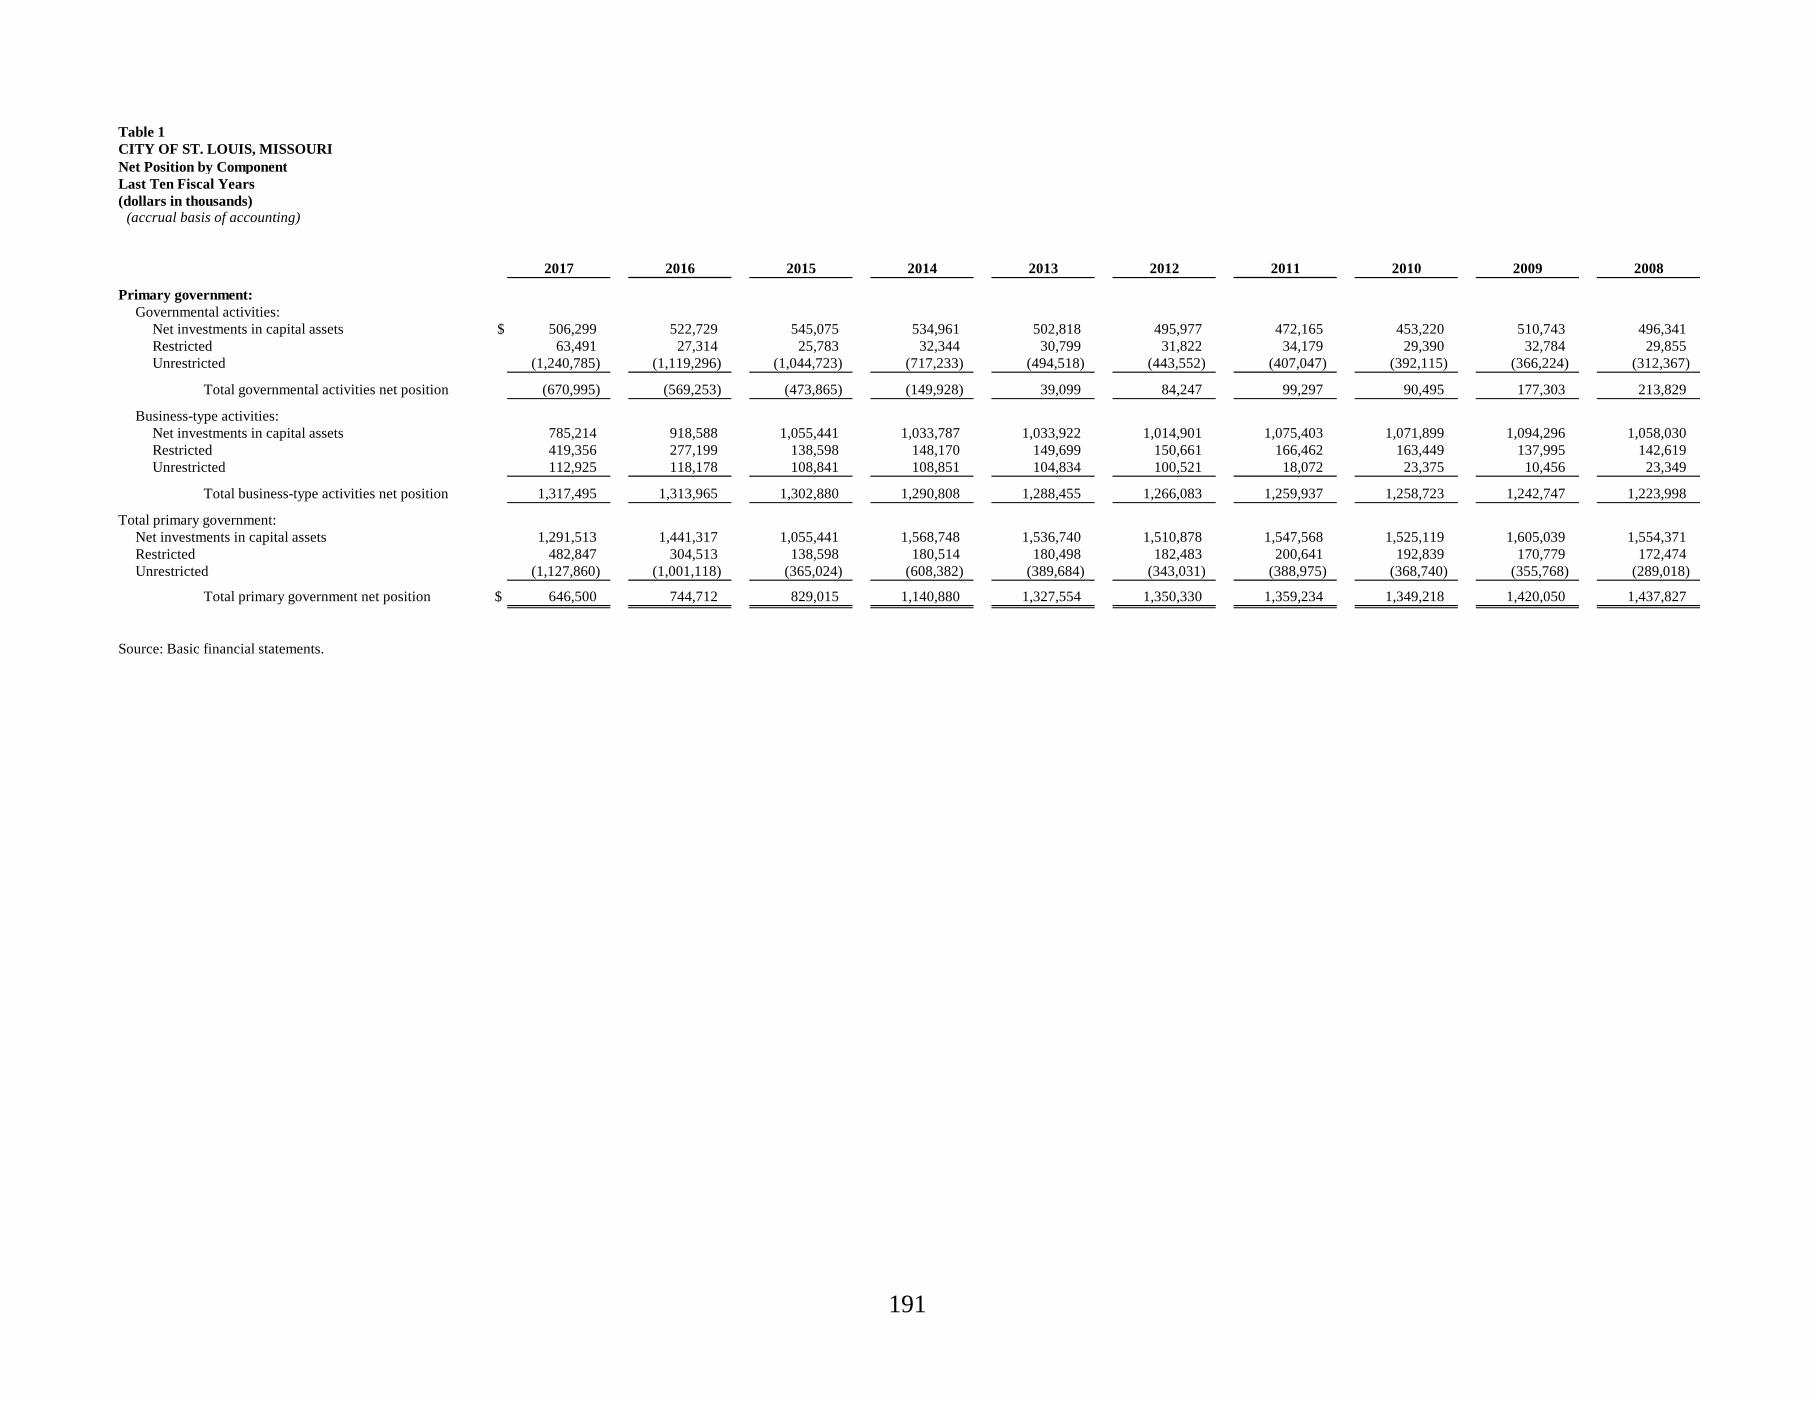
191
Table 1CITY OF ST. LOUIS, MISSOURINet Position by ComponentLast Ten Fiscal Years(dollars in thousands) (accrual basis of accounting)
2017 2016 2015 2014 2013 2012 2011 2010 2009 2008
Primary government:Governmental activities:
Net investments in capital assets $ 506,299 522,729 545,075 534,961 502,818 495,977 472,165 453,220 510,743 496,341 Restricted 63,491 27,314 25,783 32,344 30,799 31,822 34,179 29,390 32,784 29,855 Unrestricted (1,240,785) (1,119,296) (1,044,723) (717,233) (494,518) (443,552) (407,047) (392,115) (366,224) (312,367)
Total governmental activities net position (670,995) (569,253) (473,865) (149,928) 39,099 84,247 99,297 90,495 177,303 213,829
Business-type activities:Net investments in capital assets 785,214 918,588 1,055,441 1,033,787 1,033,922 1,014,901 1,075,403 1,071,899 1,094,296 1,058,030 Restricted 419,356 277,199 138,598 148,170 149,699 150,661 166,462 163,449 137,995 142,619 Unrestricted 112,925 118,178 108,841 108,851 104,834 100,521 18,072 23,375 10,456 23,349
Total business-type activities net position 1,317,495 1,313,965 1,302,880 1,290,808 1,288,455 1,266,083 1,259,937 1,258,723 1,242,747 1,223,998
Total primary government:Net investments in capital assets 1,291,513 1,441,317 1,055,441 1,568,748 1,536,740 1,510,878 1,547,568 1,525,119 1,605,039 1,554,371 Restricted 482,847 304,513 138,598 180,514 180,498 182,483 200,641 192,839 170,779 172,474 Unrestricted (1,127,860) (1,001,118) (365,024) (608,382) (389,684) (343,031) (388,975) (368,740) (355,768) (289,018)
Total primary government net position $ 646,500 744,712 829,015 1,140,880 1,327,554 1,350,330 1,359,234 1,349,218 1,420,050 1,437,827
Source: Basic financial statements.

192
Table 2CITY OF ST. LOUIS, MISSOURIChanges in Net PositionLast Ten Fiscal Years(dollars in thousands) (accrual basis of accounting)
2017 2016 2015 2014 2013 2012 2011 2010 2009 2008
Expenses:Governmental activities:
General government $ 83,029 66,403 58,679 94,791 73,204 72,063 79,871 84,330 85,680 74,166 Convention and tourism 5,801 5,789 5,775 5,711 5,513 4,979 4,563 4,507 4,504 4,468 Parks and recreation 31,695 31,390 30,111 31,765 30,818 28,529 29,416 32,778 33,431 31,335 Judicial 49,587 51,085 50,730 52,009 52,232 50,931 52,362 54,880 56,159 50,684 Streets 75,329 75,707 73,452 69,584 68,402 70,420 66,952 66,263 63,646 62,566 Public safety:
Fire 92,422 88,008 64,658 86,085 75,460 69,062 66,637 67,334 70,572 69,668 Police 280,295 226,537 202,080 209,762 138,028 140,815 139,010 141,805 146,955 143,452 Police pension 28,492 19,854 17,949 14,902 8,196 12,914 Other 60,714 60,647 58,714 59,323 61,264 59,068 52,182 55,980 60,020 63,687
Health and welfare 56,020 57,112 54,071 49,602 61,162 52,092 50,468 51,552 54,223 45,732 Public service 79,680 79,451 78,021 76,863 62,301 71,458 65,898 59,980 59,218 70,007 Community development 47,270 82,459 65,499 35,238 77,530 80,184 68,123 76,264 61,859 60,611 Interest and fiscal charges 58,378 60,049 60,580 58,009 57,674 59,750 58,612 57,933 54,684 49,963
Total governmental activities expenses 920,220 884,637 802,370 828,742 792,080 779,205 752,043 768,508 759,147 739,253
Business-type activities:Airport 176,892 165,756 160,233 175,058 173,968 171,574 187,449 181,775 175,758 215,691 Water division 49,039 49,726 46,799 50,184 45,799 43,637 44,530 43,479 47,500 45,157 Parking division 16,520 15,253 13,851 14,043 13,558 13,229 13,141 13,514 14,352 14,560
Total business-type activities expenses 242,451 230,735 220,883 239,285 233,325 228,440 245,120 238,768 237,610 275,408
Total primary government expenses $ 1,162,671 1,115,372 1,023,253 1,068,027 1,025,405 1,007,645 997,163 1,007,276 996,757 1,014,661
Program revenues:Governmental activities:
Charges for services:General government $ 44,435 42,132 32,455 34,783 33,375 36,697 37,767 39,340 37,706 35,060 Convention and tourism — — — — — 8 19 18 19 — Parks and recreation 5,139 5,328 4,611 5,979 2,958 7,314 4,378 4,419 4,516 2,662 Judicial 6,347 9,746 12,042 23,076 21,542 18,996 20,524 20,791 18,952 18,894 Streets 27,562 27,330 26,898 26,110 26,012 27,514 34,842 17,644 17,734 15,621 Public safety:
Fire 10,829 10,246 12,562 9,553 18,887 8,181 8,088 7,677 7,669 6,718 Police 2,831 4,051 6,228 5,260 Other 22,115 23,533 21,376 20,639 19,537 19,218 17,527 19,022 19,632 18,635
Health and welfare 1,364 1,073 875 1,631 1,041 992 1,255 591 494 944 Public service 5,341 5,977 6,974 6,037 2,906 5,265 309 1,487 253 6,320 Community development ** 7,774 7,076 5,907 4,412 5,332 5,367 4,819 4,528 5,524 5,273 Operating grants and contributions 66,793 67,052 60,792 57,173 64,782 71,513 75,281 98,270 73,563 72,860 Capital grants and contributions 15,134 6,524 7,987 5,628 14,882 31,623 33,666 7,548 12,726 14,306
Total governmental activities program revenues 215,664 210,068 198,707 200,281 211,254 232,688 238,475 221,335 198,788 197,293
Business-type activities:Charges for services:
Airport 169,004 162,837 164,745 165,927 164,606 157,154 149,438 160,378 159,061 163,460 Water Division 54,620 57,494 54,399 56,647 56,902 58,631 56,039 50,983 48,709 45,635 Parking Division 18,032 17,113 16,129 15,804 14,657 14,999 13,813 12,428 13,897 15,890 Operating grants and contributions 1,136 692 1,277 706 751 1,069 1,513 1,615 2,683 4,348 Capital grants and contributions 11,937 9,378 23,627 16,726 21,615 10,050 8,267 31,815 35,122 28,123
Total business-type activities program revenues 254,729 247,514 260,177 255,810 258,531 241,903 229,070 257,219 259,472 257,456
Total primary government program revenues $ 470,393 457,582 458,884 456,091 469,785 474,591 467,545 478,554 458,260 454,749
** Fiscal years 2008 and 2009 Community development revenues reflect TIF revenues previously reported under General governmentin prior fiscal years.

193
Table 2CITY OF ST. LOUIS, MISSOURIChanges in Net PositionLast Ten Fiscal Years(dollars in thousands) (accrual basis of accounting)
2017 2016 2015 2014 2013 2012 2011 2010 2009 2008
Net program (expense) revenue:Governmental activities $ (704,556) (674,569) (603,663) (628,461) (580,826) (546,517) (513,568) (547,173) (560,359) (541,960) Business-type activities 12,278 16,779 39,294 16,525 25,206 13,463 (16,050) 18,451 21,862 (17,952)
Total primary government net expense $ (692,278) (657,790) (564,369) (611,936) (555,620) (533,054) (529,618) (528,722) (538,497) (559,912)
General revenues and other changes in net position:Governmental activities:
TaxesProperty taxes, levied for general purpose $ 86,542 82,397 77,365 75,136 73,234 68,531 66,767 67,291 67,562 62,424 Property taxes, levied for debt service 6,984 6,251 6,406 6,661 7,140 5,909 7,669 6,463 4,810 6,285 Sales tax 179,075 179,362 175,581 173,018 157,302 164,174 155,708 142,295 143,972 134,476 Earnings/payroll taxes 223,018 204,013 203,251 202,022 189,762 186,068 178,571 172,450 181,214 181,812 Gross receipt taxes (includes franchise tax) 90,145 91,778 92,160 97,344 94,721 93,587 97,327 90,291 108,178 84,652 Miscellaneous taxes 5,068 4,791 4,485 4,977 3,784 4,504 4,080 3,902 3,712 4,035
Unrestricted investment earnings 621 632 381 364 265 470 953 886 6,001 12,159 Gain/loss on sale of capital assets — — — — — (1,142) 2,528 62 83 47 Transfers 11,361 9,957 9,619 9,431 9,470 9,366 8,767 7,317 8,301 8,740
Total governmental activities 602,814 579,181 569,248 568,953 535,678 531,467 522,370 490,957 523,833 494,630
Business-type activities:Unrestricted investment earnings 2,613 3,585 2,956 1,818 2,336 2,049 2,941 3,878 5,188 10,776 Gain/loss on sale of capital assets — — — 4,872 — — 4 553 — 26 Extraordinary item – Natural disaster — 678 1,737 2,730 4,300 — 23,086 — — — Transfers (11,361) (9,957) (9,619) (9,431) (9,470) (9,366) (8,767) (6,906) (8,301) (8,740)
Total business-type activities (8,748) (5,694) (4,926) (11) (2,834) (7,317) 17,264 (2,475) (3,113) 2,062
Total primary government $ 594,066 573,487 564,322 568,942 532,844 524,150 539,634 488,482 520,720 496,692
Change in net position:Governmental activities: $ (101,742) (95,388) (34,415) (59,508) (45,148) (15,050) 8,802 (56,216) (36,526) (47,330) Business-type activities 3,530 11,085 34,368 16,514 22,372 6,146 1,214 15,976 18,749 (15,890)
Total primary government $ (98,212) (84,303) (47) (42,994) (22,776) (8,904) 10,016 (40,240) (17,777) (63,220)
Source: Basic financial statements.

194
Table 3CITY OF ST. LOUIS, MISSOURIFund Balances, Governmental FundsLast Ten Fiscal Years(dollars in thousands) (modified accrual basis of accounting)
2017 2016 2015 2014 2013 2012 2011 2010 2009 2008
General fund:Nonspendable $ 3,608 3,768 2,425 2,537 — — — * * *Restricted 13,145 13,532 14,852 16,008 14,784 16,755 16,723 * * *Committed — 10,136 9,134 8,054 8,054 8,063 6,895 * * *Assigned — — 3,938 6,521 6,043 1,509 1,055 * * *Unassigned 1,529 (5,150) (1,696) 2,605 25,777 29,543 24,675 * * *Reserved — — — — — — — 31,284 26,484 21,150 Unreserved — — — — — — — 22,132 35,570 33,721
Total general fund $ 18,282 22,286 28,653 35,725 54,658 55,870 49,348 53,416 62,054 54,871
All other governmental funds:Nonspendable $ 11 11 11 14 11 11 11 * * *Restricted 112,175 93,231 84,500 96,160 71,117 79,573 131,102 * * *Committed 69,322 70,387 64,075 65,536 57,127 54,553 54,678 * * *Assigned 4,121 4,770 6,379 5,053 4,473 1,837 3,200 * * *Unassigned (17,059) (18,057) (18,227) (24,025) (24,648) (20,103) (26,752) * * *Reserved — — — — — — — 181,410 173,407 191,062 Unreserved, reported in:
Special revenue funds — — — — — — — 19,342 30,104 42,304 Capital projects funds — — — — — — — (13,961) (10,689) (9,253)
Total all other governmental funds $ 168,570 150,342 136,738 142,738 108,080 115,871 162,239 186,791 192,822 224,113
* Effective July 1, 2011 the City adopted GASB Statement No. 54, Fund Balance Reporting and Governmental Fund Type Definitions, to enhance the usefulness of fund balance information by providing clearerfund balance classifications that can be more consistently applied and by clarifying the existing governmental fund type definitions. This statement establishes fund balance classifications that comprise ahierarchy based primarily on the extent to which a government is bound to observe constraints imposed upon the use of the resources reported in governmental funds.
Source: Basic financial statements.

195
Table 4CITY OF ST. LOUIS, MISSOURIChanges In Fund Balances, Governmental FundsLast Ten Fiscal Years(dollars in thousands)
2017 2016 2015 2014 2013 2012 2011 2010 2009 2008
Revenues:Taxes $ 585,773 564,488 556,593 557,487 524,428 519,852 510,150 480,082 506,228 473,646 Licenses, fees and permits 26,441 26,947 26,743 26,004 24,359 21,259 21,716 24,214 22,238 22,208 Intergovernmental 109,353 100,946 97,684 88,069 107,289 130,079 138,141 117,084 116,693 119,197 Charges for services, net 48,313 51,048 47,222 49,867 52,347 46,166 44,659 30,906 28,316 28,752 Court fines and forfeitures 3,388 4,009 4,916 10,810 11,022 12,103 10,848 11,558 11,127 10,000 Investment income 621 632 381 364 265 470 953 886 6,001 12,159 Interfund services provided 4,847 4,488 858 3,464 5,531 4,293 4,631 3,043 6,354 3,868 Miscellaneous 17,845 20,915 19,234 19,584 13,514 17,651 15,845 15,987 12,865 13,902
Total revenues 796,581 773,473 753,631 755,649 738,755 751,873 746,943 683,760 709,822 683,732
Expenditures:General government 71,572 59,708 65,648 84,648 63,980 60,942 67,400 77,906 80,226 101,622 Convention and tourism 119 124 126 123 116 150 189 176 198 201 Parks and recreation 25,945 25,805 25,169 26,553 25,689 23,885 25,153 27,357 29,827 27,966 Judicial 49,363 51,026 50,058 51,491 51,849 50,821 52,498 53,985 55,222 50,806 Streets 42,571 42,743 40,645 37,867 37,378 40,772 39,498 37,356 37,500 38,086 Public Safety:
Fire 73,099 67,229 68,415 74,261 71,595 69,887 68,518 66,590 62,010 115,605 Police 190,422 183,337 179,129 176,089 138,004 140,815 139,010 141,805 146,955 143,452 Police-pension * — — — — 28,492 19,719 17,949 14,783 8,072 43,618 Other 59,808 60,407 58,242 58,736 60,178 58,741 51,899 54,653 57,443 62,743
Health and welfare 55,839 56,859 53,808 49,207 60,709 51,855 50,127 51,230 53,441 45,379 Public service 79,224 78,689 77,334 76,211 61,519 70,840 65,916 59,315 58,594 70,095 Community development 47,270 82,459 65,499 35,238 77,530 80,184 68,123 76,264 63,220 60,710 Capital outlay 47,607 38,322 31,560 35,444 36,914 90,065 94,653 51,175 67,615 51,103 Debt service:
Principal 59,653 55,697 65,602 55,209 54,952 58,091 46,721 41,759 46,484 Interest and fiscal charges 52,322 53,768 48,510 64,316 47,154 47,256 46,283 54,555 47,350 44,741
Cost of issuance — — — 44,375 — — — — 1,290 — Advance refunding escrow 2,010 2,380 — — — — — 1,178 — —
Total expenditures 856,824 858,553 829,745 814,559 816,316 860,884 845,307 815,049 810,722 902,611
Deficiency of revenues over expenditures (60,243) (85,080) (76,114) (58,910) (77,561) (109,011) (98,364) (131,289) (100,900) (218,879)
* Police pension expenses under Governmental activities were reclassified in fiscal years 2008 and 2009. In prior fiscal years, this expensewas included in Public Safety-Other. See accompanying notes to basic financial statements.

196
Table 4CITY OF ST. LOUIS, MISSOURIChanges In Fund Balances, Governmental FundsLast Ten Fiscal Years(dollars in thousands)
2017 2016 2015 2014 2013 2012 2011 2010 2009 2008
Other financing sources (uses):Sale of capital assets $ 190 — 1,849 207 3 345 3,216 62 83 47 Issuance of note payable — — — — — — — — 9,068 — Issuance of SLMFC Certificates of participation — — 5,195 — — — — — 9,100 — Issuance of refunding bonds-revenue refunding bonds — — — — — 49,825 2,690 — — — Issuance of refunding bonds-leasehold revenue bonds 90,167 49,441 31,695 26,000 — — 9,250 74,191 21,850 247,967 Issuance of contractual obligation with component unit — — — — — — — 16,960 — — Premium on leasehold revenue bonds — — — 1,471 1,890 4,038 145 396 — 653 Discount on leasehold revenue bonds — — — — — — — (384) (525) (3,965) Proceeds from agreement with FPF 7,695 5,000 — — — — — — — — Issuance of general obligation bonds 25,000 16,795 — — — — — — — — Premium on general obligation bonds and revenue bonds 12,171 5,434 3,782 — — — — — — — Discount on general obligation bonds (131) — — — — — — — — — Issuance of capital lease — — — 16,605 — 2,384 11,150 704 5,600 1,478 Issuance of tax increment revenue notes 19,794 49,757 49,917 10,852 57,195 51,101 46,503 28,352 32,669 37,737 Issuance of refunding development and tax increment financing notes 9,050 — — — — — — — — — Payment of development and TIF notes — — (3,442) — — — 4,580 — — — Discount on tax increment revenue bonds — — (11) — — — — — — — Issuance of loan agreement — — 2,080 3,510 — — — — — 4,500 Issuance of joint venture financing agreement — — — — — — — — — — Payment to refunded escrow agent-joint venture — — — — — — — — — — Payment to refunded escrow agent-leasehold revenue bonds (91,780) (44,067) (37,642) — — (53,172) (2,416) (12,391) — (8,632) Payment of development and tax increment financing notes (9,050) — — — — — — — — — Payment to refunded escrow agent-obligation with component unit — — — — — — — — (9,354) — Payment of refunded escrow agent-capital lease — — — — — — (11,931) (341) — — Fireman’s Retirement EAN note proceeds — — — — — 5,278 — — — — Advance refunding on TIF bonds and notes payable — — — — — — — (16,961) — (11,000) Recovery of legal judgment — — — — — — — — — — Receipt of redevelopment lease proceeds from component unit — — — — — — — 18,006 — — Transfers in 64,790 65,731 61,946 68,121 62,143 62,920 53,467 58,575 50,849 40,569 Transfers out (53,429) (55,774) (52,327) (58,690) (52,673) (53,554) (46,910) (50,549) (42,548) (31,829)
Total other financing sources, net 74,467 92,317 63,042 68,076 68,558 69,165 69,744 116,620 76,792 277,525
Net change in fund balances $ 14,224 7,237 (13,072) 9,166 (9,003) (39,846) (28,620) (14,669) (24,108) 58,646
Debt service as a percentage ofnoncapital expenditures 14.1% 13.3% 14.3% 8.3% 13.1% 13.3% 13.9% 13.3% 12.0% 10.7%
Debt service expenditures $ 113,985 109,465 114,112 64,316 102,363 102,208 104,374 101,276 89,109 91,225 Non-capital expenditures 809,217 820,231 798,185 779,115 779,402 770,819 750,654 763,874 743,107 851,508
Source: Basic financial statements.

197
Table 5
Taxable AssessedValue
Manufacturer's Less: Total Taxable Estimated Total toFiscal Real Estate Personal Machinery, Tools Tax-Exempt Assessed Actual Taxable Direct Estimated ActualYear Residential Commercial Property & Equipment Property Value Value Tax Rate Taxable Value
2017 $ 2,075,196 2,708,997 980,000 168,051 1,443,328 4,488,916 17,784,543 1.6231 25.2%2016 2,083,783 2,543,883 835,238 243,122 1,333,027 4,372,999 17,356,913 1.6158 25.2%2015 1,980,203 2,599,573 810,313 255,068 1,343,072 4,302,085 17,033,118 1.6063 25.3%2014 1,968,547 2,528,334 753,790 255,595 1,273,384 4,232,882 16,787,744 1.6092 25.2%2013 2,161,657 2,452,348 737,422 216,902 1,195,359 4,372,970 17,614,380 1.4848 24.8%2012 2,197,419 2,499,166 705,441 238,661 1,282,753 4,357,934 17,543,141 1.4691 24.8%2011 2,281,376 2,542,399 723,739 221,519 1,281,865 4,487,168 18,126,314 1.4224 24.8%2010 2,206,698 2,688,333 781,557 254,873 1,381,310 4,550,151 18,144,398 1.3601 25.1%2009 2,256,467 2,440,325 861,837 287,366 1,162,841 4,683,154 18,841,886 1.3225 24.9%2008 2,195,159 2,548,206 805,298 292,371 1,283,851 4,557,183 18,401,969 1.3451 24.8%
Note:Residential real property is assessed at 19% of estimated value, commercial at 32%, and agricultural at 12%; personal property and manufacturer's machinery, tools and equipment assessed at 33-1/3%.A complete reassessment is made on personal property by the Assessor every year and every odd year for real property.
CITY OF ST. LOUIS, MISSOURIAssessed Value and Actual Value of Taxable Property Last Ten Fiscal Years(dollars in thousands)

198
Table 6CITY OF ST. LOUIS, MISSOURIProperty Tax Rates Per $100 Assessed Value - Direct and Overlapping GovernmentsLast Ten Fiscal Years
2017 2016 2015 2014 2013 2012 2011 2010 2009 2008
City of St. Louis:Municipal purposes 1.0000 0.9928 0.9833 0.9772 0.9071 0.9002 0.8639 0.8500 0.8161 0.8059 County purposes 0.3500 0.3500 0.3500 0.3500 0.3270 0.3247 0.3113 0.3064 0.2940 0.2903 Hospital purposes 0.1000 0.1000 0.1000 0.1000 0.0933 0.0926 0.0888 0.0874 0.0839 0.0829 Public health purposes 0.0200 0.0200 0.0200 0.0200 0.0187 0.0186 0.0178 0.0175 0.0168 0.0166 Recreation purposes 0.0200 0.0200 0.0200 0.0200 0.0187 0.0186 0.0178 0.0175 0.0168 0.0166 Interest and public debt 0.1331 0.1330 0.1330 0.1420 0.1200 0.1144 0.1228 0.0813 0.0949 0.1328
Total City of St. Louis 1.6231 1.6158 1.6063 1.6092 1.4848 1.4691 1.4224 1.3601 1.3225 1.3451
Overlapping governments: State Blind Pension Fund 0.0300 0.0300 0.0300 0.0300 0.0300 0.0300 0.0300 0.0300 0.0300 0.0300 Board of Education of the City of St. Louis 5.1211 4.3711 4.3711 4.3711 4.4071 4.1743 3.9865 3.8943 3.8028 3.7533 St. Louis Community College 0.2185 0.2176 0.2200 0.2200 0.2200 0.2200 0.2179 0.2136 0.2013 0.2003 Metropolitan St. Louis Sewer District 0.1196 0.0876 0.0879 0.0874 0.0821 0.0818 0.0790 0.0000 0.0000 0.0667 Sheltered Workshop District 0.1500 0.1500 0.1500 0.1500 0.1460 0.1445 0.1372 0.1346 0.1295 0.1278 St. Louis Public Library 0.5600 0.5600 0.5600 0.5600 0.5814 0.5435 0.5208 0.5019 0.4938 0.4768 Community Mental Health 0.0900 0.0900 0.0900 0.0900 0.0876 0.0867 0.0823 0.0800 0.0777 0.0767 Community Children's Service Fund 0.1900 0.1900 0.1900 0.1900 0.1900 0.1900 0.1880 0.1827 0.1775 0.1752 Metropolitan Zoological Park and Museum District:
Zoological Subdistrict 0.0799 0.0793 0.0800 0.0800 0.0769 0.0764 0.0727 0.0714 0.0671 0.0667 Art Museum Subdistrict 0.0799 0.0793 0.0800 0.0800 0.0769 0.0764 0.0727 0.0714 0.0671 0.0667 Museum of Science and Natural History Subdistrict 0.0399 0.0397 0.0399 0.0399 0.0382 0.0381 0.0364 0.0355 0.0334 0.0332 Botanical Garden Subdistrict 0.0399 0.0397 0.0399 0.0399 0.0382 0.0381 0.0364 0.0355 0.0334 0.0332 Missouri History Museum Subdistrict 0.0399 0.0397 0.0399 0.0399 0.0382 0.0381 0.0364 0.0355 0.0334 0.0332
Total overlapping governments 6.7587 5.9740 5.9787 5.9782 6.0126 5.7379 5.4963 5.2864 5.1470 5.1398
Total City of St. Louis and overlapping governments 8.3818$ 7.5898$ 7.5850$ 7.5874$ 7.4974$ 7.2070$ 6.9187$ 6.6465$ 6.4695$ 6.4849$
Source: City Assessor's Office.

199
Table 7CITY OF ST. LOUIS, MISSOURIPrincipal Property Tax Payers Identified by Industry ClassificationCurrent Calendar Year and Nine Years Ago(dollars in thousands)
Calendar Year Calendar Year 2016 2007
Percentage Percentageof Total City of Total City
Taxable Taxable Taxable TaxableTax Payer by Industry Assessed Assessed Assessed Assessed
Classification (1) Valuation Rank Valuation Valuation Rank Valuation
Utilities 96,658$ 1 2.24% 82,609$ 2 1.94%Gaming 73,981 2 1.71%Financial Services 65,481 3 1.52% 28,276 7 0.66%Manufacturing 64,575 4 1.49% 92,645 1 2.17%Telecommunications 55,657 5 1.29% 62,924 3 1.48%Utilities 50,672 6 1.17% 28,777 6 0.67%Property Management 34,614 7 0.80%Property Management 30,629 8 0.71% 25,652 10 0.60%Retail 26,876 9 0.62%Manufacturing 22,961 10 0.53% 26,701 9 0.63%Financial Services 39,119 4 0.92%Property Management 29,856 5 0.70%Financial Services 27,427 8 0.64%
522,104$ 12.09% 443,986$ 10.41%
Note:
(1) Taxpayer confidentiality prevents the disclosure of amounts by company name. The above information is individual taxpayers within the noted industry categories.
Source: City Assessor's Office and Collector of Revenue

200
Table 8
(1)Fiscal Collected within the Fiscal Year Year Taxes Levied Fiscal Year of the Levy Collections Total Collections to Date
Ended for the (2) Percentage Related to PercentageJune 30 Fiscal Year Amount of Levy Prior Year Levies Amount of Levy
2017 65,035$ 60,626$ 93.2% -$ 60,626$ 93.2%2016 64,417 59,795 92.8% - 59,795 92.8%2015 63,872 58,736 92.0% 2,865 61,601 96.4%2014 60,538 55,764 92.1% 3,522 59,286 97.9%2013 58,797 53,545 91.1% 4,576 58,121 98.9%2012 57,723 52,191 90.4% 4,568 56,759 98.3%2011 57,990 52,223 90.1% 4,546 56,769 97.9%2010 56,169 49,634 88.4% 5,521 55,155 98.2%2009 56,104 49,487 88.2% 6,126 55,613 99.1%2008 * 57,734 48,627 84.2% 8,428 57,055 98.8%
Notes:(1) Figures are based on the Collector of Revenue's fiscal year which begins the first Monday of March.(2) Includes monies collected that were paid to the state for reassessment.
* Total collections does not reflect protest monies held in escrow of approximately $4,100.
Source: Collector of Revenue, City of St. Louis.
CITY OF ST. LOUIS, MISSOURIGeneral and Debt Service Funds - Property Tax Levies And Collections -Last Ten Fiscal Years(dollars in thousands)

201
Table 9
PayrollFiscal Revenue Base 1% Tax Total (1) Revenue (1)Year Business Individual Business Individual Earnings Tax Base 0.5% Tax
2017 3,881,600$ 14,207,200$ 38,816$ 142,072$ 180,888$ 7,875,000$ 39,375 2016 3,581,000 13,822,900 35,810 138,229 174,039 7,800,000 39,000 2015 3,597,700 13,349,500 35,977 133,495 169,472 7,574,600 37,873 2014 3,356,500 12,813,900 33,565 128,139 161,704 7,358,400 36,792 2013 3,219,000 12,701,200 32,190 127,012 159,202 7,369,800 36,849 2012 3,354,200 12,482,700 33,542 124,827 158,369 7,021,600 35,108 2011 3,025,300 12,082,700 30,253 120,827 151,080 7,048,400 35,242 2010 2,557,500 12,171,600 25,575 121,716 147,291 7,513,600 37,568 2009 2,221,000 12,166,800 22,210 121,668 143,878 7,186,200 35,931 2008 2,671,400 12,046,700 26,714 120,467 147,181 7,451,200 37,256
Note:Data calculated on a cash basis.
(1) Tax totals include Collector of Revenue commissions
CITY OF ST. LOUIS, MISSOURIEarnings and Payroll TaxLast Ten Fiscal Years(dollars in thousands)
Earnings

202
Table 10
By Industry Classification
Fiscal Year Fiscal Year2017 (1) 2008 (1)
Percentage PercentageTotal of Total Total of Total
Top Ten Companies by Earnings & Earnings & Earnings & Earnings &Industry Classification (2) Payroll Tax Rank Payroll Tax Payroll Tax Rank Payroll Tax
Financial Services 10,010$ 1 4.54% $ 5,103 4 2.92%Education 8,664 2 3.93% 5,566 3 3.18%Manufacturing 6,956 3 3.16% 7,390 1 4.23%Healthcare 6,301 4 2.86% 4,175 5 2.39%Manufacturing 5,025 5 2.28% 2,132 8 1.22%
Government 4,178 6 1.90%Telecommunications 3,968 7 1.80% 6,487 2 3.71%Education 3,849 8 1.75% 2,667 7 1.53%Utilities 3,489 9 1.58% 2,786 6 1.59%
Government 3,289 10 1.49%Manufacturing 1,968 9 1.13%Retail 1,550 10 0.89%
55,729$ 25.29% $ 39,824 22.79%
Note:(1) The percentages are calculated using total taxes from Table 9.
(2) Taxpayer confidentiality prevents the disclosure of amounts by company name. The above information is individual taxpayers within the noted industry categories.
Source: Collector of Revenue
CITY OF ST. LOUIS, MISSOURIPrincipal Earnings and Payroll Tax PayersTop Ten Companies’ Current Fiscal Year and Nine Years Ago
(dollars in thousands)

203
Table 11
(3) (1) (1)General Tax Increment Lease (2) Joint Venture Water Airport Parking Unamortized Total Percentage
Fiscal Obligation Revenue Revenue Capital Financing Federal Other Revenue Revenue Revenue Discounts and Primary of Personal PerYear Bonds Bonds Bonds Leases Agreement Section 108 Obligations Bonds Bonds Bonds Premiums Government Income Capita
2017 37,345 388,669 419,909 48,089 24,068 22,160 18,025 8,485 906,255 64,387 84,452 2,021,844 15.81% 6,4932016 16,795 381,231 438,932 59,391 28,845 26,910 13,538 5,118 686,225 67,113 41,258 1,765,356 13.43% 5,5922015 23,010 340,342 435,005 71,157 33,434 31,370 11,935 2,288 726,010 73,488 38,843 1,786,882 14.31% 5,6292014 28,130 300,321 470,889 76,299 37,844 35,580 16,153 4,760 764,150 69,679 38,767 1,842,572 14.76% 5,7872013 35,050 296,122 473,403 66,713 42,085 39,530 15,502 7,585 794,615 70,527 11,910 1,853,042 14.84% 5,8262012 38,955 246,079 502,429 72,009 46,166 43,250 15,644 11,480 833,960 72,763 10,541 1,893,276 15.16% 5,9352011 42,685 200,202 548,958 75,993 50,092 46,750 11,353 16,000 869,980 74,892 8,811 1,945,716 15.58% 6,0942010 46,300 167,436 567,292 67,779 53,873 50,050 13,191 19,585 905,405 76,925 7,943 1,975,779 15.83% 5,5412009 49,790 163,554 531,615 53,131 57,516 53,160 14,373 23,025 797,105 78,854 9,606 1,831,729 15.74% 5,1352008 50,875 136,987 534,223 59,531 61,028 56,080 6,159 26,325 818,830 81,350 10,237 1,841,625 15.82% 5,163
Note:(1) See Table 16 for personal income and population data. These ratios are calculated using personal income and population for the prior calendar year.(2) Capital Leases include rolling stock and obligations with component units.(3) Prior to fiscal year 2014, deferred amounts on refunding were included in these amounts
CITY OF ST. LOUIS, MISSOURIRatios of Outstanding Debt by TypeLast Ten Fiscal Years(dollars in thousands)
Governmental Activities Business -Type Activities

204
Table 12
General Bonded Debt Outstanding(1) (2)
General Less Debt Total Net Percentage of PerFiscal Obligation Service Bonded Actual Taxable Value o CapitaYear Bonds Fund Debt Property (in dollars)
2017 37,345$ 8,355$ 28,990$ 0.16% 93$ 2016 16,795 6,903 9,892 0.06% 31 2015 23,010 6,966 16,044 0.09% 51 2014 28,130 6,842 21,288 0.13% 67 2013 35,050 8,713 26,337 0.15% 83 2012 38,955 8,137 30,818 0.17% 97 2011 42,685 8,118 34,567 0.19% 108 2010 46,300 7,331 38,969 0.21% 123 2009 49,790 8,216 41,574 0.23% 131 2008 50,875 9,008 41,867 0.27% 131
Note:(1) See Table 5 for property value data.(2) Population data can be found in Table 16
Source: City Assessor's Office and Comptroller's Office
CITY OF ST. LOUIS, MISSOURIRatio of Net General Obligation Debt OutstandingLast Ten Fiscal Years(dollars in thousands except per capita)

205
Table 13
EstimatedEstimated Share of
Debt Percentage OverlappingOutstanding Applicable Debt
Governmental Unit
Debt repaid with property taxesBoard of Education of the City of St. Louis (1): General Obligation Debt 351,863$ 100.00% 351,863$
Other debtMetropolitan St. Louis Sewer District (2) 1,400,884 9.32% * 130,551 St. Louis Public Library (3) 50,000 100.00% * 50,000 Junior College District of St. Louis (4) 17,665 18.63% * 3,291
Subtotal, overlapping debt 1,820,412 535,705
City of St. Louis direct debt (5) 958,265
Total direct and overlapping debt 1,493,970$
Source:(1) Board of Education City of St. Louis.(2) Metropolitan St. Louis Sewer District(3) St. Louis Public Library(4) Junior College District of St. Louis(5) Notes to basic financial statements
Note: * Based on assessed property value
CITY OF ST. LOUIS, MISSOURIDirect and Overlapping Governmental Activities DebtAs of June 30, 2017(dollars in thousands)

206
Table 14CITY OF ST. LOUIS, MISSOURILegal Debt Margin Calculation Last Ten Fiscal Years(dollars in thousands)
Legal Debt Margin Calculation for Fiscal Year Ended June 30, 2017
Assessed Value
Debt limit (10% of assessed value)Debt applicable to limit:
General obligation bondsLess: Amount set aside for repayment .
of general obligation debt.
Total net debt applicable to limit
Legal Debt Margin
Fiscal Year Ended June 30, 2017
2017 2016 2015 2014 2013 2012 2011 2010 2009 2008
Debt limit 456,399 437,300$ 430,209$ 423,288$ 423,933$ 420,253$ 426,565$ 455,015$ 468,315$ 455,718$
Total net debt applicable to limit 28,990 9,708 16,044 21,288 26,337 30,818 34,567 38,969 41,574 41,867
Legal debt margin 427,409$ 427,592$ 414,165$ 402,000$ 397,596$ 389,435$ 391,998$ 416,046$ 426,741$ 413,851$
Total net debt applicable to the limitas a percentage of debt limit 6.35% 2.22% 3.73% 5.03% 6.21% 7.33% 8.10% 8.56% 8.88% 9.19%
Source: Assessor and Comptroller's Office
410,699$
4,563,987$
456,399
37,345
8,355
45,700

Table 15CITY OF ST. LOUIS, MISSOURIPledged-Revenue Coverage,Last Ten Fiscal Years(dollars in thousands)
(1) Coverage ratio as defined by the various bond covenants may be different than that presented here.(2) Coverage ratio for Tax Increment Financings and for Leasehold Revenue Bonds combines several issues.
207
Water Revenue Bonds (1)
Less: NetFiscal Water Operating Available Debt ServiceYear Revenue Expenses Revenue Principal Interest Coverage
2017 53,557$ 43,264$ 10,293$ 412$ 74$ 21.182016 56,538 44,193 12,345 404 33 28.252015 53,842 41,357 12,485 4,019 43 3.072014 56,647 44,645 12,002 3,765 86 3.122013 56,902 40,590 16,312 3,895 143 4.042012 58,631 38,126 20,505 3,740 650 4.672011 56,044 38,535 17,509 3,585 809 3.982010 51,295 37,549 13,746 2,440 959 4.042009 49,173 41,425 7,748 3,300 1,100 1.762008 46,709 39,414 7,295 2,850 1,469 1.69

Table 15CITY OF ST. LOUIS, MISSOURIPledged-Revenue Coverage,Last Ten Fiscal Years(dollars in thousands)
(1) Coverage ratio as defined by the various bond covenants may be different than that presented here.(2) Coverage ratio for Tax Increment Financings and for Leasehold Revenue Bonds combines several issues.
208
FiscalYear
2017201620152014201320122011201020092008
Airport Revenue Bonds (1)
Less: NetAviation Operating Available Debt ServiceRevenue Expenses Revenue Principal Interest Coverage
168,911$ 84,151$ 84,760$ 38,668$ 35,254$ 1.15167,961 74,670 93,291 58,623 18,281 1.21170,315 74,041 96,274 44,095 32,922 1.25178,365 86,524 91,841 30,465 46,318 1.20174,394 83,237 91,157 30,655 41,804 1.26161,518 81,872 79,646 19,985 41,501 1.30165,405 91,993 73,412 29,970 46,942 0.95170,429 87,385 83,044 21,670 44,157 1.26169,961 86,054 83,907 21,725 40,575 1.35178,960 93,600 85,360 25,090 39,664 1.32

Table 15CITY OF ST. LOUIS, MISSOURIPledged-Revenue Coverage,Last Ten Fiscal Years(dollars in thousands)
(1) Coverage ratio as defined by the various bond covenants may be different than that presented here.(2) Coverage ratio for Tax Increment Financings and for Leasehold Revenue Bonds combines several issues.
209
FiscalYear
2017201620152014201320122011201020092008
Parking Revenue Bonds (1)
Parking/ Less: Net Project Operating Available Debt Service
Revenues Expenses Revenue Principal Interest Coverage
18,403$ 8,620$ 9,783$ 2,091$ 826$ 3.3518,272 7,920 10,352 2,381 2,526 2.1117,147 7,603 9,544 2,232 2,738 1.9217,035 7,809 9,226 1,960 2,839 1.9215,935 7,248 8,687 1,860 2,911 1.8216,200 6,855 9,345 1,765 3,005 1.9615,163 6,657 8,506 1,675 3,093 1.7813,765 7,061 6,704 1,595 3,176 1.4115,601 8,691 6,910 1,275 3,246 1.5315,945 8,331 7,614 1,475 3,756 1.46

Table 15CITY OF ST. LOUIS, MISSOURIPledged-Revenue Coverage,Last Ten Fiscal Years(dollars in thousands)
(1) Coverage ratio as defined by the various bond covenants may be different than that presented here.(2) Coverage ratio for Tax Increment Financings and for Leasehold Revenue Bonds combines several issues.
210
FiscalYear
2017201620152014201320122011201020092008
Tax Increment Financing Bonds (1) (2)
Tax Less: NetIncrement Operating Available Debt ServiceRevenue Expenses Revenue Principal Interest Coverage
32,580$ 887$ 33,467$ 12,356$ 19,090$ 1.0629,413 874 28,539 8,868 18,326 1.0523,436 1,064 22,372 16,056 18,772 0.6421,512 850 20,662 6,653 14,944 0.9622,796 898 21,898 7,067 14,000 1.0417,914 697 17,217 5,776 12,800 0.9314,115 631 13,484 5,853 10,189 0.8415,444 477 14,967 7,509 10,434 0.8312,327 401 11,926 5,384 8,793 0.84
9,449 324 9,125 4,000 7,409 0.80

Table 15CITY OF ST. LOUIS, MISSOURIPledged-Revenue Coverage,Last Ten Fiscal Years(dollars in thousands)
(1) Coverage ratio as defined by the various bond covenants may be different than that presented here.(2) Coverage ratio for Tax Increment Financings and for Leasehold Revenue Bonds combines several issues.
211
FiscalYear
2017201620152014201320122011201020092008
Section 108 Downtown ConventionHeadquarters Hotel Project
Tax Less: NetIncrement Operating Available Debt ServiceRevenue Expenses Revenue Principal Interest Coverage R
4,749$ 297$ 4,452$ 3,480$ 494$ 1.124,500 328 4,172 3,270 530 1.104,341 356 3,985 3,080 404 1.144,278 350 3,928 2,890 572 1.134,044 401 3,643 2,720 581 1.104,629 360 4,269 2,560 1,381 1.084,576 260 4,316 2,410 2,387 0.903,701 270 3,431 2,270 2,523 0.725,403 280 5,123 2,130 2,645 1.075,219 286 4,933 2,000 2,756 1.04

Table 15CITY OF ST. LOUIS, MISSOURIPledged-Revenue Coverage,Last Ten Fiscal Years(dollars in thousands)
(1) Coverage ratio as defined by the various bond covenants may be different than that presented here.(2) Coverage ratio for Tax Increment Financings and for Leasehold Revenue Bonds combines several issues.
212
FiscalYear
2017201620152014201320122011201020092008
Justice Center Leasehold Revenue Bonds (1) (2)
Prisoner Less: NetHousing Operating Available Debt Service
Reimbursement Expenses Revenue Principal Interest Coverage
7,450$ -$ 7,450$ 9,485$ 1,136$ 0.70 6,997 - 6,997 9,030 1,587 0.66 6,322 - 6,322 8,615 2,008 0.60 6,259 - 6,259 8,265 2,352 0.59 4,620 - 4,620 7,190 2,653 0.47 5,298 - 5,298 11,020 2,500 0.39 4,494 - 4,494 7,465 3,659 0.40 6,919 - 6,919 5,680 4,238 0.70 6,535 - 6,535 6,620 4,507 0.59 6,375 - 6,375 6,285 4,836 0.57
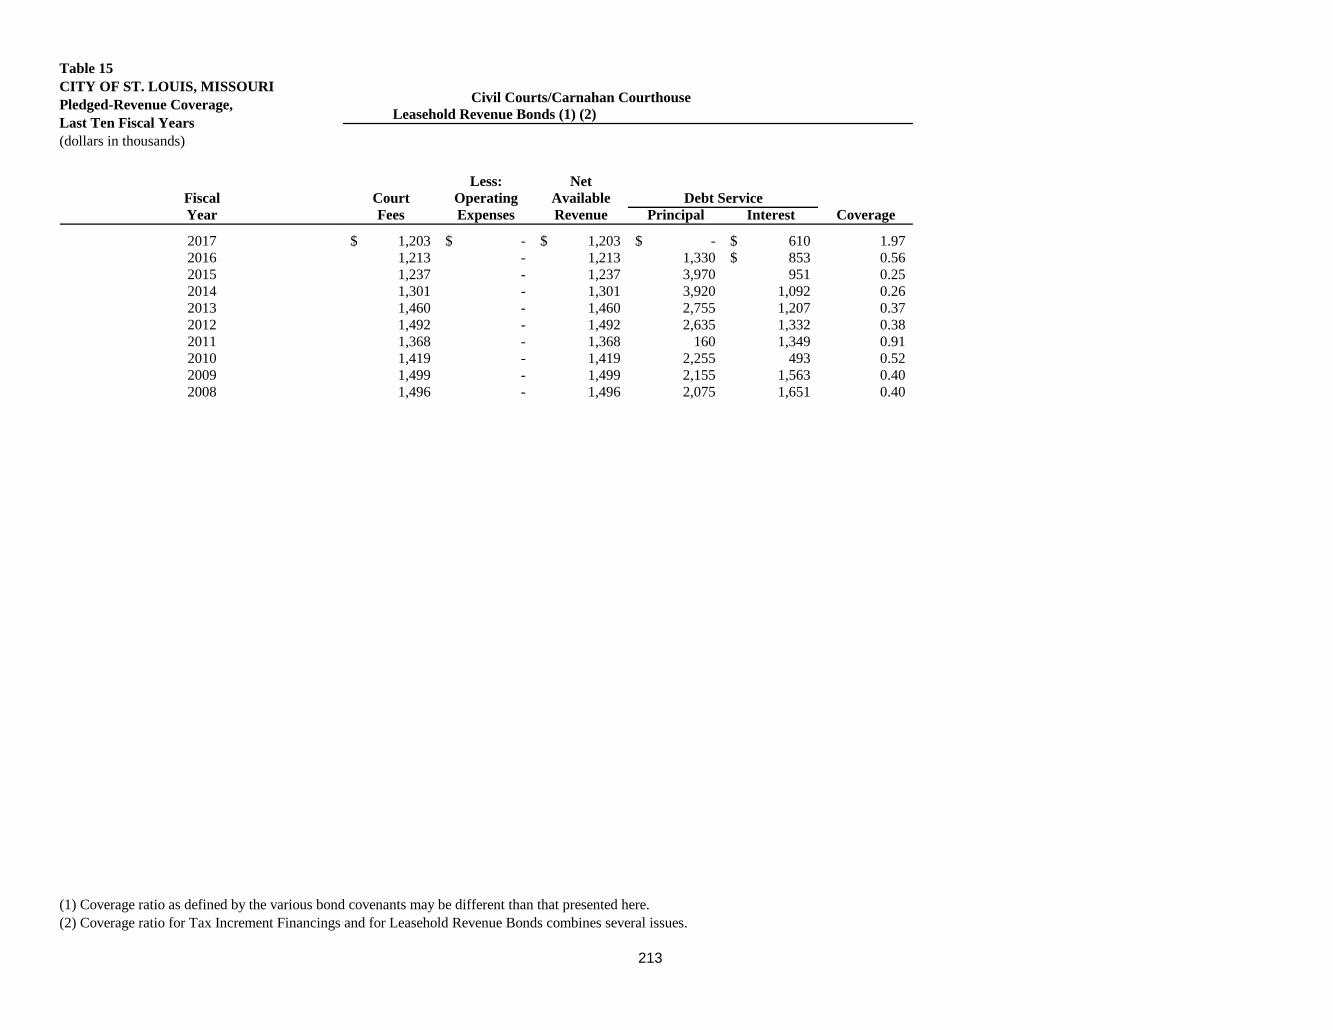
Table 15CITY OF ST. LOUIS, MISSOURIPledged-Revenue Coverage,Last Ten Fiscal Years(dollars in thousands)
(1) Coverage ratio as defined by the various bond covenants may be different than that presented here.(2) Coverage ratio for Tax Increment Financings and for Leasehold Revenue Bonds combines several issues.
213
FiscalYear
2017201620152014201320122011201020092008
Civil Courts/Carnahan Courthouse Leasehold Revenue Bonds (1) (2)
Less: NetCourt Operating Available Debt ServiceFees Expenses Revenue Principal Interest Coverage
1,203$ -$ 1,203$ -$ 610$ 1.97 1,213 - 1,213 1,330 853$ 0.56 1,237 - 1,237 3,970 951 0.25 1,301 - 1,301 3,920 1,092 0.26 1,460 - 1,460 2,755 1,207 0.37 1,492 - 1,492 2,635 1,332 0.38 1,368 - 1,368 160 1,349 0.91 1,419 - 1,419 2,255 493 0.52 1,499 - 1,499 2,155 1,563 0.40 1,496 - 1,496 2,075 1,651 0.40

Table 15CITY OF ST. LOUIS, MISSOURIPledged-Revenue Coverage,Last Ten Fiscal Years(dollars in thousands)
(1) Coverage ratio as defined by the various bond covenants may be different than that presented here.(2) Coverage ratio for Tax Increment Financings and for Leasehold Revenue Bonds combines several issues.
214
FiscalYear
2017201620152014201320122011201020092008
Forest Park Leasehold Revenue Bonds /Subordinate Leasehold Revenue Bonds (1) (2)
10.4% of the Less: Net1/2c capital Operating Available Debt ServiceSales Tax Expenses Revenue Principal Interest Coverage
3,700$ -$ 3,700$ 3,025$ 654$ 1.01 3,533 - 3,533 3,170 549 0.95 3,087 - 3,087 2,470 619 1.00 3,152 - 3,152 1,720 527 1.40 1,815 - 1,815 895 473 1.33 1,905 - 1,905 865 508 1.39 1,740 - 1,740 835 533 1.27 1,722 - 1,722 805 563 1.26 1,814 - 1,814 785 587 1.32 1,849 - 1,849 760 610 1.35

Table 15CITY OF ST. LOUIS, MISSOURIPledged-Revenue Coverage,Last Ten Fiscal Years(dollars in thousands)
(1) Coverage ratio as defined by the various bond covenants may be different than that presented here.(2) Coverage ratio for Tax Increment Financings and for Leasehold Revenue Bonds combines several issues.
215
FiscalYear
2017201620152014201320122011201020092008
Recreation Sales Tax Leasehold Revenue Bonds (1) (2)
Parks and Less: NetRecreation Operating Available Debt ServiceSales Tax Expenses Revenue Principal Interest Coverage
4,689$ -$ 4,689$ 2,010$ 968$ 1.57 4,855 - 4,855 1,155 2,084 1.50 4,886 - 4,886 1,110 2,129 1.51 4,473 - 4,473 1,065 2,172 1.38 4,323 - 4,323 1,025 2,213 1.34 4,520 - 4,520 985 2,252 1.40 4,152 - 4,152 950 2,290 1.28 4,055 - 4,055 910 2,326 1.25 4,280 - 4,280 875 2,361 1.32 4,425 - 4,425 1,665 1,442 1.42

Table 15CITY OF ST. LOUIS, MISSOURIPledged-Revenue Coverage,Last Ten Fiscal Years(dollars in thousands)
(1) Coverage ratio as defined by the various bond covenants may be different than that presented here.(2) Coverage ratio for Tax Increment Financings and for Leasehold Revenue Bonds combines several issues.
216
FiscalYear
2017201620152014201320122011201020092008
Police Capital Improvements Sales Tax Leasehold Revenue Bonds (1) (2)
10% of the Less: Net1/2c Capital Operating Available Debt Service
Sales Tax Expenses Revenue Principal Interest Coverage
1,856$ -$ 1,856$ 350$ 958$ 1.42 1,831 - 1,831 340 970 1.40 1,863 1,863 325 983 1.42 1,889 - 1,889 315 996 1.44 1,747 - 1,747 300 1,008 1.34 1,830 - 1,830 290 1,019 1.40 1,671 - 1,671 280 1,030 1.28 1,654 - 1,654 265 1,041 1.27 1,742 - 1,742 255 1,051 1.33 1,777 - 1,777 1,120 189 1.36

Table 15CITY OF ST. LOUIS, MISSOURIPledged-Revenue Coverage,Last Ten Fiscal Years(dollars in thousands)
(1) Coverage ratio as defined by the various bond covenants may be different than that presented here.(2) Coverage ratio for Tax Increment Financings and for Leasehold Revenue Bonds combines several issues.
217
FiscalYear
2017201620152014201320122011201020092008
City Parks Leasehold Revenue Bonds (1) (2)
6.6% of the1/2cCapital Sales Tax,
15.5% of Metro ParksSales Tax, and Less: Net
60% of Metro Park Operating Available Debt ServiceArch Sales Tax Expenses Revenue Principal Interest Coverage
3,074$ -$ 3,074$ 515$ 1,089$ 1.92 3,091 - 3,091 500 1,104 1.93 3,104 - 3,104 440 1,167 1.93
- - - - - - - - - - - - - - - - - - - - - - - - - - - - - - - - - - - - - - - - - -
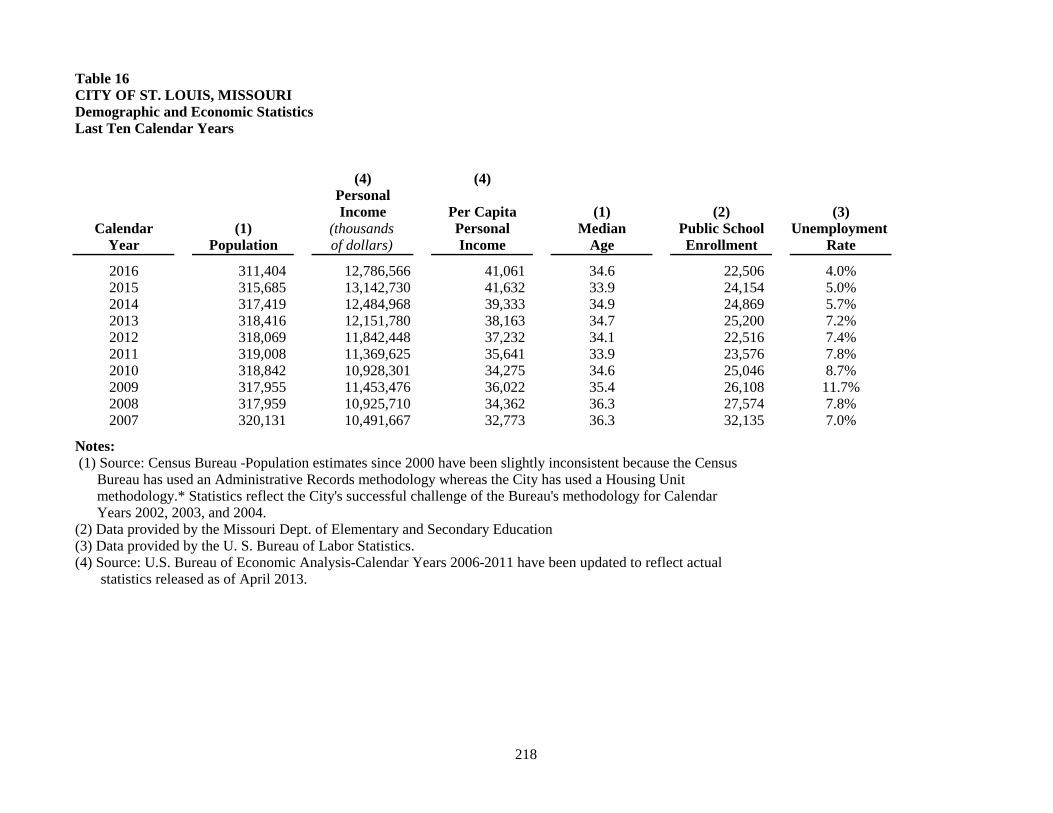
218
Table 16
(4) (4)PersonalIncome Per Capita (1) (2) (3)
Calendar (1) (thousands Personal Median Public School Unemployment Year Population of dollars) Income Age Enrollment Rate
2016 311,404 12,786,566 41,061 34.6 22,506 4.0%2015 315,685 13,142,730 41,632 33.9 24,154 5.0%2014 317,419 12,484,968 39,333 34.9 24,869 5.7%2013 318,416 12,151,780 38,163 34.7 25,200 7.2%2012 318,069 11,842,448 37,232 34.1 22,516 7.4%2011 319,008 11,369,625 35,641 33.9 23,576 7.8%2010 318,842 10,928,301 34,275 34.6 25,046 8.7%2009 317,955 11,453,476 36,022 35.4 26,108 11.7%2008 317,959 10,925,710 34,362 36.3 27,574 7.8%2007 320,131 10,491,667 32,773 36.3 32,135 7.0%
Notes:
(2) Data provided by the Missouri Dept. of Elementary and Secondary Education(3) Data provided by the U. S. Bureau of Labor Statistics.(4) Source: U.S. Bureau of Economic Analysis-Calendar Years 2006-2011 have been updated to reflect actual statistics released as of April 2013.
CITY OF ST. LOUIS, MISSOURIDemographic and Economic Statistics Last Ten Calendar Years
Years 2002, 2003, and 2004.
(1) Source: Census Bureau -Population estimates since 2000 have been slightly inconsistent because the Census Bureau has used an Administrative Records methodology whereas the City has used a Housing Unit methodology.* Statistics reflect the City's successful challenge of the Bureau's methodology for Calendar

219
Table 17
Calendar Year Calendar Year2016 2007
Percentage Percentageof Total City of Total City
Employer Employees Rank Employment Employees Rank Employment
BJC Health Systems 18,354 1 3.98% 16,477 1 3.78%Washington University 16,174 2 3.50% 13,381 2 3.07%St. Louis University 10,078 3 2.18% 9,399 3 2.16%City of St. Louis 8,765 4 1.90% 8,682 4 1.99%Defense Finance & Acct Services 6,508 5 1.41%A G Edwards/Wells Fargo 5,418 6 1.17% 4,811 10 1.10%St. Louis Board of Education 4,940 7 1.07% 5,811 6 1.33%US Postal Service 4,577 8 0.99% 5,109 8 1.17%State of Missouri 4,070 9 0.88% 5,052 9 1.16%SSM Health SLUH 4,070 10 0.88%AT&T Services 5,917 5 1.36%Anheuser Busch 5,164 7 1.19%
82,954 17.96% 79,803 18.31%
Source: City Collector of Revenue
CITY OF ST. LOUIS, MISSOURIPrincipal Employers,Current Calendar Year and Nine Years Ago

220
Table 18CITY OF ST. LOUIS, MISSOURIFull-time Equivalent City Government Employees by Function/ProgramLast Ten Fiscal Years
Full-time equivalent employees as of June 302017 2016 2015 2014 2013 2012 2011 2010 2009 2008
Function/Program:Primary Government Employees:
General government 509 505 506 485 491 498 509 528 539 535 Convention and tourism 2 2 2 3 3 3 2 2 3 3 Parks and recreation 285 284 283 314 313 313 309 322 328 331 Judicial 643 653 653 681 679 706 714 709 721 717 Streets 442 446 451 455 455 455 455 464 463 458 Fire 776 776 776 781 778 813 829 830 830 830 Police 1,818 1,814 1,822 1,841 1,867 1,940 1,943 1,937 1,992 1,938 Other 759 757 752 749 750 709 716 774 814 804 Health and welfare 203 210 212 213 206 220 219 257 278 274 Public service 306 303 302 217 221 222 224 251 258 256 Community development 61 60 65 61 59 65 65 65 65 66
Business-Type Employees:Airport 524 529 530 537 540 555 580 583 637 637 Water Division 344 342 342 341 341 341 361 380 380 376 Parking Division 105 109 105 94 82 89 103 86 90 142
Total Employees 6,777 6,790 6,801 6,772 6,785 6,929 7,029 7,188 7,398 7,367
Source: Budget division

221
Table 19CITY OF ST. LOUIS, MISSOURIOperating Indicators by Function/ProgramLast Ten Fiscal Years
Fiscal Year
2017 2016 2015 2014 2013 2012 2011 2010 2009 2008
General Government Payroll checks issued 185,212 179,475 179,431 180,873 183,489 185,338 191,837 201,642 202,802 269,186 Invoices processed 91,432 91,393 91,341 90,518 95,572 96,571 95,375 98,772 103,352 108,703 Deeds recorded 67,074 48,219 33,120 63,261 74,138 58,991 61,841 66,351 65,740 81,692 Birth and death certificate copies issued 73,643 72,418 68,357 60,780 54,552 55,773 57,898 61,836 65,874 69,107 Marriage licenses processed 2,992 2,992 2,962 2,680 2,358 2,318 2,548 2,570 2,523 2,453 Real property parcels 140,669 140,936 141,364 142,480 143,357 145,166 145,572 145,858 145,507 145,930 Personal property accounts 110,342 110,862 108,878 109,296 107,666 109,439 108,257 108,427 110,285 106,176 Problem properties cases heard* 6,669 5,201 4,894 5,555 7,911 8,942 8,981 8,491 7,932 9,793 Citizen Service Bureau (CSB) calls answered 110,788 107,479 126,780 131,129 119,504 124,637 122,470 102,964 119,531 175,339 CSB service requests issued 79,121 113,245 103,730 65,526 98,306 109,596 119,109 107,116 90,177 107,431
Parks and Recreation and Forestry Park use permits issued 3,007 3,186 3,484 3,212 3,056 3,066 3,170 3,727 3,283 3,434 Vacant lot grass cuttings 46,734 54,693 56,298 52,886 52,079 51,845 52,110 51,015 52,929 95,191 Vacant building grass cuttings 22,332 24,400 22,641 24,775 24,366 24,870 24,124 23,520 22,332 51,663 CSB service requests received 24,560 21,341 22,303 22,149 23,116 24,009 25,660 23,007 26,655 47,408
Judicial Juvenile cases-referrals * 2,026 2,436 2,297 2,395 2,702 3,031 3,444 3,540 4,282 4,840 Jurors summoned 63,797 99,879 120,629 112,881 55,105 59,650 58,230 65,805 71,187 74,450 Jurors who served 20,085 21,244 21,474 17,265 22,596 23,186 20,019 21,582 26,030 23,874
Streets Tons of waste placed in landfills 142,707 142,768 139,667 134,125 150,645 164,134 173,812 185,848 199,725 186,132 Tons of waste recycled 16,589 15,907 15,769 14,686 15,618 12,830 4,842 3,851 4,900 4,855 Vehicles towed 12,837 11,594 9,825 9,197 8,880 8,470 9,850 9,765 11,523 8,829
Public Safety Fire Suppression calls 58,804 56,335 50,067 56,623 46,959 48,159 59,683 51,464 45,855 45,137 EMS calls 54,580 54,968 54,118 68,772 58,213 61,401 74,929 73,771 60,062 59,241 Police Directed calls for service* 285,403 289,780 277,684 237,367 267,435 300,921 309,696 321,015 325,958 348,648 Felony arrests* 11,319 12,970 10,466 12,569 14,205 15,309 13,424 13,284 14,186 14,930 Misdemeanor arrests* 6,509 6,125 3,640 5,043 6,307 8,574 6,986 7,948 8,569 10,048 Police reports written* 72,055 71,046 68,400 66,104 65,337 72,057 76,204 83,339 86,316 94,539
Public Service Contracts executed 137 130 115 125 78 108 81 298 252 205 Bridges inspected 45 43 41 41 44 40 44 33 36 37
Airport Major airlines 7 7 9 9 9 10 10 10 10 9 Commuter airlines 17 14 14 16 18 19 19 19 20 22 Air cargo carriers 3 3 3 3 3 3 3 3 3 4 Passengers 14,359,274 13,323,815 12,487,420 12,339,645 12,747,102 12,681,341 12,399,226 12,514,653 13,271,170 15,220,080 Aircraft operations 193,439 188,466 185,474 184,211 189,068 191,653 186,908 195,409 226,052 255,800
Water Division Bills issued - metered 51,185 51,325 51,327 51,625 51,512 52,000 52,128 52,432 53,208 53,324 Bills issued - flat rate 316,911 317,269 316,850 317,200 316,904 316,000 316,596 321,720 325,420 327,804 Billions of gallons of water purified 42,620 47,645 43,553 45,265 44,922 46,597 43,345 44,015 46,223 47,479
* Information based on calendar year
Source: information is provided by departments

222
Table 20CITY OF ST. LOUIS, MISSOURICapital Asset Statistics by Function/ProgramLast Ten Fiscal Years
Fiscal Year2017 2016 2015 2014 2013 2012 2011 2010 2009 2008
Parks and Recreation Park acreage 3,250 3,250 3,249 3,248 3,248 3,248 3,243 2,960 2,722 2,717 Miles of bicycle paths 38 38 38 38 36 36 36 36 36 36 Athletic fields 153 153 153 153 153 153 152 152 152 152 Recreation centers 7 7 9 9 9 9 7 9 8 9 Neighborhood centers 2 2 - - - - - - 1 1 Swimming pools 11 11 11 11 12 12 7 9 8 8 Golf courses 4 4 4 4 4 4 3 3 2 2
Judicial Court houses 3 3 3 3 3 3 3 3 3 3
Streets Alley containers 26,507 26,507 26,507 26,507 26,507 26,507 27,724 27,724 27,724 27,814 Rollout carts 39,952 39,952 39,952 39,952 39,952 39,952 34,770 21,202 21,202 19,899 Recycling containers 5,744 5,744 5,744 5,744 5,744 5,744 3,434 125 136 130 Streets - paved (miles) 26 27 24 21 14 16 18 21 21 30 Streets - (miles) 1,100 1,100 1,100 1,100 1,100 1,100 1,100 1,100 1,100 1,100 Alleys (miles) 450 450 450 450 450 450 450 450 450 450 Street, alley and easement lights 70,652 70,000 70,000 70,000 70,000 70,000 70,000 70,000 70,059 69,919
Public Safety Fire Fire stations 30 30 30 30 30 30 30 30 30 30 Fire department vehicles 142 139 122 122 122 122 122 114 114 144 Police Police stations 4 4 4 4 3 3 3 3 3 3 Police vehicles 668 679 675 757 759 757 694 710 703 703
Public Service Bridges structurally deficient 15 17 18 15 15 14 15 17 5 16 Bridges functionally obsolete 27 24 28 28 28 27 30 22 20 22 Total bridges 73 73 73 73 73 73 72 71 72 69
Water Division Miles of water mains 1,372 1,400 1,400 1,400 1,400 1,400 1,400 1,400 1,400 1,400 Water storage capacity (gallons) 128,000,000 128,000,000 128,000,000 128,000,000 128,000,000 128,000,000 128,000,000 128,000,000 128,000,000 128,000,000 Treatment Plants 2 2 2 2 2 2 2 2 2 2
Source: information is provided by department personnel

Prepared by:
Office of the Comptroller City of St. Louis, Missouri Honorable Darlene Green Comptroller
Cover photo: Walla Walla Onion sculptures by Dale Chihuly float in front of the Climatron at the Missouri Botanical Garden. The garden was founded in 1859 by philanthropist Henry Shaw and covers 79 acres.