comprehensive annual financial report › financial-documents › sites › ...city of pooler,...
TRANSCRIPT
COMPREHENSIVE
ANNUAL
FINANCIAL
REPORT
City of Pooler, Georgia
For the Year Ended December 31, 2010
Prepared by:
Finance Department


City of Pooler, Georgia
Comprehensive Annual Financial Report
Table of Contents
For the Year Ended December 31, 2010
PAGE
INTRODUCTORY SECTION
Letter of Transmittal............................................................................................................................................... A - 1
Principal Officials................................................................................................................................................... A - 6Organizational Chart............................................................................................................................................... A - 7
Certificate of Achievement for Excellence in Financial Reporting......................................................................... A - 8
FINANCIAL SECTION
INDEPENDENT AUDITORS' REPORT............................................................................................................... B - 1
MANAGEMENT'S DISCUSSION AND ANALYSIS (MD&A)........................................................................... C - 1
BASIC FINANCIAL STATEMENTS:
GOVERNMENT-WIDE FINANCIAL STATEMENTS:Statement of Net Assets.................................................................................................................................. D - 1
Statement of Activities.................................................................................................................................... D - 2
FUND FINANCIAL STATEMENTS:
Governmental Funds:
Balance Sheet.............................................................................................................................................. D - 4
Reconciliation of Total Governmental Fund Balances to
Net Assets of Governmental Activities................................................................................................... D - 5Statement of Revenues, Expenditures, and Changes in Fund Balances...................................................... D - 6
Reconciliation of the Statement of Revenues, Expenditures, and Changes in
Fund Balances of Governmental Funds to the Statement of Activities................................................... D - 7
Proprietary Funds:
Statement of Net Assets - Water and Sewer Enterprise Fund..................................................................... D - 8
Statement of Revenues, Expenses, and Changes in Fund Net Assets - Water and Sewer Enterprise Fund. D - 9
Statement of Cash Flows - Water and Sewer Enterprise Fund.................................................................... D - 10
Fiduciary Funds:
Statement of Net Assets.............................................................................................................................. D - 11
NOTES TO THE BASIC FINANCIAL STATEMENTS................................................................................... D - 12
REQUIRED SUPPLEMENTARY INFORMATION OTHER THAN MD&A:
Budgetary Comparison Schedule - General Fund............................................................................................... E - 1
Notes to Required Supplementary Information................................................................................................... E - 2Schedule of Funding Progress - Pension Plan..................................................................................................... E - 3
Schedule of Funding Progress - Other Postemployment Benefits Plan............................................................... E - 4
SUPPLEMENTARY DATA - Fund Schedules and State Mandated Program Information:
Budgetary Comparison Schedules - Nonmajor Governmental Funds:
Special Revenue Funds: Hotel - Motel Fund....................................................................................................................................... F - 1
Statement of Changes in Assets and Liabilities - Municipal Court Fund............................................................ F - 2
Schedule of Projects Constructed with Special Purpose Local Option Sales Tax Proceeds............................... F - 3
Schedule of Required Expenditures Generated by the Hotel/Motel Tax............................................................. F - 4

City of Pooler, Georgia
Comprehensive Annual Financial Report
Table of Contents
For the Year Ended December 31, 2010
PAGE
STATISTICAL SECTION
FINANCIAL TRENDS:
Net Assets by Component - Last Seven Calendar Years..................................................................................... G - 2
Changes in Net Assets - Last Seven Calendar Years........................................................................................... G - 3Fund Balances, Governmental Funds - Last Ten Calendar Years....................................................................... G - 5
Changes in Fund Balances, Governmental Funds - Last Ten Calendar Years.................................................... G - 6
Schedule of Tax Revenues and Franchise Fees - Last Ten Calendar Years........................................................ G - 8
REVENUE CAPACITY:
Assessed and Actual Value of Taxable Property - Last Ten Calendar Years...................................................... G - 9
Direct and Overlapping Property Tax Rates - Last Ten Calendar Years............................................................. G - 11
Principal Property Taxpayers - Current Year and Eight Years Ago.................................................................... G - 12Property Tax Levies and Collections - Last Ten Calendar Years....................................................................... G - 13
DEBT CAPACITY:
Ratios of Outstanding Debt by Type - Last Ten Calendar Years........................................................................ G - 14Ratios of Net General Bonded Debt Outstanding - Last Ten Calendar Years..................................................... G - 15
Direct and Overlapping Governmental Activities Debt...................................................................................... G - 16
Legal Debt Margin Information - Last Ten Calendar Years............................................................................... G - 17
DEMOGRAPHIC AND ECONOMIC INFORMATION:
Demographic and Economic Statistics - Last Ten Calendar Years..................................................................... G - 18
Principal Employers - Current Year and Nine Years Ago.................................................................................. G - 19
OPERATING INFORMATION:
Full Time City Employees by Function/Program - Last Ten Calendar Years..................................................... G-20
Operating Indicators by Function - Last Ten Calendar Years............................................................................. G-21
Capital Asset Statistics by Function - Last Ten Calendar Years......................................................................... G-22
COMPLIANCE SECTION:
Report on Internal Control over Financial Reporting and on Compliance and Other Matters Based on an
Audit of Financial Statements Performed in Accordance with Government Auditing Standards....................... H-1

INTRODUCTORY SECTION


Mayor Michael F. Lamb
CITY COUNCIL
Bruce Allen Rebecca C. Benton
Shannon Black David M. Burke
Mike Royal Stevie E. Wall
Honorable Mayor,
CITY OF POOLER 100 Southwest Highway 80
Pooler, Georgia 31322 (912) 748-7261
Fax: (912) 330-0987 www.pooler-ga.us
April 20, 2011
Members of Council, and Citizens City of Pooler
Robert H. Byrd, Jr. - City Manager
Steve Scheer - City Attorney
The City Manager's office is pleased to submit the Comprehensive Annual Financial Report for the City of Pooler for the year ended December 31 , 2010. The purpose of this report is to provide the Council, management, staff, the public and other interested parties with detailed information reflecting the City's financial condition. This report also satisfies the state law to publish an annual audit within six months of the close of each fiscal year. Responsibility for both accuracy of the presented data and the completeness and fairness of the presentation, including all disclosures, rest with the City. To meet these responsibilities management has established a comprehensive framework of internal control. Because the cost of internal controls should not exceed anticipated benefits, the objective is to provide reasonable, rather than absolute, assurance that the financial statements are free of any material misstatements.
Karp, Ronning & Tindol, Certified Public Accountants, have issued an unqualified ("clean") opinion on the City of Pooler's financial statements for the year ended December 31, 2010. The independent auditor's report is located at the front of the financial section of this report.
Management's discussion and analysis (MD&A) immediately follows the independent auditor's report and provides a narrative introduction, overview, and analysis of the basic financial statements. The MD&A complements this letter of transmittal and should be read in conjunction with it.
A - 1

Profile of Government
The City of Pooler is located in Chatham County, Georgia 10 miles west of the City of Savannah. The City encompasses an area of approximately 31 square miles and has a current population of 19,140.
The City Council appoints a City Manager to manage the City on a daily basis and implement the policies and programs enacted by the Council. The City Council also appoints a City Clerk and a Finance Officer.
The City provides a full range of municipal services, including general government, public safety (police and fire), recreation, street and drainage maintenance, code enforcement, solid waste collection and disposal, and water and sewer utilities.
The criteria used by the City for including activities in preparing its financial statements are set forth in GASB Statement No. 14. Based on these criteria, all municipal services listed above are included in the City's financial statements. In addition, the Pooler Development Authority is considered to be a component unit of the City and is treated as such in the City's financial statements.
The City Council adopts and reports armual budgets for its general and special revenue funds as required by state law. The legal level of control (the level at which expenditures may not exceed appropriations) is at the department level.
Local Economy
Over the past ten years, the City of Pooler has experienced unprecedented growth. In 2000, the US Census Bureau estimated the population of Pooler to be 6,239. As of the 2010 Census, the population more than tripled. Several new communities have been developed in Pooler which has also sparked commercial development and employment opportunities. The geographical location of the City combined with quality of life benefits that Pooler has to offer contributed to the growth.
Although the City is still optimistic about additional growth and development in Pooler, the past three fiscal years have seen a decline in residential development brought about by the current economic downswing that is common throughout the entire country. Over the previous ten years, the City issued an average of 467 residential construction permits and 50 commercial construction permits armually. In 2010, residential permitting was down to 174 permits which was a 16% decline from the 207 permits issued last year for new residential construction. However, the number of commercial construction permits issued increased from 36 in 2009 to 50 in 20 I 0 and is consistent with the previous 10 year average. The City continues to issue permits to office complexes, fast food establishments, medical and dental clinics, and restaurants.
A - 2

The City of Pooler has 12 hotels to offer the traveling public on Interstate 95. In 20 I 0, the City had an average annual occupancy of 65 percent. The City received $562,207 in hotel excise tax in 2010 which was 6.7% lower than revenue collected in the previous year. The revenue from this tax has been decreasing over the past 5 years, which is another indication of the current economic conditions. The City has also seen declines in Local Option Sales Tax collections. LOST collections in 2010 were $1,847,965 compared to $2,050,733 in 2007, nearly a 10% decrease. However, the City issued 1,218 business licenses in 2010 which is a slight increase (2.7%) from the previous year in which only 1,186 business licenses were issued.
Due to the increase in population over the past few years, the City of Pooler has been attracting several family entertainment-oriented businesses. In 20 I 0, two movie theatres opened in Pooler, and plans scheduled for 20 II include a 14-acre water park to be built near the new bowling alley, as well as a skating rink. The large number of residents moving to Pooler also resulted in a Publix grocery store opening in 20 I 0 along Pooler Parkway. Future plans tentatively include another grocery store, additional restaurants, as well as a nationally recognized drugstore. All of these projects will help to stimulate the economy in Pooler, as well as make the city a more attractive place for families to reside.
In 2009, the State of Georgia decided to sell multiple parcels located at the 1500-acre "Mega Site" along 1-16 rather than continue to market to one manufacturing business. The Savannah Economic Development Authority leased a 119-acre parcel on the "Mega Site" to Mitsubishi Power Systems America, Inc. in September of 2009 on which the company intends to build a manufacturing facility for the production of advanced steam and gas turbines and to service turbines and related components for power generation.
Construction of Phase I of the facility has already begun, with 2 more phases to be constructed later. In 20 II, construction will begin on a rail spur from the CSX line to help facilitate distribution of products manufactured at the new facility. Mitsubishi expects to hire approximately 200 employees in the first 2 years including engineers, skilled tradespeople and administrative staff. By 2015, the company expects to have nearly 500 positions at the facility. Currently, the major employers for the residents of Pooler continue to be Gulfstream Aerospace and International Paper.
Long-term Financial Planning
Adherence to the City' s financial planning, revenue, and expenditure policies has allowed the City to maintain a general fund unreserved fund balance of approximately $7.6 million or 71 % ofthe general fund's current expenditures. Management believes this balance will be vital in the financial planning for the future ofthe City of Pooler.
A - 3

Major Initiatives
The City has taken necessary steps to assure quality growth. Infrastructure improvements to the water and sewer system have been made to accommodate the influx of new residents. Currently, engineering design work, as well as various construction projects, are underway for the expansion of Pooler's state of the art wastewater treatment plant. This expansion will increase the City's treatment capacity from 2.5 to 3.34 millions of gallons per day.
Effluent from the treatment plant is being pumped through re-use lines to the local golf course and the City's newly constructed recreation complex. The first phase of the complex was opened in April of 2009. At build-out, the complex will be one of the largest recreation facilities in this area and will have the potential to host regional tournaments and bring people from surrounding areas to Pooler. The benefit to our local restaurants and hotels makes this prospect very attractive to the City.
As noted in prior years, City Council has adopted zoning ordinances which encourage planned developments for those property owners of large tracts of land. By professionally planning these projects, the owner can maximize the full potential of their land, and the City can accurately prepare for growth. Currently there are six different planned communities within the City's limits. Savannah Quarters to the south includes a golf community, a retirement village, and a master planned commercial/retail development. The Jabot Tract, also on the south end of town, has been master planned for up-scale single-family, multi-family and commercial developments. The Morgan Tract, located on the north side of Pine Barren Road, has primarily light industrial zoning planned due to its close proximity to the Pooler Parkway, Interstate 1-16 and 1-95 and the Central of Georgia railroad. Some multi-family and commercial development is also proposed. And Godley Station, located to the north, includes retail shopping developments and single- and multi-family residential developments. Godley Station at build-out will include approximately 1,500 single-family homes. The 589 acre Morgan Lakes PUD is located on the north side of Jimmy DeLoach Parkway and consists of a mixture of single-family and multi-family town homes. Our newest PUD is the 717.5 acre Wynn-Capallo tract located on the north and south side of Jimmy DeLoach Parkway. This mixed-use development includes commercial/retail and approximately 764 developmental units.
A wards and Acknowledgments
The Government Finance Officers Association of the United States and Canada (GFOA) awarded the Certificate of Achievement for Excellence in Financial Reporting to the City of Pooler for its comprehensive annual financial report for the year ended December 31,2009. This was the ninth year the City has achieved this prestigious award. In order to be awarded a Certificate of Achievement, a government must establish an easily readable and efficiently organized comprehensive financial report. This report must satisfy both generally accepted accounting principles and applicable legal requirements.
A - 4

A Certificate of Achievement is valid for a period of one year only. We believe that our current comprehensive annual financial report continues to meet the Certificate of Achievement Program's requirements and we are submitting it to the GFOA to determine its eligibility for another certificate.
This report could not have been completed without the assistance of the entire administrative staff in various departments of the City. We would like to especially acknowledge the dedicated services and help of the staff members in the Finance Department. The Finance staff members are key components in the maintenance of the City ' s accounting systems and records, and their contributions are invaluable.
Respectfully submitted,
Robert H. Byrd, Jr. City Manager
jj~f~Uc~ Michelle McNeely 1 Finance Officer
A - 5


A - 6
Mayor......................................................................................... Michael F. Lamb
City Manager.............................................................................. Robert H. Byrd, Jr.
City Clerk................................................................................... Maribeth Lindler
Finance Officer.......................................................................... Michelle McNeely
Chief of Police........................................................................... Mark Revenew
Chief of Fire............................................................................... Wade Simmons
Director of Public Works........................................................... Matt Saxon
Director of Recreation................................................................ Hugh Elton
Director of Human Resources.................................................... Julie Moore
City Attorney.............................................................................. Steven E. Scheer
City Council Members
Bruce Allen, Mayor Pro-Tem................................................. Chair - Building and Zoning
Mike Royal.............................................................................. Chair - Public Safety
Rebecca Benton....................................................................... Chair - Streets and Drainage
Shannon Black........................................................................ Chair - Recreation
David Burke............................................................................ Chair - Finance
Stevie E. Wall......................................................................... Chair - Water and Sewer
(912) 748-7261Fax (912) 748-0157
City of Pooler, Georgia
List of Principal Officials
December 31, 2010
City Hall

City of Pooler, GeorgiaCity of Pooler, Georgia
Organizational Chart
December 31, 2010
A - 7

Certificate of
Presented to
City of Pooler
For its Comprehensive Annual
December 31, 2009
President
Executive Director
Financial Reportfor the Fiscal Year Ended
Reportingin Financial
for ExcellenceAchievement
Text38: Georgia
A Certificate of Achievement for Excellence in FinancialReporting is presented by the Government Finance Officers
Association of the United States and Canada togovernment units and public employee retirement
systems whose comprehensive annual financialreports (CAFRs) achieve the higheststandards in government accounting
and financial reporting.
A - 8


FINANCIAL SECTION


KARP, RONNING & TINDOLCERTIFIED PUBLIC ACCOUNTANTS
B - 16600 ABERCORN STREET • SUITE 200 SAVANNAH, GEORGIA 31405
P.O. BOX 16149 SAVANNAH, GEORGIA 31416
912-232-0475 TEL 912-232-0478 FAX www.krtcpa.com
INDEPENDENT AUDITORS’ REPORT
Honorable Mayor and Members of the
City Council
City of Pooler, Georgia
We have audited the accompanying financial statements of the governmental activities, the business-type activities, the discretely presented component unit, each major fund, and the remaining fund information of the City of Pooler, Georgia, as of and for the year ended December 31, 2010, which collectively comprise the City’s basic financial statements as listed in the table of contents. These financial statements are the responsibility of the City of Pooler, Georgia’s management. Our responsibility is to express opinions on these financial statements based on our audit.
We conducted our audit in accordance with auditing standards generally accepted in the United States of America and the standards applicable to financial audits contained in Government Auditing Standards,issued by the Comptroller General of the United States. Those standards require that we plan and perform the audit to obtain reasonable assurance about whether the financial statements are free of material misstatement. An audit includes examining, on a test basis, evidence supporting the amounts and disclosures in the financial statements. An audit also includes assessing the accounting principles used and significant estimates made by management, as well as evaluating the overall financial statement presentation. We believe that our audit provides a reasonable basis for our opinions.
In our opinion, the financial statements referred to above present fairly, in all material respects, the respective financial position of the governmental activities, the business-type activities, the discretely presented component unit, each major fund, and the remaining fund information of the City of Pooler, Georgia, as of December 31, 2010, and the respective changes in financial position and cash flows, where applicable, thereof for the year then ended in conformity with accounting principles generally accepted in the United States of America.
In accordance with Government Auditing Standards, we have also issued a report dated April 15, 2011 on our consideration of the City of Pooler, Georgia’s internal control over financial reporting and our tests of its compliance with certain provisions of laws, regulations, contracts, and grant agreements and other matters. The purpose of that report is to describe the scope of our testing of internal control over financial reporting and compliance and the results of that testing, and not to provide an opinion on the internal control over financial reporting or on compliance. That report is an integral part of an audit performed in accordance with Government Auditing Standards and important for assessing the results of our audit.
The Management’s Discussion and Analysis and the required supplementary information other than Management’s Discussion and Analysis beginning on page C-1 and E-1, respectively, are not a required part of the basic financial statements but are supplementary information required by accounting principles generally accepted in the United States of America. We have applied certain limited procedures, which consisted principally of inquiries of management regarding the methods of measurement and presentation of the required supplementary information. However, we did not audit the information and express no opinion on it.

B - 26600 ABERCORN STREET • SUITE 200 SAVANNAH, GEORGIA 31405
P.O. BOX 16149 SAVANNAH, GEORGIA 31416
912-232-0475 TEL 912-232-0478 FAX www.krtcpa.com
Our audit was made for the purpose of forming opinions on the financial statements that collectively comprise the City of Pooler, Georgia’s basic financial statements. The introductory section, the supplementary data – fundschedules and state mandated program information, and the statistical section are presented for purposes of additional analysis and are not a required part of the basic financial statements. The supplementary data – fundschedules and state mandated program information have been subjected to the auditing procedures applied in the audit of the basic financial statements and, in our opinion, are fairly stated in all material respects in relation to the basic financial statements taken as a whole. The introductory and statistical sections have not been subjected to the auditing procedures applied in the audit of the basic financial statements and, accordingly, we express no opinion on them.
April 15, 2011
C - 1
MANAGEMENT’S DISCUSSION AND ANALYSIS
INTRODUCTION
Our discussion and analysis of the financial performance of the City of Pooler provides an overview of the City’s financial activities for the calendar year ended December 31, 2010. The intent of the management discussion and analysis is to look at the City’s financial performance as a whole. Readers should also review the transmittal letter, financial statements and notes to the financial statements to enhance their understanding of the City’s financial performance.
The reporting model used by the City of Pooler is a combination of both government-wide financial statements and fund financial statements. The basic financial statements contain three components:
1) Government-wide financial statements including the Statement of Net Assets and the Statement of Activities which provide a broad, long-term overview of the City’s finances.
2) Fund financial statements, including the balance sheets, that provide a greater level of detail of revenues and expenditures and focus on how well the City has performed in the short term in the most significant funds, and
3) Notes to the financial statements.
This report presents the financial highlights for 2010 and contains other supplementary information.
FINANCIAL HIGHLIGHTS
The City’s assets exceeded its liabilities at December 31, 2010 by $44,104,224 (net assets). Of this amount, $20,560,490 (unrestricted net assets) may be used to meet the City’s ongoing obligations to citizens and creditors.
The City’s total net assets increased $1,697,342 from the previous year. This increase consists of $1,168,855 from Governmental Activities and $528,487 from Business-Type Activities.
Key factors resulting in the increase include:
o The net assets of governmental activities increased partly due to a change in the payment schedule of Georgia Power’s franchise fees which resulted in an increase in revenues from 2009 to 2010 of nearly $500,000. In addition, the city received just over $800,000 in federal and state funds for improving the city’s fire department operations and installing traffic signals, respectively.
o The increase in net assets of business-type activities was realized due to a 5% increase in water and sewer fees in 2010.
At December 31, 2010 the City’s governmental funds balance sheet reported a combined ending fund balance of $9,432,273, an increase of $394,247 from the previous calendar year. The increase resulted from the intergovernmental funds received that were mentioned previously and an overall reduction in spending realized in 2010. Of the combined fund balance, $9,410,438remains in the various fund types of the City as unreserved.
The General Fund reported an unreserved fund balance of $7,603,418, which is an approximate increase over 2009 of $476,401.

C - 2
GOVERNMENT-WIDE FINANCIAL ANALYSIS
Net Assets
As noted earlier, net assets may serve over time as a useful indicator of a government’s financial position. The City’s combined net assets (government and business-type activities) totaled $44.1 million at December 31, 2010.
The following table presents a summary of the City’s Net Assets at December 31, 2010:
2010 2009 2010 2009 2010 2009
Current assets.............................. 11,872,894$ 11,007,628$ 13,051,602 14,191,416$ 24,924,496$ 25,199,044$
Capital assets, net....................... 13,018,234 12,697,686 31,836,859 31,453,777 44,855,093 44,151,463
Total assets................................. 24,891,128 23,705,314 44,888,461 45,645,193 69,779,589 69,350,507
Current liabilities........................ 356,929 391,118 410,283 752,028 767,212 1,143,146
Noncurrent liabilities.................. 6,329,168 6,278,020 18,578,985 19,522,459 24,908,153 25,800,479
Total liabilities............................ 6,686,097 6,669,138 18,989,268 20,274,487 25,675,365 26,943,625
Net assets:
Invested in capital assets,
net of related debt................. 7,684,621 7,047,370 13,321,328 11,988,584 21,005,949 19,035,954
Restricted................................. 1,804,340 1,881,686 733,445 1,103,235 2,537,785 2,984,921
Unrestricted............................. 8,716,070 8,107,120 11,844,420 12,278,887 20,560,490 20,386,007
Total net assets............................ 18,205,031$ 17,036,176$ 25,899,193$ 25,370,706$ 44,104,224$ 42,406,882$
Governmental Activities Business-Type Activities Total
The largest portion of the City’s net assets (47.6%) represents its investment in capital assets such as land, buildings, and equipment, less any related debt used to acquire those assets that is still outstanding. The City uses these capital assets to provide services to citizens; consequently, these assets are not available for future spending. Although the City’s investment in its capital assets is reported net of related debt, it should be noted that the resources needed to repay this debt must be provided from other sources, since the capital assets themselves cannot be used to liquidate these liabilities. The second largest portion of the City’s total net assets (46.6%) reflects unrestricted net assets that may be used to meet the City’s ongoing obligations to citizens and creditors. Internally imposed designations of resources are not presented as restricted net assets. The remaining balance of total net assets contains resources that are subject to external restrictions on how they may be used, such as SPLOST money and contributions from private developers restricted for debt service on GEFA loans.
At the end of the current calendar year, the City is able to report positive balances in all three categories of net assets for the government as a whole. Positive balances are reported for the City’s separate governmental and business-type activities.
In the City’s business-type activities, net assets invested in capital assets increased approximately $1.3million due to the installation of sewer infrastructure and the expansion of the Public Works building, as well as the addition of miscellaneous equipment.
The City’s total net assets increased nearly $1.7 million from 2009 to 2010. Net assets in governmental activities increased $1,168,855 which accounts for 69% of the increase. This increase is attributable to the increase in franchise fee collections, as well as the addition of a new fire truck along with retirement of other debt in 2010. The remainder of the growth in total net assets resulted from a 5% water and sewer rate increase in the business-type activities fund.

C - 3
Changes in Net Assets
The following table presents a summary of the changes in net assets for the year ended December 31, 2010:
2010 2009 2010 2009 2010 2009
Revenues:
Program Revenues:
Charges for services................................. 2,133,428$ 1,723,030$ 4,747,291$ 4,065,215$ 6,880,719$ 5,788,245$
Operating grants and contributions.......... 537,167 102,329 - - 537,167 102,329
Capital grants and contributions.............. 316,245 142,000 1,154,287 1,430,242 1,470,532 1,572,242
General Revenues:
Property and sales taxes........................... 5,437,911 7,279,847 - - 5,437,911 7,279,847
Selective sales and use taxes.................... 2,893,335 1,068,824 - - 2,893,335 1,068,824
Business taxes.......................................... 555,497 653,599 - - 555,497 653,599
Other taxes............................................... 12,314 - - - 12,314 -
Unrestricted grants and contributions...... 199,578 107,892 - - 199,578 107,892
Other........................................................ 85,960 57,425 62,631 76,080 148,591 133,505
Total revenues................................................ 12,171,435 11,134,946 5,964,209 5,571,537 18,135,644 16,706,483
Expenses:
General government.................................... 679,957 1,111,240 - - 679,957 1,111,240
Public safety................................................ 4,593,471 4,582,679 - - 4,593,471 4,582,679
Public works................................................ 2,896,229 2,644,005 - - 2,896,229 2,644,005
Health and welfare...................................... 189,957 177,029 - - 189,957 177,029
Culture and recreation................................. 1,763,580 2,091,260 - - 1,763,580 2,091,260
Housing and development........................... 649,072 681,187 - - 649,072 681,187
Interest on long-term debt........................... 230,314 245,443 - - 230,314 245,443
Water and sewer.......................................... - - 5,435,722 5,899,528 5,435,722 5,899,528
Total expenses................................................ 11,002,580 11,532,843 5,435,722 5,899,528 16,438,302 17,432,371
Change in net assets........................................ 1,168,855 (397,897) 528,487 (327,991) 1,697,342 (725,888)
Net assets - beginning..................................... 17,036,176 17,434,073 25,370,706 25,698,697 42,406,882 43,132,770
Net assets - ending.......................................... 18,205,031$ 17,036,176$ 25,899,193$ 25,370,706$ 44,104,224$ 42,406,882$
Governmental Activities Business-Type Activities Total
Approximately 49% of the City’s total revenue in 2010 came from taxes and 38% came from user charges, while the remainder resulted from various operating grants and capital contributions. The City’s expenses cover a range of services. The largest expenses were for water and sewer, public safety, public works, and culture and recreation. Although the water and sewer departments contributed to the largestportion of expenses in 2010 (33%), these departments had fewer expenses than in 2009 mostly due to attrition and a hiring freeze instituted in 2009. There was no significant change in the costs associated with Public Safety from 2009 to 2010, however, Public Works saw a 10% increase in expenses from $2,644,005 in 2009 to $2,896,229 in 2010 mostly due to rising energy costs as well as a contractual increase in the cost of solid waste removal. Culture and Recreation expenses decreased from $2,091,260 in 2009 to $1,763,580 in 2010 also due to attrition and the hiring freeze, as well as a more efficient approach to managing the various departments that make up the Culture and Recreation function.
The total excess of revenues over expenditures in 2010 totaled $1,697,342. The key factors for the increase in total net assets were discussed earlier in the financial highlights section.
C - 4
FINANCIAL ANALYSIS OF THE CITY’S FUNDS
The City utilizes fund accounting to ensure and demonstrate compliance with finance-related legal requirements.
Governmental Funds
Governmental funds provide information on near-term inflows, outflows, and balances of available resources. The governmental fund types include the general fund, capital projects (Special Purpose Local Option Sales Tax Fund) fund and a special revenue fund. The General Fund and the Capital Projects Fund are reported as the City’s major funds. The remaining fund of the City is presented as an Other Governmental Fund. As of December 31, 2010, the City governmental funds reported a combined fund balance of $9,432,273, an increase of $394,247 from the prior year’s combined balance. The General Fund has a reserved total of $21,835 of the fund balance to meet commitments for public safety programs.
Governmental funds are reported on pages D-4 through D-7.
General Fund
The general fund is the chief operating fund of the City. At December 31, 2010 the total fund balance in the general fund was $7,625,253. The total amount of unreserved fund balance for the general fund was $7,603,418.
One measure of the general fund’s liquidity is to compare its unreserved fund balance and total fund balance to total fund expenditures. Unreserved, undesignated fund balance and total fund balance represents 70.8% and 71% of total general fund expenditures respectively.
The fund balance of the general fund increased $468,913 during the 2010 fiscal year with expenditures remaining consistent from the previous year. Revenue collections also remained consistent from last year, however, the increase in the fund balance resulted primarily from federal grants for fire operations and equipment, as well as state funds for the installation of two traffic signals.
Special Purpose Local Option Sales Tax Fund
The Capital Projects Fund had a total fund balance of $1,807,020 at the end of 2010 which must be used for special purpose local option sales tax projects. The fund balance decreased $74,666due to various SPLOST-related expenditures for drainage, recreation, and a project to install new sidewalks along Pooler Parkway. An additional expenditure of $166,950 from the SPLOST fund was made in 2010 for debt service on revenue bonds issued in 2007 for the recreation park. The City collected $199,578 in SPLOST revenue from Chatham County towards the end of 2010 after the delayed payment schedule created in the current SPLOST agreement was completed.
Proprietary Funds
Proprietary fund statements provide the same information as in the business activities column of the government-wide statements, only in greater detail. The City currently utilizes only one enterprise fund at this time in the proprietary fund financial statements, the Water and Sewer enterprise fund. An enterprise fund is required to be used to account for the operations for which a fee is charged to external users for goods or services.
At December 31, 2010, total net assets amounted to $25,899,193 for the enterprise fund compared to $25,370,706 at December 31, 2009. The change in net assets (an increase of $528,487) can be attributed to the 5% increase in water and sewer fees in 2010, as well as an overall attempt to reduce expenses.
The enterprise fund is reported on pages D-8 through D-10.

C - 5
Fiduciary Funds
The City of Pooler operates only one fiduciary fund which represents the Municipal Court function. This fund does not report a fund balance since all of the reportable assets are monies owed to other entities. In the Municipal Court fund, liabilities at year end totaled $144,741 which represents monies owed to other governmental agencies and monies owed to others, such as bond refunds.
The fiduciary fund is reported on page D-11.
CAPITAL ASSETS
The Statement of Net Assets presents capital assets in two groups: those assets subject to depreciation, such as equipment or operational facilities and those assets not subject to depreciation such as land and construction-in-progress. At December 31, 2010, the City’s net capital assets for both governmental activities and business-type activities totaled $44,855,093. Capital assets include assets purchased and donated, land, buildings, system improvements and machinery and equipment. Capital Assets increased $703,630, or 2%, from what was reported at the end of 2009.
Major capital asset events during the year included the following:
Construction of a sewer force main near I-16 at Savannah Quarters totaling $259,182.
Installation of a transmission tower for the sewer system totaling $168,565.
Addition of a Pierce Fire Truck in the amount of $399,502.
General equipment purchase of approximately $165,000 for the public safety function.
Installation of 2 new traffic signals on Pooler Parkway totaling $371,665.
Additional information on the City’s capital assets can be found in Note 2E on page D-20 to D-21.
DEBT ADMINISTRATION
The long-term liabilities at December 31, 2010 totaled $24,165,892. Of this amount, $5,586,907represents the governmental activities and $18,578,985 represents the business-type activities.
Overall, long-term liabilities decreased from 2009 by $1,260,392. The only addition to long-term liabilities in 2010 (other than compensated absences) was a lease-purchase agreement in governmental activities for 2 new police cruisers totaling $42,281. Business-type activities realized a reduction of $943,474 in long-term liabilities mostly due to payments being made on GEFA loans using revenue received through the collection of capital cost recovery fees from residential and commercial development.
Additional information on the City’s debt can be found in Note 2G on page D-22 and D-24.

C - 6
GENERAL FUND BUDGETARY HIGHLIGHTS
The budgetary comparison schedule of the General Fund is provided as required supplementary information other than MD&A and can be found on pages E-1 and E-2. Additional budgetary comparison schedules of the special revenue fund can be found within other supplementary information on page F-1. Budget columns are provided for both the original budget adopted for calendar year 2010 as well as the final budget. A column for actual resources (revenues), appropriations (expenditures), and a column for any variance between final budget and actual are also provided. Resources and appropriations are discussed net of transfer in or out.
The overall operations of the City are similar to directing a large multi-million dollar business. Budget amendments are approved throughout the year to more accurately reflect the ongoing changes and to abide by state laws. The original budget was adopted on December 21,2009.
During the year there was a $654,379 increase in appropriations between the original and final amended budget. Following are the main components of the increase:
Installation of 2 traffic signals along Pooler Parkway
Engineering design costs associated with the development of 3 new fire stations to be constructed in 2011
Total revenue and other financing sources actually recorded for this calendar year were $11,215,299, which is $159,730 more than the final budget amount.
Explanations for individual major category variances in resources are as follows:
Revenue from property taxes was approximately $50,000 more than what was budgeted. In 2010, the City of Pooler entered into an agreement with Chatham County for property tax billing and collection which made the actual revenue stream more difficult to predict.
Local Option Sales Tax collections amounted to $36,000 more than the budgeted amount as a result of the changing economy.
Also as a result of an economy that is very difficult to predict, alcohol beverage licenses, business regulatory fees, and building permits totaled over $14,000 more than the budgeted amount collectively.
The total appropriations (expenditures) actually recorded for the calendar year were $10,746,386. This figure is $309,183 less than the final budgeted figure. Individual major category variances in expenditures and explanations are as follows:
Police expenditures for salaries and benefits were less than what was budgeted due to administrative changes and employee turnover.
The Fire department was able to purchase budgeted equipment at a discounted cost and therefore expenditures were less than what was budgeted.
The Parks and Trees department expended less money than what was budgeted by finding more efficient ways to perform the duties of this department, such as combining general duties with those of the Recreation department.

C - 7
ECONOMIC FACTORS AND NEXT YEAR’S BUDGET
The City adopted a general fund budget of $12,722,167 for the calendar year 2011. This budget includes approximate expenditures of $1.5 million to construct 3 new fire stations in an effort to improve the City’s ISO rating. Options for funding construction include a low-interest loan from the United States Department of Agriculture or Georgia Municipal Association financing. The City will continually look for new ways in the future to reduce the reliance on one-time revenue sources.
REQUESTS FOR INFORMATION
This financial report is designed to provide a general overview for the governmental operations of the City of Pooler. It is designed for anyone with an interest in our government’s finances and management. Questions concerning any of the information provided in this report or requests for additional information may be addressed to the City of Pooler, Finance Officer, 100 Highway 80 SW, Pooler, Georgia 31322.


BASIC FINANCIAL STATEMENTS


GOVERNMENT-WIDE FINANCIAL STATEMENTS


City of Pooler, Georgia
Statement of Net Assets
December 31, 2010
D - 1The notes to the basic financial statements are an integral part of this statement.
ComponentPrimary Government Unit
PoolerGovernmental Business-type Development
Activities Activities Total Authority
ASSETSCash and cash equivalents........................................................ 8,863,674$ 3,591,102$ 12,454,776$ 110,993$ Receivables.............................................................................. 2,745,144 822,432 3,567,576 - Internal balances...................................................................... 159,473 (159,473) - - Inventories................................................................................ - 5,500 5,500 - Prepaid items............................................................................ 61,729 19,206 80,935 - Restricted assets
Cash and cash equivalents..................................................... 18 8,772,835 8,772,853 - Bond issuance costs, net of accumulated amortization............. 42,856 - 42,856 - Capital assets:
Land, improvements, and construction in progress............... 2,185,509 1,428,797 3,614,306 - Other capital assets, net of depreciation................................ 10,832,725 30,408,062 41,240,787 -
Total assets............................................................................... 24,891,128 44,888,461 69,779,589 110,993
LIABILITIESAccounts payable and other current liabilities......................... 285,978 181,948 467,926 - Accrued interest....................................................................... 59,634 104,923 164,557 - Unearned revenue..................................................................... 4,500 - 4,500 Other liabilities......................................................................... 7,867 123,412 131,279 - Long-term liabilities:
Due within one year.............................................................. 1,211,546 1,032,059 2,243,605 - Due in more than one year.................................................... 4,375,361 17,546,926 21,922,287 - Net OPEB obligation............................................................ 741,211 - 741,211 -
Total liabilities......................................................................... 6,686,097 18,989,268 25,675,365 -
NET ASSETSInvested in capital assets, net of related debt........................... 7,684,621 13,321,328 21,005,949 - Restricted for:
Capital projects..................................................................... 1,804,340 - 1,804,340 - Debt service.......................................................................... - 733,445 733,445 -
Unrestricted.............................................................................. 8,716,070 11,844,420 20,560,490 110,993
Total net assets......................................................................... 18,205,031$ 25,899,193$ 44,104,224$ 110,993$

City of Pooler, Georgia
Statement of Activities
For the Year Ended December 31, 2010
D - 2The notes to the basic financial statements are an integral part of this statement.
Operating Capital
Charges for Grants and Grants and
Functions/Programs Expenses Services Contributions Contributions
Primary Government:Governmental activities:
General government....................... 679,957$ 385,268$ 2,725$ -$ Public safety.................................. 4,593,471 534,095 523,692 - Public works.................................. 2,896,229 1,067,061 - 316,114 Health and welfare......................... 189,957 4,368 - - Culture and recreation................... 1,763,580 142,636 10,750 131 Housing and development............. 649,072 - - - Interest on long-term debt.............. 230,314 - - -
Total governmental activities............ 11,002,580 2,133,428 537,167 316,245
Business-type activities:Water and Sewer............................ 5,435,722 4,747,291 - 1,154,287
Total business-type activities............ 5,435,722 4,747,291 - 1,154,287
Total primary government.................... 16,438,302$ 6,880,719$ 537,167$ 1,470,532$
Component Unit
Pooler Development Authority............ 3,843$ 24,452$ -$ -$
General revenues:Taxes:
Sales taxes for general purposes........................................................
Grants and contributions not restricted to specific programs:
Property taxes, levied for general purposes.......................................
Program Revenues
Net assets - ending...................................................................................
Business taxes....................................................................................
Change in net assets.................................................................................
Selective sales and use taxes..............................................................
Net assets - beginning..............................................................................
Unrestricted investment earnings..........................................................
Miscellaneous.......................................................................................
Total general revenues and transfers........................................................
Special Purpose Local Option Sales Tax.......................................
Other taxes.........................................................................................
Gain on sale of capital assets/insurance recoveries...............................

D - 3
ComponentPrimary Government Unit
Business- PoolerGovernmental Type Development
Activities Activities Total Authority
(291,964)$ (291,964)$ (3,535,684) (3,535,684) (1,513,054) (1,513,054)
(185,589) (185,589) (1,610,063) (1,610,063)
(649,072) (649,072) (230,314) (230,314)
(8,015,740) (8,015,740)
- 465,856$ 465,856
- 465,856 465,856
(8,015,740) 465,856 (7,549,884)
20,609$
5,437,911 - 5,437,911 - 1,847,966 - 1,847,966 - 1,045,369 - 1,045,369 -
555,497 - 555,497 - 12,314 - 12,314 -
199,578 - 199,578 - 10,319 62,631 72,950 352 44,129 - 44,129 - 31,512 - 31,512 -
9,184,595 62,631 9,247,226 352
1,168,855 528,487 1,697,342 20,961 17,036,176 25,370,706 42,406,882 90,032
18,205,031$ 25,899,193$ 44,104,224$ 110,993$
Changes in Net AssetsNet (Expense) Revenue and


FUND FINANCIAL STATEMENTS


City of Pooler, Georgia
Balance Sheet
Governmental Funds
December 31, 2010
D - 4The notes to the basic financial statements are an integral part of this statement.
Special OtherPurpose Governmental Total
Local Option Fund - GovernmentalGeneral Sales Tax Fund Hotel / Motel Funds
AssetsCash and cash equivalents................................ 7,129,292$ 1,734,400 -$ 8,863,692$ Receivables...................................................... 2,629,274 80,860 35,010 2,745,144 Due from other funds....................................... 176,978 - - 176,978 Prepaid items................................................... 61,729 - - 61,729
Total assets.......................................................... 9,997,273$ 1,815,260$ 35,010$ 11,847,543$
Liabilities and fund balances
LiabilitiesAccounts payable............................................. 212,467$ 8,240$ 17,505$ 238,212$ Salaries and wages payable.............................. 47,766 - - 47,766 Due to other funds............................................ - - 17,505 17,505 Other liabilities................................................ 12,367 - - 12,367 Deferred revenue.............................................. 2,099,420 - - 2,099,420
Total liabilities.................................................... 2,372,020 8,240 35,010 2,415,270
Fund balances:Reserved for:
Public safety.............................................. 21,835 - - 21,835 Unreserved, reported in:
General fund.............................................. 7,603,418 - - 7,603,418 Capital projects fund................................. - 1,807,020 - 1,807,020
Total fund balances............................................. 7,625,253 1,807,020 - 9,432,273
Total liabilities and fund balances....................... 9,997,273$ 1,815,260$ 35,010$ 11,847,543$

City of Pooler, Georgia
Reconciliation of Total Governmental Fund Balancesto Net Assets of Governmental Activities
December 31, 2010
D - 5The notes to the basic financial statements are an integral part of this statement.
Amounts reported for governmental activities in the statement of net assets are different because:
9,432,273$
Some receivables are not available to pay for current period expenditures therefore2,099,420
Capital assets used in governmental activities are not currentfinancial resources and therefore are not reported in the governmental
13,018,234
Long-term and related liabilities are not due and payable in the current periodand therefore are not reported in the governmental funds balance sheet:
Contractual obligations........................................................................................... (4,500,000) Unamortized bond issuance costs........................................................................... 42,856 Capital lease obligations......................................................................................... (833,613) Compensated absences........................................................................................... (253,294) Accrued interest payable......................................................................................... (59,634) (5,603,685)
(741,211)
18,205,031$
related revenues are deferred in the governmental fund financial statements..........................................
funds (net of accumulated depreciation of $5,192,082)...........................................................................
Net Assets of Governmental Activities.......................................................................................................
Total Governmental Fund Balances............................................................................................................
Net OPEB liability not reported in the fund statements...........................................................................
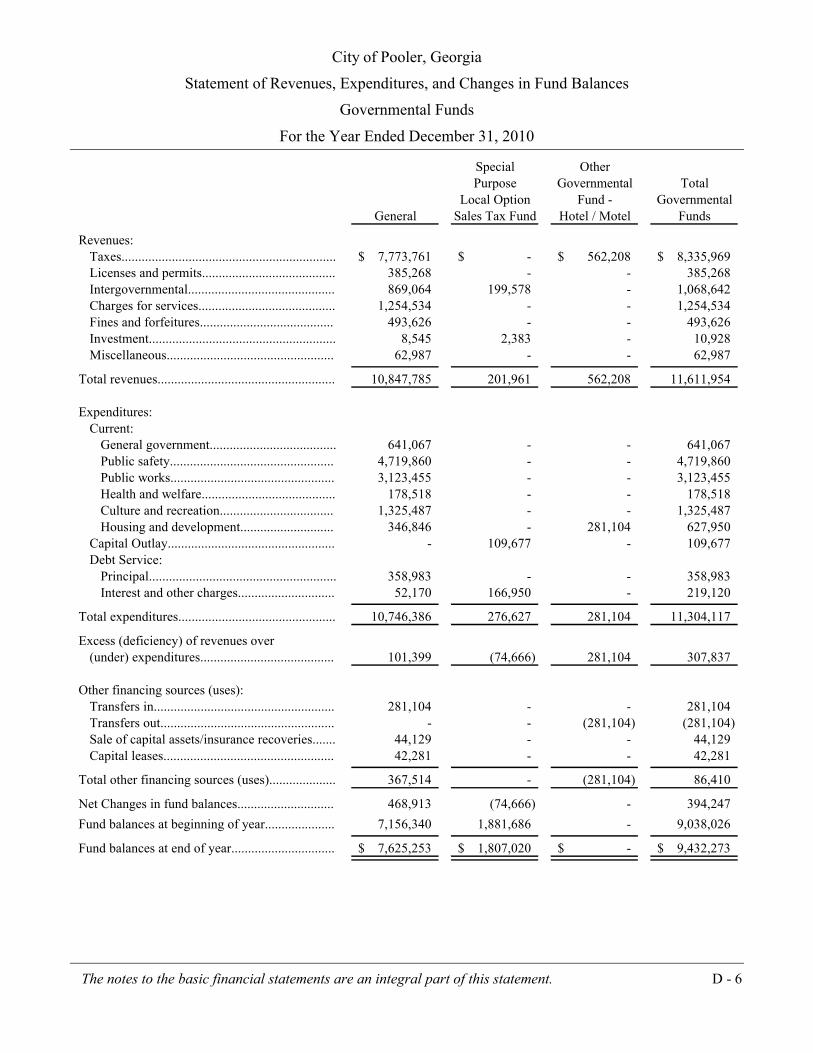
City of Pooler, Georgia
Statement of Revenues, Expenditures, and Changes in Fund Balances
Governmental Funds
For the Year Ended December 31, 2010
D - 6The notes to the basic financial statements are an integral part of this statement.
Special OtherPurpose Governmental Total
Local Option Fund - GovernmentalGeneral Sales Tax Fund Hotel / Motel Funds
Revenues:Taxes................................................................ 7,773,761$ -$ 562,208$ 8,335,969$ Licenses and permits........................................ 385,268 - - 385,268 Intergovernmental............................................ 869,064 199,578 - 1,068,642 Charges for services......................................... 1,254,534 - - 1,254,534 Fines and forfeitures........................................ 493,626 - - 493,626 Investment........................................................ 8,545 2,383 - 10,928 Miscellaneous.................................................. 62,987 - - 62,987
Total revenues..................................................... 10,847,785 201,961 562,208 11,611,954
Expenditures:Current:
General government...................................... 641,067 - - 641,067 Public safety................................................. 4,719,860 - - 4,719,860 Public works................................................. 3,123,455 - - 3,123,455 Health and welfare........................................ 178,518 - - 178,518 Culture and recreation.................................. 1,325,487 - - 1,325,487 Housing and development............................ 346,846 - 281,104 627,950
Capital Outlay.................................................. - 109,677 - 109,677 Debt Service:
Principal........................................................ 358,983 - - 358,983 Interest and other charges............................. 52,170 166,950 - 219,120
Total expenditures............................................... 10,746,386 276,627 281,104 11,304,117
Excess (deficiency) of revenues over(under) expenditures........................................ 101,399 (74,666) 281,104 307,837
Other financing sources (uses):Transfers in...................................................... 281,104 - - 281,104 Transfers out.................................................... - - (281,104) (281,104) Sale of capital assets/insurance recoveries....... 44,129 - - 44,129 Capital leases................................................... 42,281 - - 42,281
Total other financing sources (uses).................... 367,514 - (281,104) 86,410
Net Changes in fund balances............................. 468,913 (74,666) - 394,247
Fund balances at beginning of year..................... 7,156,340 1,881,686 - 9,038,026
Fund balances at end of year............................... 7,625,253$ 1,807,020$ -$ 9,432,273$

City of Pooler, Georgia
Reconciliation of the Statement of Revenues,Expenditures, and Changes in Fund Balances of
Governmental Funds to the Statement of Activities
For the Year Ended December 31, 2010
D - 7The notes to the basic financial statements are an integral part of this statement.
Amounts reported for governmental activities in the statement of activities are different because:
394,247$
Governmental funds report capital outlays as expenditures. However, in thestatement of activities, the cost of those assets is allocated over their estimateduseful lives as depreciation expense. This is the amount by which capitaloutlays exceeded depreciation in the current period:
Capital outlays........................................................................................................ 1,144,188$ Depreciation expense.............................................................................................. (823,640) 320,548
3,092
The issuance of long-term debt provides current financial resources to
governmental funds, while the repayment of the principal of long-term debtconsumes the current financial resources of governmental funds. Neither transaction, however, has any effect on net assets. Also, governmental fundsreport the effect of issuance costs, premiums, discounts and similar items whendebt is first issued, whereas these amounts are deferred and amortized forgovernmental activities. This amount is the net effect of these differences intreatment of long-term debt and related items.
Amortization of bond issuance costs...................................................................... (14,286)$ Capital lease proceeds received.............................................................................. (42,281) Capital lease principal payments............................................................................ 358,983 302,416
Revenues in the statement of activities that do not provide current financial515,352
Some expenses reported in the statement of activities do not require the use of
current financial resources and therefore are not reported as expenditures ingovernmental funds.
216
The current year's increase in the net OPEB liability creates a balance sheet item(367,016)
1,168,855$
resources are not reported as revenue in the governmental funds............................................................
Compensated absences.........................................................................................................................
Net change in fund balances - total governmental funds.............................................................................
Change in Net Assets of Governmental Activities......................................................................................
Change in accrual of interest payable on revenue bonds and capital leases.............................................
while increasing net expenses of the functions on the government wide statements................................
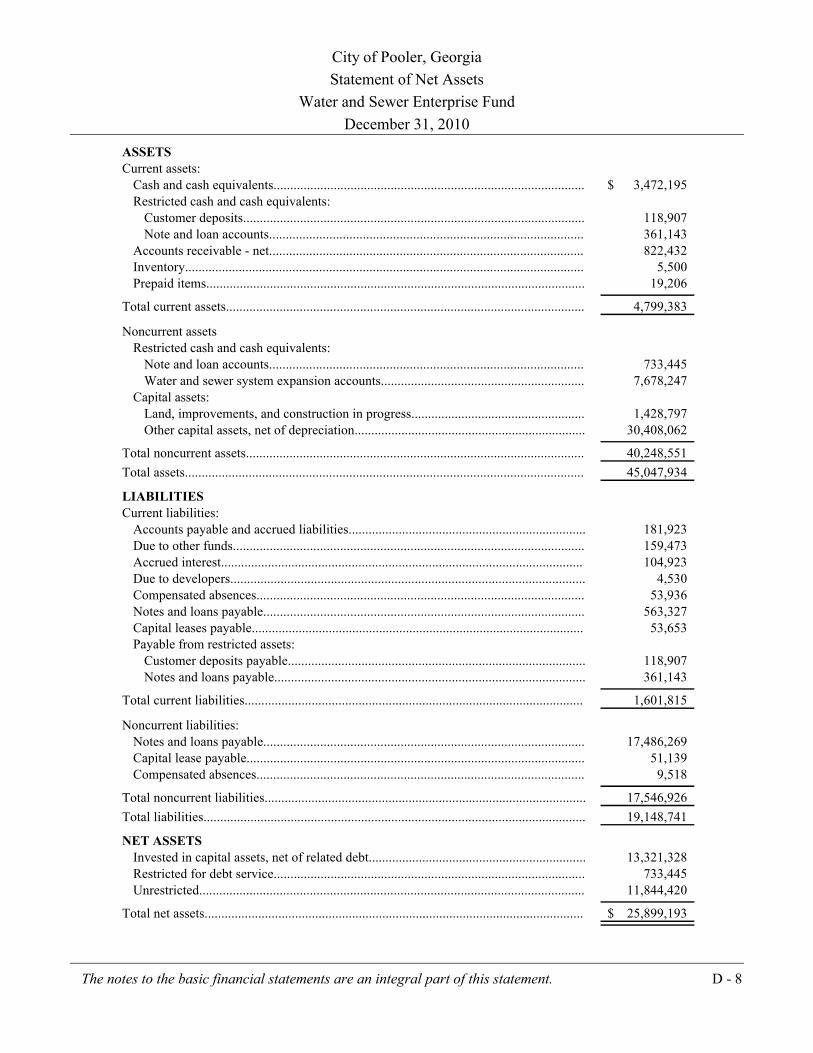
City of Pooler, Georgia
Statement of Net Assets
Water and Sewer Enterprise Fund
December 31, 2010
D - 8The notes to the basic financial statements are an integral part of this statement.
ASSETSCurrent assets:
Cash and cash equivalents............................................................................................. 3,472,195$ Restricted cash and cash equivalents:
Customer deposits...................................................................................................... 118,907 Note and loan accounts.............................................................................................. 361,143
Accounts receivable - net.............................................................................................. 822,432 Inventory....................................................................................................................... 5,500 Prepaid items................................................................................................................. 19,206
Total current assets........................................................................................................... 4,799,383
Noncurrent assetsRestricted cash and cash equivalents:
Note and loan accounts.............................................................................................. 733,445 Water and sewer system expansion accounts............................................................. 7,678,247
Capital assets:Land, improvements, and construction in progress.................................................... 1,428,797 Other capital assets, net of depreciation..................................................................... 30,408,062
Total noncurrent assets..................................................................................................... 40,248,551
Total assets....................................................................................................................... 45,047,934
LIABILITIESCurrent liabilities:
Accounts payable and accrued liabilities....................................................................... 181,923 Due to other funds......................................................................................................... 159,473 Accrued interest............................................................................................................ 104,923 Due to developers.......................................................................................................... 4,530 Compensated absences.................................................................................................. 53,936 Notes and loans payable................................................................................................ 563,327 Capital leases payable................................................................................................... 53,653 Payable from restricted assets:
Customer deposits payable......................................................................................... 118,907 Notes and loans payable............................................................................................. 361,143
Total current liabilities..................................................................................................... 1,601,815
Noncurrent liabilities:Notes and loans payable................................................................................................ 17,486,269 Capital lease payable..................................................................................................... 51,139 Compensated absences.................................................................................................. 9,518
Total noncurrent liabilities................................................................................................ 17,546,926
Total liabilities.................................................................................................................. 19,148,741
NET ASSETSInvested in capital assets, net of related debt................................................................. 13,321,328 Restricted for debt service............................................................................................. 733,445 Unrestricted................................................................................................................... 11,844,420
Total net assets................................................................................................................. 25,899,193$

City of Pooler, Georgia
Statement of Revenues, Expenses, and Changes in Fund Net Assets
Water and Sewer Enterprise Fund
For the Year Ended December 31, 2010
D - 9The notes to the basic financial statements are an integral part of this statement.
Operating revenuesWater fees.................................................................................................................. 2,197,215$ Sewer fees.................................................................................................................. 2,550,076
Total operating revenues.................................................................................................. 4,747,291
Operating expensesWater Department
Personnel services and employee benefits................................................................. 533,294 Purchased and contracted services............................................................................. 143,189 Supplies...................................................................................................................... 1,138,516 Depreciation............................................................................................................... 260,020
Total operating expenses - Water.................................................................................. 2,075,019
Sewer DepartmentPersonnel services and employee benefits................................................................. 399,136 Purchased and contracted services............................................................................. 130,908 Supplies...................................................................................................................... 193,416 Depreciation............................................................................................................... 517,230
Total operating expenses - Sewer.................................................................................. 1,240,690
Wastewater DepartmentPersonnel services and employee benefits................................................................. 421,037 Purchased and contracted services............................................................................. 306,862 Supplies...................................................................................................................... 387,087 Depreciation............................................................................................................... 279,790
Total operating expenses - Sewer.................................................................................. 1,394,776
Total operating expenses.................................................................................................. 4,710,485
Operating income (loss).................................................................................................... 36,806
Nonoperating revenues (expenses)Interest income.............................................................................................................. 62,631 Interest expense............................................................................................................. (669,244) Loss on disposal of assets.............................................................................................. (55,993)
Total nonoperating revenues (expenses)........................................................................... (662,606)
Income (loss) before capital contributions........................................................................ (625,800) Capital contributions:
Tap fees......................................................................................................................... 217,792 Capital cost recovery charges........................................................................................ 936,495
Total capital contributions................................................................................................ 1,154,287
Change in net assets.......................................................................................................... 528,487 Net assets, beginning of year............................................................................................ 25,370,706
Net assets, end of year...................................................................................................... 25,899,193$

City of Pooler, Georgia
Statement of Cash Flows
Water and Sewer Enterprise Fund
For The Year Ended December 31, 2010
D - 10The notes to the basic financial statements are an integral part of this statement.
Cash flows from operating activities:Cash received from customers....................................................................................... 4,640,876$ Cash payments to suppliers for goods and services....................................................... (2,876,196) Cash payments to employees for services..................................................................... (1,374,913)
Net cash provided (used) by operating activities.............................................................. 389,767
Cash flows from capital and related financing activities:Principal payments on debt........................................................................................... (949,662) Interest payments on debt.............................................................................................. (675,245) Tap fees......................................................................................................................... 217,792 Capital cost recovery proceeds...................................................................................... 936,495 Acquisitions and construction of capital assets............................................................. (1,808,129)
Net cash (used) by capital and related financing activities............................................... (2,278,749)
Cash flows from investing activities:Interest earned on cash and investments........................................................................ 62,631
Net cash provided (used) by investing activities.............................................................. 62,631
Net increase (decrease) in cash and cash equivalents....................................................... (1,826,351) Cash and cash equivalents, beginning of year.................................................................. 14,190,288
Cash and cash equivalents, end of year............................................................................ 12,363,937$
Operating income (loss).................................................................................................... 36,806$ Adjustments to reconcile operating income to net cash provided by operating activities:
Depreciation.................................................................................................................. 1,057,040 Change in assets and liabilities:
Decrease (increase) in accounts receivables.............................................................. (127,080) (Decrease) Increase in prepaid expenses.................................................................... (7,553) (Decrease) Increase in accounts payable and accrued liabilities................................ (74,157) (Decrease) Increase in interfund payables.................................................................. (515,954) (Decrease) increase in customer deposits................................................................... 20,665
Total adjustments.............................................................................................................. 352,961
Net cash provided (used) by operating activities.............................................................. 389,767$

City of Pooler, Georgia
Statement of Net Assets
Fiduciary Fund
December 31, 2010
D - 11The notes to the basic financial statements are an integral part of this statement.
MunicipalCourt Fund
AssetsCash and cash equivalents............................................................................................. 12,307$ Fines receivable............................................................................................................. 132,434
Total assets....................................................................................................................... 144,741$
LiabilitiesDue to others................................................................................................................. 144,741
Total liabilities.................................................................................................................. 144,741$

NOTES TO THE FINANCIAL STATEMENTS


City of Pooler, Georgia
Notes to the Basic Financial Statements
December 31, 2010
D - 12
Note 1 – Summary of Significant Accounting Policies
The City complies with generally accepted accounting principles (GAAP). GAAP includes all relevant Governmental Accounting Standards Board (GASB) pronouncements. Private-sector standards of accounting and financial reporting issued prior to December 1, 1989, generally are followed in both the government-wide and proprietary fund financial statements to the extent that those standards do not conflict with or contradict guidance of the Government Accounting Standards Board. Governments also have the option of following subsequent private-sector guidance for their business-type activities and enterprise funds, subject to this same limitation. The City has elected not to follow subsequent private-sector guidance. The accounting and reporting framework and the more significant accounting policies are discussed in subsequent subsections of this note.
A. Financial Reporting Entity
The City’s financial reporting entity comprises the following:
Primary Government: City of Pooler
In determining the financial reporting entity, the City complies with the provisions of GASB Statement No. 14, “The Financial Reporting Entity,” and includes all component units of which the City appointed a voting majority of the units’ board; the City is either able to impose its will on the unit or a financial benefit or burden relationship exists.
Blended Component Units
Blended component units are separate legal entities that meet the component unit criteria described above and whose governing body is the same or substantially the same as the City Council or the component unit provides services entirely to the City. These component units’ funds are blended into those of the City’s by appropriate activity type to compose the primary government presentation. Currently, the City has no blended component units.
Discretely Presented Component Units
Discretely presented component units are separate legal entities that meet the component unit criteria described above but do not meet the criteria for blending. The City’s only discretely presented component unit is described below.
Pooler Development Authority (PDA) – The PDA was created on November 24, 2003 for the public purpose of economic development within the city limits of Pooler, Georgia. The PDA was established pursuant to the Development Authorities Law of the State of Georgia (O.C.G.A. 36-62 et seq.) and operates as a separate public body corporate and politic. The PDA’s board consists of seven members appointed by the governing body of the City of Pooler, Georgia. Pooler City Council is able to impose its will on the Authority, and the Authorityprovides services and benefits which are not limited to the City of Pooler.
Revenue of the PDA consists solely of an “issuer’s annual administrative fee” pursuant to a loan agreement dated July 1, 2005 between the PDA and Alta Towne Lake, LLC for a $20,000,000 multifamily rental residential development in Pooler, Georgia known as Alta Town Lake Apartments. The fee is equal to 0.125% of the principal amount of bonds outstanding payable annually in arrears on each anniversary date of the issuance of the bonds commencing July 14, 2006. This conduit debt is discussed at Note 2.G.
During the year ended December 31, 2010, the PDA had billed a total of $24,452 in fees.
The PDA does not issue a separate stand-alone financial report.

City of Pooler, Georgia
Notes to the Basic Financial Statements
December 31, 2010
D - 13
Note 1 – Summary of Significant Accounting Policies – continued
Membership in Regional Development Center
Under Georgia law, the City is a member of the Coastal Georgia Regional Development Center and is required to pay annual dues thereto. During its year ended December 31, 2010, the City paid $9,369 in such dues. Membership in an RDC is required by the Official Code of Georgia Annotated (OCGA) Section 50-8-34 which provides for the organizational structure of the RDC in Georgia. The RDC Board membership includes five members from the Chatham County governments: the Mayors of the Cities of Savannah, Port Wentworth and Tybee Island and two commissioners of Chatham County, Georgia. Therefore, the City of Pooler has no direct representation on the Board. The total board membership is 37. Other county representation is as follows: Bryan -3, Bulloch - 5, Camden - 4, Effingham - 4, Glynn - 5, Liberty - 5, Long - 3 and McIntosh - 3. OCGA 50-8-39.1 provides that the member governments are liable for any debts or obligations of an RDC. Management believes that the RDC is currently accumulating sufficient financial resources to meet its financial obligations. Separate financial statements may be obtained from:
Coastal Georgia Regional Development CenterP.O. Box 1917Brunswick, Georgia 31521
B. Government-wide and Fund Financial Statements
Financial information of the City is presented as follows:
Management’s discussion and analysis introduces the basic financial statements and provides an analytical overview of the City’s financial activities.
Basic Financial Statements: Government-wide financial statements consist of a statement of net assets and a statement of activities.
These statements report all of the non-fiduciary activities of the primary government and its component units. Governmental activities are reported separately from business-type activities. Governmental activities are normally supported by taxes and intergovernmental revenues whereas business-type activities are normally supported by fees and charges from services and are usually intended by management to be financially self-sustaining. The fiduciary fund of the primary government is not included in the government-wide financial statements; however separate financial statements are presented.
The statement of activities presents a comparison between direct expenses and program revenues for the different business-type activities of the City and for each function of the City’s governmental activities. Direct expenses are those that are clearly identifiable with a specific program or function. Program revenues include (a) charges to customers or applicants who purchase, use, or directly benefit from goods, services, or privileges provided by a given function or program and (b) grants and contributions that are restricted to meeting the operational or capital requirements of a particular function or program. Revenues that are not classified as program revenues, including all taxes and other items, are presented as general revenues.
Fund financial statements consist of a series of statements focusing on information about the City’s major governmental and proprietary funds. Separate financial statements are presented for the governmental and proprietary funds.

City of Pooler, Georgia
Notes to the Basic Financial Statements
December 31, 2010
D - 14
Note 1 – Summary of Significant Accounting Policies – continued
C. Measurement Focus, Basis of Accounting and Basis of Presentation
The government-wide financial statements are reported using the economic resources measurement focus and the accrual basis of accounting, as are the proprietary fund and fiduciary fund financial statements. Revenues are recognized when earned and expenses are recognized when a liability is incurred, regardless of the timing of related cash flows. Property taxes are recognized as revenues in the year for which they are levied. Grants and similar items are recognized as revenue as soon as all eligibility requirements imposed by the provider have been met.
Governmental fund financial statements are reported using the current financial resources measurement focus and the modified accrual basis of accounting. Revenues are recognized as soon as they are both measurable and available. Revenues are considered to be available when they are collectible within the current period or soon enough thereafter to pay liabilities of the current period. For this purpose, the government considers revenues to be available if they are collected within thirty days after year-end. Expenditures generally are recognized when a liability is incurred, as under accrual accounting. However, debt service expenditures, as well as, expenditures related to compensated absences and claims and judgments, are reported only when payment is due. Capital asset acquisitions are reported as expenditures in governmental funds. Proceeds of long-term debt are reported as other financing sources.
Property taxes, sanitation fees, sales tax, grants from other governments, and interest on investments are susceptible to accrual. Revenues from fines, forfeits and penalties, and franchise fees become measurable and available when cash is received by the City and are recognized as revenue at that time.
The City reports the following major governmental funds:
The General Fund is the City’s primary operating fund. It accounts for all financial resources of the government, except those required to be accounted for in another fund.
The Special Purpose Local Option Sales Tax Fund is used to account for resources restricted for the acquisition or construction of specific capital projects or items. The reporting entity includes only one Capital Project Fund and it is used to account for the acquisition of capital assets with the 1% sales tax proceeds.
The City reports the following major enterprise fund:
The Water and Sewer Fund accounts for water and sewer services provided to the residents of the City. All activities necessary to provide such services are accounted for in this fund, including, but not limited to, administration, operations, maintenance, financing and related debt service.
Additionally, the City reports the following fund types:
Special Revenue Fund – The Hotel / Motel Fund accounts for proceeds of the lodging tax which are restricted by state and local ordinance for the promotion of convention and tourism.
Agency Fund – The Municipal Court Fund accounts on a temporary basis for fines collected by the municipal court that ultimately are transferred to the general fund.
City of Pooler, Georgia
Notes to the Basic Financial Statements
December 31, 2010
D - 15
Note 1 – Summary of Significant Accounting Policies – continued
As a general rule, the effect of interfund activity has been removed from the government-wide financial statements. Exceptions to this general rule are charges for sales and purchases of goods and services between various functions of the City. Elimination of these charges would distort the direct costs and program revenues reported for the various functions concerned.
Amounts reported as program revenues include (1) charges to customers or applicants for goods, services or privileges provided, (2) operating grants and contributions, and (3) capital grants and contributions. Revenues not classified as program revenues are presented as general revenues.
Proprietary funds distinguish operating revenues and expense from nonoperating items. Operating revenues and expense generally result from providing services and producing and delivering goods in connection with a proprietary fund’s principal ongoing operations. The principal operating revenues of the Water and Sewer Fund are charges to customers for services provided. Operating expenses include the cost of services, administrative expenses, and depreciation on capital assets. All revenues and expenses not meeting this definition are reported as nonoperating revenues and expenses.
When both restricted and unrestricted resources are available for use, it is the City’s policy to use restricted resources first, and then unrestricted resources, as they are needed.
D. Assets, Liabilities and Net Assets or Equity
Cash and Investments
The City’s cash and cash equivalents are considered to be cash on hand, demand deposits and short-term investments with original maturities of three months or less from the date of acquisition.
State statutes authorize the City to invest in obligations of or obligations guaranteed by the U.S. Government and agencies or corporations of the U.S. Government; obligations of any state; obligations of any political subdivision of any state; certificates of deposit or time deposits of any national state bank or savings and loan which have deposits insured by the FDIC or FSLIC; prime bankers acceptances; repurchase agreements; and the Local Government Investment Pool of the State of Georgia (Georgia Fund 1). Investments are reported at fair value.
Short-term investments are reported at cost, which approximates fair value. Securities traded on a national or international exchange are valued at the last reported sales price at current exchange rates. Mortgages are valued on the basis of future principal and interest payments, and are discounted at prevailing interest rates for similar instruments. The fair value of real estate investments is based on independent appraisals. Investments that do not have an established market are reported at estimated fair values.
Receivables
In the fund financial statements, material receivables in governmental funds include revenue accruals such as property taxes, grants and other similar intergovernmental revenues since they are usually both measurable and available. Nonexchange transactions collectible but not available are deferred in the fund financial statements in accordance with modified accrual. Accounts receivable comprise the majority of proprietary fund receivables. Trade receivables are shown net of an allowance for uncollectibles.
Property taxes are levied as of January 1 on property values assessed on the same date. A millage rate of 4.500mills was adopted on July 19, 2010. Tax bills were rendered on November 15, 2010 and are considered past due 60 days after the respective tax billing date at which time the applicable property is subject to lien and penalties and interest are assessed.
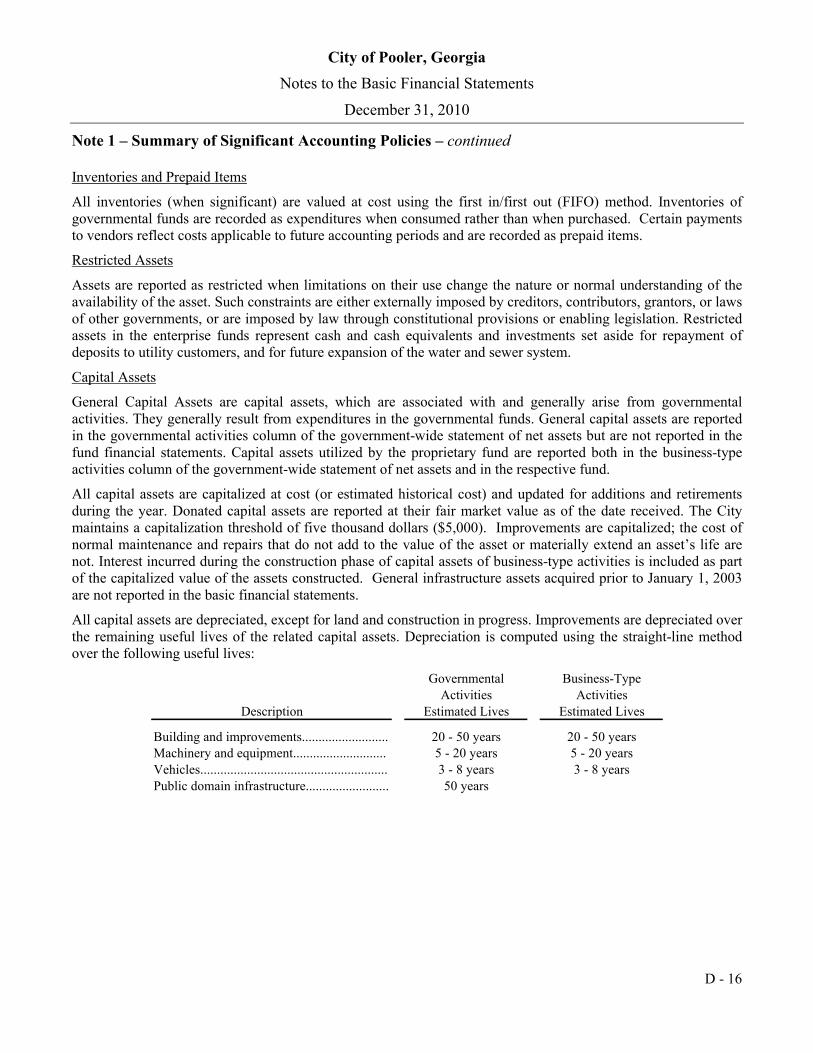
City of Pooler, Georgia
Notes to the Basic Financial Statements
December 31, 2010
D - 16
Note 1 – Summary of Significant Accounting Policies – continued
Inventories and Prepaid Items
All inventories (when significant) are valued at cost using the first in/first out (FIFO) method. Inventories of governmental funds are recorded as expenditures when consumed rather than when purchased. Certain payments to vendors reflect costs applicable to future accounting periods and are recorded as prepaid items.
Restricted Assets
Assets are reported as restricted when limitations on their use change the nature or normal understanding of the availability of the asset. Such constraints are either externally imposed by creditors, contributors, grantors, or laws of other governments, or are imposed by law through constitutional provisions or enabling legislation. Restricted assets in the enterprise funds represent cash and cash equivalents and investments set aside for repayment of deposits to utility customers, and for future expansion of the water and sewer system.
Capital Assets
General Capital Assets are capital assets, which are associated with and generally arise from governmental activities. They generally result from expenditures in the governmental funds. General capital assets are reported in the governmental activities column of the government-wide statement of net assets but are not reported in the fund financial statements. Capital assets utilized by the proprietary fund are reported both in the business-type activities column of the government-wide statement of net assets and in the respective fund.
All capital assets are capitalized at cost (or estimated historical cost) and updated for additions and retirements during the year. Donated capital assets are reported at their fair market value as of the date received. The City maintains a capitalization threshold of five thousand dollars ($5,000). Improvements are capitalized; the cost of normal maintenance and repairs that do not add to the value of the asset or materially extend an asset’s life are not. Interest incurred during the construction phase of capital assets of business-type activities is included as part of the capitalized value of the assets constructed. General infrastructure assets acquired prior to January 1, 2003 are not reported in the basic financial statements.
All capital assets are depreciated, except for land and construction in progress. Improvements are depreciated over the remaining useful lives of the related capital assets. Depreciation is computed using the straight-line method over the following useful lives:
Governmental Business-TypeActivities Activities
Description Estimated Lives Estimated Lives
Building and improvements.......................... 20 - 50 years 20 - 50 yearsMachinery and equipment............................ 5 - 20 years 5 - 20 yearsVehicles........................................................ 3 - 8 years 3 - 8 yearsPublic domain infrastructure......................... 50 years

City of Pooler, Georgia
Notes to the Basic Financial Statements
December 31, 2010
D - 17
Note 1 – Summary of Significant Accounting Policies – continued
Compensated Absences
It is the City’s policy to permit employees to accumulate earned but unused vacation and sick pay benefits. There is no liability for unpaid accumulated sick leave since the government does not have a policy to pay any amounts when employees separate from service with the government. All vacation pay (when material) is accrued when incurred in the government - wide and proprietary fund financial statements. A liability for these amounts is reported in governmental funds only if they have matured, for example, as a result of employee resignations and retirements.
Long-term Obligations
In the government-wide financial statements and proprietary fund type in the fund financial statements, long-term debt and other long-term obligations are reported as liabilities in the applicable governmental activities, or business-type activities Statement of Net Assets. Bond premiums and discounts, as well as issuance costs, are deferred and amortized over the life of the bonds using the straight-line method. Bond issuance costs are reported as deferred charges and amortized over the term of the related debt.
In the fund financial statements, governmental fund types recognize bond premiums and discounts, as well as bond issuance costs, during the current period. The face amount of debt issued is reported as other financing sources while discounts on debt issuances are reported as other financing uses. Issuance costs, whether or not withheld from the actual debt proceeds received, are reported as debt service expenditures.
Equity Classifications
Equity is classified as net assets and displayed in three components in the government-wide financial statements.
Invested in capital assets, net of related debt consists of capital assets including restricted capital assets, net of accumulated depreciation and reduced by the outstanding balances of any bonds, mortgages, notes, or other borrowings that are attributable to the acquisition, construction, or improvements of those assets.
Restricted net assets consist of net assets with constraints placed on the use either by (1) external groups such as creditors, grantors, contributors, or laws and regulations of other governments; or (2) law through constitutional provisions or enabling legislation.
Unrestricted net assets consists of all other net assets that do not meet the definition of “restricted” or “invested in capital assets, net of related debt”.
In the fund financial statements, governmental funds report reservations of fund balance for amounts that are not available for appropriation or are legally restricted by outside parties for use for a specific purpose. Designations of fund balance represent tentative management plans that are subject to change.
Use of Estimates
The preparation of financial statements in conformity with generally accepted accounting principles requires management to make estimates and assumptions that may affect the amounts reported in the financial statements and the related notes. Accordingly, actual results could differ from these estimates.

City of Pooler, Georgia
Notes to the Basic Financial Statements
December 31, 2010
D - 18
Note 2 – Detailed Notes on Funds and Activities
A. Cash and Investments
Deposits
At year-end the carrying amount of the City's deposits was $21,239,936 and the bank balance was $21,181,395. As of December 31, 2010 the entire bank balance was insured and collateralized with securities held by the government or its agent in the entity’s name.
Custodial credit risk is the risk that in the event of a bank failure, the City’s deposits may not be returned to the City. The Official Code of Georgia Annotated (OCGA) Section 45-8-12 provides that there shall not be on deposit at any time in any depository for a time longer than ten days a sum of money which has not been secured by a surety bond, by guarantee of insurance, or by collateral. The aggregate of the face value of such surety bond and the market value of securities pledged shall be equal to not less than 110% of the public funds being secured after the deduction of the amount of depository insurance. The City has no custodial credit risk policy that would require additional collateral requirements.
Reconciliation of financial statements to notes:
Statement of Net AssetsCash and cash equivalents........................................... 12,454,776$ Restricted cash and cash equivalents.......................... 8,772,853
21,227,629 Fiduciary Funds
Cash and cash equivalents........................................... 12,307
Total cash and cash equivalents..................................... 21,239,936$
B. Accounts Receivable
Receivables as of year-end for the government’s individual major funds and non-major funds in the aggregate including the applicable allowance for uncollectible accounts are as follows:
Water and NonmajorReceivable General SPLOST Sewer Governmental Total
Taxes........................................................ 2,335,870$ -$ -$ 35,010$ 2,370,880$ Accounts................................................... 234 - 901,180 - 901,414 Intergovernmental.................................... 318,173 80,860 - - 399,033
Gross receivables 2,654,277 80,860 901,180 35,010 3,671,327 Less: Allowance for uncollectibles....... (25,003) - (78,748) - (103,751)
Net receivables......................................... 2,629,274$ 80,860$ 822,432$ 35,010$ 3,567,576$

City of Pooler, Georgia
Notes to the Basic Financial Statements
December 31, 2010
D - 19
Note 2 – Detailed Notes on Funds and Activities - continued
C. Deferred Revenue
Governmental funds report deferred revenue in connection with receivables for revenues that are not considered to be available to liquidate liabilities of the current period. At December 31, 2010 the various components of deferred revenue reported in the general fund were as follows:
General Fund:Property taxes............................................................. 1,026,923$ Franchise taxes............................................................ 1,072,497
Total deferred revenue................................................... 2,099,420$
D. Interfund Receivables, Payables and Transfers
Interfund receivable and payable balances at December 31, 2010 are as follows:
Receivable Fund Payable Fund Amount
General Water and Sewer 159,473$
General Nonmajor governmental 17,505
176,978$ Total interfund receivables and payables..............................................
These balances represent loans between the borrower fund and the lender fund. These balances resulted from the time lag between the dates that 1) interfund goods and services are provided or reimbursable expenditures occur, 2) transactions are recorded in the accounting system, and 3) payments between funds are made. Interfund receivables and payables are reported in the fund financial statements; however, they are eliminated in the government-wide financial statements if the interfund loan is between governmental funds.
A summary of interfund transfers by fund type is as follows:
Transfer In Transfer Out Purpose Amount
General Fund Nonmajor governmental funds Distribution of tax revenue 281,104$
Interfund transfers are used to 1) move revenues from the fund that statute or budget requires collecting them to the fund that statute or budget requires to expend them, 2) move receipts restricted to debt service from the funds collecting the receipts to the debt service fund as debt service payments become due, and 3) use unrestricted revenues collected to finance various programs accounted for in other funds in accordance with budgetary authorizations. Transfers are eliminated in the government-wide financial statements if the interfund transfer is within the governmental fund group.

City of Pooler, Georgia
Notes to the Basic Financial Statements
December 31, 2010
D - 20
Note 2 – Detailed Notes on Funds and Activities - continued
E. Capital Assets
Changes in governmental activities capital asset for the year ended December 31, 2010 was as follows:
Beginning Ending Balance Increases Decreases Transfers Balance
Governmental Activities:
Non-Depreciable Assets:
Land.......................................................... 2,074,320$ -$ -$ -$ 2,074,320$ Construction in progress............................ 73,681 468,055 - (430,547) 111,189
Total non-depreciable capital assets............. 2,148,001 468,055 - (430,547) 2,185,509
Depreciable Assets:Buildings and improvements..................... 7,896,507 - - 58,882 7,955,389 Machinery, equipment and vehicles.......... 6,835,768 665,647 374,538 7,126,877
Infrastructure............................................. 560,390 10,486 - 371,665 942,541
Total depreciable capital assets.................... 15,292,665 676,133 374,538 430,547 16,024,807
Accumulated DepreciationBuildings and improvements..................... (1,235,142) (202,620) - - (1,437,762) Machinery, equipment and vehicles.......... (3,468,686) (602,169) (374,538) - (3,696,317) Infrastructure............................................. (39,152) (18,851) - - (58,003)
Total accumulated depreciation.................... (4,742,980) (823,640) (374,538) - (5,192,082)
Total Governmental Activities...................... 12,697,686$ 320,548$ -$ -$ 13,018,234
(5,333,613)
7,684,621$
Less related long-term debt outstanding.............................................................................................................................
Investment in capital assets, net of related debt..................................................................................................................
Depreciation expense was charged to governmental activities as follows:
General government....................................................... 34,715 Public safety................................................................... 289,420 Public works................................................................... 94,635 Health and welfare......................................................... 5,045 Culture and recreation.................................................... 396,036 Housing and development.............................................. 3,789
Total depreciation expense............................................. 823,640$

City of Pooler, Georgia
Notes to the Basic Financial Statements
December 31, 2010
D - 21
Note 2 – Detailed Notes on Funds and Activities – continued
Changes in business-type activities capital asset for the year ended December 31, 2010 was as follows:
Beginning Ending Balance Increases Decreases Net Transfers Balance
Business-type Activities:
Non-Depreciable Assets:Land.......................................................... 172,139$ -$ -$ -$ 172,139$ Construction in progress............................ 764,169 1,408,575 55,993 (860,093) 1,256,658
Total non-depreciable capital assets............. 936,308 1,408,575 55,993 (860,093) 1,428,797
Depreciable Assets:Buildings and improvements..................... 39,003,597 - - 852,709 39,856,306 Machinery, equipment and vehicles.......... 1,074,746 87,541 15,529 7,384 1,154,142 -
Total depreciable capital assets.................... 40,078,343 87,541 15,529 860,093 41,010,448
Accumulated DepreciationBuildings and improvements..................... (8,822,966) (957,433) - (9,780,399) Machinery, equipment and vehicles.......... (737,908) (99,608) (15,529) - (821,987)
Total accumulated depreciation.................... (9,560,874) (1,057,041) (15,529) - (10,602,386)
Total Business-type Activities...................... 31,453,777$ 439,075$ 55,993$ -$ 31,836,859
(18,515,531)
13,321,328$
Less related long-term debt outstanding.............................................................................................................................
Investment in capital assets, net of related debt..................................................................................................................
F. Capital Leases
The City has entered into lease agreements as lessee for financing of equipment and vehicles used in governmental and business-type activities. These lease agreements qualify as capital leases for accounting purposes and, therefore, have been recorded at the present value of future minimum lease payments as of the inception date.
The assets acquired through capital lease are as follows:
Governmental Business-TypeActivities Activities
Machinery and Equipment............................ 1,761,833$ 226,129$ Less: Accumulated depreciation................... (522,032) (123,252)
Total............................................................. 1,239,801$ 102,877$

City of Pooler, Georgia
Notes to the Basic Financial Statements
December 31, 2010
D - 22
Note 2 – Detailed Notes on Funds and Activities – continued
The following is a schedule of the future minimum lease payments under the capital leases, and the present value of the net minimum lease payments at December 31, 2010:
Governmental Business-type Year Ending December 31, Activities Activities
2011 294,930$ 57,007$ 2012 152,444 36,506 2013 91,516 13,101 2014 254,318 3,275 2015 54,802 -
2016 - 2017 109,605 -
Total minimum lease payments.................... 957,615 109,889 Less: amount representing interest................ (124,002) (5,097)
Present value of minimum lease payments... 833,613$ 104,792$
G. Long -term Debt
Chatham County Recreation Authority Revenue Bonds (City of Pooler Project), Series 2007
In May 2007, The Chatham County Recreation Authority authorized the issuance, delivery and sale of Chatham County Recreation Authority Revenue Bonds (City of Pooler Project), Series 2007. The bonds bear an interest rate of 3.71% with final maturity on April 1, 2014. The bond proceeds were used to finance the construction of the Pooler Recreational Park.
Pursuant to the bond issue, the City entered into an intergovernmental contract with the Chatham County Recreation Authority whereby the City has the unconditional obligation to provide sufficient funds for debt service payments and related paying agent or bond register fees. The City is authorized to exercise its powers of taxation to the extent necessary to pay the amounts required by the contract.
Annual debt service requirements to maturity for the contractual obligation are as follows:
Year Ending December 31, Principal Interest Total
2011 750,000$ 153,037$ 903,037$ 2012 1,200,000 116,865 1,316,865 2013 1,250,000 71,418 1,321,418 2014 1,300,000 24,115 1,324,115
Totals.......................................... 4,500,000$ 365,435$ 4,865,435$

City of Pooler, Georgia
Notes to the Basic Financial Statements
December 31, 2010
D - 23
Note 2 – Detailed Notes on Funds and Activities – continued
Georgia Environmental Facilities Authority (GEFA) Loans
The City has entered into loan agreements with GEFA, a state agency. The GEFA makes low interest long-term loans to fund improvements to publicly owned water and sewer systems. The loan proceeds have been used to finance water and sewer projects to provide water and sewer access to areas of commercial and residential development throughout the City.
The City has entered into water and sewer agreements with land owners (developers) to assist in the repayment of the GEFA loans. Pursuant to the water and sewer agreements, the land owners are required to contemporaneousley provide, with the excecution of the agreement, an irrevocable letter of credit or financial obligation bond (financial guarantee) in the amount of the land owners shared cost of the project. In addition, the agreement authorizes the City to collect a GEFA Loan Cost Recovery Fee from customers connecting to the water and sewer system. The cost recovery fee revenue is restricted to the repayment of the related GEFA loans and reduces the land owners financial guarantee to the project.
The City has the following GEFA loans outstanding at year end:
Original Interest BalanceContract Number Amount Rate 12/31/2010
98-L66WJ 2,497,297$ 4.67% 1,961,946$ 02-L33WQ 672,289 4.36% 547,918 CW02-007 12,593,549 3.00% 10,838,018 03-L42WJ 3,103,709 4.16% 2,804,050 05-L23WJ 2,406,407 4.14% 2,258,807
18,410,739$
Annual debt service requirements to maturity for the GEFA Loans are as follows:
Year Ending December 31, Principal Interest Total
2011 924,470$ 637,058$ 1,561,528$ 2012 957,997 603,530 1,561,527 2013 993,062 568,465 1,561,527 2014 1,029,217 532,310 1,561,527 2015 1,066,813 494,714 1,561,527
2016 - 2020 5,901,599 1,857,831 7,759,430 2021 - 2025 5,701,136 845,159 6,546,295 2025 - 2029 1,836,445 74,139 1,910,584
Totals.......................................... 18,410,739$ 5,613,206$ 24,023,945$

City of Pooler, Georgia
Notes to the Basic Financial Statements
December 31, 2010
D - 24
Note 2 – Detailed Notes on Funds and Activities – continued
Pooler Development Authority (PDA) – Conduit Debt
On July 1, 2005 the PDA (the “Issuer”) agreed to issue its Multifamily Housing Revenue Bonds (Alta Towne Lake Apartments Project), Series 2005 in the aggregate principle amount of $20,000,000 for the purpose of financing the cost of the acquisition, construction and equipping of a multifamily rental residential development in Pooler, Georgia known as Alta Towne Lake Apartments. The proceeds of the bonds were loaned by the issuer to Alta Towne Lake, LLC, a Georgia limited liability company (the “Borrower”) pursuant to a loan agreement dated July 1, 2005 between the Issuer and the Borrower. Any obligation of the Issuer created by, arising out of, or entered into in contemplation of the agreement, including the bonds, shall not impose a debt or pecuniary liability upon the Issuer, the State, the City, or any political subdivision thereof or constitute a charge upon the general credit or taxing powers of any of the forgoing. The obligation of the Borrower to make the payments required under the agreement is absolute and unconditional. During the year ended December 31, 2010, the Multifamily Housing Revenue Bonds (Alta Towne Lake Apartments Project), Series 2005 were paid in full.
Changes in Long-Term Liabilities
AmountsBeginning Ending Due Within
Balance Additions Reductions Balance One Year
Governmental Activities:Contractual obligations.............................. 4,500,000$ -$ -$ 4,500,000$ 750,000$ Capital lease obligations............................ 1,150,315 42,281 358,983 833,613 256,849
Long-term debt....................................... 5,650,315 42,281 358,983 5,333,613 1,006,849
Compensated absences.............................. 253,510 372,264 372,480 253,294 215,300
Total Governmental Activities...................... 5,903,825$ 414,545$ 731,463$ 5,586,907$ 1,222,149$
Business-Type Activities:GEFA loans............................................... 19,302,565$ -$ 891,826$ 18,410,739$ 924,470$ Capital lease obligations............................ 162,628 - 57,836 104,792 53,653
Long-term debt....................................... 19,465,193 - 949,662 18,515,531 978,123
Compensated absences.............................. 57,266 85,624 79,436 63,454 53,936
Total Business-Type Activities..................... 19,522,459$ 85,624$ 1,029,098$ 18,578,985$ 1,032,059$
For the governmental activities, long-term liabilities are generally liquidated by the general fund. For business-type activities, long-term liabilities are liquidated by the water and sewer enterprise fund.

City of Pooler, Georgia
Notes to the Basic Financial Statements
December 31, 2010
D - 25
Note 3 – Other Information
A. Employee Pension Plans
Plan Description
The City of Pooler Pension Plan (the Plan) is a defined benefit pension plan covering all employees with 6 months services, officials are not covered. The Plan is affiliated with the Georgia Municipal Employees Benefit System (GMEBS), a statewide, agent multiple-employer type plan adminstered by the Georgia Municipal Association. The Georgia Municipal Association handles all administrative and investment functions relative to the Plan. The Georgia Municipal Association issues a publicly available financial report that includes financial statements and required supplementary information for the Plan. That report may be obtained by writing to Georgia MunicipalAssociation, 201 Pryor Street, SW, Atlanta, Georgia 30303.
The Plan provides retirement, disability, and death benefits to plan members as well as an annual cost of livingadjustment. Benefits are fully vested after 5 years of service. Participants become eligible to retire earlier of 62 with 5 years of service and 55 with 30 years of service. These benefit provisions and all other requirements are established and amended by local ordinance.
As of July 1, 2010, the plan membership included the following categories of participants:
Retired participants and beneficiaries................. 15
Terminated vested participants........................... 22
Active participants.............................................. 141
Total participants................................................ 178
Funding Policy
The Plan is subject to minimum funding standards of the Public Retirement Systems Standards Law (Georgia Code Section 47-20-10). The Board of Trustees of GMEBS has adopted an actuarial funding policy for determination of annual contributions and the systematic funding of liabilities arising under the Plan. The City’s policy is to contribute the actuarially determined amount as recommended by GMEBS. The required contribution rate of active plan members is 2%. For 2010, the actuarially determined rate was 18.18% of covered payroll. TheCity’s contributions to the Plan for the years ended December 31, 2010, 2009, and 2008 were $744,755,$670,446, and 550,784 respectively and were equal to the required contributions for each year.
Trend Information
Trend information, which gives an indication of the progress made in accumulating sufficient assets to pay benefits when due, is presented below.
Year Annual Required Net PensionEnding Contribution (ARC) Obligation
12/31/2008 550,784$ 100.0 % -$ 12/31/2009 670,446 100.0 - 12/31/2010 744,755 100.0 -
Percentage ofARC Contributed

City of Pooler, Georgia
Notes to the Basic Financial Statements
December 31, 2010
D - 26
Note 3 – Other Information – continued
Actuarial Methods and Assumptions
The required contribution was determined as part of the January, 2009 actuarial valuations using the projected unit credit actuarial cost method. The actuarial value of assets is determined by sum of actuarial value at beginning of year and the cash flow during the year plus the assumed investment return, adjusted by 10% of the amount that the value exceeds or is less than the market value at end of year. The actuarial value is adjusted, if necessary, to be within 20% of market value. The actuarial assumptions include (a) 8.0% investment rate of return and (b) projected salary increases of 5.50%, (c) social security wage base increase of 5.50%, and (d) a cost of living adjustments of 2.00%. The period, and related method, for amortizing the unfunded actuarial accrued liability is 30 years from 2008 and changes in the unfunded actuarial accrued liabilities over 15 years for actuarial gains and losses, 20 years for plan provisions and 30 years for actuarial assumptions and cost methods as a level dollar amount. These amortization periods, if applicable, are closed for this plan year.
Fund Status and Funding Progress
As of July 1, 2010, the most recent actuarial valuation date, the actuarial value of assets was $6.3 million; the actuarial accrued liability for benefits was $9.8 million; the unfunded actuarial liability was $3.5 million; the plan was 64.08% funded; the covered payroll (annual payroll of active employees covered by the plan) was $5.2million; and the ratio of the UAAL to the covered payroll was 68.08%.
The schedule of funding progress, presented as RSI following the notes to the financial statements, presents multiyear trend information about whether the actuarial value of plan assets is increasing or decreasing over time relative to the actuarial accrued liability for benefits.
B. Other Postemployment Benefits
Plan Description
The City of Pooler Other Postemployment Benefit Plan (Plan) provides PPO and HMO medical and prescription drug benefit plans to all eligible retirees. The City’s regular health care benefit provider, Georgia Municipal Association, underwrites the retiree’s policy and administers the Plan. The Plan was adopted and established by action of the City Council. The Plan does not issue a separate or stand-alone report. The Plan is reported with the City’s governmental activities in the accompanying financial statements.
The City pays 80 percent of the premiums of health care coverage for employees who retire with 25 years of full-time service and who agree to pay the remaining 20 percent of the premium. The City pays 70 percent of these premiums for employees who retire with 20-24 years of full-time service and who agree to pay the remaining 30 percent of the premium. The City pays 50 percent of these premiums for employees who retire with 15-19 years of full-time service and who agree to pay the remaining 50 percent of the premium.
Funding Policy
The City has no obligation to make contributions in advance of when the insurance premiums or benefits are due for payment; in other words, the plan may be financed on a pay-as-you-go basis. Administrative costs of the plan are paid for by the City’s general fund. Plan participants are not required to contribute to the plan. For the year ended December 31, 2010, the City did not make any contributions to advance-fund the plan.
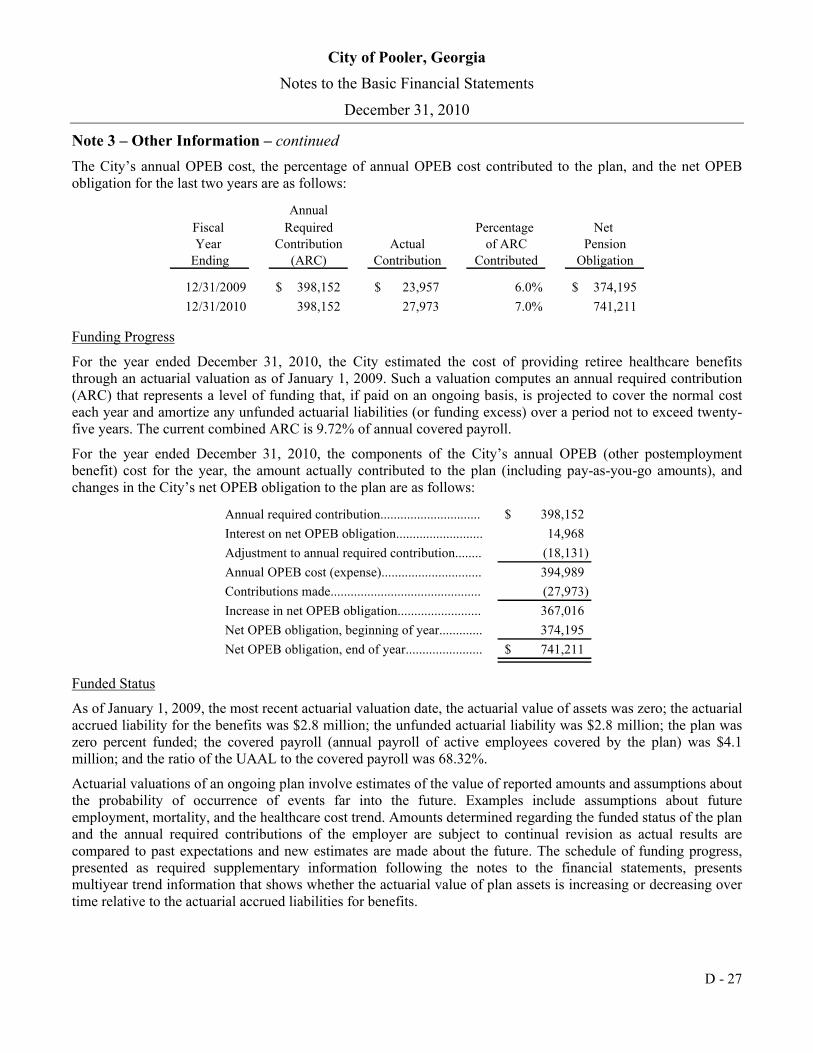
City of Pooler, Georgia
Notes to the Basic Financial Statements
December 31, 2010
D - 27
Note 3 – Other Information – continued
The City’s annual OPEB cost, the percentage of annual OPEB cost contributed to the plan, and the net OPEB obligation for the last two years are as follows:
Annual
Fiscal Required Percentage Net Year Contribution Actual of ARC Pension
Ending (ARC) Contribution Contributed Obligation
12/31/2009 398,152$ 23,957$ 6.0% 374,195$
12/31/2010 398,152 27,973 7.0% 741,211
Funding Progress
For the year ended December 31, 2010, the City estimated the cost of providing retiree healthcare benefits through an actuarial valuation as of January 1, 2009. Such a valuation computes an annual required contribution (ARC) that represents a level of funding that, if paid on an ongoing basis, is projected to cover the normal cost each year and amortize any unfunded actuarial liabilities (or funding excess) over a period not to exceed twenty-five years. The current combined ARC is 9.72% of annual covered payroll.
For the year ended December 31, 2010, the components of the City’s annual OPEB (other postemployment benefit) cost for the year, the amount actually contributed to the plan (including pay-as-you-go amounts), and changes in the City’s net OPEB obligation to the plan are as follows:
Annual required contribution.............................. 398,152$
Interest on net OPEB obligation.......................... 14,968
Adjustment to annual required contribution........ (18,131)
Annual OPEB cost (expense).............................. 394,989
Contributions made............................................. (27,973)
Increase in net OPEB obligation......................... 367,016
Net OPEB obligation, beginning of year............. 374,195
Net OPEB obligation, end of year....................... 741,211$
Funded Status
As of January 1, 2009, the most recent actuarial valuation date, the actuarial value of assets was zero; the actuarial accrued liability for the benefits was $2.8 million; the unfunded actuarial liability was $2.8 million; the plan was zero percent funded; the covered payroll (annual payroll of active employees covered by the plan) was $4.1 million; and the ratio of the UAAL to the covered payroll was 68.32%.
Actuarial valuations of an ongoing plan involve estimates of the value of reported amounts and assumptions about the probability of occurrence of events far into the future. Examples include assumptions about future employment, mortality, and the healthcare cost trend. Amounts determined regarding the funded status of the plan and the annual required contributions of the employer are subject to continual revision as actual results are compared to past expectations and new estimates are made about the future. The schedule of funding progress, presented as required supplementary information following the notes to the financial statements, presents multiyear trend information that shows whether the actuarial value of plan assets is increasing or decreasing over time relative to the actuarial accrued liabilities for benefits.
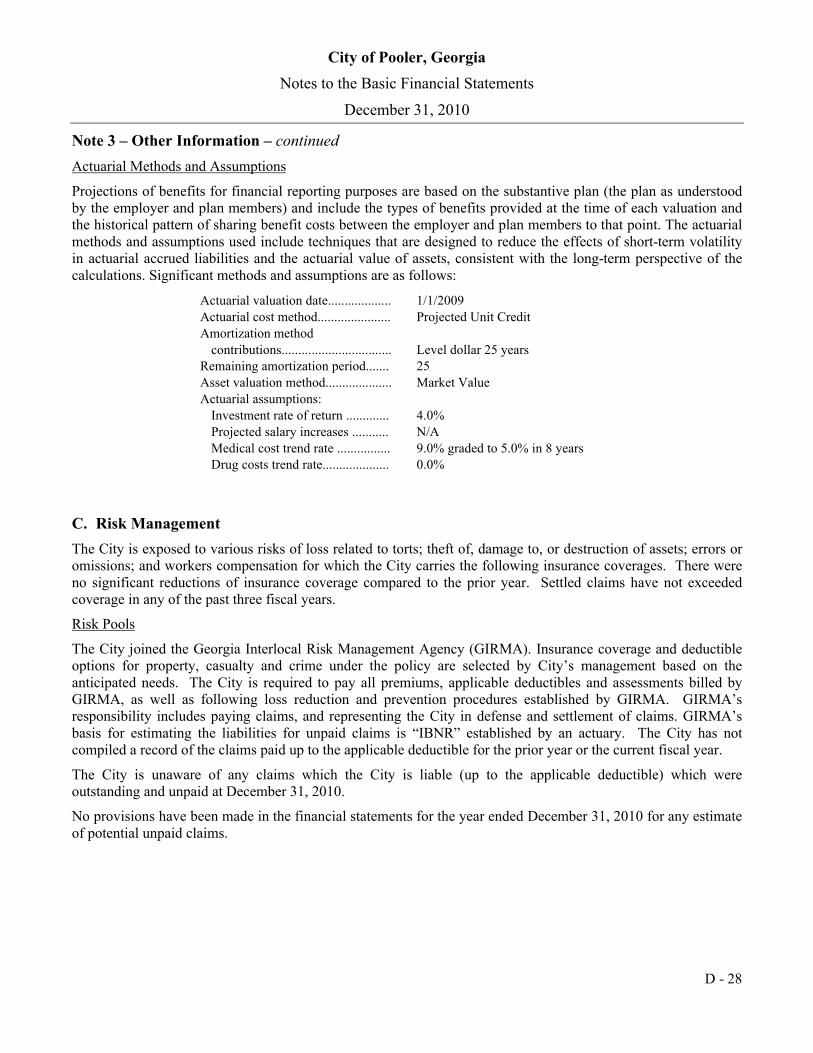
City of Pooler, Georgia
Notes to the Basic Financial Statements
December 31, 2010
D - 28
Note 3 – Other Information – continued
Actuarial Methods and Assumptions
Projections of benefits for financial reporting purposes are based on the substantive plan (the plan as understood by the employer and plan members) and include the types of benefits provided at the time of each valuation and the historical pattern of sharing benefit costs between the employer and plan members to that point. The actuarial methods and assumptions used include techniques that are designed to reduce the effects of short-term volatility in actuarial accrued liabilities and the actuarial value of assets, consistent with the long-term perspective of the calculations. Significant methods and assumptions are as follows:
Actuarial valuation date................... 1/1/2009Actuarial cost method...................... Projected Unit CreditAmortization method
contributions................................. Level dollar 25 yearsRemaining amortization period....... 25Asset valuation method.................... Market ValueActuarial assumptions:
Investment rate of return ............. 4.0%Projected salary increases ........... N/AMedical cost trend rate ................ 9.0% graded to 5.0% in 8 yearsDrug costs trend rate.................... 0.0%
C. Risk Management
The City is exposed to various risks of loss related to torts; theft of, damage to, or destruction of assets; errors or omissions; and workers compensation for which the City carries the following insurance coverages. There were no significant reductions of insurance coverage compared to the prior year. Settled claims have not exceeded coverage in any of the past three fiscal years.
Risk Pools
The City joined the Georgia Interlocal Risk Management Agency (GIRMA). Insurance coverage and deductible options for property, casualty and crime under the policy are selected by City’s management based on the anticipated needs. The City is required to pay all premiums, applicable deductibles and assessments billed by GIRMA, as well as following loss reduction and prevention procedures established by GIRMA. GIRMA’s responsibility includes paying claims, and representing the City in defense and settlement of claims. GIRMA’s basis for estimating the liabilities for unpaid claims is “IBNR” established by an actuary. The City has not compiled a record of the claims paid up to the applicable deductible for the prior year or the current fiscal year.
The City is unaware of any claims which the City is liable (up to the applicable deductible) which were outstanding and unpaid at December 31, 2010.
No provisions have been made in the financial statements for the year ended December 31, 2010 for any estimate of potential unpaid claims.

City of Pooler, Georgia
Notes to the Basic Financial Statements
December 31, 2010
D - 29
Note 3 – Other Information – continued
The City has elected to be a member of the Georgia Municipal Association Workers’ Compensation Self-
Insurance Fund (GMAWCSIF), a risk management agency created under Georgia law. As a participant in the
GMAWCSIF, the City has no legal obligation to pay its own workers’ compensation claims. The City is required
to make an annual contribution to the fund in an amount that is determined on the basis of actuarial projections of
losses. With payment of the City’s annual contribution, the City has effectively transferred the risk and
responsibility for payment of its workers’ compensation claims. However, the enabling statute creating the
GMAWCSIF permits the fund to levy an assessment upon its members to make up any deficiency the fund may
have in surplus or reserves. No amount has been recorded in the financial statements for this contingency as
management believes the likelihood for assessment is remote.
Self Insurance
The City pays unemployment claims to the state department of labor on a reimbursement basis. Liabilities for such claims are immaterial and are not accrued.
D. Commitments and Contingencies
The City receives a number of grants that are subject to program compliance audits by the grantors. Noncompliance with the terms and provisions of these grant agreements could result in contingent liabilities to the grantor agencies.
Various other claims are pending against the City. The City attorney estimates the potential effects of these claims net of insurance coverage would not be material to in relation to the overall financial statements.
E. Other Agencies
The Volunteer Fire Department maintains a cash account independently from the City’s General Fund records. Since this account is not controlled by the City, these transactions are not included in the City’s basic financial statements. The City provides some funding directly and indirectly to this agency.

REQUIRED SUPPLEMENTARY INFORMATION OTHER THAN MANAGEMENT’S DISCUSSION & ANALYSIS


City of Pooler, Georgia
General Fund
Budgetary Comparison Schedule
For the Year Ended December 31, 2010
E - 1
Variance withFinal Budget
PositiveOriginal Final Actual (Negative)
REVENUESTaxes..................................................... 7,582,700$ 7,688,800$ 7,773,761$ 84,961$ Licenses and permits............................. 298,500 368,500 385,268 16,768 Intergovernmental................................. 313,765 837,190 869,064 31,874 Charges for services.............................. 1,221,600 1,223,850 1,254,534 30,684 Fines and forfeitures.............................. 600,000 500,000 493,626 (6,374) Investment income................................ 10,000 10,000 8,545 (1,455) Miscellaneous....................................... 21,207 53,907 62,987 9,080
Total revenues.......................................... 10,047,772 10,682,247 10,847,785 165,538
EXPENDITURESCurrent:
General government:General administration................... 781,208 662,545 641,067 21,478
Public safety:Police department........................... 2,646,993 2,706,890 2,610,393 96,497 Fire department.............................. 1,912,759 2,158,069 2,109,467 48,602
Public works:Public works administration........... 355,201 380,171 370,097 10,074 Street department............................ 959,979 1,404,479 1,397,250 7,229 Drainage department...................... 438,433 429,633 405,016 24,617 Solid waste and recycling............... 965,000 965,000 951,092 13,908
Health and welfare:Senior Citizens Center.................... 154,952 180,442 178,518 1,924
Culture and recreation:Recreation...................................... 707,039 751,689 742,677 9,012 Parks and trees................................ 693,514 640,814 582,810 58,004
Housing and development:Inspections...................................... 375,623 364,223 346,846 17,377
Debt service:Principal............................................. 358,434 358,983 358,983 - Interest and other charges.................. 52,055 52,631 52,170 461
Total expenditures.................................... 10,401,190 11,055,569 10,746,386 309,183
Excess (deficiency) of revenues over(under) expenditures............................. (353,418) (373,322) 101,399 474,721
OTHER FINANCING SOURCES (USES)Transfers in........................................... 310,000 287,662 281,104 (6,558) Insurance recoveries.............................. - 42,242 44,129 1,887 Capital lease proceeds........................... 43,418 43,418 42,281 (1,137)
Total other financing sources (uses)......... 353,418 373,322 367,514 (5,808)
Net change in fund balance...................... - - 468,913 468,913 Fund balance, beginning........................... 7,156,340 7,156,340 7,156,340 -
Fund balance, ending................................ 7,156,340$ 7,156,340$ 7,625,253$ 468,913$
Budgeted Amounts
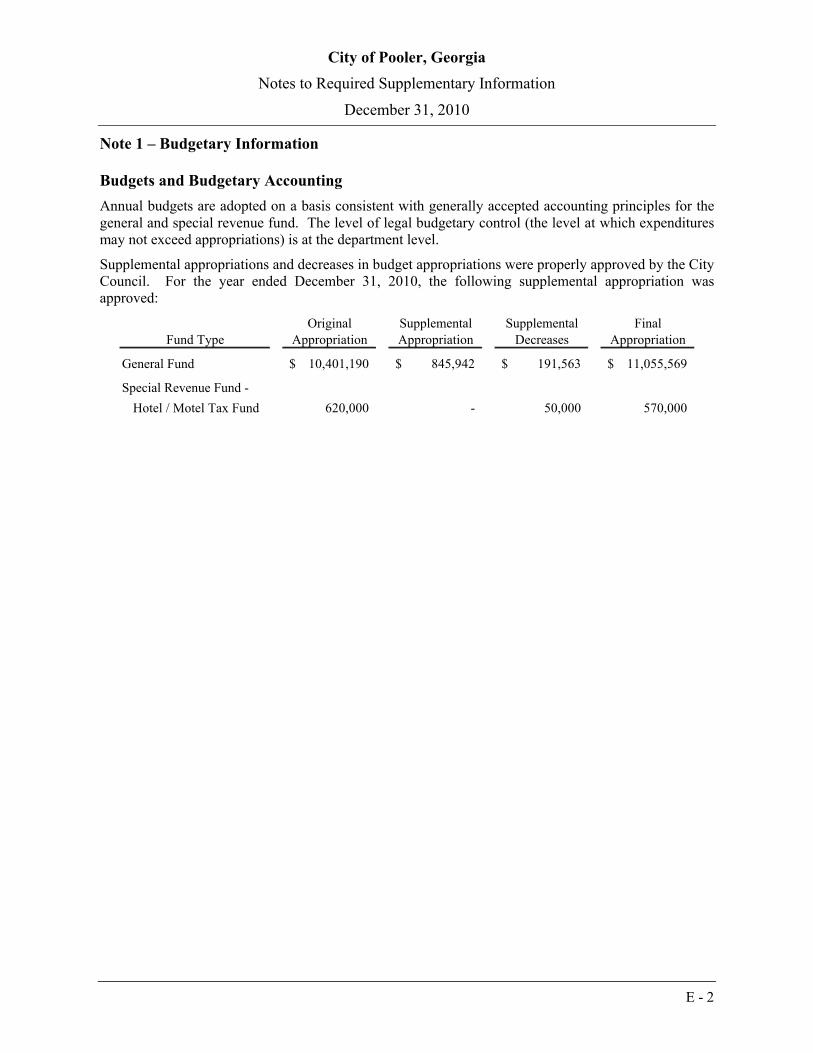
City of Pooler, Georgia
Notes to Required Supplementary Information
December 31, 2010
E - 2
Note 1 – Budgetary Information
Budgets and Budgetary Accounting
Annual budgets are adopted on a basis consistent with generally accepted accounting principles for the general and special revenue fund. The level of legal budgetary control (the level at which expenditures may not exceed appropriations) is at the department level.
Supplemental appropriations and decreases in budget appropriations were properly approved by the City Council. For the year ended December 31, 2010, the following supplemental appropriation was approved:
Original Supplemental Supplemental FinalFund Type Appropriation Appropriation Decreases Appropriation
General Fund 10,401,190$ 845,942$ 191,563$ 11,055,569$
Special Revenue Fund -
Hotel / Motel Tax Fund 620,000 - 50,000 570,000

City of Pooler, Georgia
Schedule of Funding Progress – Pension Plan
December 31, 2010
E - 3
UnfundedActuarial AAL
Actuarial Accrued [UAAL]Actuarial Value of Liability (Funding CoveredValuation Assets [AAL] Excess) Payroll
Date (a) (b) (b) - (a) (c)
1/1/2008 4,380,122$ 6,919,834$ 2,539,712$ 63.30 % 3,681,885$ 68.98 %1/1/2009 4,009,864 7,913,329 3,903,465 50.67 4,095,577 95.317/1/2010 6,264,747 9,776,174 3,511,427 64.08 5,157,943 68.08
Excess) as a(Funding
(a) / (b)
RatioFunded
UAAL
[(b) - (a) / (c)]
Payrollof CoveredPercentage
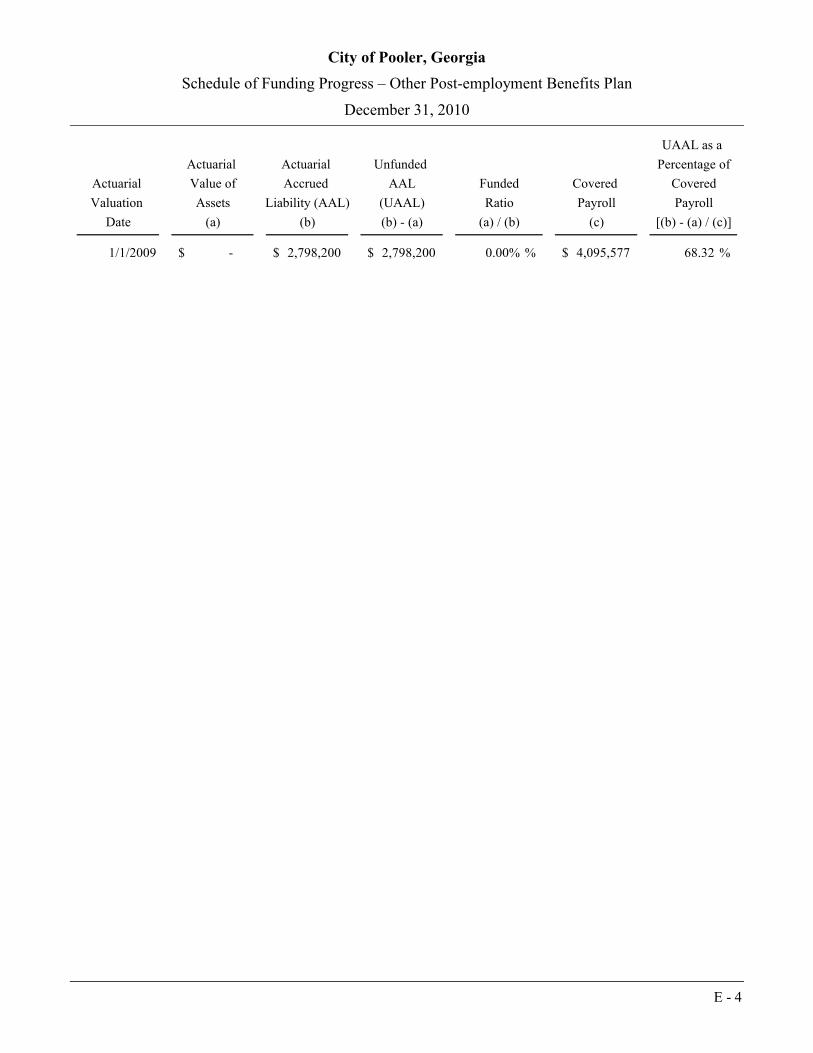
City of Pooler, Georgia
Schedule of Funding Progress – Other Post-employment Benefits Plan
December 31, 2010
E - 4
Actuarial Actuarial Unfunded
Actuarial Value of Accrued AAL Covered
Valuation Assets Liability (AAL) (UAAL) Payroll
Date (a) (b) (b) - (a) (c)
1/1/2009 -$ 2,798,200$ 2,798,200$ 0.00% % 4,095,577$ 68.32 %
Ratio
(a) / (b)
Funded
UAAL as a
Percentage of
Covered
Payroll
[(b) - (a) / (c)]

SUPPLEMENTARY DATA – FUND SCHEDULES AND STATE MANDATED PROGRAM INFORMATION


City of Pooler, Georgia
Hotel – Motel Fund
Budgetary Comparison Schedule
For the Year Ended December 31, 2010
F - 1
Variance with
Final Budget
Positive
Original Final Actual (Negative)
Revenues:
Taxes................................................... 620,000$ 570,000$ 562,208$ (7,792)$
Total revenues........................................ 620,000 570,000 562,208 (7,792)
Expenditures:
Current:
Housing and development................. 310,000 285,000 281,104 3,896
Total expenditures.................................. 310,000 285,000 281,104 3,896
Excess (deficiency) of revenues over
(under) expenditures............................ 310,000 285,000 281,104 (3,896)
Other financing sources (uses):
Transfers out........................................ (310,000) (285,000) (281,104) 3,896
Total financing sources (uses)................ (310,000) (285,000) (281,104) 3,896
Net change in fund balance.................... - - - -
Fund balance, beginning of year............. - - - -
Fund balance, end of year....................... -$ -$ -$ -$
Budgeted Amounts
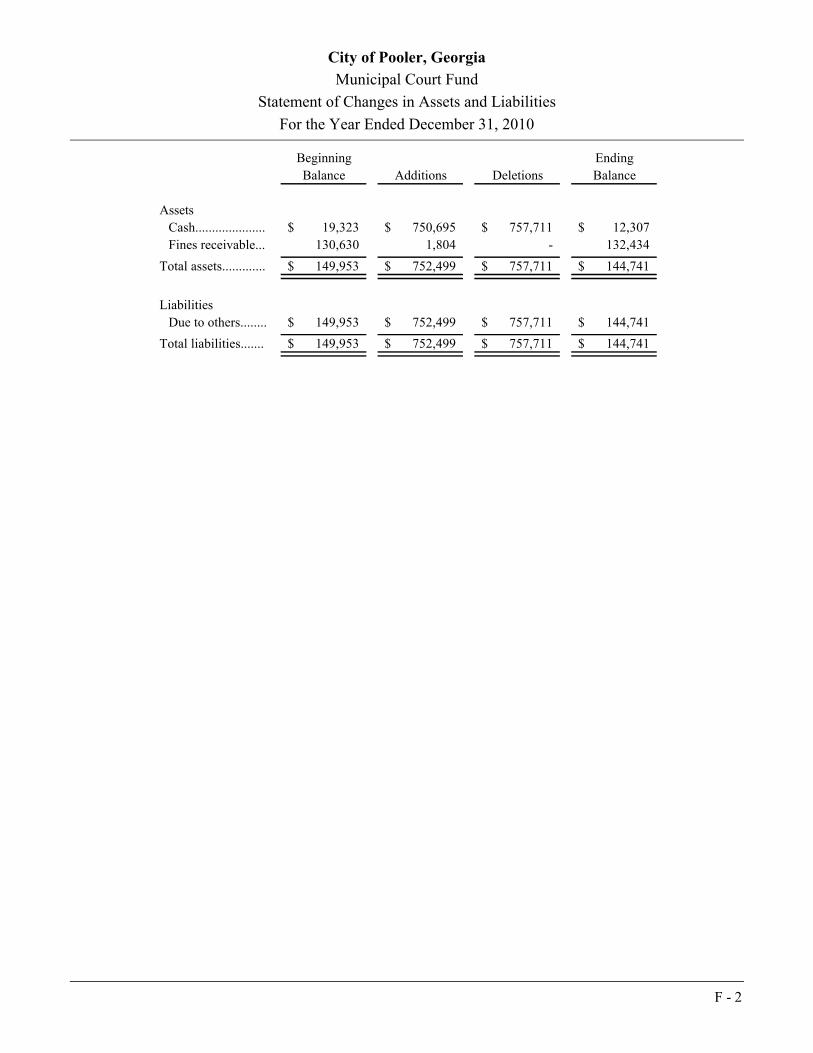
City of Pooler, Georgia
Municipal Court Fund
Statement of Changes in Assets and Liabilities
For the Year Ended December 31, 2010
F - 2
Beginning Ending
Balance Additions Deletions Balance
Assets
Cash..................... 19,323$ 750,695$ 757,711$ 12,307$
Fines receivable... 130,630 1,804 - 132,434
Total assets............. 149,953$ 752,499$ 757,711$ 144,741$
Liabilities
Due to others........ 149,953$ 752,499$ 757,711$ 144,741$
Total liabilities....... 149,953$ 752,499$ 757,711$ 144,741$

City of Pooler, Georgia
Schedule of Projects Constructed with Special Purpose Local Option Sales Tax Proceeds
December 31, 2010
F - 3
Original RevisedEstimated Estimated Prior Current Total
Project Cost Cost Years Year Cost
Sales Tax III (1998-2003)
Drainage: 2,000,000$ 2,048,512$ Simmons Street drainage................................... 4,213$ -$ 4,213$ Benton Canal..................................................... 297,361 - 297,361 South Rogers Street........................................... 3,974 - 3,974 Massey Street.................................................... 7,238 - 7,238 Stormwater mapping......................................... 28,960 - 28,960 Outfalls.............................................................. 208,192 - 208,192 Miscellaneous drainage projects....................... 320,196 22,086 342,282
Open Space.......................................................... 54,667 59,056 - - -
Public Safety:Fire truck debt service....................................... 266,667 217,140 217,140 - 217,140
Other Capital Outlay:Construction of new sidewalks.......................... 458,703 421,183 677,746 - 677,746 Pine Barren-Quacco Road Intersection............. 164,723 - 164,723
Subtotal Sales Tax III.............................................. 2,780,037 2,745,891 1,929,743 22,086 1,951,829
Sales Tax IV (2003-2008)
Public Safety:Fire truck debt service....................................... 200,000 245,815 245,815 - 245,815
Open Space.......................................................... 33,659 44,022 - 2,250 2,250
Other Capital Outlay: 3,779,500 4,201,634 Recreational park.............................................. 2,721,780 9,698 2,731,478 Debt service - Recreation Revenue Bonds........ 333,900 - 333,900 Construction of new sidewalks.......................... 10,919 75,642 86,561
Subtotal Sales Tax IV............................................. 4,013,159 4,491,471 3,312,414 87,590 3,400,004
Sales Tax IV (2008-2014)
Other Capital Outlay:Debt service - Recreation Revenue Bonds........ 6,000,000 6,000,000 - 166,950 166,950
Subtotal Sales Tax IV............................................. 6,000,000 6,000,000 - 166,950 166,950
Grand totals............................................................. 12,793,196$ 13,237,362$ 5,242,157$ 276,626$ 5,518,783$
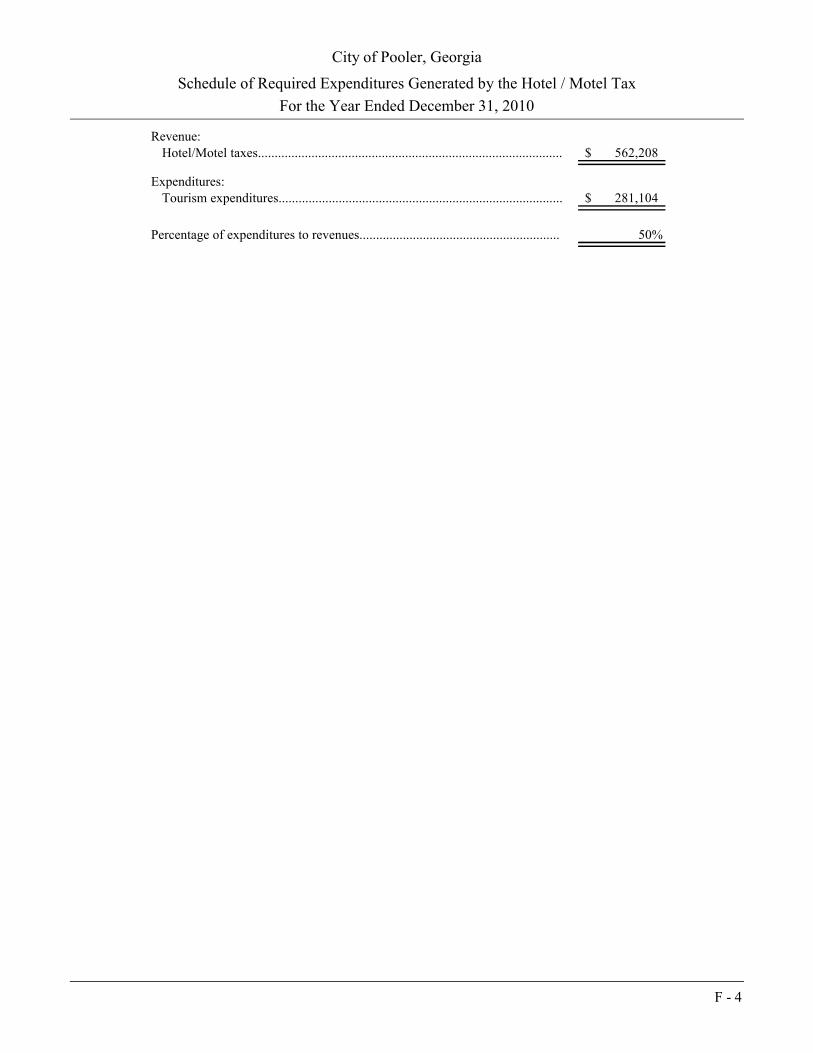
City of Pooler, Georgia
Schedule of Required Expenditures Generated by the Hotel / Motel Tax
For the Year Ended December 31, 2010
F - 4
Revenue:Hotel/Motel taxes........................................................................................... 562,208$
Expenditures:Tourism expenditures..................................................................................... 281,104$
Percentage of expenditures to revenues............................................................ 50%

G - 1
STATISTICAL SECTION
This part of the City of Pooler, Georgia’s Comprehensive Annual Financial Report presents detailed information as a context for understanding what the information in the financial statements, note disclosures, and required supplementary information says about the City’s overall financial health.
Contents Page
G-2
These schedules contain trend information to help the reader understand how the city's financial
position has changed over time.
G-9
These schedules contain information to help the reader understand and assess the factors
affecting the city's ability to generate its most significant local revenue sources, the property tax
and the sales tax.
G-14
These schedules present information to help the reader assess the affordability of the city's
current levels of outstanding debt and the city's ability to issue additional debt in the future.
G-18
These schedules offer economic and demographic indicators to help the reader understand the
environment within which the city's financial activities take place and to provide information
that facilitates comparisons of financial information over time and among governments.
G-20
These schedules contain service and infrastructure data to help the reader understand how the
information in the city's financial report relates to the services the city provides and the
activities it performs.
Operating Information......................................................................................................................
Financial Trends.................................................................................................................................
Revenue Capacity...............................................................................................................................
Debt Capacity.....................................................................................................................................
Demographic and Economic Information........................................................................................
Sources: Unless otherwise noted, the information in these schedules is derived from the City’s financial reports for the relevant year. The City implemented GASBS 34 in 2004; schedules presenting government-wide information (unless otherwise indicated) include information beginning in that year.

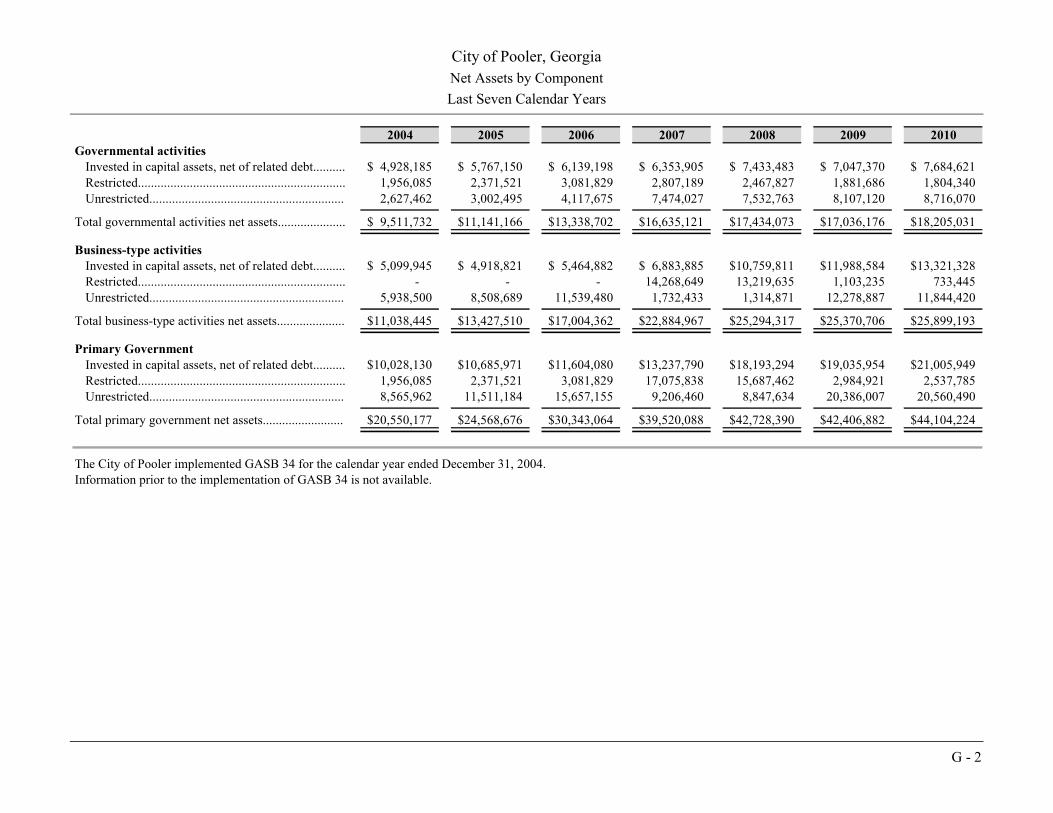
City of Pooler, Georgia
Net Assets by Component
Last Seven Calendar Years
G - 2
2004 2005 2006 2007 2008 2009 2010Governmental activities
Invested in capital assets, net of related debt.......... 4,928,185$ 5,767,150$ 6,139,198$ 6,353,905$ 7,433,483$ 7,047,370$ 7,684,621$ Restricted................................................................ 1,956,085 2,371,521 3,081,829 2,807,189 2,467,827 1,881,686 1,804,340 Unrestricted............................................................ 2,627,462 3,002,495 4,117,675 7,474,027 7,532,763 8,107,120 8,716,070
Total governmental activities net assets..................... 9,511,732$ 11,141,166$ 13,338,702$ 16,635,121$ 17,434,073$ 17,036,176$ 18,205,031$
Business-type activitiesInvested in capital assets, net of related debt.......... 5,099,945$ 4,918,821$ 5,464,882$ 6,883,885$ 10,759,811$ 11,988,584$ 13,321,328$Restricted................................................................ - - - 14,268,649 13,219,635 1,103,235 733,445 Unrestricted............................................................ 5,938,500 8,508,689 11,539,480 1,732,433 1,314,871 12,278,887 11,844,420
Total business-type activities net assets..................... 11,038,445$ 13,427,510$ 17,004,362$ 22,884,967$ 25,294,317$ 25,370,706$ 25,899,193$
Primary GovernmentInvested in capital assets, net of related debt.......... 10,028,130$ 10,685,971$ 11,604,080$ 13,237,790$ 18,193,294$ 19,035,954$ 21,005,949$Restricted................................................................ 1,956,085 2,371,521 3,081,829 17,075,838 15,687,462 2,984,921 2,537,785 Unrestricted............................................................ 8,565,962 11,511,184 15,657,155 9,206,460 8,847,634 20,386,007 20,560,490
Total primary government net assets......................... 20,550,177$ 24,568,676$ 30,343,064$ 39,520,088$ 42,728,390$ 42,406,882$ 44,104,224$
The City of Pooler implemented GASB 34 for the calendar year ended December 31, 2004.Information prior to the implementation of GASB 34 is not available.

City of Pooler, Georgia
Changes in Net Assets
Last Seven Calendar Years
G - 3
2004 2005 2006 2007 2008 2009 2010Expenses
Governmental activities:
General government......................................................... 969,525$ 1,002,427$ 1,256,912$ 1,547,470$ 1,546,693$ 1,111,240$ 679,957$
Public safety..................................................................... 2,225,836 2,707,976 3,107,415 3,393,650 3,883,305 4,582,679 4,593,471
Public works..................................................................... 2,422,748 2,470,765 2,125,679 2,566,199 3,166,924 2,644,005 2,896,229
Health and welfare............................................................ 82,076 107,704 104,412 140,525 167,869 177,029 189,957
Culture and recreation...................................................... 416,141 342,222 930,940 1,453,187 1,539,124 2,091,260 1,763,580
Housing and development................................................ 513,700 533,939 583,953 554,574 597,580 681,187 649,072
Interest on long-term debt................................................ 42,930 37,455 46,268 178,945 216,665 245,443 230,314
Total governmental activities expenses................................ 6,672,956 7,202,488 8,155,579 9,834,550 11,118,160 11,532,843 11,002,580
Business-type activities:
Water and sewer............................................................... 3,216,630 3,021,623 3,716,554 5,043,784 5,923,440 5,899,528 5,435,722
Total business-type activities expense................................. 3,216,630 3,021,623 3,716,554 5,043,784 5,923,440 5,899,528 5,435,722
Total primary government expenses........................................ 9,889,586$ 10,224,111$ 11,872,133$ 14,878,334$ 17,041,600$ 17,432,371$ 16,438,302$
Program Revenues
Governmental activities:
Charges for services:
General government...................................................... 643,227$ 686,473$ 781,888$ 1,038,640$ 683,765$ 213,935$ 385,268$
Public safety................................................................. 470,224 475,618 470,681 712,812 664,769 452,756 534,095
Public works................................................................. 766,834 816,135 908,002 1,209,568 1,374,763 937,006 1,067,061
Health and welfare........................................................ - - - 2,926 5,169 4,942 4,368
Culture and recreation.................................................. 41,581 34,489 62,389 132,138 107,053 114,391 142,636
Operating grants and contributions.................................. 47,178 90,282 74,696 63,521 74,324 244,329 537,167
Capital grants and contributions....................................... 1,846,195 953,291 1,100,720 64,017 22,339 - 316,245
Total governmental activities program revenues.................. 3,815,239 3,056,288 3,398,376 3,223,622 2,932,182 1,967,359 2,986,840
Business-type activities - water and sewer:
Charges for services......................................................... 2,643,935 3,212,285 4,200,773 3,803,287 3,424,339 4,065,215 4,747,291
Capital grants and contributions....................................... 2,536,061 2,013,056 2,643,057 6,397,249 2,205,867 1,430,242 1,154,287
Total business type activities program revenues.................. 5,179,996 5,225,341 6,843,830 10,200,536 5,630,206 5,495,457 5,901,578
Total primary government program revenues.......................... 8,995,235$ 8,281,629$ 10,242,206$ 13,424,158$ 8,562,388$ 7,462,816$ 8,888,418$
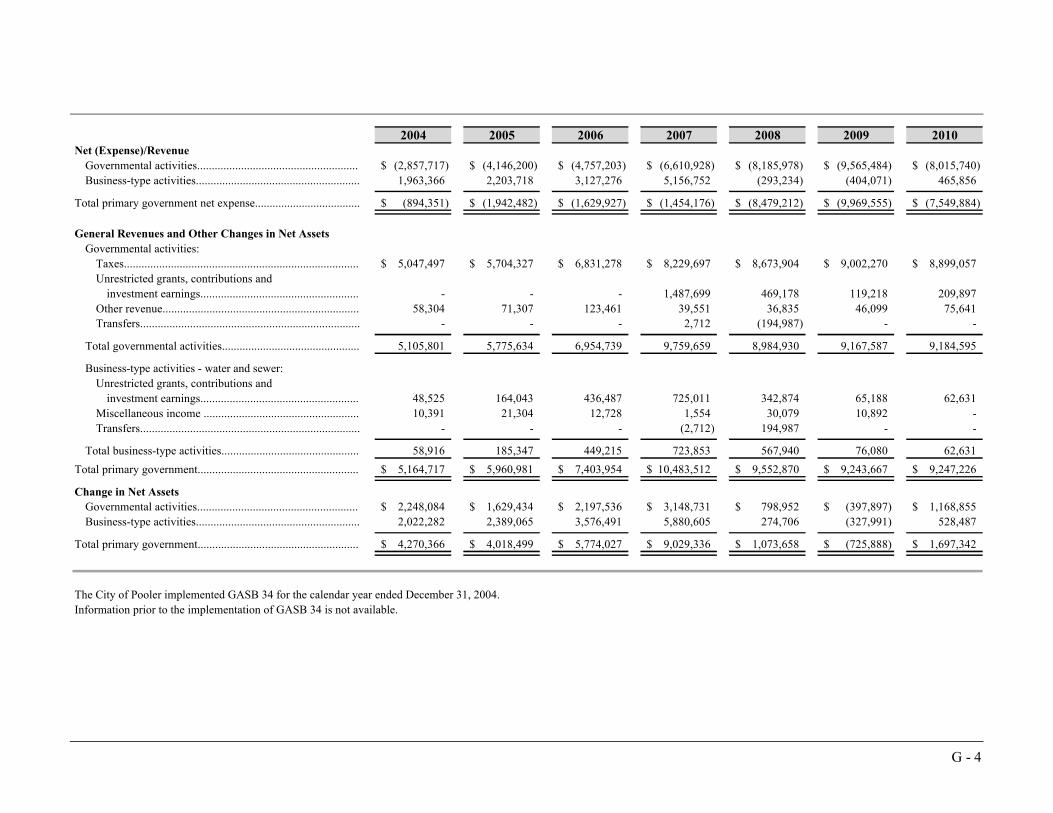
G - 4
2004 2005 2006 2007 2008 2009 2010Net (Expense)/Revenue
Governmental activities....................................................... (2,857,717)$ (4,146,200)$ (4,757,203)$ (6,610,928)$ (8,185,978)$ (9,565,484)$ (8,015,740)$
Business-type activities........................................................ 1,963,366 2,203,718 3,127,276 5,156,752 (293,234) (404,071) 465,856
Total primary government net expense.................................... (894,351)$ (1,942,482)$ (1,629,927)$ (1,454,176)$ (8,479,212)$ (9,969,555)$ (7,549,884)$
General Revenues and Other Changes in Net Assets
Governmental activities:
Taxes................................................................................ 5,047,497$ 5,704,327$ 6,831,278$ 8,229,697$ 8,673,904$ 9,002,270$ 8,899,057$
Unrestricted grants, contributions and
investment earnings...................................................... - - - 1,487,699 469,178 119,218 209,897
Other revenue................................................................... 58,304 71,307 123,461 39,551 36,835 46,099 75,641
Transfers........................................................................... - - - 2,712 (194,987) - -
Total governmental activities............................................... 5,105,801 5,775,634 6,954,739 9,759,659 8,984,930 9,167,587 9,184,595
Business-type activities - water and sewer:
Unrestricted grants, contributions and
investment earnings...................................................... 48,525 164,043 436,487 725,011 342,874 65,188 62,631
Miscellaneous income ..................................................... 10,391 21,304 12,728 1,554 30,079 10,892 -
Transfers........................................................................... - - - (2,712) 194,987 - -
Total business-type activities............................................... 58,916 185,347 449,215 723,853 567,940 76,080 62,631
Total primary government....................................................... 5,164,717$ 5,960,981$ 7,403,954$ 10,483,512$ 9,552,870$ 9,243,667$ 9,247,226$
Change in Net Assets
Governmental activities....................................................... 2,248,084$ 1,629,434$ 2,197,536$ 3,148,731$ 798,952$ (397,897)$ 1,168,855$
Business-type activities........................................................ 2,022,282 2,389,065 3,576,491 5,880,605 274,706 (327,991) 528,487
Total primary government....................................................... 4,270,366$ 4,018,499$ 5,774,027$ 9,029,336$ 1,073,658$ (725,888)$ 1,697,342$
The City of Pooler implemented GASB 34 for the calendar year ended December 31, 2004.
Information prior to the implementation of GASB 34 is not available.

City of Pooler, Georgia
Fund Balances, Governmental Funds
Last Ten Calendar Years
G - 5
2001 2002 2003 2004 2005General Fund
Reserved............................................... 1,209,749$ 28,236$ 9,277$ 19,822$ 10,763$ Unreserved............................................ 1,613,846 1,857,176 2,100,022 2,201,986 2,389,887
Total general fund.................................... 2,823,595$ 1,885,412$ 2,109,299$ 2,221,808$ 2,400,650$
All Other Governmental FundsReserved............................................... -$ -$ -$ -$ -$ Unreserved, reported in:
Capital projects fund.......................... - 1,593,534 1,809,062 1,936,263 2,371,521
Total all other governmental funds........... -$ 1,593,534$ 1,809,062$ 1,936,263$ 2,371,521$
2006 2007 2008 2009 2010General Fund
Reserved............................................... 11,031$ 29,323$ 30,716$ 29,323$ 21,835$ Unreserved............................................ 3,449,879 4,917,867 6,593,303 7,127,017 7,603,418
Total general fund.................................... 3,460,910$ 4,947,190$ 6,624,019$ 7,156,340$ 7,625,253$
All Other Governmental FundsReserved............................................... -$ -$ -$ -$ -$ Unreserved, reported in:
Capital projects fund.......................... 3,081,829 3,771,711 2,467,827 1,881,686 1,807,020
Total all other governmental funds........... 3,081,829$ 3,771,711$ 2,467,827$ 1,881,686$ 1,807,020$

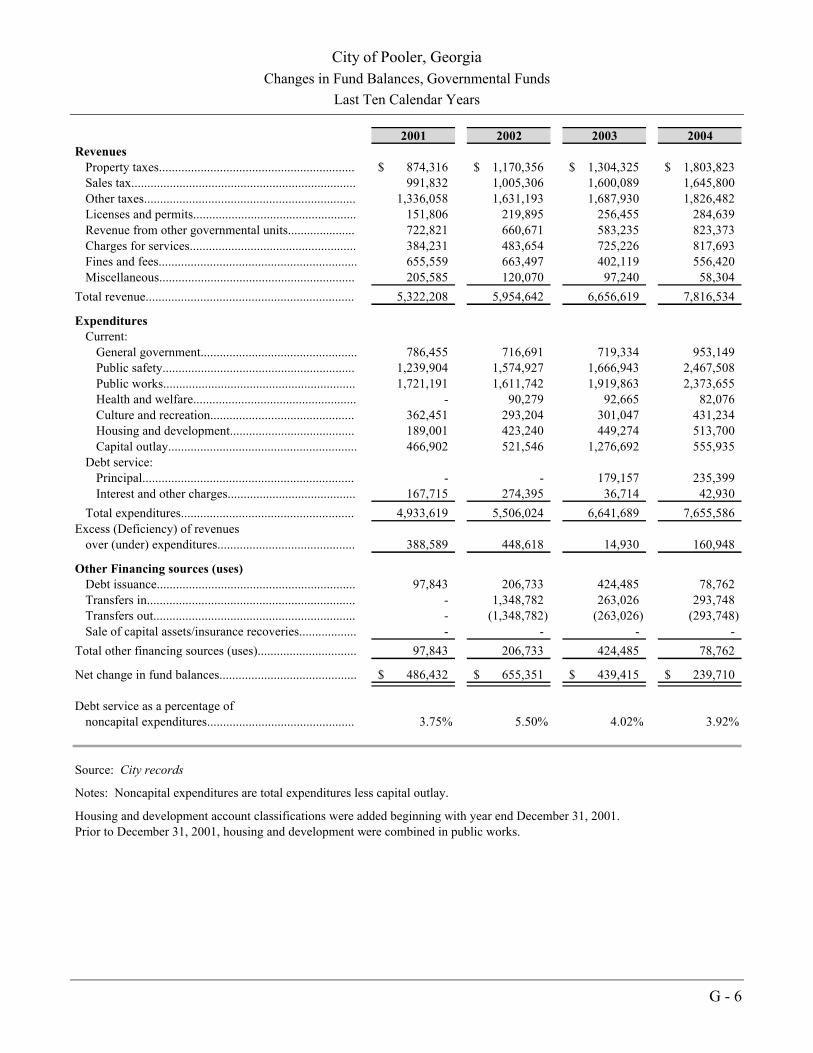
City of Pooler, Georgia
Changes in Fund Balances, Governmental Funds
Last Ten Calendar Years
G - 6
2001 2002 2003 2004Revenues
Property taxes............................................................. 874,316$ 1,170,356$ 1,304,325$ 1,803,823$ Sales tax...................................................................... 991,832 1,005,306 1,600,089 1,645,800 Other taxes.................................................................. 1,336,058 1,631,193 1,687,930 1,826,482 Licenses and permits................................................... 151,806 219,895 256,455 284,639 Revenue from other governmental units..................... 722,821 660,671 583,235 823,373 Charges for services.................................................... 384,231 483,654 725,226 817,693 Fines and fees.............................................................. 655,559 663,497 402,119 556,420 Miscellaneous............................................................. 205,585 120,070 97,240 58,304
Total revenue................................................................. 5,322,208 5,954,642 6,656,619 7,816,534
ExpendituresCurrent:
General government................................................. 786,455 716,691 719,334 953,149 Public safety............................................................ 1,239,904 1,574,927 1,666,943 2,467,508 Public works............................................................ 1,721,191 1,611,742 1,919,863 2,373,655 Health and welfare................................................... - 90,279 92,665 82,076 Culture and recreation............................................. 362,451 293,204 301,047 431,234 Housing and development....................................... 189,001 423,240 449,274 513,700 Capital outlay........................................................... 466,902 521,546 1,276,692 555,935
Debt service:Principal.................................................................. - - 179,157 235,399 Interest and other charges........................................ 167,715 274,395 36,714 42,930
Total expenditures...................................................... 4,933,619 5,506,024 6,641,689 7,655,586 Excess (Deficiency) of revenues
over (under) expenditures........................................... 388,589 448,618 14,930 160,948
Other Financing sources (uses)Debt issuance.............................................................. 97,843 206,733 424,485 78,762 Transfers in................................................................. - 1,348,782 263,026 293,748 Transfers out............................................................... - (1,348,782) (263,026) (293,748) Sale of capital assets/insurance recoveries.................. - - - -
Total other financing sources (uses)............................... 97,843 206,733 424,485 78,762
Net change in fund balances........................................... 486,432$ 655,351$ 439,415$ 239,710$
Debt service as a percentage ofnoncapital expenditures.............................................. 3.75% 5.50% 4.02% 3.92%
Source: City records
Notes: Noncapital expenditures are total expenditures less capital outlay.
Housing and development account classifications were added beginning with year end December 31, 2001.Prior to December 31, 2001, housing and development were combined in public works.
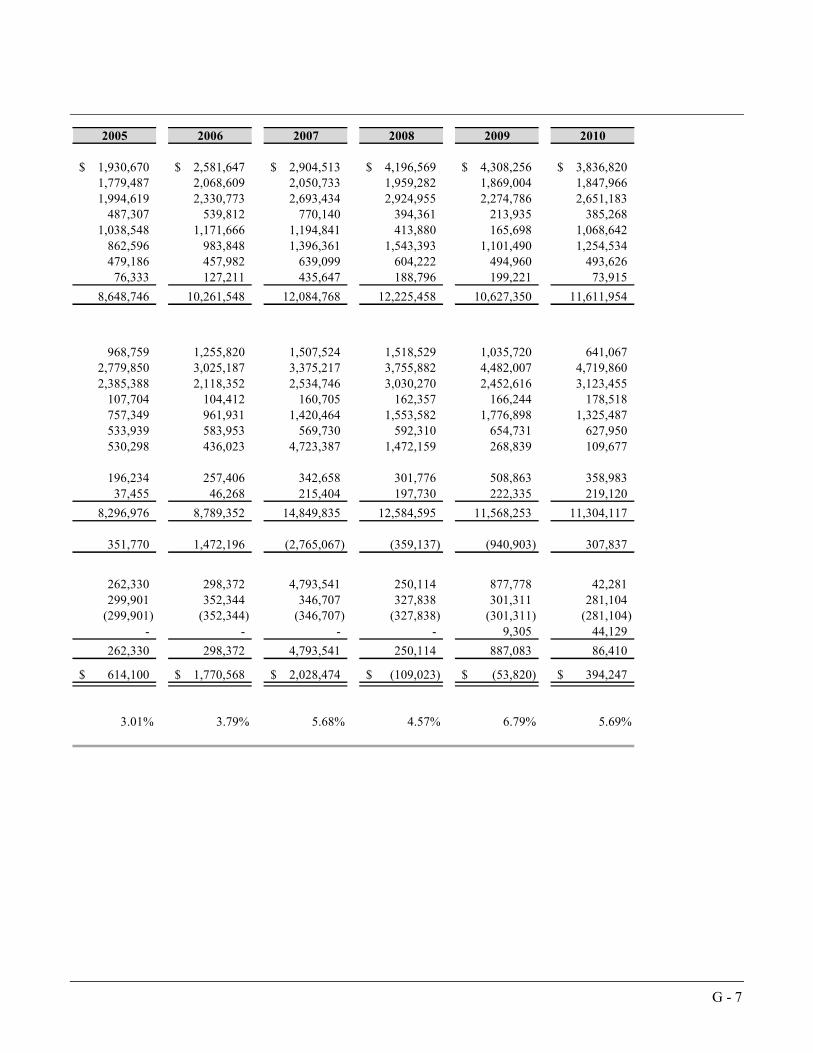
G - 7
2005 2006 2007 2008 2009 2010
1,930,670$ 2,581,647$ 2,904,513$ 4,196,569$ 4,308,256$ 3,836,820$ 1,779,487 2,068,609 2,050,733 1,959,282 1,869,004 1,847,966 1,994,619 2,330,773 2,693,434 2,924,955 2,274,786 2,651,183
487,307 539,812 770,140 394,361 213,935 385,268 1,038,548 1,171,666 1,194,841 413,880 165,698 1,068,642
862,596 983,848 1,396,361 1,543,393 1,101,490 1,254,534 479,186 457,982 639,099 604,222 494,960 493,626
76,333 127,211 435,647 188,796 199,221 73,915
8,648,746 10,261,548 12,084,768 12,225,458 10,627,350 11,611,954
968,759 1,255,820 1,507,524 1,518,529 1,035,720 641,067 2,779,850 3,025,187 3,375,217 3,755,882 4,482,007 4,719,860 2,385,388 2,118,352 2,534,746 3,030,270 2,452,616 3,123,455
107,704 104,412 160,705 162,357 166,244 178,518 757,349 961,931 1,420,464 1,553,582 1,776,898 1,325,487 533,939 583,953 569,730 592,310 654,731 627,950 530,298 436,023 4,723,387 1,472,159 268,839 109,677
196,234 257,406 342,658 301,776 508,863 358,983 37,455 46,268 215,404 197,730 222,335 219,120
8,296,976 8,789,352 14,849,835 12,584,595 11,568,253 11,304,117
351,770 1,472,196 (2,765,067) (359,137) (940,903) 307,837
262,330 298,372 4,793,541 250,114 877,778 42,281 299,901 352,344 346,707 327,838 301,311 281,104
(299,901) (352,344) (346,707) (327,838) (301,311) (281,104) - - - - 9,305 44,129
262,330 298,372 4,793,541 250,114 887,083 86,410
614,100$ 1,770,568$ 2,028,474$ (109,023)$ (53,820)$ 394,247$
3.01% 3.79% 5.68% 4.57% 6.79% 5.69%

City of Pooler, Georgia
Schedule of Tax Revenues and Franchise Fees
Last Ten Calendar Years
G - 8
Calendar Year MaltEnding Local Option Insurance Occupational and Alcohol Utility Annual
December 31, Property Tax Sales Tax Premium Tax Tax Beverage Tax Lodging Tax Franchise Fee Totals
2001 874,316$ 991,832$ 226,626$ 149,146$ 193,836$ 378,002$ 388,448$ 3,202,206$
2002 1,170,356 1,005,306 248,660 154,508 214,912 484,203 528,910 3,806,855
2003 1,304,325 1,600,089 267,997 160,253 232,431 526,052 501,197 4,592,344
2004 1,803,823 1,645,800 290,436 185,585 245,276 587,496 517,689 5,276,105
2005 1,930,670 1,779,487 312,471 199,166 264,880 601,136 616,966 5,704,776
2006 2,581,647 2,068,609 326,923 242,076 315,086 704,688 742,000 6,981,029
2007 2,904,513 2,050,733 341,017 268,500 410,803 693,414 979,700 7,648,680
2008 4,196,569 1,959,282 349,186 289,404 460,411 655,860 1,170,094 9,080,806
2009 4,308,256 1,869,004 345,910 307,689 466,200 602,624 552,363 (1) 8,452,046
2010 3,836,730 1,847,966 335,857 219,640 483,161 562,208 1,050,407 8,335,969
Source: City records
Table includes general fund and special revenue fund revenues.
(1) The City's franchise fee agreement with Georgia Power was amended in 2009 and the payment schedule changed from quarterly to annually. The Cityreceived the 2009 first quarter payment in April of 2009 and did not receive another payment until March 2010. The March 2010 payment represented thelast three quarters of calendar year 2009.


City of Pooler, Georgia
Assessed and Actual Value of Taxable Property
Last Ten Calendar Years
(In thousands of dollars)
G - 9
Real Property Personal Property Utilities and Other Property
Calendar Assessed Estimated Assessed Estimated Assessed EstimatedYear Value Actual Value Value Actual Value Value Actual Value
2001 168,724$ 421,810$ 55,856$ 139,640$ 1,236$ 3,090$
2002 212,138 530,345 76,668 191,670 1,514 3,785
2003 301,457 753,643 71,431 178,578 1,515 3,788
2004 338,435 846,088 78,522 196,305 1,748 4,370
2005 419,499 1,048,748 88,793 221,983 1,831 4,578
2006 527,258 1,318,145 97,774 244,435 1,982 4,955
2007 670,918 1,677,295 117,386 293,465 1,583 3,958
2008 788,988 1,972,470 130,563 326,408 4,046 10,115
2009 821,471 2,053,678 149,589 373,973 4,681 11,703
2010 808,755 2,021,888 147,231 368,078 5,257 13,143
Source: Georgia Department of Revenue - Consolidation and Evaluation of Digest
Note: The ratio of total assessed to total estimated value is set at 40% by state law.
Tax rates are per $1,000 net assessed value.

G - 10
Ratio of TotalTotal Assessed to
Total Total
Assessed Estimated Estimated Direct TaxValue Actual Value Value Rate
225,816$ 564,540$ 40.00% 4.000
290,320 725,800 40.00% 3.910
374,403 936,009 40.00% 3.669
418,705 1,046,763 40.00% 4.250
510,123 1,275,309 40.00% 4.071
627,014 1,567,535 40.00% 4.500
789,887 1,974,718 40.00% 4.392
923,597 2,308,993 40.00% 4.500
975,741 2,439,354 40.00% 4.500
961,243 2,403,109 40.00% 4.500

City of Pooler, Georgia
Direct and Overlapping Property Tax Rates
Last Ten Calendar Years
G - 11
City of Pooler
Tax Year Operating School District County State Total
2001 4.000 18.576 10.367 0.250 33.193
2002 3.910 17.550 10.367 0.250 32.077
2003 3.669 17.680 10.367 0.250 31.966
2004 4.250 17.600 10.367 0.250 32.467
2005 4.071 17.277 11.037 0.250 32.635
2006 4.500 14.642 10.837 0.250 30.229
2007 4.392 13.795 10.537 0.250 28.974
2008 4.500 13.404 10.537 0.250 28.691
2009 4.500 13.404 10.537 0.250 28.691
2010 4.500 14.131 10.537 0.250 29.418
Source: Department of Revenue - Tax Digest Millage Rates
a Overlapping rates are those of local and county governments that apply to property owners withinthe City of Pooler.
Overlapping Rates
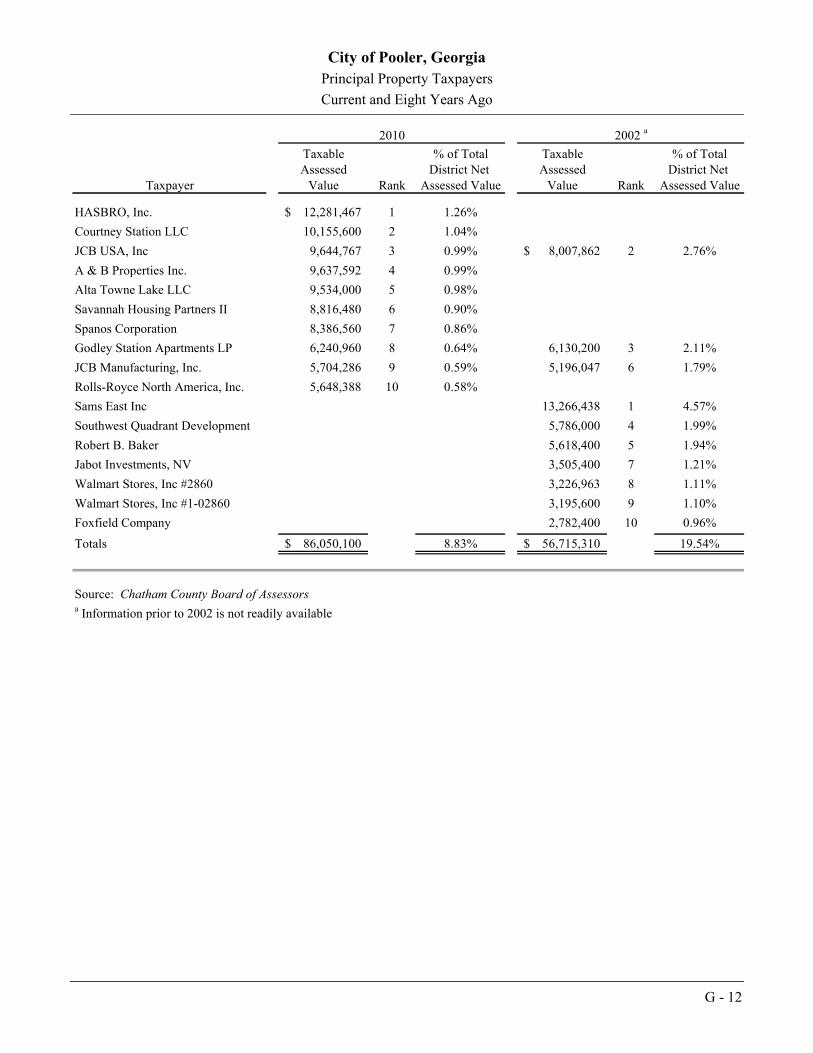
City of Pooler, Georgia
Principal Property Taxpayers
Current and Eight Years Ago
G - 12
Taxable % of Total Taxable % of TotalAssessed District Net Assessed District Net
Taxpayer Value Rank Assessed Value Value Rank Assessed Value
HASBRO, Inc. 12,281,467$ 1 1.26%
Courtney Station LLC 10,155,600 2 1.04%
JCB USA, Inc 9,644,767 3 0.99% 8,007,862$ 2 2.76%
A & B Properties Inc. 9,637,592 4 0.99%
Alta Towne Lake LLC 9,534,000 5 0.98%
Savannah Housing Partners II 8,816,480 6 0.90%
Spanos Corporation 8,386,560 7 0.86%
Godley Station Apartments LP 6,240,960 8 0.64% 6,130,200 3 2.11%
JCB Manufacturing, Inc. 5,704,286 9 0.59% 5,196,047 6 1.79%
Rolls-Royce North America, Inc. 5,648,388 10 0.58%
Sams East Inc 13,266,438 1 4.57%
Southwest Quadrant Development 5,786,000 4 1.99%
Robert B. Baker 5,618,400 5 1.94%
Jabot Investments, NV 3,505,400 7 1.21%
Walmart Stores, Inc #2860 3,226,963 8 1.11%
Walmart Stores, Inc #1-02860 3,195,600 9 1.10%
Foxfield Company 2,782,400 10 0.96%
Totals 86,050,100$ 8.83% 56,715,310$ 19.54%
Source: Chatham County Board of Assessorsa Information prior to 2002 is not readily available
2002 a2010

City of Pooler, Georgia
Property Tax Levies and Collections
Last Ten Calendar Years
G - 13
Amount
Percentage of
Levy
Collections
for
subsequent
years Amount
Percentage of
Levy
2001 777,862$ 671,023$ 86.27% 105,594$ 776,617$ 99.84%
2002 934,126 755,649 80.89% 177,368 933,017 99.88%
2003 1,119,214 931,708 83.25% 185,696 1,117,404 99.84%
2004 1,475,079 1,324,285 89.78% 149,501 1,473,786 99.91%
2005 1,639,817 1,536,648 93.71% 94,926 1,631,574 99.50%
2006 2,388,944 1,984,407 83.07% 399,657 2,384,064 99.80%
2007 2,881,516 1,229,403 (3) 42.67% 1,635,172 2,864,575 99.41%
2008 3,592,498 2,952,303 82.18% 485,723 3,438,026 95.70%
2009 3,844,880 3,251,769 84.57% 431,399 3,683,168 95.79%
2010 3,862,638 2,960,033 76.63% - 2,960,033 76.63%
Source: City records.
(1) Taxes are assessed for the calendar year beginning January 1.
(2) The total tax levy includes real property, industrial area, personal property and public utilities.The total tax levy is the original state approved levy after adjustments for cancelations, releases,errors and additions.
(3) Collections decreased due to a two week delay in rendering tax bills.
Calendar
Year (1)
Collected within the Calendar
Year of the Levy
Total Tax
Levy (2)
Total Collections to Date
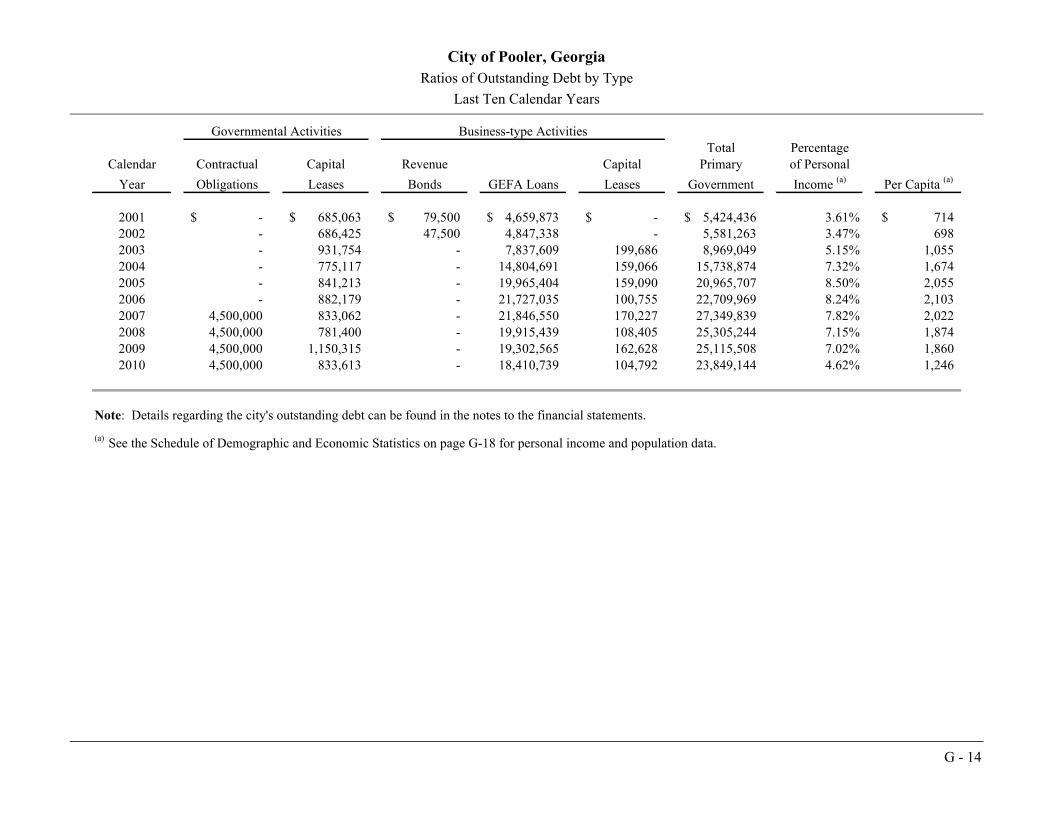
City of Pooler, Georgia
Ratios of Outstanding Debt by Type
Last Ten Calendar Years
G - 14
Governmental ActivitiesTotal Percentage
Calendar Contractual Capital Revenue Capital Primary of Personal
Year Obligations Leases Bonds GEFA Loans Leases Government Income (a) Per Capita (a)
2001 -$ 685,063$ 79,500$ 4,659,873$ -$ 5,424,436$ 3.61% 714$ 2002 - 686,425 47,500 4,847,338 - 5,581,263 3.47% 698 2003 - 931,754 - 7,837,609 199,686 8,969,049 5.15% 1,055 2004 - 775,117 - 14,804,691 159,066 15,738,874 7.32% 1,674 2005 - 841,213 - 19,965,404 159,090 20,965,707 8.50% 2,055 2006 - 882,179 - 21,727,035 100,755 22,709,969 8.24% 2,103 2007 4,500,000 833,062 - 21,846,550 170,227 27,349,839 7.82% 2,022 2008 4,500,000 781,400 - 19,915,439 108,405 25,305,244 7.15% 1,874 2009 4,500,000 1,150,315 - 19,302,565 162,628 25,115,508 7.02% 1,860 2010 4,500,000 833,613 - 18,410,739 104,792 23,849,144 4.62% 1,246
Note: Details regarding the city's outstanding debt can be found in the notes to the financial statements.
(a) See the Schedule of Demographic and Economic Statistics on page G-18 for personal income and population data.
Business-type Activities
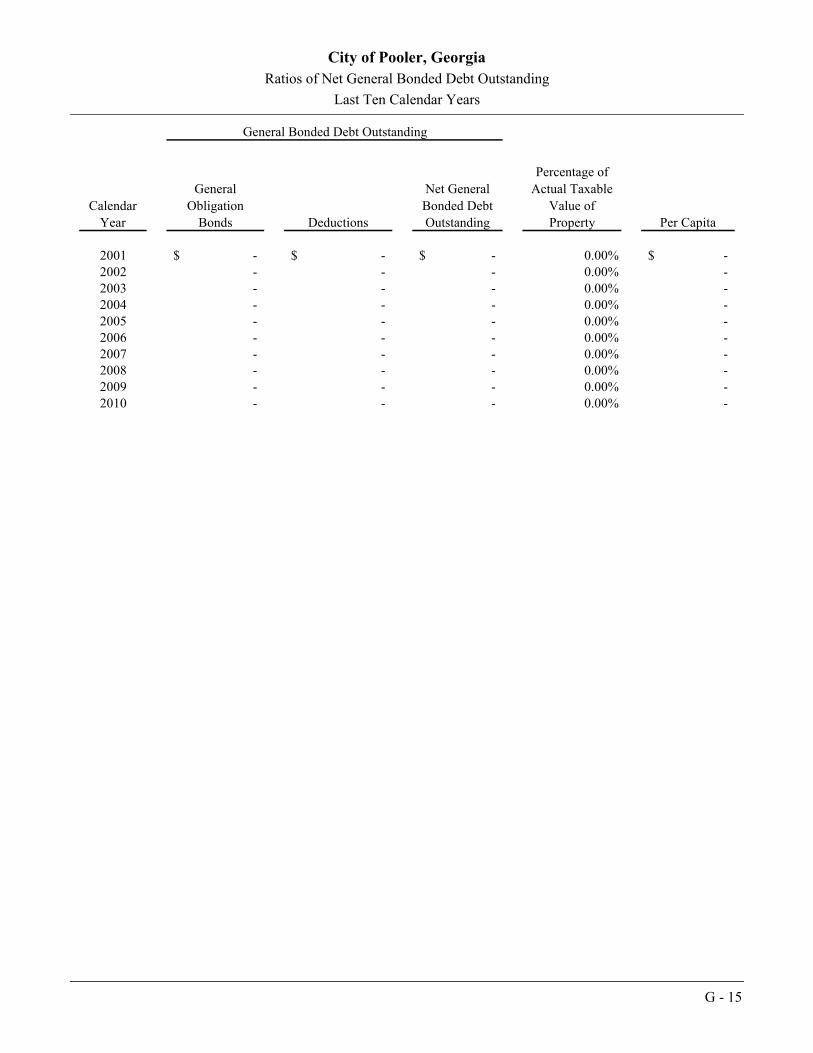
City of Pooler, Georgia
Ratios of Net General Bonded Debt Outstanding
Last Ten Calendar Years
G - 15
Calendar
Year
General
Obligation
Bonds Deductions
Net General
Bonded Debt
Outstanding
Percentage of
Actual Taxable
Value of
Property Per Capita
2001 -$ -$ -$ 0.00% -$ 2002 - - - 0.00% - 2003 - - - 0.00% - 2004 - - - 0.00% - 2005 - - - 0.00% - 2006 - - - 0.00% - 2007 - - - 0.00% - 2008 - - - 0.00% - 2009 - - - 0.00% - 2010 - - - 0.00% -
General Bonded Debt Outstanding
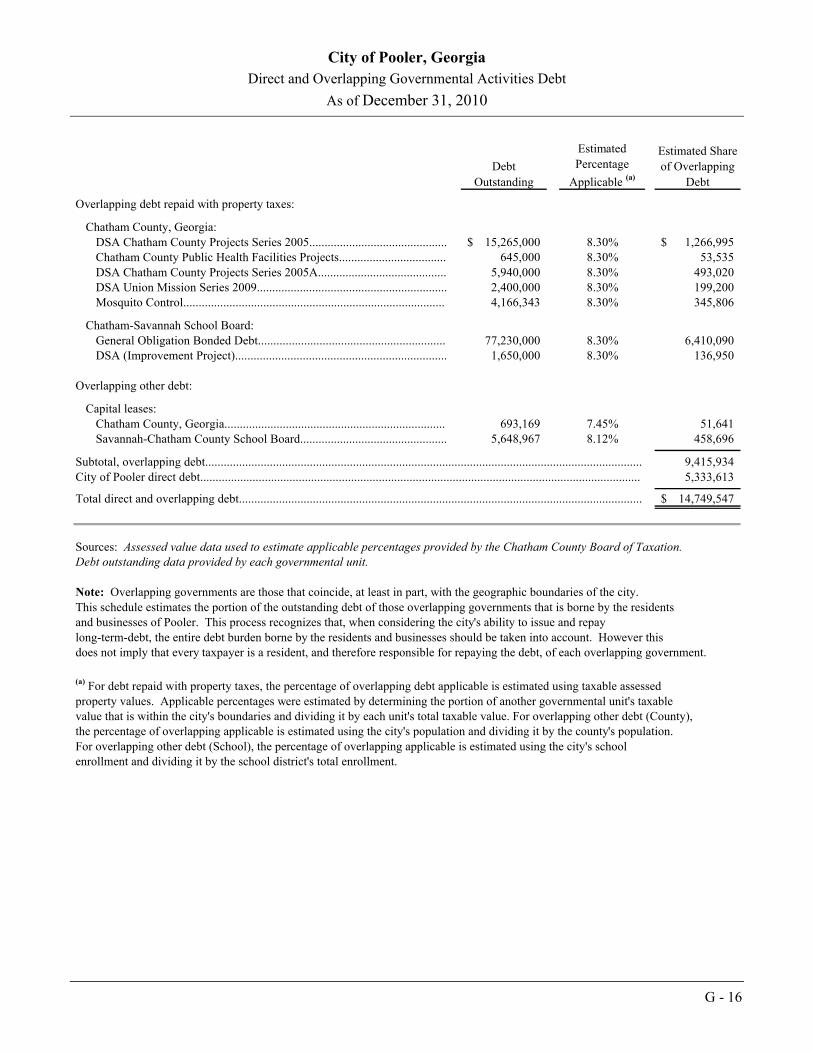
City of Pooler, Georgia
Direct and Overlapping Governmental Activities Debt
As of December 31, 2010
G - 16
Debt
Outstanding
Estimated
Percentage
Applicable (a)
Estimated Share
of Overlapping
Debt
Overlapping debt repaid with property taxes:
Chatham County, Georgia:DSA Chatham County Projects Series 2005............................................. 15,265,000$ 8.30% 1,266,995$ Chatham County Public Health Facilities Projects................................... 645,000 8.30% 53,535 DSA Chatham County Projects Series 2005A.......................................... 5,940,000 8.30% 493,020 DSA Union Mission Series 2009.............................................................. 2,400,000 8.30% 199,200 Mosquito Control..................................................................................... 4,166,343 8.30% 345,806
Chatham-Savannah School Board:General Obligation Bonded Debt............................................................. 77,230,000 8.30% 6,410,090 DSA (Improvement Project)..................................................................... 1,650,000 8.30% 136,950
Overlapping other debt:
Capital leases:Chatham County, Georgia........................................................................ 693,169 7.45% 51,641 Savannah-Chatham County School Board................................................ 5,648,967 8.12% 458,696
9,415,934 5,333,613
14,749,547$
Sources: Assessed value data used to estimate applicable percentages provided by the Chatham County Board of Taxation.Debt outstanding data provided by each governmental unit.
Note: Overlapping governments are those that coincide, at least in part, with the geographic boundaries of the city. This schedule estimates the portion of the outstanding debt of those overlapping governments that is borne by the residentsand businesses of Pooler. This process recognizes that, when considering the city's ability to issue and repaylong-term-debt, the entire debt burden borne by the residents and businesses should be taken into account. However thisdoes not imply that every taxpayer is a resident, and therefore responsible for repaying the debt, of each overlapping government.
(a) For debt repaid with property taxes, the percentage of overlapping debt applicable is estimated using taxable assessedproperty values. Applicable percentages were estimated by determining the portion of another governmental unit's taxablevalue that is within the city's boundaries and dividing it by each unit's total taxable value. For overlapping other debt (County),the percentage of overlapping applicable is estimated using the city's population and dividing it by the county's population.For overlapping other debt (School), the percentage of overlapping applicable is estimated using the city's schoolenrollment and dividing it by the school district's total enrollment.
Subtotal, overlapping debt..............................................................................................................................................City of Pooler direct debt...............................................................................................................................................
Total direct and overlapping debt...................................................................................................................................
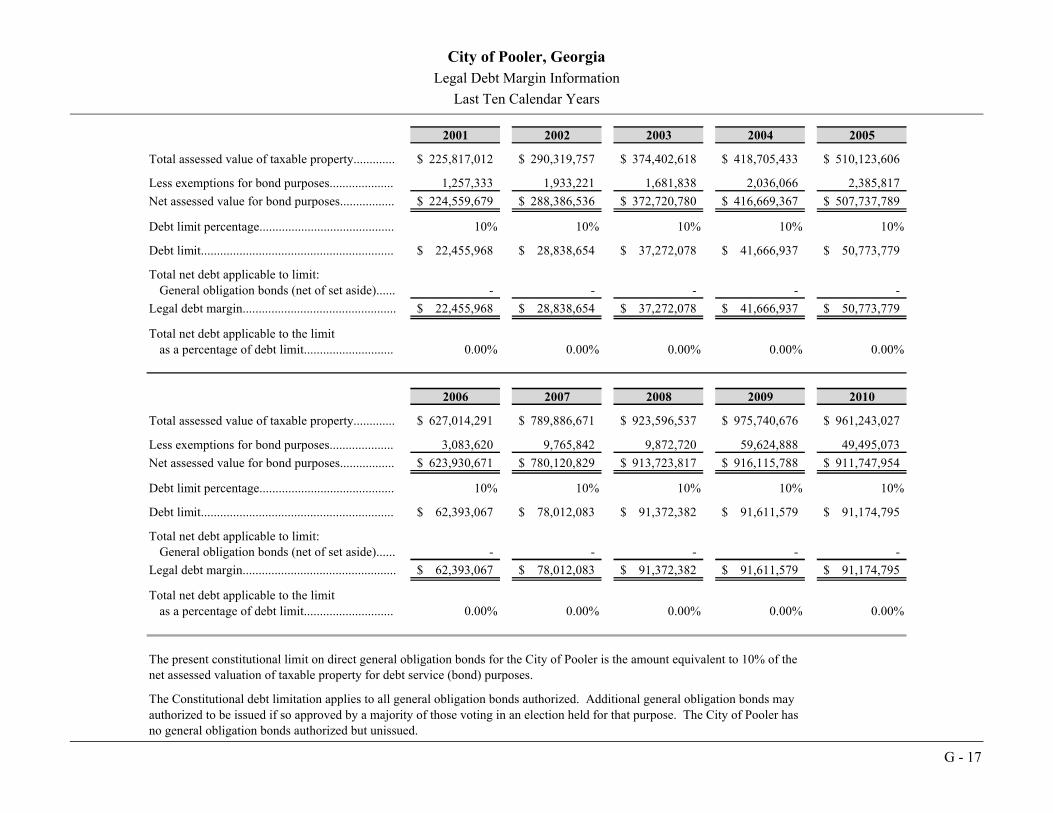
City of Pooler, Georgia
Legal Debt Margin Information
Last Ten Calendar Years
G - 17
2001 2002 2003 2004 2005
Total assessed value of taxable property............. 225,817,012$ 290,319,757$ 374,402,618$ 418,705,433$ 510,123,606$
Less exemptions for bond purposes.................... 1,257,333 1,933,221 1,681,838 2,036,066 2,385,817
Net assessed value for bond purposes................. 224,559,679$ 288,386,536$ 372,720,780$ 416,669,367$ 507,737,789$
Debt limit percentage.......................................... 10% 10% 10% 10% 10%
Debt limit............................................................ 22,455,968$ 28,838,654$ 37,272,078$ 41,666,937$ 50,773,779$
Total net debt applicable to limit:General obligation bonds (net of set aside)...... - - - - -
Legal debt margin................................................ 22,455,968$ 28,838,654$ 37,272,078$ 41,666,937$ 50,773,779$
Total net debt applicable to the limitas a percentage of debt limit............................ 0.00% 0.00% 0.00% 0.00% 0.00%
2006 2007 2008 2009 2010
Total assessed value of taxable property............. 627,014,291$ 789,886,671$ 923,596,537$ 975,740,676$ 961,243,027$
Less exemptions for bond purposes.................... 3,083,620 9,765,842 9,872,720 59,624,888 49,495,073
Net assessed value for bond purposes................. 623,930,671$ 780,120,829$ 913,723,817$ 916,115,788$ 911,747,954$
Debt limit percentage.......................................... 10% 10% 10% 10% 10%
Debt limit............................................................ 62,393,067$ 78,012,083$ 91,372,382$ 91,611,579$ 91,174,795$
Total net debt applicable to limit:General obligation bonds (net of set aside)...... - - - - -
Legal debt margin................................................ 62,393,067$ 78,012,083$ 91,372,382$ 91,611,579$ 91,174,795$
Total net debt applicable to the limitas a percentage of debt limit............................ 0.00% 0.00% 0.00% 0.00% 0.00%
The present constitutional limit on direct general obligation bonds for the City of Pooler is the amount equivalent to 10% of thenet assessed valuation of taxable property for debt service (bond) purposes.
The Constitutional debt limitation applies to all general obligation bonds authorized. Additional general obligation bonds mayauthorized to be issued if so approved by a majority of those voting in an election held for that purpose. The City of Pooler hasno general obligation bonds authorized but unissued.
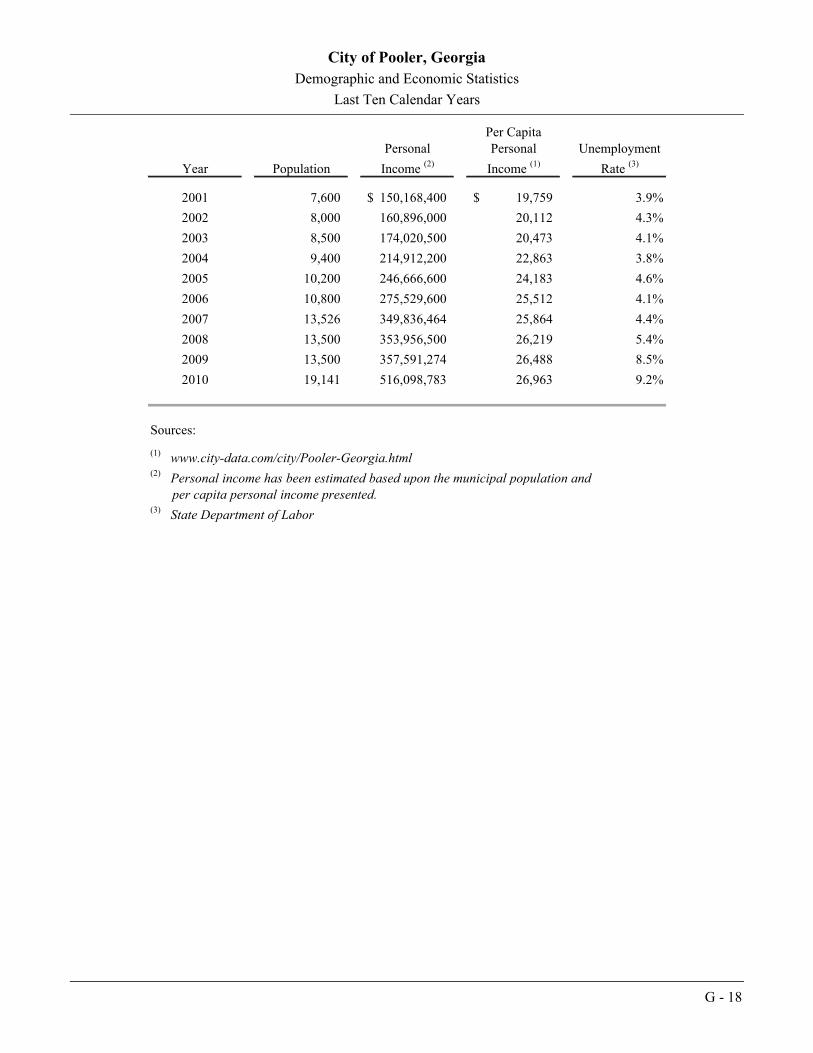
City of Pooler, Georgia
Demographic and Economic Statistics
Last Ten Calendar Years
G - 18
Per CapitaPersonal Personal Unemployment
Year Population Income (2) Income (1) Rate (3)
2001 7,600 150,168,400$ 19,759$ 3.9%
2002 8,000 160,896,000 20,112 4.3%
2003 8,500 174,020,500 20,473 4.1%
2004 9,400 214,912,200 22,863 3.8%
2005 10,200 246,666,600 24,183 4.6%
2006 10,800 275,529,600 25,512 4.1%
2007 13,526 349,836,464 25,864 4.4%
2008 13,500 353,956,500 26,219 5.4%
2009 13,500 357,591,274 26,488 8.5%
2010 19,141 516,098,783 26,963 9.2%
Sources:
(1) www.city-data.com/city/Pooler-Georgia.html(2) Personal income has been estimated based upon the municipal population and
per capita personal income presented.(3) State Department of Labor
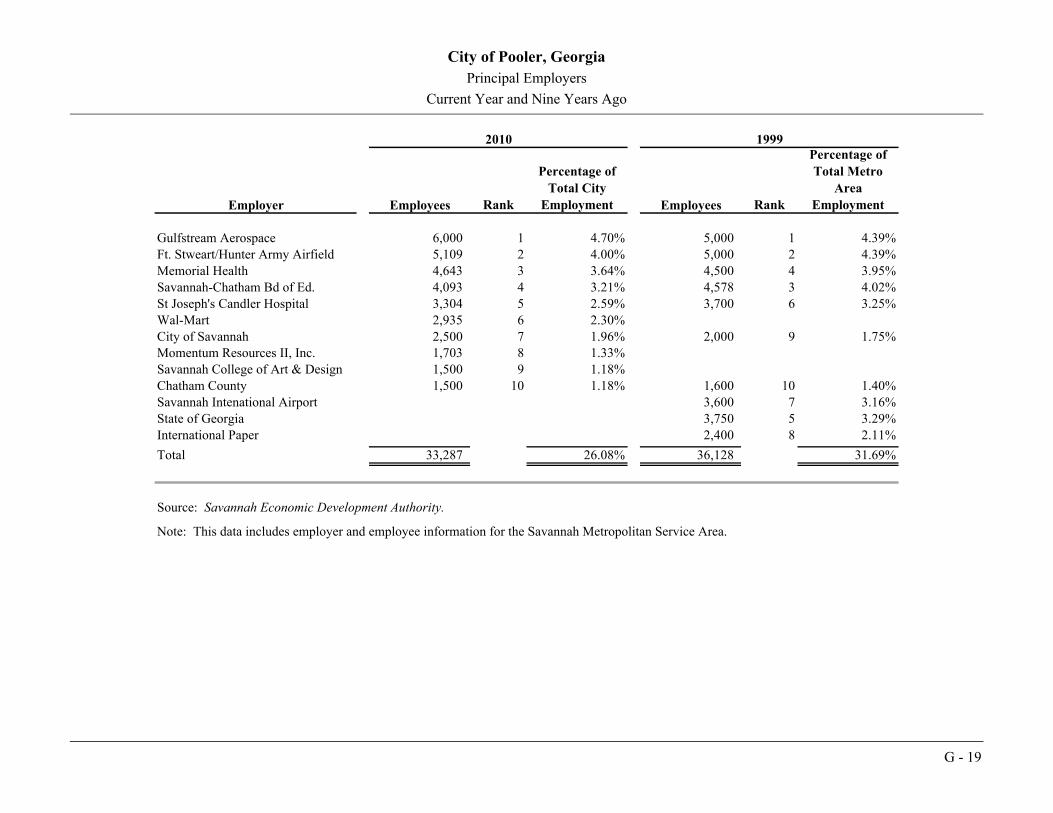
City of Pooler, Georgia
Principal Employers
Current Year and Nine Years Ago
G - 19
Employer Employees Rank
Percentage of
Total City
Employment Employees Rank
Percentage of
Total Metro
Area
Employment
Gulfstream Aerospace 6,000 1 4.70% 5,000 1 4.39%Ft. Stweart/Hunter Army Airfield 5,109 2 4.00% 5,000 2 4.39%Memorial Health 4,643 3 3.64% 4,500 4 3.95%Savannah-Chatham Bd of Ed. 4,093 4 3.21% 4,578 3 4.02%St Joseph's Candler Hospital 3,304 5 2.59% 3,700 6 3.25%Wal-Mart 2,935 6 2.30%City of Savannah 2,500 7 1.96% 2,000 9 1.75%Momentum Resources II, Inc. 1,703 8 1.33%Savannah College of Art & Design 1,500 9 1.18%Chatham County 1,500 10 1.18% 1,600 10 1.40%Savannah Intenational Airport 3,600 7 3.16%State of Georgia 3,750 5 3.29%International Paper 2,400 8 2.11%
Total 33,287 26.08% 36,128 31.69%
Source: Savannah Economic Development Authority.
Note: This data includes employer and employee information for the Savannah Metropolitan Service Area.
2010 1999

City of Pooler, Georgia
Full Time City Employees by Function/Program
Last Ten Calendar Years
G - 20
2001 2002 2003 2004 2005
Function/Program
General government.............................. 10 13 14 14 14
Public safety.......................................... 32 35 38 42 45
Public works......................................... 25 26 30 29 29
Culture and recreation........................... 6 6 6 6 5
Water and sewer services...................... 12 15 17 18 19
Total......................................................... 85 95 105 109 112
2006 2007 2008 2009 2010
Function/Program
General government.............................. 16 19 13 10 10
Public safety.......................................... 51 54 55 63 69
Public works......................................... 32 39 40 35 28
Culture and recreation........................... 6 10 10 8 13
Water and sewer services...................... 19 19 23 26 19
Total......................................................... 124 141 141 142 139
Source: City Personnel Records

City of Pooler, Georgia
Operating Indicators by Function
Last Ten Calendar Years
G - 21
2001 2002 2003 2004 2005
Police:
Arrests................................................... 478 581 698 705 960
Fire:
Number of emergency calls................... 585 631 651 1,079 1,168
Inspections............................................ - - - - 13
Public works:
Street resurfacing (miles)...................... 3.330 0.229 3.665 2.105 2.086
Water:
New connections................................... unav unav 368 380 436
Average daily consumption(thousands of gallons)........................ 670,000 757,000 705,129 688,000 628,749
Sewer:
New connections................................... unav unav 368 380 436
Average daily sewage treatment(thousands of gallons)........................ 920,000 890,000 975,000 1,110,000 1,210,000
2006 2007 2008 2009 2010
Police:
Arrests................................................... 1,060 1,143 415 641 601
Fire:
Number of emergency calls................... 1,547 1,754 1,843 2,002 2,241
Inspections............................................ 166 256 - b 213 724
Public works:
Street resurfacing (miles)...................... 1.193 1.000 1.820 0.700 -
Water:
New connections................................... 778 701 362 243 262
Average daily consumption(thousands of gallons)........................ 676,390 1,755,345 a 1,951,355 2,117,587 2,058,684
Sewer:
New connections................................... 778 676 361 243 262
Average daily sewage treatment(thousands of gallons)........................ 1,300,000 1,700,000 1,750,000 1,750,000 1,617,000
Sources: City records
unav - This information is not available.
a Began including water purchased from the City of Savannah in 2007.
b In 2008 management used a contractor to preform inspections.

City of Pooler, Georgia
Capital Asset Statistics by Function
Last Ten Calendar Years
G - 22
2001 2002 2003 2004 2005Police:
Stations................................................. 1 1 1 1 1
Fire:
Fire stations........................................... 1 1 1 2 2
Public works:
Streets (miles)....................................... unav unav unav unav 55.7
Traffic signals....................................... - 2 2 2 2
Parks and recreation:
Parks..................................................... 1 1 1 1 1
Community centers............................... 1 1 1 1 1
Water:
Maximum daily capacity(thousands of gallons)........................ 1,020,000 998,000 1,010,000 1,092,000 1,100,000
Wastewater:
Maximum daily treatment capacity(thousands of gallons)........................ 980,000 998,000 998,000 2,500,000 2,500,000
2006 2007 2008 2009 2010
Police:
Stations................................................. 1 1 1 1 1
Fire:
Fire stations........................................... 2 2 2 2 2
Public works:
Streets (miles)....................................... 71.6 80 80 81 87
Traffic signals....................................... 3 3 3 5 7
Parks and recreation:
Parks..................................................... 1 2 5 5 5
Community centers............................... 1 1 1 1 1
Water:
Maximum daily capacity
(thousands of gallons)........................ 1,114,000 3,960,000 a 3,900,000 3,900,000 3,697,000
Wastewater:
Maximum daily treatment capacity(thousands of gallons)........................ 2,500,000 3,000,000 2,500,000 2,500,000 2,500,000
Sources: City records and Georgia Department of Transportation, Office of Transportation
unav - This information is not available.
a Began including water purchased from the City of Savannah in 2007.


COMPLIANCE SECTION


KARP, RONNING & TINDOLCERTIFIED PUBLIC ACCOUNTANTS
H - 16600 ABERCORN STREET • SUITE 200 SAVANNAH, GEORGIA 31405
P.O. BOX 16149 SAVANNAH, GEORGIA 31416
912-232-0475 TEL 912-232-0478 FAX www.krtcpa.com
REPORT ON INTERNAL CONTROL OVER FINANCIAL REPORTING AND ON COMPLIANCE AND OTHER MATTERS BASED ON AN AUDIT OF FINANCIAL
STATEMENTS PERFORMED IN ACCORDANCE WITH GOVERNMENT AUDITING STANDARDS
Honorable Mayor and Members of the City CouncilCity of Pooler, Georgia
We have audited the financial statements of the governmental activities, the business-type activities, the discretely presented component unit, each major fund, and the remaining fund information of the City of Pooler, Georgia (City), as of and for the year ended December 31, 2010, which collectively comprise the City’s basic financial statements and have issued our report thereon dated April 15, 2011. We conducted our audit in accordance with auditing standards generally accepted in the United States of America and the standards applicable to financial audits contained in Government Auditing Standards, issued by the Comptroller General of the United States.
Internal Control Over Financial Reporting
In planning and performing our audit, we considered the City’s internal control over financial reporting as a basis for designing our auditing procedures for the purpose of expressing our opinion on the financial statements, but not for the purpose of expressing an opinion on the effectiveness of the City’s internal control over financial reporting. Accordingly, we do not express an opinion on the effectiveness of the City’s internal control over financial reporting.
A deficiency in internal control exists when the design or operation of a control does not allow management or employees, in the normal course of performing their assigned functions, to prevent, or detect and correct misstatements on a timely basis. A material weakness is a deficiency, or combination of deficiencies, in internal control, such that there is a reasonable possibility that a material misstatement of the City’s financial statements will not be prevented, or detected and corrected on a timely basis.
Our consideration of internal control over financial reporting was for the limited purpose described in the first paragraph of this section and was not designed to identify all deficiencies in internal control over financial reporting that might be deficiencies, significant deficiencies or material weaknesses. We did not identify any deficiencies in internal control over financial reporting that we consider to be material weaknesses, as defined above.
Compliance and Other Matters
As part of obtaining reasonable assurance about whether the City’s financial statements are free of material misstatement, we performed tests of its compliance with certain provisions of laws, regulations, contracts, and grant agreements, noncompliance with which could have a direct and material effect on the determination of financial statement amounts. However, providing an opinion on compliance with those provisions was not an objective of our audit, and accordingly, we do not express such an opinion. The results of our tests disclosed no instances of noncompliance or other matters that are required to be reported under Government Auditing Standards.

H - 26600 ABERCORN STREET • SUITE 200 SAVANNAH, GEORGIA 31405
P.O. BOX 16149 SAVANNAH, GEORGIA 31416
912-232-0475 TEL 912-232-0478 FAX www.krtcpa.com
We noted certain matters that we reported to management of the City in a separate letter dated April 15, 2011.
This report is intended solely for the information and use of management and City Council and is not intended to be and should not be used by anyone other than these specified parties.
April 15, 2011