composite index of market access for the export of rice ... · trade barriers for us rice exports 8...
TRANSCRIPT
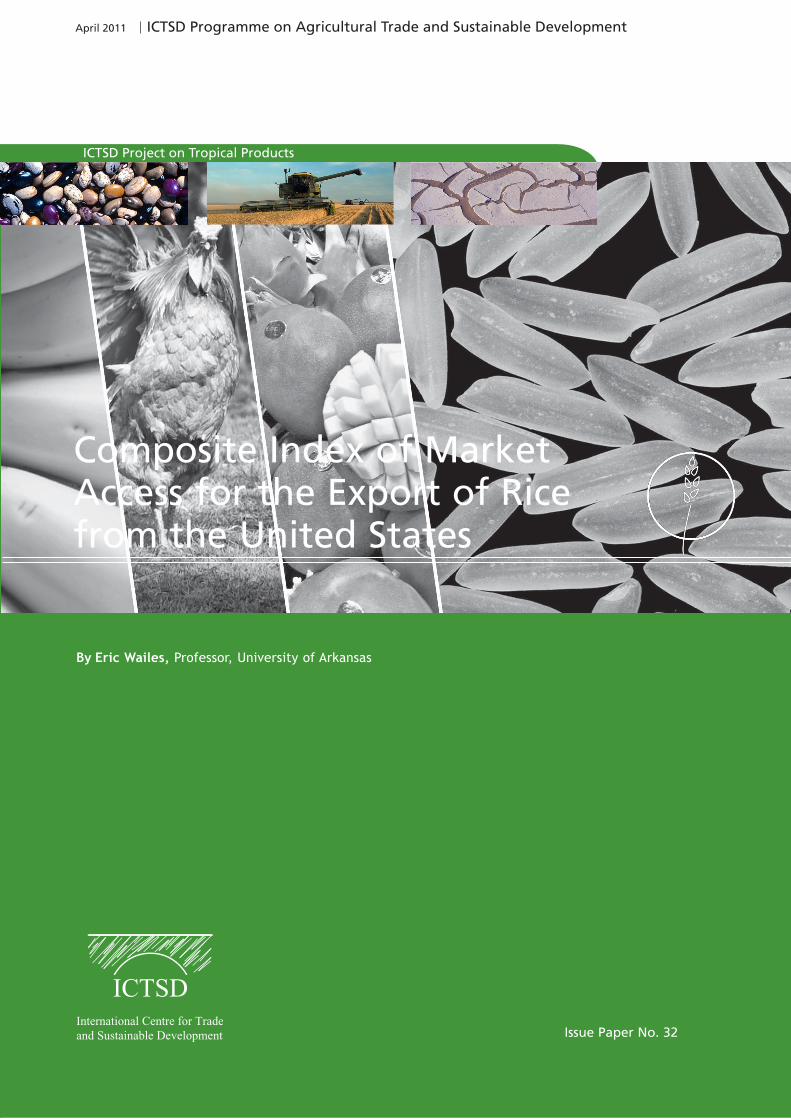
By Eric Wailes, Professor, University of Arkansas
Issue Paper No. 32
ICTSD Programme on Agricultural Trade and Sustainable Development
Composite Index of Market Access for the Export of Rice from the United States
ICTSD Project on Tropical Products
April 2011

l ICTSD Programme on Agricultural Trade and Sustainable Development
By Eric Wailes, Professor, University of Arkansas
Composite Index of Market Access for the Export of Rice from the United States
Issue Paper No. 32
April 2011

ii E. Wailes - Composite Index of Market Access for the Export of Rice from the United States
Published by
International Centre for Trade and Sustainable Development (ICTSD)International Environment House 27 Chemin de Balexert, 1219 Geneva, SwitzerlandTel: +41 22 917 8492 Fax: +41 22 917 8093E-mail: [email protected] Internet: www.ictsd.org
Chief Executive: Ricardo Meléndez-Ortiz Programmes Director: Christophe Bellmann Programme Officers: Jonathan Hepburn, Marie Chamay and Ammad Bahalim
Acknowledgments
This paper has been produced under the ICTSD Programme on Agricultural Trade and Sustainable Development. The activities of this programme have benefited from support from the UK Department for International Development (DFID), the Dutch Ministry of Foreign Affairs (DGIS).
ICTSD acknowledges all comments provided by developed and developing country negotiators and policy-makers, academic experts, staff of intergovernmental and non-governmental organisations and other participants in a series of ICTSD multi-stakeholder dialogues which contributed to this research.
For more information about ICTSD’s Programme on Agricultural Trade and Sustainable Development, visit our website at http://ictsd.org/programmes/agriculture/
ICTSD welcomes feedback and comments on this document. These can be forwarded to Ammad Bahalim at abahalim [at] ictsd.ch
Citation: Eric Wailes (2011). Composite Index of Market Access for the export of rice from the United States, ICTSD Programme on Agricultural Trade and Sustainable Development, International Centre for Trade and Sustainable Development, Geneva, Switzerland.
Copyright ICTSD, 2011. Readers are encouraged to quote and reproduce this material for educational, non-profit purposes, provided the source is acknowledged.
This work is licensed under the Creative Commons Attribution-Noncommercial-No-Derivative Works 3.0 License. To view a copy of this license, visit http://creativecommons.org/licenses/by-nc-nd/3.0/ or send a letter to Creative Commons, 171 Second Street, Suite 300, San Francisco, California, 94105, USA.
The views expressed in this publication are those of the author(s) and do not necessarily reflect the views of ICTSD or the funding institutions.
ISSN 1817 356X
iiiICTSD Programme on Agricultural Trade and Sustainable Development
TABLE OF CONTENTS
LIST OF ABBREVIATIONS AND ACRONYMS iv
LIST OF TABLES AND FIGURES v
FOREWORD vii
EXECUTIVE SUMMARY vii
1. CONTEXT AND ISSUE 1 1.1 Measurement Units 1
1.2 Degree of Processing 1
1.3 Period of Study 1
1.4 Data Sources 1
2. US RICE SECTOR 3 2.1. Structure of the Rice Industry 3
2.2. Exports Relative to US Rice Supply and Utilization 6
2.3. Trade Barriers for US Rice Exports 8
3. PRICE LEVELS 11 3.1. Farm Prices 11
3.2. Processor Prices 11
3.3. Exporter Prices 11
4. COSTS 12 4.1. Costs of Farm Production 12
4.2. Inspection and Grading Service Fees 12
4.3. Drying and Storage Costs 12
4.4. Transportation Costs 12
4.5. Processing Costs 12
5. SUBSIDIES AND TAXES 13 5.1. Subsidies and Taxes in the US 13
5.2. Taxes and Trade Barriers in Importing Countries 13
6. PRICE LADDERS AND CALCULATION OF CIMA 15
7. SUMMARY 16
ENDNOTES 20
REFERENCES 21
iv E. Wailes - Composite Index of Market Access for the Export of Rice from the United States
LIST OF ABBREVIATIONS AND ACRONYMS
AGI Adjusted Gross Income
ARMS Agricultural Resource Management Survey
CIF Cost, insurance and freight
CIMA Composite Index of Market Access
ERS Economic Research Service, USDA
EU European Union
FAS Foreign Agricultural Service, USDA
FOB Free on board
GATS Global Agricultural Trade System, FAS, USDA
GM Genetically modified
GMO Genetically modified organism
HS Harmonized System Classification
ICTSD International Centre for Trade and Sustainable Development
NAFTA North American Free Trade Agreement
OECD Organization for Economic Cooperation and Development
UN United Nations
USDA United States Department of Agriculture
WTO World Trade Organization

vICTSD Programme on Agricultural Trade and Sustainable Development
LIST OF TABLES AND FIGURES
Table 1. US farm costs and returns per planted hectare, 2006-2008
Table 2. Total supply and distribution of US rice (million cwt rough equiv)
Table 3. Producer Subsidy Equivalent of US rice, 2006-2008
Table 4. US farm prices
Figure 1. US rice industry product flow
Figure 2. US rice harvested area, 2007
Figure 3. US rice processing functions and product flow
Figure 4. US export share by market by value, ave. 2006-2008
Figure 5. US export share by market by quantity, ave. 2006-2008
Figure 6. US export value by classification of rice type, ave. 2006-2008
Figure 7. US export quantity by classification of rice type, ave. 2006-2008

vi E. Wailes - Composite Index of Market Access for the Export of Rice from the United States
Trade barriers are often opaque and difficult to compare. All too often, an exporter faces costs well in excess of a simple tariff when seeking entry to a market. The principles underlying the WTO’s July 2004 Framework Agreement, the 2001 Doha Declaration and the Agreement on Agriculture commit Members to reducing barriers to their markets and lowering their tariffs. However, to date, there exist few tools to measure the changes in market access that will take place at the conclusion of the Doha Round, or those that may result from any other trade agreement. The Composite Index of Market Access (CIMA) has been conceived as a tool to help trade policy-makers and other stakeholders to address this challenge.
As part of a work programme that resulted from a dialogue organized with the Institute for International Trade Negotiations in Salvador de Bahia, Brazil, ICTSD commissioned a methodology paper by Prof. Timothy Josling as well as pilot country studies by other experts. The methodology and country studies have been reviewed by government officials, academics, and civil society at two meetings Washington DC. An Advisory Panel has helped refine the CIMA methodology and recommended a list of products and markets to study as part of a set of pilot studies. This study is the first in the series of pilot studies.
The World Bank and IMF have developed a number of indices aimed at measuring trade restrictiveness, as a result of work they conducted to understand the impact of structural adjustment programmes on recipient countries’ policies. Additionally, the OECD’s Producer Support Estimate (PSE) provides a methodologically consistent means of comparing the level of domestic support on agriculture amongst its members. These tools, though useful for their intended purpose, fail to address the needs of developing country exporters trying to assess the costs they face in entering a given market. CIMA is intended to provide a clear and concise tool for this purpose.
The CIMA project is not intended to provide a comparison of the barriers faced by different tropical products. Rather, the project is meant to illustrate the actual costs faced by exporters of selected tropical products when trying to penetrate markets. While liberalisation through tariff reduction may partially achieve the aim of facilitating access for tropical products, the CIMA project highlights the fact that tariff reductions are only a part of the puzzle that trade policy has to solve.
The findings of the CIMA project can be used in many ways, including ensuring a more rational management of actual barriers to access, and hence, enhancing developing country opportunities to trade. It can also be useful in negotiations for further liberalization. Using the CIMA approach would help shift the focus from the number and complexity of support measures, as well as standards, to a uniform and comparable index so that negotiators may conclude more transparent and equitable trade agreements in the future. We hope this study, and the CIMA initiative, is of import to the reader and of help to the policy-maker.
FOREWORD
Ricardo Meléndez-Ortiz Chief Executive, ICTSD

viiICTSD Programme on Agricultural Trade and Sustainable Development
The Composite Index of Market Access (CIMA) is based on measuring the types of distortions imposed on a value chain as it is produced, exported and consumed in international trade. The index is built on the basis of accounting for prices and costs through the value chain and identification of distortions in prices and costs and non-price and non-costs factors that create market access barriers that prevent free trade.
The CIMA concept is applied to US rice exports to four major rice importers—Mexico, the EU, Turkey and Japan. These importers were chosen to capture differential effects associated with the wide variety of rice products exported from the US. Another consideration was the difference that the US enjoys among these countries in terms of commercial relations.
Section 1 provides the context and issue of implementing the study. Issues of measurement, differentiation of rice products in trade, the period of study and data sources are discussed.
Section 2 gives a general overview of the structure of the US rice industry. Production and processing is concentrated in six states. While rice is not one of the major crops produced in the United States, it is very important in the six states where it is produced, processed and exported. The US rice industry is trade dependent with nearly 50% of the production exported. The US is unique among major rice exporters as it supplies rice in all the differentiated forms that are demanded by international markets, including long-grain and medium-grain, white milled, brown, and paddy, and high quality and low quality in terms of percent broken.
Section 3 provides a discussion of the elements of the US rice price ladder including farm, processor and exporter levels. Section 4 gives an elaboration on the cost structure from the farm level to transportation and processing.
Section 5 discusses the distortions in the US rice sector and those it faces from export destinations. The primary distortions of the four importing countries are discussed, which provides an understanding of the estimated price ladders generated for each of these importers.
Section 6 briefly reviews the concept of the price ladder and calculation of the CIMA estimates.
Section 7 concludes with a summary of the major finding of this case study.
EXECUTIVE SUMMARY
1 E. Wailes - Composite Index of Market Access for the Export of Rice from the United States
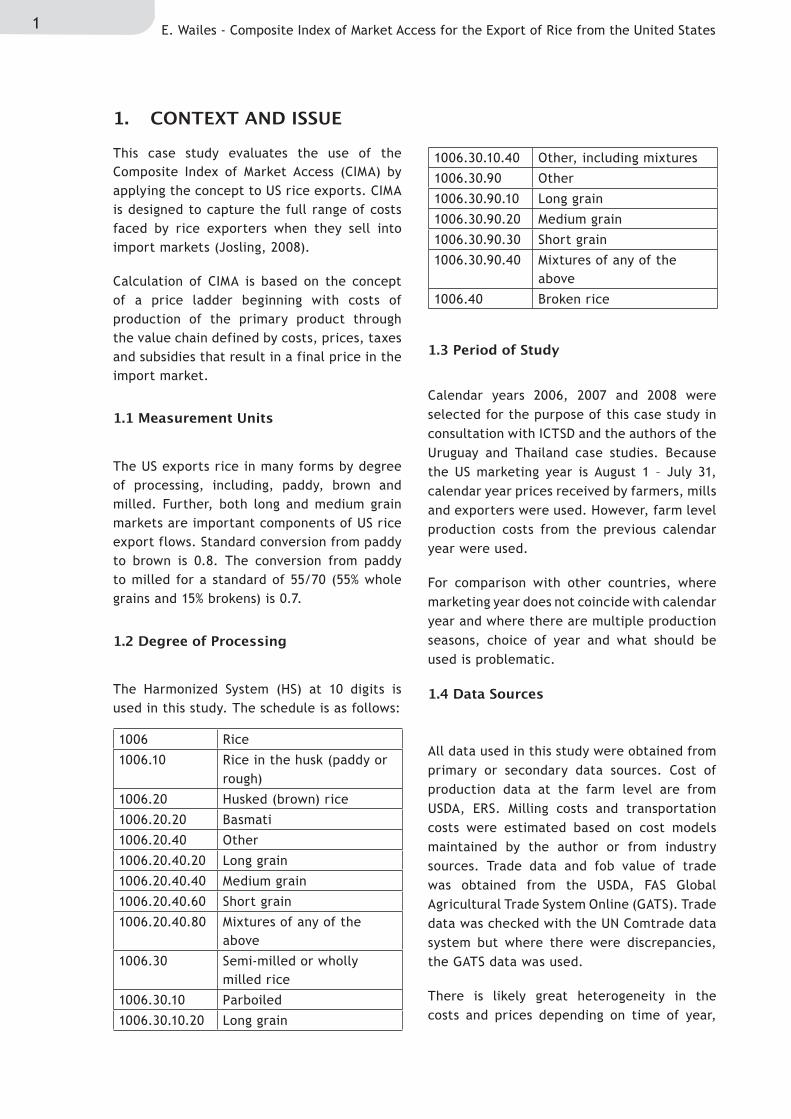
This case study evaluates the use of the Composite Index of Market Access (CIMA) by applying the concept to US rice exports. CIMA is designed to capture the full range of costs faced by rice exporters when they sell into import markets (Josling, 2008).
Calculation of CIMA is based on the concept of a price ladder beginning with costs of production of the primary product through the value chain defined by costs, prices, taxes and subsidies that result in a final price in the import market.
The US exports rice in many forms by degree of processing, including, paddy, brown and milled. Further, both long and medium grain markets are important components of US rice export flows. Standard conversion from paddy to brown is 0.8. The conversion from paddy to milled for a standard of 55/70 (55% whole grains and 15% brokens) is 0.7.
The Harmonized System (HS) at 10 digits is used in this study. The schedule is as follows:
Calendar years 2006, 2007 and 2008 were selected for the purpose of this case study in consultation with ICTSD and the authors of the Uruguay and Thailand case studies. Because the US marketing year is August 1 – July 31, calendar year prices received by farmers, mills and exporters were used. However, farm level production costs from the previous calendar year were used.
For comparison with other countries, where marketing year does not coincide with calendar year and where there are multiple production seasons, choice of year and what should be used is problematic.
All data used in this study were obtained from primary or secondary data sources. Cost of production data at the farm level are from USDA, ERS. Milling costs and transportation costs were estimated based on cost models maintained by the author or from industry sources. Trade data and fob value of trade was obtained from the USDA, FAS Global Agricultural Trade System Online (GATS). Trade data was checked with the UN Comtrade data system but where there were discrepancies, the GATS data was used.
There is likely great heterogeneity in the costs and prices depending on time of year,
1. CONTEXT AND ISSUE
1.1 Measurement Units
1.2 Degree of Processing
1.3 Period of Study
1.4 Data Sources
1006 Rice
1006.10 Rice in the husk (paddy or rough)
1006.20 Husked (brown) rice
1006.20.20 Basmati
1006.20.40 Other
1006.20.40.20 Long grain
1006.20.40.40 Medium grain
1006.20.40.60 Short grain
1006.20.40.80 Mixtures of any of the above
1006.30 Semi-milled or wholly milled rice
1006.30.10 Parboiled
1006.30.10.20 Long grain
1006.30.10.40 Other, including mixtures
1006.30.90 Other
1006.30.90.10 Long grain
1006.30.90.20 Medium grain
1006.30.90.30 Short grain
1006.30.90.40 Mixtures of any of the above
1006.40 Broken rice

2ICTSD Programme on Agricultural Trade and Sustainable Development
location within country, by size of firm, etc. For this case study, complexity in determining transportation costs was an issue, for example freight rates are rather different to same destination locations depending on port location, e.g. Gulf ports and California. Fortunately, export shipment data was available by customs district, which made this less problematic but could contribute to sources of inaccuracy if ignored.
Further, the choice of years for this study is problematic since in the 2007 and 2008 calendar years, the global rice market experienced significant price volatility and trade flows were distorted even more than usual for some key export competitors with the United States, including India, Vietnam and Thailand as those countries imposed export controls of various kinds to stabilize their domestic rice prices (Dawe, 2010).

3 E. Wailes - Composite Index of Market Access for the Export of Rice from the United States
2. US RICE SECTOR
The US rice marketing system can be under-stood with the use of the following graphics which show the key product flows and actors in the production, processing and utilization of US rice.
According to the 2007 US Census of Agriculture, there were 6,085 rice farms with total farm rice sales of USD 2.02 billion or an average per farm of USD 332 thousand. There were 24% less rice farms in 2007 than reported in the 2002 Census following the general trend in the US of larger and fewer farms. Over the 2006 to 2008 years, an average of 1.159 million hectares
were planted and 1.153 million hectares were harvested.
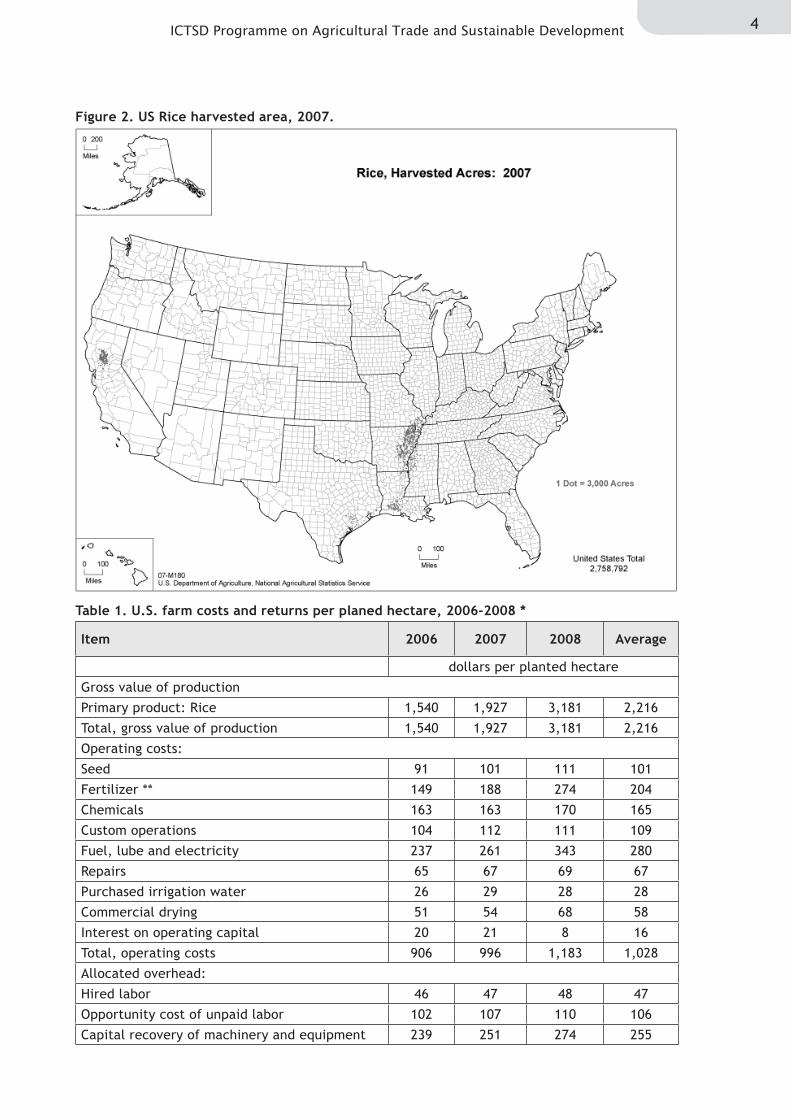
Production is concentrated in sub-regions within six states including Arkansas, Cali-fornia, Louisiana, Mississippi, Missouri, and Texas (Figure 2). US rice is produced on lowland, flood-irrigated production systems. In the Mid-South states of Arkansas, Missouri, Mississippi, Louisiana, and Texas both long-grain rice and medium grain rice are produced. California produces primarily medium grain rice. The production is highly costly (Table 1). Costs varied from USD 1683 to 2070 over the 2006-08 period. Net returns varied from USD -143 to 1,111.
2.1 Structure of the Rice Industry
Figure 1. US rice industry product flow.
Grain Rice Grain Rice
DRIERON-FARM STORAGE
COMMERCIAL STORAGE
Rough Rice
Rough Rice
Rough Rice
Rough Rice Brown Parboiled White Brokens Other ProcessedProducts
Rice Mill
InternationalMarket
InternationalMarket
DomesticMarket
InternationalMarket
DomesticMarket
InternationalMarket
DomesticMarket
InternationalMarket
DomesticMarket
InternationalMarket
DomesticMarket
4ICTSD Programme on Agricultural Trade and Sustainable Development
Figure 2. US Rice harvested area, 2007.
Table 1. U.S. farm costs and returns per planed hectare, 2006-2008 *
Item 2006 2007 2008 Average
dollars per planted hectare
Gross value of production
Primary product: Rice 1,540 1,927 3,181 2,216
Total, gross value of production 1,540 1,927 3,181 2,216
Operating costs:
Seed 91 101 111 101
Fertilizer ** 149 188 274 204
Chemicals 163 163 170 165
Custom operations 104 112 111 109
Fuel, lube and electricity 237 261 343 280
Repairs 65 67 69 67
Purchased irrigation water 26 29 28 28
Commercial drying 51 54 68 58
Interest on operating capital 20 21 8 16
Total, operating costs 906 996 1,183 1,028
Allocated overhead:
Hired labor 46 47 48 47
Opportunity cost of unpaid labor 102 107 110 106
Capital recovery of machinery and equipment 239 251 274 255

5 E. Wailes - Composite Index of Market Access for the Export of Rice from the United States
Long grain production from the Mid-South states is consumed domestically but is also competitive in high quality export markets. The medium grain production from California has led to the growth of the domestic market but is particularly important in export markets into Northeast Asia.
Total US production averaged slightly more than 9 million metric tons (mmt) of rough rice or 6.3 mmt milled equivalent. Yields averaged 8.4 tons per hectare of rough or 5.9 tons milled equivalent. The farm level value of the crop averaged $2.7 billion. Once harvested, rice is dried and stored either in on-farm facilities or in commercial elevators until sent for milling to rice mills or exported as rough rice (Figure 2). One of the competitive advantages of US
rice is its ability to supply a wide range of rice products to world markets.
Milling capacity in the US ranged from eight to nine mmt over the 2006 to 2008 period. Capacity utilization of rice mills averaged 66 percent. Growth in rough rice exports has reduced demand for milling services, which has led to consolidation in the US milling industry over the past decade.
Several excellent descriptions of the US rice market structure are found in the literature including Wailes (2008), Childs and Livezey (2006), Livezey and Foreman (2004), Cramer et al. (2003), Chambers and Childs (2000), Childs and Burdett (2000), Setia et al. (1994), Smith et al. (1990).
* Developed from USDA Agriculture Resource Management Survey (ARMS) base year, 2006.** Commercial fertilizer and soil conditioners.Source: Adapted from USDA, Economic Research Service, Commodity Costs and Returns Data
Table 1. Continued
Item 2006 2007 2008 Average
dollars per planted hectare
Opportunity cost of land (rental rate) 292 318 345 319
General farm overhead 60 61 62 61
Total, allocated overhead 777 827 887 830
Total costs listed 1,683 1,823 2,070 1,858
Value of production less total costs listed -143 104 1,111 357
Value of production less operating costs 634 931 1,998 1,188
Supporting information:
Price (dollars per cwt at harvest) 8.62 10.26 17.88 12.25
Yield (cwt per planted hectare) 179 188 178 181
Enterprise size (planted hectares) * 207 207 207 207

6ICTSD Programme on Agricultural Trade and Sustainable Development
Figure 3. US Rice Processing Functions and Product Flow
Table 2. Total Supply and Distribution of US Rice (million cwt. Rough equivalent)
Source: Childs, N. and K. Baldwin. 2009. Rice Outlook. RCS-09j. Economic Research Service, US Department of Agriculture. October.
The United States is the fourth largest rice exporter with a global market share of 10%,
following Thailand (30%), Vietnam (15%), and India (16%). For the 2006 through 2008 marketing years, US rice exports averaged 49% of US production, making this sector trade dependent (Table 2).
2.2 Exports Relative to US Rice Supply and Utilization
Item 2005/06 2006/07 2007/08 2008/09
Beginning Stocks 37,7 43 39,3 29,4
Production 222,8 194,6 198,4 203,7
Imports 17,1 20,6 23,9 19,2
Total Supply 277,7 258,2 261,6 252,4
Domestic Use 119,9 128,1 127,4 128,4
Exports 114,8 90,8 104,7 93,6
Total Use 234,7 218,8 232,2 222
Ending Stocks 43,0 39,3 29,4 30,4
Exports/Production 51,5 46,7 52,8 45,9
Warm water soakUnder pressure
Steamed and dried
DriedRough Rice
CleanRough Rice
Co-Products:Hulls
Co-Products:Rice Bran
Stabilizing
ProcessedBran
Oil Extraction
Processing
Processing Precooked instantWhite or brown rice
Cooking, Enriching,Cooling & Drying
GrindingSifting
Rice FlourRice Meal
Enriching
RegularWhite Rice
Whole KernelMilled Rice
ParboiledMilled Rice
ParboiledBrown Rice
CookingCooling & Drying
Precooked or processedParboiled whole kernelbrown or milled rice
Brown Rice
Grinding Sifting
GrindingSifting
Rice FlourRice Meal
Rice FlourRice Meal
Co-Products:2nd HeadsScreenings Brewers
Cleaning
Shelling
Shelling
Milling
Milling
Packaging
Packaging
Packaging
Packaging
Packaging Packaging Packaging Packaging Packaging
Packaging
Packaging
Grading & Sorting

7 E. Wailes - Composite Index of Market Access for the Export of Rice from the United States
The US produces long, medium and short grain rice and export shares for the 2005/06 to 2008/09 marketing years for long and medium/short were 50% and 48%, respectively. US exports were sold in 160 countries. The major importers by value and quantity for the 2006-2008 period were Mexico, Japan, Haiti and Canada as shown in Figures 3 and 4. The US exports rice by various degrees of processing. Figures 5 and 6 show value and quantity shares for rough,
brown, milled, and broken rice exports for the 2006-2008 period. Milled rice exports accounted for 57% of rice exports of which 38% were long grain and 19% were medium/short. The US is the only major global exporter of rough (paddy) rice and it accounted for 31% of US export value. Brown medium/short grain exports and brown long grain accounted for 6% and 3%, respectively of total export value and brokens accounted for 2 percent.
Figure 4. US export share by market by value, average 2006-2008 years.
Figure 5. US export share by market by quantity, average 2006-2008 years.
Source: USDA, FAS, Global Agriculture Trade System (GATS).
Source: USDA, FAS, Global Agriculture Trade System (GATS).
Value
30%
16%
1%2%
3%
4%3%
3% 5% 5%
8%
9%
10%
Mexico
Japan
Haiti
Canada
Iraq
Saudi Arabia
Nicaragua
Costa Rica
European Union-27
Korea, South
Turkey
Taiwan
ROW
Quantity
30%
22%
1%1%
2%
4%
4%4% 3% 6%
7%
8%
8%
Mexico
Japan
Haiti
Canada
Iraq
Saudi Arabia
Nicaragua
Costa Rica
European Union-27
Korea, South
Turkey
Taiwan
ROW

8ICTSD Programme on Agricultural Trade and Sustainable Development
Figure 6. US rice export value by classification of rice type, average 2006-2008.
Figure 7. US rice export quantity by classification of rice type, average 2006-2008.
Source: USDA, FAS, Global Agriculture Trade System (GATS).
Source: USDA, FAS, Global Agriculture Trade System (GATS).
Rice exports by rice type in Figure 4 are given in milled equivalents. The shares are approximately the same as value shares, with somewhat higher quantity shares for rough rice and milled long grain and smaller shares for milled and brown medium/short grain exports.
The US rice industry views the primary constraint on global rice trade as one of limited market access. Trade barriers in rice importing countries are driven by policies that seek to protect producers, rice millers,
2.3 Trade Barriers for US Rice Exports.
Value
MilledLong, 38%
Broken, 2%
Rough, 31%
BrownMed/Shotr, 6%
Brown Long, 3%MilledMed/Shrt, 19%
Quantity
MilledLong, 39%
Broken, 3%
Rough, 34%
BrownMed/Shotr, 5%
Brown Long, 3%Milled
Med/Shrt, 15%

9 E. Wailes - Composite Index of Market Access for the Export of Rice from the United States
and consumers in importing countries to achieve self sufficiency, policies to promote multifunctional public good attributes, policies to insulate domestic markets from international market instabilities, and policies that respond to rent-seeking behavior of particular groups of individuals. Various forms of protection are used by rice importers including tariffs, tariff escalation, tariff rate quotas, state enterprise trading, science and non-science based sanitary/phytosanitary requirements, etc.
In order to offset the constraints on foreign market access and to provide for price and income stability, the US has maintained domestic price and income supports. For the period of 2006 to 2008, US rice policy and programs were guided by the Farm Security Act of 2002. This act provided US farmers with a coupled price support program which made payments only when market access constraints effectively depressed world rice prices to a level below a so-called “loan rate”. If the “announced world rice price” fell below the loan rate, then market deficiency payments were made to rice farmers, subject to payment limitations. In addition, a decoupled
income payment known as “direct payments”, based on historical area and yields, was made whether the rice producer produced rice or not, also subject to a payment limit. Finally, a partially decoupled income payment known as a counter-cyclical payment was made if the sum of the direct payment plus the larger of the average market price or loan rate, fell below a target price. For the years 2006 to 2008, prices received by farmers were high enough that no market loan deficiency payments were made nor were there counter-cyclical payments. The only subsidies received by rice producers was the decoupled direct payment for which they received USD 2.35 per cwt. based on historical area and yields.
Additional minor subsidies are provided for interest on rice placed under loan and for 50% catastrophic coverage of crop insurance to cover yield risks. Because US rice is irrigated and yield risks are relatively small compared to input and output price risks, most farmers do not use the crop insurance program. Table 3 shows that for the years 2006 to 2008 that the percent of producer subsidy for US rice producers was less than 1%.
Table 3. Producer Subsidy Equivalent of U.S. Rice, 2006-2008
Description Unit 2006 207 2008
I. Level of production 000 tons 8,827.00 8,999.36 9,239.77
II. Value of production (at farm gate) USDmn 1,938.22 2,539.52 3,422.16
III. Producer Single Commodity Transfers
USDmn 18.39 7.56 12.48
A. Support based on commodity output
USDmn 5.73 6.45 6.39
A1. Market Price Support USDmn 0.00 0.00 0.00
A2. Payments based on output Commodity loan interest
subsides
USDmn 5.73 6.45 6.39
B. Payments based on input use USDmn 0.00 0.00 0.00
B1. Variable input use USDmn 0.00 0.00 0.00
B2. Fixed capital formation USDmn 0.00 0.00 0.00
B3. On-farm services USDmn 0.00 0.00 0.00
C. Payments based on current A/An/R/I, production required, single commodity
USDmn 12.66 1.10 6.09
D. Payments based on non-current A/An/R/I, production required
Crop Insurance subsidy
USDmn 0.00 0.00 0.00

10ICTSD Programme on Agricultural Trade and Sustainable Development
The US Rice industry faces a wide variety of trade barriers given the large number of countries to which it exports. The willingness of the US rice industry to export brown and rough (paddy) rice in the face of tariff escalation, provides it a competitive advantage but at the same time a loss in domestic value-added from processing milled rice in the US.
Global estimates of protectionism in rice are well documented in studies by Dorosh and Wailes (2010), Wailes (2005), Childs and Livezey (2006), Calpe (2005), Wailes (2004), Wailes (2002) and Gulati and Narayanan (2002).
Table 3. Continued
Source: OECD, Producer and Consumer Support Estimates Database.
Description Unit 2006 207 2008
IV. % Producer Single Commodity Transfers
% 0.94 0.30 0.36
11 E. Wailes - Composite Index of Market Access for the Export of Rice from the United States
3. PRICE LEVELS
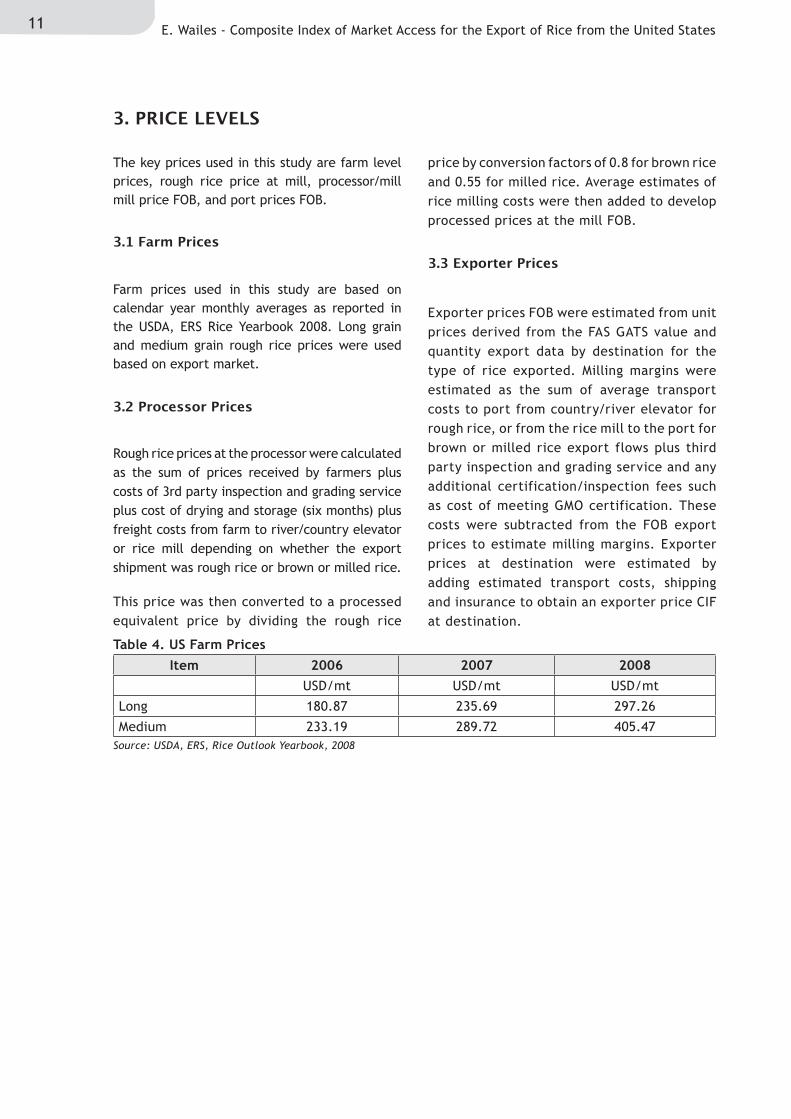
The key prices used in this study are farm level prices, rough rice price at mill, processor/mill mill price FOB, and port prices FOB.
Farm prices used in this study are based on calendar year monthly averages as reported in the USDA, ERS Rice Yearbook 2008. Long grain and medium grain rough rice prices were used based on export market.
Rough rice prices at the processor were calculated as the sum of prices received by farmers plus costs of 3rd party inspection and grading service plus cost of drying and storage (six months) plus freight costs from farm to river/country elevator or rice mill depending on whether the export shipment was rough rice or brown or milled rice.
This price was then converted to a processed equivalent price by dividing the rough rice
price by conversion factors of 0.8 for brown rice and 0.55 for milled rice. Average estimates of rice milling costs were then added to develop processed prices at the mill FOB.
Exporter prices FOB were estimated from unit prices derived from the FAS GATS value and quantity export data by destination for the type of rice exported. Milling margins were estimated as the sum of average transport costs to port from country/river elevator for rough rice, or from the rice mill to the port for brown or milled rice export flows plus third party inspection and grading service and any additional certification/inspection fees such as cost of meeting GMO certification. These costs were subtracted from the FOB export prices to estimate milling margins. Exporter prices at destination were estimated by adding estimated transport costs, shipping and insurance to obtain an exporter price CIF at destination.
3.1 Farm Prices
3.2 Processor Prices
3.3 Exporter Prices
Table 4. US Farm Prices
Source: USDA, ERS, Rice Outlook Yearbook, 2008
Item 2006 2007 2008USD/mt USD/mt USD/mt
Long 180.87 235.69 297.26
Medium 233.19 289.72 405.47

12ICTSD Programme on Agricultural Trade and Sustainable Development
4. COSTS
The key cost components of this study included farm level costs of production, inspection and grading service costs for both rough and processed flows, drying and storage costs, transportation costs from farm to elevator or mill, milling costs, transportation costs from elevator or mill to the port, costs of meeting GMO certification, and costs of shipping and insurance to export destinations. Costs used in this study did not vary from year to year. However, energy costs did vary considerably over the 2006 to 2008 calendar years. Obtaining more precise detailed year to year cost data is a serious challenge when one must depend upon industry sources as the basis of cost estimates.
Farm costs of production are developed from the USDA, ERS ARMS data base. Costs are based on the previous year production costs, i.e. 2006 farm production costs are the 2005/06 costs of production estimates. Costs of production used included Mid-South for long grain exports and California for the medium grain exports evaluated in this study.
Inspection and grading is done between the farm and processor levels and between the
processor and port levels. Industry sources provided estimates of these fees.
Costs of drying rough rice to 12.5% and storage for an average period of 6 months were based on industry source estimates.
Farm to elevator or mill transport costs were based on industry source estimates of average costs. Elevator or mill transportation costs to port were based on industry source estimates. Costs of international shipping and insurance were based on industry supplied estimates from the destination.
Milling costs are based on industry estimates and estimates from costs models developed and maintained by Wailes and Holder (1987) and Wailes and Gauthier (1998)
4.1 Costs of Farm Production
4.2 Inspection and Grading Service Fees
4.4 Transportation Costs
4.5 Processing Costs
4.3 Drying and Storage costs

13 E. Wailes - Composite Index of Market Access for the Export of Rice from the United States
5. SUBSIDIES AND TAXES
The US government provides deficiency pay-ments based on loan rates. If prices received by farmers are below a loan rate of $143/mt, then a loan deficiency payment is made available to the producer. For the 2006 to 2008 time period there were no price subsidies provided as market prices were in excess of $143/mt. Decoupled income support is provided to farmers who have historically produced rice. A direct payment of $51.80/mt is made to farmers whether they currently produce rice or not. This payment is subject to a payment limitation (USD 40,000 per person) and an adjusted gross income (AGI) limit1. (Producers with an AGI over USD 2.5 million, averaged over 3 years, were not eligible for direct or counter-cyclical payments, marketing loan benefits and conservation payments unless 75% or more of the AGI was from farming, forestry or agriculture.) An additional decoupled payment is made if the market price plus the direct payment is below $231.48/mt. This payment, known as a counter-cyclical payment, is also paid on historical rice production program acreage and yields. A producer does not have to produce rice to qualify for this income support payment. A deficiency payment is made if the market price plus the direct payment are below the so-called target price of $231.48/mt. This payment is also subject to payment limits and AGI limits. Because the direct payment and counter-cyclical payment are decoupled, they are not introduced into the CIMA accounting framework.
This case study evaluates four major export markets in terms of the most important rice type exported to that country. The countries and type of rice include: Mexico—long grain rough rice, the EU-27—long grain brown rice, Turkey—long grain rough rice, and Japan—medium grain milled rice.
5.2.1 Mexico
Mexico is the largest market for US rice. Rough rice accounted for approximately 85% of the milled equivalent rice exports from the US to Mexico. Under the NAFTA agreement, tariffs on US rice were eliminated and therefore, there are no tariffs or other protectionist barriers on US rice during the 2006 to 2008 period. In early 2007, Mexico held US rice for testing until Mexico approved LL62, which had contaminated US rice supplies2.
5.2.2 European Union—27
The EU—27 was the most important market for US brown rice exports prior to the GM contamination events in 2006 and 2007. Over the 2006 to 2008 period, US rice exports declined to minimal levels due to difficulties in agreeing to GM testing and certification protocols. Current testing is estimated to add an additional $10/mt to the cost of entering the EU market.
MFN tariffs apply to the US for brown rice the bound duty is 65 Euro/mt while the applied duty varies depending upon import levels relative to specified upper and lower thresholds calculated at the beginning and mid-way of the marketing year. Finally, a 4% Value Added Tax (VAT) is charged to cereals. According to the EU Commission for the period from January 1 – February 28, 2006 the applied duty for husked (brown) rice was 42.5 EURO/mt. From March 1 2006 until December 31 2008 the applied duty for husked rice was 65 EURO/mt.
5.2.3 Turkey
Turkey is an important market for medium grain rice from the US, primarily as rough rice. In 2005 the US brought a WTO dispute (DS334) against Turkey regarding its use of Certificates of Control as an import barrier3. This mechanism required domestic purchase requirements. US exports declined from 255 thousand metric tons in 2005 to less than 18 thousand metric tons by
5.1 Subsidies and Taxes in the US
5.2 Taxes and Trade Barriers in Importing Countries
14ICTSD Programme on Agricultural Trade and Sustainable Development
2006. In September 2007, the dispute settlement panel agreed with the US that Turkey’s failure to grant licenses to import rice and its operation of a discretionary import licensing system for rice were in breach of Turkey’s market access obligations. The panel also found that the domestic purchase requirement was in breach of national treatment of the MFN. Subsequently by 2008, US rice exports to Turkey increased to 133 thousand metric tons.
Applied duties for rice imports by Turkey are 34% for rough rice, 36% for husked (brown) rice and 45% for milled rice.
5.2.4 Japan
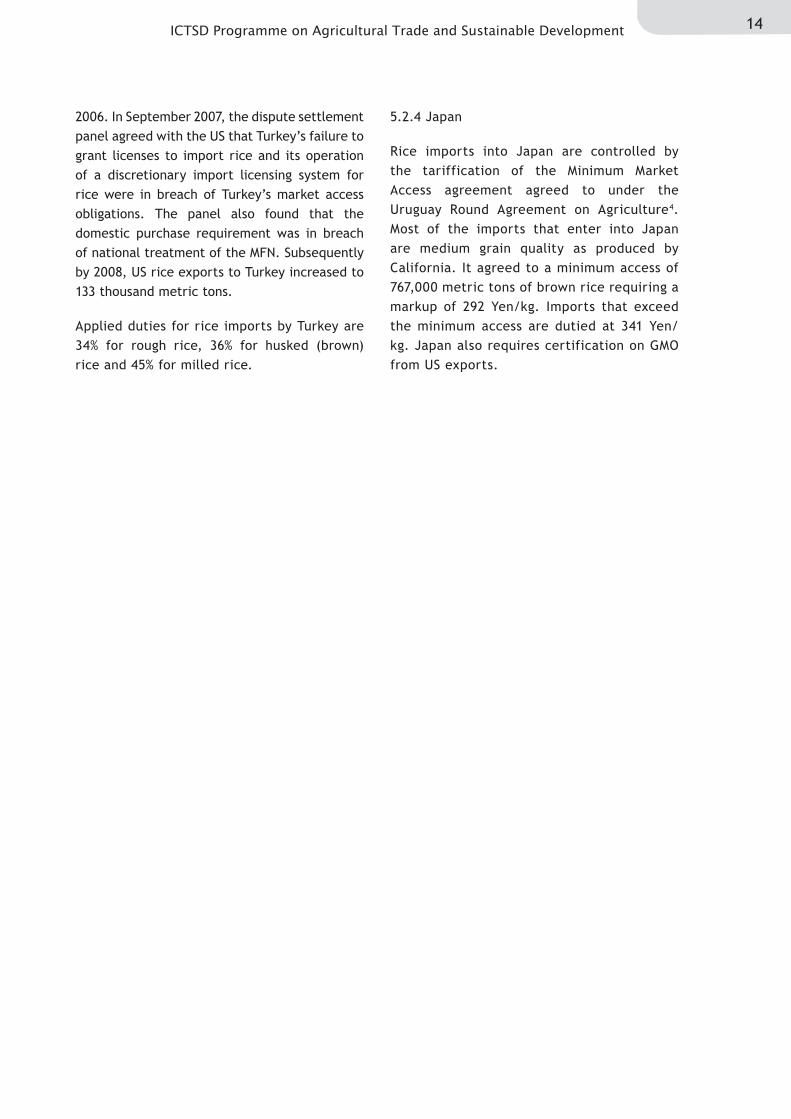
Rice imports into Japan are controlled by the tariffication of the Minimum Market Access agreement agreed to under the Uruguay Round Agreement on Agriculture4. Most of the imports that enter into Japan are medium grain quality as produced by California. It agreed to a minimum access of 767,000 metric tons of brown rice requiring a markup of 292 Yen/kg. Imports that exceed the minimum access are dutied at 341 Yen/kg. Japan also requires certification on GMO from US exports.

15 E. Wailes - Composite Index of Market Access for the Export of Rice from the United States
6. PRICE LADDERS AND CALCULATION OF CIMA
Based on the price and cost data the following tables provide estimates of the Composite Index of Market Access for US exports to Mexico, the EU, Turkey and Japan. The unique elements of the price ladders are provided in the tables for each of the importers. The CIMA index is calculated as a degree of market access where:
CIMA = 1 – BMA% where, BMA% = BMA/final price to exporter and
BMA = EDT + MTD + (PLC-PLP) + SPC, where EDT = excise taxes in importing country
MTD = import duties and other charges
PLC = costs of meeting private standards for export
PLP = price premium for meeting private standards
SPC = costs of meeting health and safety standards
16ICTSD Programme on Agricultural Trade and Sustainable Development
7. SUMMARY
This US rice export case study is a pilot application of the method and framework for CIMA as an analytical tool to estimate the full range of costs faced by US rice exporters when they sell into import markets. The study demonstrates that the calculation of CIMA for US rice is possible and meaningful. The study shows that measurement of market access only in term of tariffs limit one’s understanding of the full range of market barriers that exist.
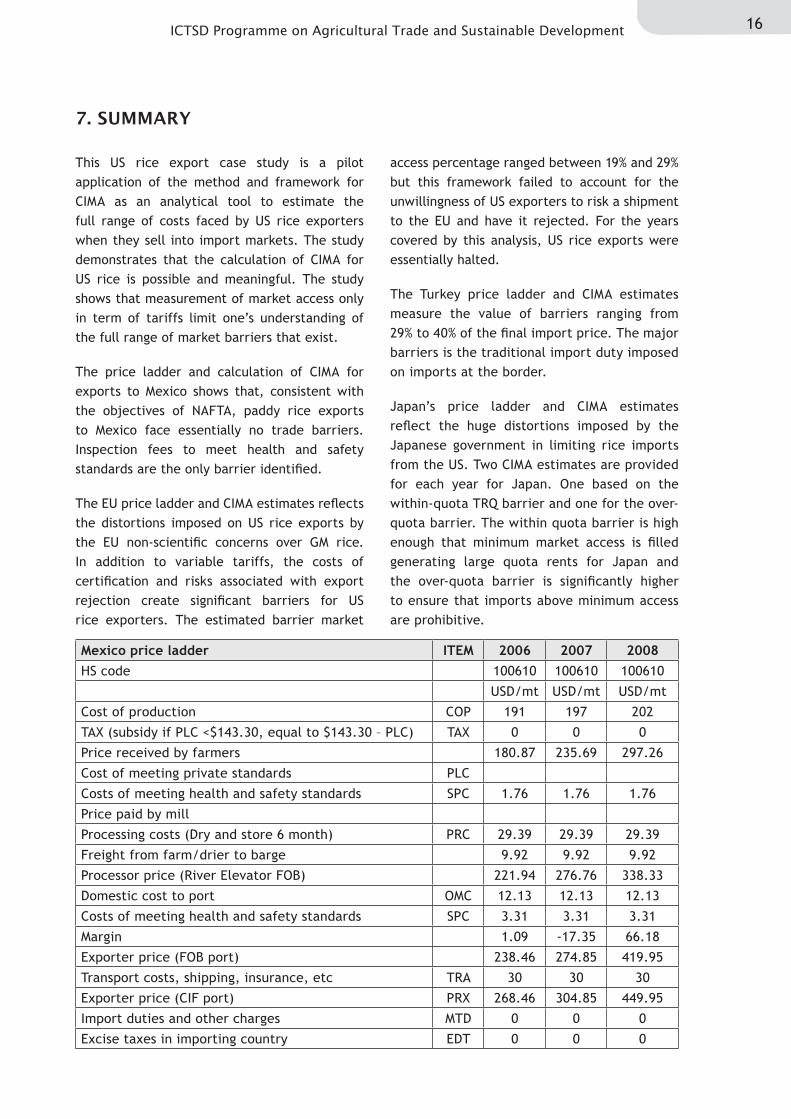
The price ladder and calculation of CIMA for exports to Mexico shows that, consistent with the objectives of NAFTA, paddy rice exports to Mexico face essentially no trade barriers. Inspection fees to meet health and safety standards are the only barrier identified.
The EU price ladder and CIMA estimates reflects the distortions imposed on US rice exports by the EU non-scientific concerns over GM rice. In addition to variable tariffs, the costs of certification and risks associated with export rejection create significant barriers for US rice exporters. The estimated barrier market
access percentage ranged between 19% and 29% but this framework failed to account for the unwillingness of US exporters to risk a shipment to the EU and have it rejected. For the years covered by this analysis, US rice exports were essentially halted.
The Turkey price ladder and CIMA estimates measure the value of barriers ranging from 29% to 40% of the final import price. The major barriers is the traditional import duty imposed on imports at the border.
Japan’s price ladder and CIMA estimates reflect the huge distortions imposed by the Japanese government in limiting rice imports from the US. Two CIMA estimates are provided for each year for Japan. One based on the within-quota TRQ barrier and one for the over-quota barrier. The within quota barrier is high enough that minimum market access is filled generating large quota rents for Japan and the over-quota barrier is significantly higher to ensure that imports above minimum access are prohibitive.
Mexico price ladder ITEM 2006 2007 2008HS code 100610 100610 100610
USD/mt USD/mt USD/mt
Cost of production COP 191 197 202
TAX (subsidy if PLC <$143.30, equal to $143.30 – PLC) TAX 0 0 0
Price received by farmers 180.87 235.69 297.26
Cost of meeting private standards PLC
Costs of meeting health and safety standards SPC 1.76 1.76 1.76
Price paid by mill
Processing costs (Dry and store 6 month) PRC 29.39 29.39 29.39
Freight from farm/drier to barge 9.92 9.92 9.92
Processor price (River Elevator FOB) 221.94 276.76 338.33
Domestic cost to port OMC 12.13 12.13 12.13
Costs of meeting health and safety standards SPC 3.31 3.31 3.31
Margin 1.09 -17.35 66.18
Exporter price (FOB port) 238.46 274.85 419.95
Transport costs, shipping, insurance, etc TRA 30 30 30
Exporter price (CIF port) PRX 268.46 304.85 449.95
Import duties and other charges MTD 0 0 0
Excise taxes in importing country EDT 0 0 0

17 E. Wailes - Composite Index of Market Access for the Export of Rice from the United States
Mexico price ladder ITEM 2006 2007 2008HS code 100610 100610 100610
USD/mt USD/mt USD/mt
Importer Price PRM 268.46 304.85 449.95
Barrier Market Access BMA 3.31 3.31 3.31
Barrier Market Access Percentage BMAP 1% 1% 1%
Composite Index Market Access CIMA 99% 99% 99%
EU price ladder ITEM 2006 2007 2008HS code 100620 100620 100620
USD/mt USD/mt USD/mt
Cost of production COP 191 197 202
TAX (subsidy if PLC <$143.30, equal to $143.30 – PLC) TAX 0 0 0
Price received by farmers (calendar year) 180.87 235.69 297.26
Cost of meeting private standards PLC 0 0 0
Costs of meeting health and safety standards SPC 1.764 1.764 1.764
Processing costs (Dry and store 6 month) PRC 29.39 29.39 29.39
Freight from farm/drier to barge 9.92 9.92 9.92
Paddy price at mill 221.94 276.76 338.33
Brown rice price at mill (conversion 0.80) 277.43 345.96 422.92
Processing costs (Husked rice) 45.45 45.45 45.45
Brown rice price at mill (FOB) 322.89 391.41 468.37
Domestic cost to port OMC 12.13 12.13 12.13
Costs of meeting health and safety standards SPC 3.31 3.31 3.31
Costs of meeting GMO certification SPC 0.00 10.00 10.00
Margin -67.72 -74.94 174.99
Exporter price (FOB port) 270.6 331.9 658.8
Transport costs, shipping, insurance, etc TRA 87 87 87
Exporter price (CIF port) PRX 357.6 418.9 745.8
Import duties and other charges MTD 81.63 89.02 95.08
Excise taxes in importing country EDT 17.57 20.32 33.64
Importer Price PRM 456.80 528.24 874.52
Barrier Market Access BMA 102.51 122.65 142.02
Barrier Market Access Percentage BMAP 29% 29% 19%
Composite Index Market Access CIMA 71% 71% 81%

18ICTSD Programme on Agricultural Trade and Sustainable Development
EU price ladder ITEM 2006 2007 2008HS code 100610 100610 100610
USD/mt USD/mt USD/mt
Cost of production COP 191 197 202
TAX (subsidy if PLC <$143.30, equal to $143.30 – PLC) TAX 0 0 0
Price received by farmers (calendar year) 180.87 235.69 297.26
Cost of meeting private standards PLC 0 0 0
Costs of meeting health and safety standards SPC 1.76 1.76 1.76
Processing costs (Dry and store 6 month) PRC 29.39 29.39 29.39
Freight from farm/drier to barge 9.92 9.92 9.92
Processor price (River Elevator FOB) 221.94 276.76 338.33
Domestic cost to port OMC 12.13 12.13 12.13
Costs of meeting health and safety standards SPC 3.31 3.31 3.31
Margin -8.91 -17.35 28.81
Exporter price (FOB port) 228.47 274.8494 382.58
Transport costs, shipping, insurance, etc TRA 95 95 95
Exporter price (CIF port) PRX 323.47 369.8494 477.58
Costs of meeting Turkish Food Codex standards SPC
Import duties and other charges MTD 109.98 125.75 162.38
Excise taxes in importing country EDT 0 0 0
Importer Price PRM 433.45 495.60 639.96
Barrier Market Access BMA 101.07 108.40 191.19
Barrier Market Access Percentage BMAP 31% 29% 40%
Composite Index Market Access CIMA 69% 71% 60%
Japan price ladder ITEM 2006 2007 2008HS code 1006309020 1006309020 1006309020
USD/mt USD/mt USD/mt
Cost of production (previous year) COP 273 249 267
TAX (subsidy if PLC <$143.30, equal to $143.30 – PLC)
TAX 0 0 0
Price received by farmers (calendar year) 233.19 289.72 405.47
Cost of meeting private standards PLC 0 0 0
Costs of meeting health and safety standards SPC 1.76 1.76 1.76
Processing costs (Dry and store 6 month) PRC 29.39 29.39 29.39
Freight from farm/drier to mill 9.92 9.92 9.92
Paddy price at mill 274.26 330.79 446.54
Milled rice price at mill (conversion 0.6) 457.11 551.32 744.24
Processing costs (Husked rice) 54.55 54.55 54.55
Milled rice price at mill (FOB) 511.65 605.87 798.79
Domestic cost to port OMC 12.13 12.13 12.13
Costs of meeting health and safety standards SPC 3.31 3.31 3.31
Costs of meeting GMO certification SPC 0.00 10.00 10.00
Margin -17.25 -71.50 -216.01
Exporter price (FOB port) 509.84 549.8 598.21

19 E. Wailes - Composite Index of Market Access for the Export of Rice from the United States
Japan price ladder ITEM 2006 2007 2008Transport costs, shipping, insurance, etc TRA 86 86 86
Exporter price (CIF port) PRX 595.84 635.8 684.21
Marked Access markup MTD 2510.77 2479.75 2774.83
Out of Market Access markup MTD’ 2932.10 2895.87 3240.47
Excise taxes in importing country EDT 0 0 0
Importer Price PRM 3106.08 3115.55 3459.04
Barrier Market Access BMA 2514.08 2493.05 2788.13
Barrier Market Access Percentage BMAP 422% 392% 407%
Composite Index Market Access CIMA -322% -292% -307%
Barrier over Minimum Market Access BMMA 2935.40 2909.17 3253.77
Barrier over Minimum Market Access Percentage
BMMAP 493% 485% 476%
Composite Index over Minimum Market Access CIMMA -393% -358% -376%
20ICTSD Programme on Agricultural Trade and Sustainable Development
ENDNOTES
1 Producers with an AGI over USD 2.5 million, averaged over 3 years, were not eligible for direct or counter-cyclical payments, marketing loan benefits and conservation payments unless 75% or more of the AGI was from farming, forestry or agriculture.
2 The US long-grain rice supply was found to be contaminated with a genetically modified rice variety (Liberty Link) in August of 2006. This resulted in an import ban into the EU and other countries including Mexico, required testing of rice on US export shipments.
3 World Trade Organization. Turkey Measures Affecting the Importation of Rice, Report of the Panel. WT/DS334/R, 21/09/2007.
4 For extended analysis of Japan’s rice import policy see Cramer, Hansen and Wailes (1999), Wailes, Ito and Cramer (1991) and Wailes, Young and Cramer (1991).
21 E. Wailes - Composite Index of Market Access for the Export of Rice from the United States
REFERENCES
Calpe, Concepcion. 2005. International trade in rice: recent developments and prospects. In Rice is Life: scientific perspectives for the 21st century. Ed. K.L. Heong. Los Baños, Philippines.
Chambers, Bill and Nathan Childs. 2000. Characteristics of U.S. Rice Farming. Rice Situation and Outlook, RCS-2000, November 2000. USDA, Economic Research Service, Washington, DC.
Childs, Nathan and Katherine Baldwin. 2009. Rice Situation and Outlook. RCS-10-2009. USDA, Economic Research Service. Washington, DC.
Childs, Nathan and Amy Burdett. The U.S. Rice Export Market. Rice Situation and Outlook, RCS-2000, November 2000. USDA, Economic Research Service. Washington, DC.
Childs, Nathan and Janet Livezey. 2006. Rice Backgrounder. RCS-2006-01. USDA, Economic Research Service, Washington, DC.
Cramer, Gail L., James M. Hansen and Eric J. Wailes. Impact of Rice Tariffication on Japan and the World Rice Market. Amer. J. Agr. Econ. 81 (December 1999).
Cramer, Gail L., Kenneth B. Young, and Eric J. Wailes. 2003. Rice Marketing. In Rice—Origin, History, Technology, and Production, eds. C. Wayne Smith and Robert H. Dilday. John Wiley and Sons. New York.
Dawe, David, ed. 2010. The Rice Crisis: Markets, Policy and Food Security. Earthscan. London.
Dorosh, Paul and Eric Wailes. 2010. The International Rice Trade: Structure, Conduct and Performance. In Rice in the Global Economy: strategic research and policy issues for food security. Ed. S. Pandey, D. Byerlee, D. Dawe, A. Dobermann, S. Mohanty, S. Rozelle, and B. Hardy. Los Baños, Philippines.
Gulati, Ashok and Suhda Narayanan. 2002. Rice trade liberalization and poverty. Discussion Paper No. 51. Markets and Structural Studies Division. International Food Policy Research Institute. Washington, DC.
Josling, Tim. 2008. Composite Index of Market Access (CIMA). ICTSD. Geneva.
Livezey, Janet and Linda Foreman. 2004. Characteristics and Production Costs of U.S. Rice Farms. Statistical Bulletin No. (SB974-7). USDA, Economic Research Service. Washington, DC.
OECD. Producer and Consumer Support Estimates Database. Paris.
Setia, P., N. Childs, E. Wailes, and J. Livezey. 1994. The U.S. Rice Industry. Agricultural Economics Research Report No. 700. U.S. Department of Agriculture, Economic Research Service, Washington, DC.
Smith, R., E.J. Wailes and G.L. Cramer. 1990. The Structure of the U.S. Rice Industry Arkansas Experiment Station Bulletin No. 921, University of Arkansas, Fayetteville.
USDA, 2007 Census of Agriculture. Washington, DC.
USDA, Economic Research Service. Commodity Costs and Returns Data. Washington, DC.
USDA, Foreign Agricultural Service. Global Agricultural Trade System. Washington, DC.
USDA, National Agricultural Statistical Service. Crop maps. Washington, DC.

22ICTSD Programme on Agricultural Trade and Sustainable Development
Wailes, E.J. and S.H. Holder. 1987. Cost Models and an Analysis of Modern Rice Mills. Arkansas Experiment Station Bulletin No. 907. University of Arkansas.
Wailes, E.J., S. Ito and G.L. Cramer. 1991. Japan’s Rice Market, Policies and Prospects for Trade Liberalization. Arkansas Experiment Station Report Series 319, University of Arkansas, Fayetteville.
Wailes, E.J., K.B. Young and G.L. Cramer. 1991. Rice and Food Security in Japan – An American Perspective. Invited Paper. International Agricultural Economic Association Meeting, Tokyo, Japan.
Wailes, Eric J. and Wayne M. Gauthier. “U.S. Rice Milling Industry: Structural Changes and Performance.” in eds. Donald W. Larson, Paul W. Gallagher, and Reynold P. Dahl. Structural Change and Performance of the U.S. Grain Marketing System. Scherer Communications: Urbana, IL. 1998. Pp.233-251
Wailes, Eric. “Trade Liberalization in Rice.” In Agricultural Trade Policies in the New Millennium, ed. P. Lynn Kennedy. Haworth Press, 2002.
Wailes, Eric J. 2004. “Implications of the WTO Doha Round for the Rice Sector.” Proceedings, The Year of Rice Conference. FAO, United Nations. Rome, Italy. At http://www.fao.org/rice2004/en/pdf/wailes.pdf
Wailes, Eric J. 2005. “Rice global trade, protectionist policies, and the impact of trade liberalization.” In Global Agricultural Trade and Developing Countries. Eds. M. Ataman Aksoy and John C. Beghin. World Bank.
Wailes, Eric. 2008. “Rice Industry.” In Encyclopedia of Rural America: the Land and People. Gary Goreham, ed. 2nd ed. Grey House Publishing. Millerton, NY. Pp. 821-826. ISBN: 978-1-59237-115-0

Selected IctSd ISSUe PAPeRS Agriculture trade and Sustainable development Composite Index of Market Access for the Export of Rice from Thailand. By T. Dechachete. Issue Paper No.31, 2011.Composite Index of Market Access for the Export of Poultry from Brazil. By H. L. Burnquist, C. C. da Costa, M. J. P. de Souza, L. M. Fassarella. Issue Paper No.30, 2011.How Might the EU’s Common Agricultural Policy Affect Trade and Development After 2013? By A. Matthews. Issue Paper No. 29, 2010.Food Security, Price Volatility and Trade: Some Reflections for Developing Countries. By Eugenio Díaz-Bonilla and Juan Francisco Ron. Issue Paper No. 28, 2010.Composite Index of Market Access for the Export of Rice from Uruguay. By Carlos Perez Del Castillo and Daniela Alfaro. Issue Paper No. 27, 2010.How Would A Trade Deal On Cotton Affect Exporting And Importing Countries? By Mario Jales. Issue Paper No.26, 2010.Simulations on the Special Safeguard Mechanism: A Look at the December Draft Agriculture Modalities. By Raul Montemayor. Issue Paper No.25, 2010.competitiveness and Sustainable developmentThe Role of International Trade, Technology and Structural Change in Shifting Labour Demands in South Africa. By H. Bhorat, C. van der Westhuizen and S.Goga. Issue Paper No. 17, 2010.Trade Integration and Labour Market Trends in India: an Unresolved Unemployment Problem. By C.P. Chandrasekhar. Issue Paper No. 16, 2010.The Impact of Trade Liberalization and the Global Economic Crisis on the Productive Sectors, Employment and Incomes in Mexico. By A. Puyana. Issue Paper No. 15, 2010.Globalization in Chile: A Positive Sum of Winners and Losers. By V. E. Tokman. Issue Paper No. 14, 2010.Practical Aspects of Border Carbon Adjustment Measures – Using a Trade Facilitation Perspective to Assess Trade Costs. By Sofia Persson. Issue Paper No.13, 2010.Trade, Economic Vulnerability, Resilience and the Implications of Climate Change in Small Island and Littoral Developing Economies. By Robert Read. Issue Paper No.12, 2010.The Potential Role of Non Traditional Donors ‘Aid in Africa. By Peter Kragelund. Issue Paper No.11, 2010.Aid for Trade and Climate Change Financing Mechanisms: Best Practices and Lessons Learned for LDCs and SVEs in Africa. By Vinaye Dey Ancharaz. Issue Paper No.10, 2010.Resilience Amidst Rising Tides: An Issue Paper on Trade, Climate Change and Competitiveness in the Tourism Sector in the Caribbean. By Keron Niles. Issue Paper No.9, 2010.dispute Settlement and legal Aspects of International tradeConflicting Rules and Clashing Courts. The Case of Multilateral Environmental Agreements, Free Trade Agreements and the WTO. By Pieter Jan Kuijper. Issue Paper No.10, 2010.Burden of Proof in WTO Dispute Settlement: Contemplating Preponderance of the Evidence. By James Headen Pfitzer and Sheila Sabune. Issue Paper No.9, 2009.Suspension of Concessions in the Services Sector: Legal, Technical and Economic Problems. By Arthur E. Appleton. Issue Paper No.7, 2009.Trading Profiles and Developing Country Participation in the WTO Dispute Settlement System. By Henrik Horn, Joseph Francois and Niklas Kaunitz. Issue Paper No.6, 2009.Fisheries, International trade and Sustainable developmentThe Importance of Sanitary and Phytosanitary Measures to Fisheries Negotiations in Economic Partnership Agreements. By Martin Doherty. Issue Paper No.7, 2008.Fisheries, Aspects of ACP-EU Interim Economic Partnership Agreements: Trade and Sustainable Development Implications. By Liam Campling. Issue Paper No.6, 2008.Fisheries, International Trade and Sustainable Development. By ICTSD. Policy Discussion Paper, 2006.Intellectual Property Rights and Sustainable developmentSustainable Development In International Intellectual Property Law – New Approaches From EU Economic Partnership Agreements? By Henning Grosse Intellectual Property Rights and International Technology Transfer to Address Climate Change: Risks, Opportunities and Policy Options. By K. E. Maskus and R. L. Okediji. Issue Paper No.32, 2010Intellectual Property Training and Education: A Development Perspective. By Jeremy de Beer and Chidi Oguamanam. Issue Paper No.31, 2010.An International Legal Framework for the Sharing of Pathogens: Issues and Challenges. By Frederick M. Abbott. Issue Paper No.30, 2010.Sustainable Development In International Intellectual Property Law – New Approaches From EU Economic Partnership Agreements? By Henning Grosse Ruse – Khan. Issue Paper No.29, 2010.trade in Services and Sustainable developmentFacilitating Temporary Labour Mobility in African Least-Developed Countries: Addressing Mode 4 Supply-Side Constraints. By Sabrina Varma. Issue Paper No.10, 2009.Advancing Services Export Interests of Least-Developed Countries: Towards GATS Commitments on the Temporary Movement of natural Persons for the Supply of Low-Skilled and Semi-Skilled Services. By Daniel Crosby, Issue Paper No.9, 2009.Maritime Transport and Related Logistics Services in Egypt. By Ahmed F. Ghoneim, and Omneia A. Helmy. Issue Paper No.8, 2007.environmental Goods and Services ProgrammeHarmonising Energy Efficiency Requirements – Building Foundations for Co-operative Action. By Rod Janssen. Issue Paper No.14, 2010Climate-related single-use environmental goods. By Rene Vossenaar. Issue Paper No.13, 2010.Technology Mapping of the Renewable Energy, Buildings, and transport Sectors: Policy Drivers and International Trade Aspects: An ICTSD Synthesis Paper. By Renee Vossenaar and Veena Jha. Issue Paper No.12, 2010.trade and Sustainable energyInternational Transport, Climate Change and Trade: What are the Options for Regulating Emissions from Aviation and Shipping and what will be their Impact on Trade? By Joachim Monkelbaan. Background Paper, 2010.Climate Change and Trade on the Road to Copenhagen. Policy Discussion Paper, 2009.Trade, Climate Change and Global Competitiveness: Opportunities and Challenge for Sustainable Development in China and Beyond. By ICTSD. Selected Issue Briefs No.3, 2008.Intellectual Property and Access to Clean Energy Technologies in Developing Countries: An Analysis of Solar Photovoltaic, Biofuel and Wind Technologies. By John H. Barton. Issue Paper No.2, 2007.Regionalism and ePAsQuestions Juridiques et Systémiques Dans les Accords de Partenariat économique : Quelle Voie Suivre à Présent ? By Cosmas Milton Obote Ochieng. Issue Paper No. 8, 2010.Rules of Origin in EU-ACP Economic Partnership Agreements. By Eckart Naumann. Issue Paper No.7, 2010SPS and TBT in the EPAs between the EU and the ACP Countries. By Denise Prévost. Issue Paper No.6, 2010.Los acuerdos comerciales y su relación con las normas laborales: Estado actual del arte. By Pablo Lazo Grandi. Issue Paper No.5, 2010.Revisiting Regional Trade Agreements and their Impact on Services and Trade. By Mario Marconini. Issue Paper No.4, 2010.Trade Agreements and their Relation to Labour Standards: The Current Situation. By Pablo Lazo Grandi. Issue Paper No.3, 2009.Global economic Policy and InstitutionsThe Microcosm of Climate Change Negotiations: What Can the World Learn from the European Union? By Håkan Nordström, Issue Paper No.1, 2009.
These and other ICTSD resources are available at http://www.ictsd.org

ICTSD’s Programme on Agricultural Trade and Sustainable Development aims to promote food security, equity and environmental sustainability in agricultural trade. Publications include:
• CompositeIndexofMarketAccessfortheExportofRicefromThailand.ByT.Dechachete.Issue Paper No. 31, 2011.
• CompositeIndexofMarketAccessfortheExportofPoultryfromBrazil.ByH.L.Burnquist,C.C.daCosta,M.J.P.deSouza,L.M.Fassarella.IssuePaperNo.30,2011.
• How Might the EU’s Common Agricultural Policy Affect Trade and Development After2013?AnAnalysisoftheEuropeanCommission’sNovember2010Communication.ByAlanMatthews.IssuePaperNo.29,2010.
• Food Security, Price Volatility and Trade: Some Reflections for Developing Countries. ByEugenioDíaz-BonillaandJuanFranciscoRon.IssuePaperNo.28,2010.
• CompositeIndexofMarketAccessfortheExportofRicefromUruguay.ByCarlosPerezDelCastillo and Daniela Alfaro. Issue Paper No. 27, 2010.
• HowWouldATradeDealOnCottonAffectExportingAndImportingCountries?ByMarioJales. Issue Paper No. 26, 2010.
• Simulations on the Special Safeguard Mechanism: A Look at the December 2008 DraftAgricultureModalities.ByRaulMontemayor.IssuePaperNo.25,2010.
• HowWouldaTradeDealonSugarAffectExportingand ImportingCountries?ByAmaniElobeid.IssuePaperNo.24,2009.
• ConstructingaCompositeIndexofMarketAcess.ByTimJosling.IssuePaperNo.23,2009.
• Comparing safeguard measures in regional and bilateral agreements. By Paul Kruger,WillemienDennerandJBCronje.IssuePaperNo.22,2009.
• HowwouldaWTOagreementonbananasaffectexportingand importingcountries?ByGiovanniAnania.IssuePaperNo.21,2009.
• Biofuels Subsidies and the Law of theWorld Trade Organisation. By Toni Harmer. IssuePaperNo.20,2009.
• BiofuelsCertificationandtheLawoftheWorldTradeOrganisation.ByMarshaA.Echols.IssuePaperNo.19,2009.
Forfurtherinformation,visitwww.ictsd.org
ABOUT ICTSD
Foundedin1996,theInternationalCentreforTradeandSustainableDevelopment(ICTSD)isanindependentnon-profitandnon-governmentalorganizationbasedinGeneva.Byempoweringstakeholdersintradepolicythroughinformation,networking,dialogue,well-targetedresearchand capacity building, the centre aims to influence the international trade system such that it advances the goal of sustainable development.
www.ictsd.org