component b development of a threshold for the … · development of a threshold for the economical...
TRANSCRIPT

CFC / ICAC / 11 Project Technical Report on Research Activities Page 101
COMPONENT B
Development of a threshold
for the economical processing
of sticky cotton

CFC / ICAC / 11 Project Technical Report on Research Activities Page 102

CFC / ICAC / 11 Project Technical Report on Research Activities Page 103
Chapter C. Component B: Development of a threshold for the economicalprocessing of sticky cotton
Methods for neutralizing stickiness are under development at CIRAD. The laboratory workcarried out so far has indicated that stickiness may be largely neutralized without affecting thequality of the cotton. Employing a neutralizing process requires additional time and cost andshould only be used if financially advantageous. Establishment of thresholds for spinningsticky cotton will therefore be of a major advantage to the spinning industry. The main focusof this component is to establish such a threshold.
The operations envisaged in this component will take place in France at Institut Textile deFrance, where, in close consultation with CIRAD, research activities will focus on the impactof varying degrees of stickiness on the spinning process (at factory scale) and the variablesthat affect this impact. Sticky cottons disrupt the spinning process by sticking to various partsof the spinning machines. The problem varies depending on the stage of the process leading tothe production of the yarn. Cotton fiber preparation (beating, mixing, opening, cleaning) isaffected greatly if the quantity of sticky cotton involved is very large (several hundredkilograms). Stickiness has a considerable effect during carding and leads to irregularities incard slivers or, in extreme cases, renders carding impossible. The machines must then bestopped and cleaned. As far as the drawing frames, brush frames and spinning machines areconcerned, the honeydew is deposited onto the rollers (feed, draw, etc.) and causes yarnirregularities and breakages. Rotor spinning suffers from problems such as the frequentfouling of the feed tables and rotors, which requires machines to be stopped repeatedly andcleaned. The result is lower yarn quality and higher production costs.
Activities related to developing post-ginning measures as foreseen in the project will belargely based on experience gained by CIRAD in earlier work on the neutralization ofstickiness in cotton (in particular the impact of pressure, heat and humidity, as studied andapplied under laboratory conditions). Research that made use of the SCT-Thermodetector hasrevealed that the number of sticky points in the test samples fluctuates depending on therelative humidity of the ambient air. Results in the 55% to 65% range seem to be stable.Outside this range there is a marked fall in the number of sticky points. The maximum stickypotential is therefore expressed between 55 and 65% relative humidity. This points to 2 waysof neutralizing stickiness: drying or humidification. The so-called TNCC9 of neutralizingstickiness developed by CIRAD uses the same combination of factors as the thermodetector,i.e. pressure, heat, humidity. A brief description of this method is given in Appendix V. Theresults have shown the importance of studying the impact of stickiness in a real-scaleenvironment.
The studies to be undertaken in the framework of the project will determine the effects ofsticky cotton on the spinning process and on the quality of the yarn and the resulting product.The threshold level of sticky cotton that will still yield end-products of acceptable qualitywill be established. Tests will also be undertaken to assess to what extent sticky cotton can beblended with non-sticky cotton to obtain an acceptable level of quality, i.e. allow spinningwithout disrupting the regular spinning process. The tests will differentiate betweenconventional (ring) and rotor spinning, and will be performed different under atmosphericconditions in order to establish the impact of different moisture and temperature levels. Alltests will be performed under industrial conditions and will use the lint from 60 balesclassified as to degree of stickiness in component (a) (approximately 13,500 kg). Quality testswill be undertaken in the ITF and CIRAD laboratories using certified measuring equipmentand standard procedures for the establishment of the properties/deficiencies to be determined.

CFC / ICAC / 11 Project Technical Report on Research Activities Page 104
In the framework of this component, the following outputs will be produced throughundertaking the described activities.
Output 2.1 The effects of sticky cotton on the spinning process and quality of the yarnor resulting product.
About 400 kg of each cotton (about 2 bales) will be required from preparation to drawing. 100kg of lint will be sufficient for the spinning process. All tests (on 30 x 2 bales) will beperformed under industrial conditions. Breakages at different steps in the process will becounted and the production process will be evaluated through spinning. Laboratory tests willconsist of measuring:
-fiber length and strength characteristics on an HVI Zellweger-Uster line (on raw fiberand card sliver), and maturity and fineness on a Shirley Maturity Meter;
-level of stickiness using an SCT sticky cotton detector at each step in production frombale to the second drawing, to evaluate any variations in the course of the productionprocess;
-regularity at each step in the production process (card sliver to yarn) using an UsterTester II regularimeter, and the strength of the yarn produced (Super web apparatus);
-Classimat, to classify the different defects (Uster, Classimat II);
The level of stickiness during spinning will be evaluated by qualitative analysis of stickinessduring different steps in the production process and by the quantitative analysis of thelaboratory tests in comparison with non sticky cottons.
The same cotton batches will be used in rotor spinning. The controls performed during theproduction process and the laboratory tests carried out will be the same as for theconventional spinning process. The quality of the yarn from the resulting product will bedetermined by making use of the method (developed by the Cotton Technology Laboratory ofCIRAD-CA) that differentiates between neps according to their different origins: seed coatfragments, fiber neps, sticky neps and stem or leaf fragment neps. This method will be used tocount the number of neps induced by stickiness in the industrial yarn and consists ofregularimetry tests performed on a Uster UT3 regularimeter. The settings chosen will be asfollows: speed 50m/mn, thin (-50%), thick (+50%), neps (200%). These settings will be usedfor the two regularimeter tests, i.e. normal test (for the total number of neps) and detailedanalysis which will be performed to identify the different neps observed. Each imperfection isexamined in detail using a magnifying glass and strong lighting. The yarn is stopped over agiven period of time (20 seconds), then is loosened in order to stabilize for 5 seconds beforethe reading. Imperfections will be classified as seed coat fragments, fiber neps (entangledfibers and sticky neps) and fragments such as leaves. Percentages obtained for each type ofimperfection will be adjusted to total neps on 1,000 m to obtain the number of neps per typeof imperfection over 1,000 m.
Activity 2.1.1 Cotton with known levels of stickiness will be spun on ring and rotorspinning machines (industrial scale).
Activity 2.1.2 The effects of sticky cotton on the spinning process and resultant yarnquality will be established.

CFC / ICAC / 11 Project Technical Report on Research Activities Page 105
Output 2.2 Establishment of stickiness thresholds for spinning.
Activity 2.2.1 The economically acceptable level of stickiness on ring and rotorspinning machines (industrial scale) will be determined. A level ofstickiness that prohibits spinning without prior processing will beestablished.
Output 2.3 Blends of sticky cotton with non-sticky cotton will be prepared such thatstickiness will not be a problem during spinning.
One way of using sticky cottons would be to mix them with non sticky cottons in order toobtain a mix whose stickiness is below the critical spinning threshold. The proportions ofeach type of cotton would depend upon the potential stickiness of the contaminated cottonwhich itself depends on at least 2 factors, namely the number of sticky points measured on thesticky cotton detector and the distribution and size of these sticky points. Five types of cotton(among the 30 employed in the industrial spinning tests) will be used (for example with 25,50, 75, 100 and 150 sticky points). These cottons will be mixed in various proportions withnon sticky cotton. The number of sticky points along with their size and distribution will bestudied.
Activity 2.3.1 Mixes of cottons from different origins (sticky and non sticky) will beprepared.
Activity 2.3.2 Cotton mixes will be measured on the stickiness detector and standardswill be established to help spinners to mix sticky cotton with non-stickycotton without affecting the spinning process (ring and rotor) or yarnquality.
Output 2.4 The effect of atmospheric moisture on cotton stickiness will be established.
The relative humidity of the air is known to have an effect on the spinning of sticky cottons.Spinners use this property in an empirical manner. The aim of this study is to determine thecritical threshold for the relative humidity of the air during spinning cottons of differentstickiness levels (number of sticky points and their sizes). Six types of cotton (among the 30employed in the industrial spinning tests) will be used. The study of the spinning process(micro-spinning) under different relative humidity conditions, will be performed usingconventional and rotor spinning techniques for three types of yarn counts. All the disruptionsthat occur during the yarn production process (carding, drawing, spinning, rotors) will beevaluated (deposit of sticky points on various parts of the machines, yarn winding, yarnbreakage, etc.). Yarn strength and regularity will be measured. Different types of neps willbe identified, counted and studied.
Activity 2.4.1 The effect of atmospheric humidity on the spinning of sticky cotton andon yarn quality will be established.
This experiment is described below.

CFC / ICAC / 11 Project Technical Report on Research Activities Page 106
C.1. Carded Spinning Of Sticky Cotton: Effect of stickiness on productivity and yarnquality
C.1.1. Introduction
Cottons are rendered sticky by sugars derived primarily from entomological and physiologicalsources (Frydrych, 1998; Perkins, 1983). The entomological sugars take the form ofhoneydew produced by insects living on the cotton plant, mainly the aphid Aphid gossypii andthe white fly Bemisia tabaci. The physiological sugars are natural cotton sugars produced asresidues after the synthesis of cellulose.
Papers concerning cotton stickiness (Floeck, 1998; Frydrych, 1998; Hector, 1989; Hoelscher,1998; Perkins, 1983; Shigeaki, 1992) clearly describe how machine parts in contact with thefiber are fouled by the stickiness and underline the increase in the breakage incidence duringspinning. Substantial productivity losses have been reported. Although numerous such reportshave been published, these cannot be used for a quantitative approach to the stickinessphenomenon. Which type of stickiness measurement is the most suitable to predict fiberbehavior during spinning ? What is the exact relationship between breakages, efficiency andstickiness ? These questions, and many others required to address the stickiness problem,have yet to be answered with precision. It is therefore difficult to evaluate accurately theeconomic effects of stickiness on the spinning industry (Floeck, 1998) and in consequence itis impossible to determine in a rational manner the discount that should be applied to stickycottons (Hoelscher, 1998).
To address these questions and gain a more precise understanding of the effects of stickinessin spinning we conducted a quantitative study using a broad range of sticky cottons(Fonteneau-Tamime, 2000). The bales of cotton were spun into yarn on an industrialproduction line. Different qualitative and quantitative parameters were recorded throughoutthe processing from bale opening to yarn in order to monitor product quality and machineproductivity. Part 1, presented here, considers process productivity. The quality aspects ofproduction are described in part 2.
C.1.2. Materials and Methods
C.1.2.1. Materials
This study of the effects of stickiness in carded spinning involved 26 bales of cotton(Gossypium hirsutum).
Sixty bales from the 1996/97 Sudanese cotton crop were available for the study. The ARC(Agriculture Research Corporation), in collaboration with SCC (Sudan Cotton Company),selected these bales on the basis of stickiness measurement using a mini-card test. The twomain cultivated varieties were included as well as the two types of ginning used in Sudan(Table C-1).

CFC / ICAC / 11 Project Technical Report on Research Activities Page 107
Table C-1: Distribution of the sticky bales by variety and ginning equipment.
Stickiness level Acala-roller Acala-saw Barakat-roller
Non sticky 2 2 2
Slightly sticky 8 8 8
Moderately sticky 8 8 8
Highly sticky 2 2 2
Acala fibers of medium length were used for the carding spinning experiment, while Barakatfibers were used for the combing spinning study.
About 30 bales were selected deom the 60 for the spinning tests. These 30 bales were selectedto cover a range of stickiness while keeping the range of the other fiber parameters as tight aspossible. A sampling procedure in 10 equidistant layers in each bale, was completed in orderto measure their fiber characteristics. The following measurements were made:
- HVI (High Volume Instrument ZELLWEGER USTER 900), for Mean Length (ML) andUpper Half ML (UHML), length uniformity UI%, HVI strength and elongation;
- FMT (Fineness Maturity Tester SDL3), for micronaire, fineness and maturity;
- SCT (Thermodetector SCT), for the number of sticky points;
- H2SD (High Speed Stickiness Detector), for the number of sticky points and their sizes.
The first sample (100 g) taken from the top of each of the 30 bales analyzed using all theabove machines. The other 9 samples were analyzed on SCT and H2SD to evaluate thewithin-bale variability of the stickiness and the size distribution of the sticky points.
Ten replicates of the measurements were made for HVI and 3 for FMT, SCT and H2SD.
Twenty-four bales were finally selected for the carded spinning tests. Ten of these were rollerginned. Their characteristics were relatively homogeneous and covered a wide range ofstickiness (from some points to 50 sticky points as measured using the H2SD). All of thebales showed some stickiness. Two non-sticky bales from Central Asia were added asreferences. Carded spinning tests were then performed using 26 bales (10 being rollerginned).
When considering the Barakat bales as references in the combed spinning experiment, theydid not cover a sufficiently broad range of stickiness. Insect infestation of this variety duringthat 96/97 crop was very low. We did not find any bales with more than 13 SCT sticky points.Thus, the number of bales tested in the combed process was reduced to 5. The protocol andresults of this experiment will be discussed in paragraph C.3.

CFC / ICAC / 11 Project Technical Report on Research Activities Page 108
C.1.2.2. Fiber quality determination
Fiber quality characteristics are given in
Table C-1, while stickiness data is given in Table C-2.
Table C-1: Fiber quality characteristics for selected bales in the spinning tests.
Bale Ginning* Variety ML
Mm
UHML
Mm
UI% Strength
g/tex
Elong.
%
IM MR PM% H
mtex
HS
mtex
Rd% +B
AC1 S - 23.9 28.5 83.7 30.1 5.7 4.6 0.92 81.6 195 212 72.3 10.3
AC2 S - 23.9 28.8 82.9 29.0 5.6 4.7 0.92 81.3 201 219 69.2 11.1
AR02 R Acala 23.2 27.7 83.6 27.3 5.0 4.0 0.86 76.5 173 201 73.7 12.4
AR05 R Acala 22.8 27.4 83.3 27.7 4.8 3.9 0.81 72.4 176 217 72.7 12.8
AR07 R Acala 20.5 25.5 80.4 25.3 4.7 3.2 0.72 63.5 153 213 74.7 11.5
AR08 R Acala 22.4 27.1 82.6 28.4 4.7 3.6 0.78 69.9 164 209 73.5 11.9
AR14 R Acala 21.8 26.6 82.0 26.4 4.5 3.4 0.75 66.2 160 215 71.9 11.7
AR16 R Acala 21.8 26.6 81.9 27.6 4.6 3.5 0.73 64.9 168 230 73.4 11.5
AR17 R Acala 22.1 27.0 82.0 26.9 4.7 3.3 0.75 66.6 153 204 72.9 12.0
AR18 R Acala 21.5 26.2 81.9 26.9 4.5 3.4 0.75 66.2 160 215 73.4 12.1
ARNC1 R Acala 22.8 27.0 84.4 27.1 5.1 4.0 0.84 75.0 176 209 75.0 9.6
ARNC2 R Acala 23.1 27.5 83.9 26.6 5.2 3.9 0.81 72.4 176 217 73.7 9.4
AS01 S Acala 19.9 24.8 80.4 24.7 4.4 3.6 0.77 68.8 163 211 74.5 12.3
AS02 S Acala 22.0 27.2 80.8 27.9 4.8 3.4 0.80 71.2 153 192 73.2 12.0
AS04 S Acala 21.5 26.3 81.6 26.4 4.6 3.8 0,82 72.8 166 203 75.2 12.0
AS05 S Acala 22.0 27.1 81.1 27.9 4.9 3.4 0.80 71.2 153 192 75.0 12.1
AS06 S Acala 23.2 28.1 82.6 30.7 5.2 3.3 0,75 67.0 151 200 75.5 11.6
AS08 S Acala 21.0 26.3 80.0 27.5 4.7 3.3 0.77 68.7 152 197 74.0 11.9
AS09 S Acala 21.2 26.2 81.0 25.8 4.6 3.9 0.74 65.9 187 252 73.8 11.7
AS10 S Acala 21.2 26.2 80.9 26.9 4.8 3.7 0.78 69.4 168 216 75.2 11.8
AS13 S Acala 22.2 27.2 81.7 26.4 4.8 3.9 0.78 69.5 179 229 74.3 11.9
AS14 S Acala 22.5 27.6 81.4 27.6 4.8 3.7 0,79 70.5 165 208 75,4 12.0
AS15 S Acala 21.6 26.4 81.7 26.4 4.6 4.2 0.82 73.2 188 229 72.6 11.6
AS16 S Acala 22.0 27.0 81.5 27.3 4.7 3.9 0.79 70.0 178 226 76.4 10.9
AS19 S Acala 22.2 26.9 82.7 28.2 5.1 3.9 0,82 72.8 177 217 79.6 10,3
AS20 S Acala 22.4 27.1 82.7 28.1 5.1 4.0 0.81 72.1 184 227 79.1 10.0
* S: Saw ginned R: Roller ginned
Two non-sticky bales were included in the study originated from Central Asia. The remaining24 corresponded to various varieties of Acala type and had been produced in Sudan in 1996-1997. Ten of these were roller ginned and 14 were saw ginned. The cottons were selected tocover a broad range of stickiness, from non-sticky to very sticky, but with the mosthomogeneous length, fineness, maturity and strength characteristics possible. Thesecharacteristics were evaluated in 10 samples taken from each raw bale for analysis by HVI,FMT3, SCT Thermodetector and H2SD (Frydrych, 1998).

CFC / ICAC / 11 Project Technical Report on Research Activities Page 109
Table C-2: Stickiness data for the raw cottons.
SCT H2SD
Bale Raw cotton Raw cotton
AC1 0.4 0.5
AC2 0.3 0.8
AR02 14.1 9.3
AR05 30.5 17.8
AR07 14.3 15.4
AR08 19.7 23.9
AR14 34.1 37.7
AR16 30.5 41.1
AR17 52.5 42.3
AR18 39.3 38.0
ARNC1 12.8 24.0
ARNC2 12.0 21.7
AS01 13.0 20.8
AS02 55.7 43.6
AS04 13.3 18.5
AS05 62.8 61.2
AS06 39.1 49.0
AS08 43.3 42.4
AS09 12.3 23.3
AS10 30.3 29.6
AS13 17.1 21.3
AS14 20.5 36.6
AS15 32.8 57.8
AS16 9.4 17.3
AS19 7.3 13.1
AS20 8.9 15.5
Once each of the 26 bales had been characterized, the cotton was processed by industrial-scale carded spinning. The spinning facility was composed of two rooms with independentconditioning: a preparation room and a spinning room. The cotton fiber was processedsuccessively by the following machines:
• Bale breaker (LAROCHE)
• Opener-cleaner (TRÜTZSCHLER RN)
• Opener-mixer (TRÜTZSCHLER RSK)
• Card (TRÜTZSCHLER DK 715)
• Drawing frame (RIETER D1/1)

CFC / ICAC / 11 Project Technical Report on Research Activities Page 110
• Roving frame (RIETER F1/1a)
• Ring spinning frame (SACM CF-6)
• Rotor spinning frame (SCHLAFHORST SE-9)
• Winder
C.1.2.3. Conditions and operating procedure
The order in which the bales were processed was randomized to avoid any bias in theinterpretation of the results. Before actually starting the processing, the bale was homogenizedby recycling between the RN opener and the LAROCHE breaker. This reduced the naturalvariability within each bale and thus improved the precision of the relationships betweenstickiness and spinning incidents. Once the homogenization was complete, the bale enteredproduction at a temperature of 25 ± 2°C and a relative humidity of 47.5 ± 2.5%. Thesehygrometric conditions correspond to those generally recommended for preparation. The cardwas set to a delivery speed of 120 m/min to produce a 5 ktex sliver. At the first drafting pass,the doubling was set at 6, sliver count at 4 ktex and delivery speed at 400 m/min. For thesecond drafting pass, only the doubling was modified, to 8. The 24 spindles on the rovingframe were set at 900 rpm to produce a 0.5 ktex roving. The sliver and roving were thentransferred to the spinning room where atmospheric conditions consisted of a temperature of25 ± 2°C and a relative humidity of 57.5 ± 2.5%. The ring spinning frame, with 100 spindlesspinning at 8000 rpm, and the rotor spinning frame with 24 rotors spinning at 90000 rpm wereset to produce 20 tex yarn with twist of 800 rpm.
During the spinning of each bale, the number of breaks, fiber wraps and stoppages forcleaning were recorded for each machine used. These incidents were then listed with respectto the part of the machine where they occurred and their cause. Thus, three principal types ofincident were recorded for the card: breakage of the web, breakage of the sliver at thecondenser and breakage of the sliver at the can coiler. Breakage were noted on the drawingframe at the feed creel, the roller drafting and the sliver condenser. Breakage on the rovingframe were noted at the feed creel, the roller drafting and the flyer. Only two types ofbreakage could be monitored on the ring spinning frame: those concerning the roving andthose the yarn. By contrast, several different incidents were possible on the rotor spinningframe. The number of yarn piecing and the efficiency at each step of the process could bedetermined thanks to the on-line management of the production. In addition to theseautomated recordings, the number of times the technician intervened in the process was alsorecorded for the four main structures in the process, i.e. the feed cylinder, the taker-in, therotor and the yarn navel (Table C-1).
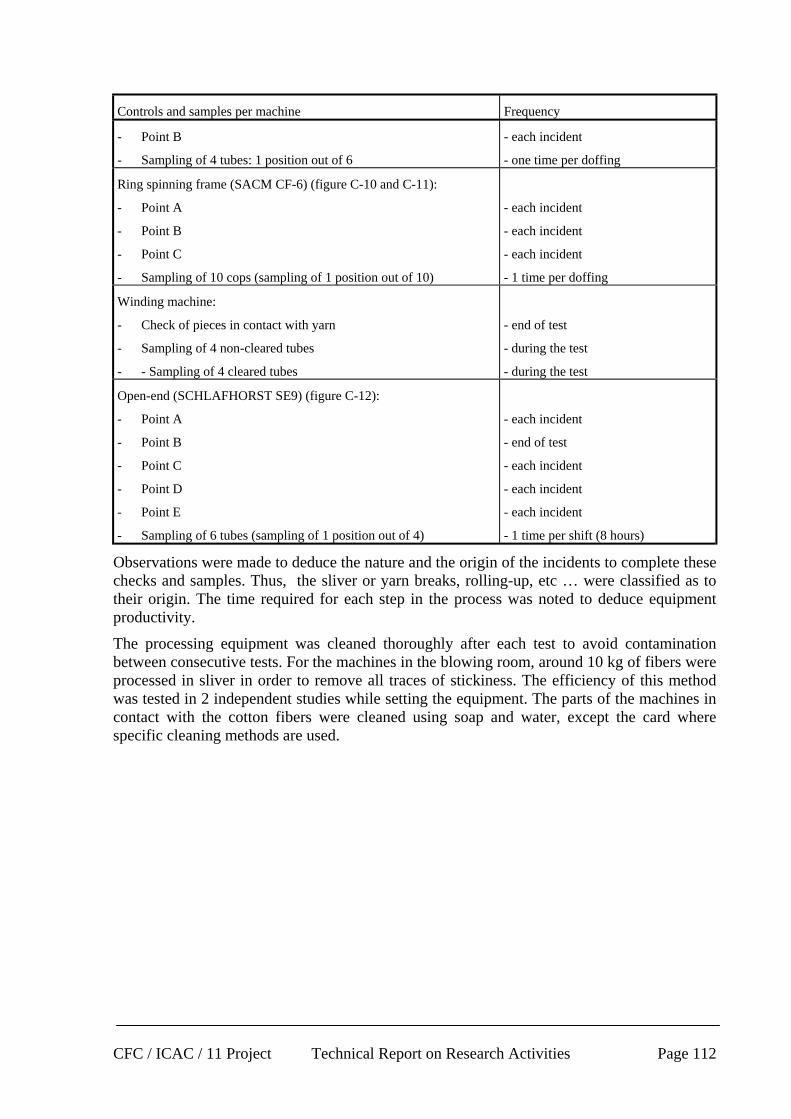
Table C-1: Frequency and list of machine check points.
Controls and samples per machine Frequency
LAROCHE Bale breaker (figure C-1):
- Point A
- Point B
- Point C
- Point D
- Point E
- Point F
- end of test
- end of test
- end of test
- end of test
- end of test
- end of test
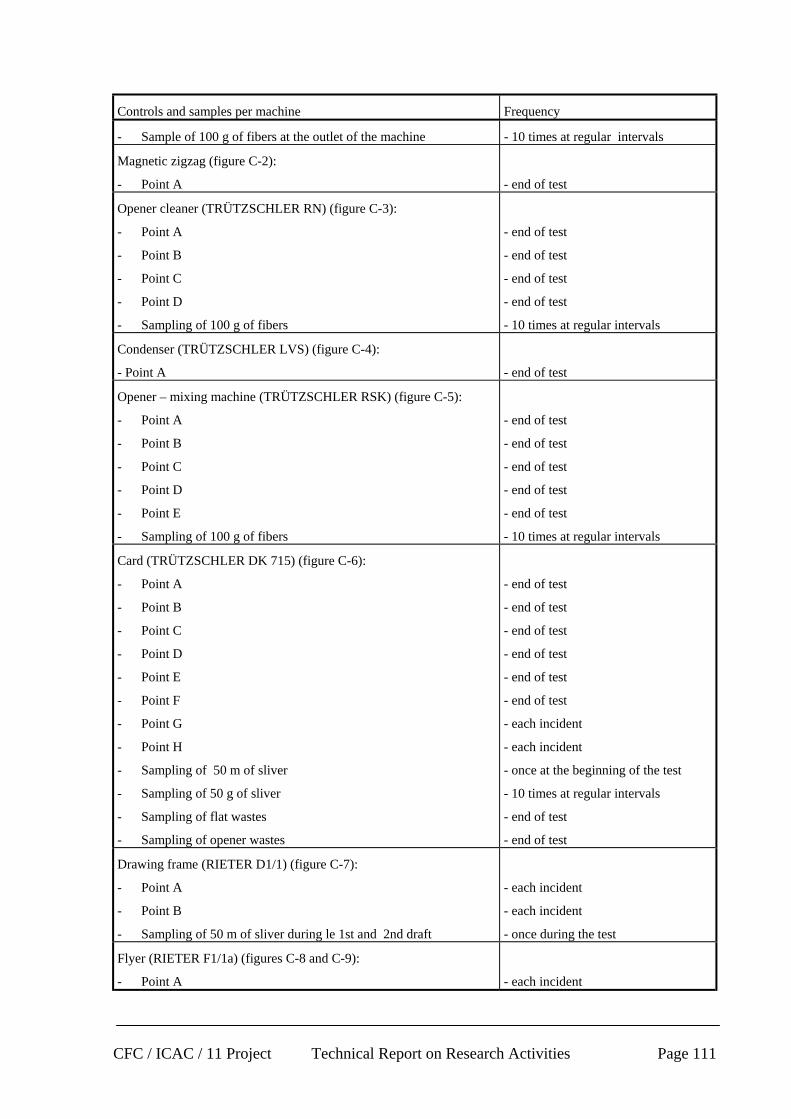
CFC / ICAC / 11 Project Technical Report on Research Activities Page 111
Controls and samples per machine Frequency
- Sample of 100 g of fibers at the outlet of the machine - 10 times at regular intervals
Magnetic zigzag (figure C-2):
- Point A - end of test
Opener cleaner (TRÜTZSCHLER RN) (figure C-3):
- Point A
- Point B
- Point C
- Point D
- Sampling of 100 g of fibers
- end of test
- end of test
- end of test
- end of test
- 10 times at regular intervals
Condenser (TRÜTZSCHLER LVS) (figure C-4):
- Point A - end of test
Opener – mixing machine (TRÜTZSCHLER RSK) (figure C-5):
- Point A
- Point B
- Point C
- Point D
- Point E
- Sampling of 100 g of fibers
- end of test
- end of test
- end of test
- end of test
- end of test
- 10 times at regular intervals
Card (TRÜTZSCHLER DK 715) (figure C-6):
- Point A
- Point B
- Point C
- Point D
- Point E
- Point F
- Point G
- Point H
- Sampling of 50 m of sliver
- Sampling of 50 g of sliver
- Sampling of flat wastes
- Sampling of opener wastes
- end of test
- end of test
- end of test
- end of test
- end of test
- end of test
- each incident
- each incident
- once at the beginning of the test
- 10 times at regular intervals
- end of test
- end of test
Drawing frame (RIETER D1/1) (figure C-7):
- Point A
- Point B
- Sampling of 50 m of sliver during le 1st and 2nd draft
- each incident
- each incident
- once during the test
Flyer (RIETER F1/1a) (figures C-8 and C-9):
- Point A - each incident
CFC / ICAC / 11 Project Technical Report on Research Activities Page 112
Controls and samples per machine Frequency
- Point B
- Sampling of 4 tubes: 1 position out of 6
- each incident
- one time per doffing
Ring spinning frame (SACM CF-6) (figure C-10 and C-11):
- Point A
- Point B
- Point C
- Sampling of 10 cops (sampling of 1 position out of 10)
- each incident
- each incident
- each incident
- 1 time per doffing
Winding machine:
- Check of pieces in contact with yarn
- Sampling of 4 non-cleared tubes
- - Sampling of 4 cleared tubes
- end of test
- during the test
- during the test
Open-end (SCHLAFHORST SE9) (figure C-12):
- Point A
- Point B
- Point C
- Point D
- Point E
- Sampling of 6 tubes (sampling of 1 position out of 4)
- each incident
- end of test
- each incident
- each incident
- each incident
- 1 time per shift (8 hours)
Observations were made to deduce the nature and the origin of the incidents to complete thesechecks and samples. Thus, the sliver or yarn breaks, rolling-up, etc … were classified as totheir origin. The time required for each step in the process was noted to deduce equipmentproductivity.
The processing equipment was cleaned thoroughly after each test to avoid contaminationbetween consecutive tests. For the machines in the blowing room, around 10 kg of fibers wereprocessed in sliver in order to remove all traces of stickiness. The efficiency of this methodwas tested in 2 independent studies while setting the equipment. The parts of the machines incontact with the cotton fibers were cleaned using soap and water, except the card wherespecific cleaning methods are used.

CFC / ICAC / 11 Project Technical Report on Research Activities Page 113
Figure C-1: Check of the bale breaker.
Figure C-2: Check of the magnetic zigzag.
Figure C-3: Check of the RN openercleaner.
Figure C-4: Check of the LVS condenser.

CFC / ICAC / 11 Project Technical Report on Research Activities Page 114
Figure C-5: Check of the RSK openermixing machine.
Figure C-6: Check of the card.
Figure C-7: Check of the drawing frame.
Figure C-8: Check of the flyer.

CFC / ICAC / 11 Project Technical Report on Research Activities Page 115
Figure C-9: Check of the drafting zone onthe flyer.
Figure C-10: Check of the ring spinningframe.
Figure C-11: Check of the ring spinningposition.
Figure C-12: Check of the open-endspinning position.

CFC / ICAC / 11 Project Technical Report on Research Activities Page 116
The results were used to calculate the breakage incidence and the efficiency of the differentmachines. Breakage incidence was expressed by unit length of the roving, sliver or yarn toavoid any effects caused by machine stoppages. Thus, when considering the card, totalbreakage corresponded to the number of breaks per 100 km of sliver. This number is thereforeequivalent to the hourly breakage rate in a card room containing fourteen machines. Thebreaks on the drawing frame were also expressed for 100 km of sliver, i.e. equivalent to thehourly breakage rate of two machines working at 800 m/min. The breakage rate of the rovingframe was calculated for 100 km of roving, equivalent to the hourly breakage rate for 100spindles (i.e. approximately two roving frames with 48 spindles each). Breaks were expressedper 1000 spindles hour for the ring spinning frame and per 240 rotors hour for the rotorspinning frame.
These productivity parameters were then compared with stickiness results determined usingthree different methods:
• SCT thermodetector measuring the number of sticky points (SCT),
• H2SD measuring the number of sticky points (H2SD), their total size (Size-H2SD) andtheir size category (Small, Medium and Large),
• HPLC measuring the content of the different sugars: Inositol (I), Trehalose (T), Glucose(G), Fructose (F), Trehalulose (W), Melezitose (M) and Sucrose (S).
Table C-2: Main sampling and quality evaluations.
Machine Sample Test Number of measures
10 fiber samples (100 g) Stickiness SCT
Stickiness H2SD
1 mes./sample
1 mes./sample
LAROCHE Bale breaker
1 waste sample Stickiness SCT 3 mes./sample
10 fiber samples (100 g) Stickiness SCT
Stickiness H2SD
1 mes./sample
1 mes./sample
RN Opener cleaner
1 waste sample Stickiness SCT 3 mes./sample
10 finer samples (100 g) Stickiness SCT
Stickiness H2SD
Sugars HPLC
1 mes./sample
1 mes./sample
3 mes./test
RSK Opener mixer
2 waste samples Stickiness SCT 3 mes./sample
10 fiber samples (100 g) Stickiness SCT
Stickiness H2SD
1 mes./sample
1 mes./sample
2 sliver samples (50 m) CV% UT3 1 mes./sample
DK 715 Card
2 waste samples Stickiness SCT 3 mes./sample
Drawing frame 2 sliver samples (50 m) CV% UT3 1 mes./sample
Flyer 4 bobbins per doffing CV% UT3 1 mes/bobbin/doffing

CFC / ICAC / 11 Project Technical Report on Research Activities Page 117
Machine Sample Test Number of measures
CV% UT3
Thin –50%
Thick +50%
Neps +200%
Yarn count
Hairiness
1 mes. UT3 on 1000 mper cop and per doffing
Ring spinning frame 10 cops per doffing
Strength g/tex
Elongation%
Work to break
10 breaks Tensorapid 3per cop and per doffing
CV% UT3
Thin –50%
Thick +50%
Neps +280%
Yarn count
Hairiness
1 mes. UT3 on 1000 mper bobbin and per day
6 bobbins per day
Strength g/tex
Elongation%
Work to break
10 breaks Tensorapid 3per cop and per doffing
Defaults CLASSIMAT 1 mes. Per test
Open-end
1 bobbin per day
Detailed analysis 1 mes. on 2000 m perbobbin and per day
CV% UT3
Thin –50%
Thick +50%
Neps +200%
Yarn count
Hairiness
1 mes. UT3 on 1000 mper bobbin
4 cleared bobbins
Strength g/tex
Elongation%
Work to break
10 breaks Tensorapid3 percop and per doffing
Winder
4 non-cleared bobbins CV% UT3
Thin –50%
Thick +50%
Neps +200%
Yarn count
Hairiness
1 mes. UT3 on 1000 mper bobbin

CFC / ICAC / 11 Project Technical Report on Research Activities Page 118
Machine Sample Test Number of measures
Strength g/tex
Elongation%
Work to break
1 mes.Tensorapid3 on1000 m per bobbin
Detailed analysis UT3 1 mes. per bobbin
Defects CLASSIMAT 1 mes. per test
Samples of cotton-fiber, sliver, roving, yarn and waste were taken to evaluate the effects ofthe stickiness of the quality of these products (Table C-2). Thus, ten fiber samples were takenat regular intervals from the breaker, RN opener, RSK opener and the card. These sampleswere analyzed on the SCT and H2SD thermodetector to evaluate stickiness at the differentsteps of the process. In addition, RSK samples were analyzed by HPLC. Samples of sliver androving were used to evaluate regularity at the card, drawing frame and roving frame. Yarnquality was evaluated in samples taken from the yarn bobbins and packages.
C.1.3. Results and Discussion: effect on productivity
It should be noted that 2 bales (AS15 and AR17) could not be processed under these normalconditions. The results were therefore based on 24 bales. A specific study was conducted on2 bales in very low relative humidity. The results of this experiment are described inparagraph C.2.
C.1.3.1. Choice of the best predictor of stickiness problem during spinning
Since stickiness appears to be worsening, detection methods appear with a strong effort todecrease the time consumption of the test.
Recently-acquired knowledge has improved our understanding of the role played by differentsugars in the stickiness effect during spinning. It is now recognized that simple chemical testsare not predictive of the problems encountered during spinning.
Since 1994, the ITMF (International Textiles Manufacturers Federation) committee has beenrecommending the SCT test for the stickiness evaluation on fiber samples (Reference ITMF:420/94).
When research described here was conducted, no reliable relations between stickinessmeasurements and disruptions during spinning had been published. Indeed, cottons wereclassified as ‘non-sticky’, ‘lightly sticky’, .. to ‘heavily sticky’. These classes were obtainedby linking SCT results to mini-card grading systems (Frydrych, 1996), and did not predict theextent of the disruptions encountered during industrial spinning.
We therefore attempted to define a stickiness indicator based on quantitative determinations.We then compared the three main methods of measuring stickiness (SCT, H2SD, sugars byHPLC) and matched these to productivity and quality criteria. First, the data from these threetechniques was analyzed and compared.
C.1.3.2. Relations between SCT, H2SD and HPLC results
If relations between SCT and H2SD data are well-known, it is interesting to compare theseresults to sugar content as measured by HPLC. This may help get a better prediction of theproblems during spinning
Table C–6 and Table C-2 give the results and the correlation coefficients observed between

CFC / ICAC / 11 Project Technical Report on Research Activities Page 119
stickiness and sugar measurements on samples taken at the RSK opener:
- H2SD: number of sticky points measured by H2SD (H2SD counting);
- Small: number of sticky points whose size, measured by H2SD, is in the range [1,7; 9]mm²;
- Medium: number of sticky points whose size, measured by H2SD, is in the range [9; 18]mm²;
- Large: number of sticky points whose size, measured by H2SD, is larger than > 18 mm²;
- TMH2SD : mean size of the sticky points as measured by H2SD;
- TTH2SD : total size (sum of the sizes measured by H2SD);
- SCT : number of sticky points as measured by SCT (SCT counting);
- I : percentage of inositol (% of the fiber mass) measured by HPLC;
- T : percentage of trehalose (% of the fiber mass) measured by HPLC;
- G : percentage of glucose (% of the fiber mass) measured by HPLC;
- F : percentage of fructose (% of the fiber mass) measured by HPLC;
- W : percentage of trehalulose (% of the fiber mass) measured by HPLC;
- S : percentage of saccharose (% of the fiber mass) measured by HPLC;
- M : percentage of melezitose (% of the fiber mass) measured by HPLC;
- Stotal : total percentage of sugars I, T, G, F, W, S and M (% of the fiber mass) .
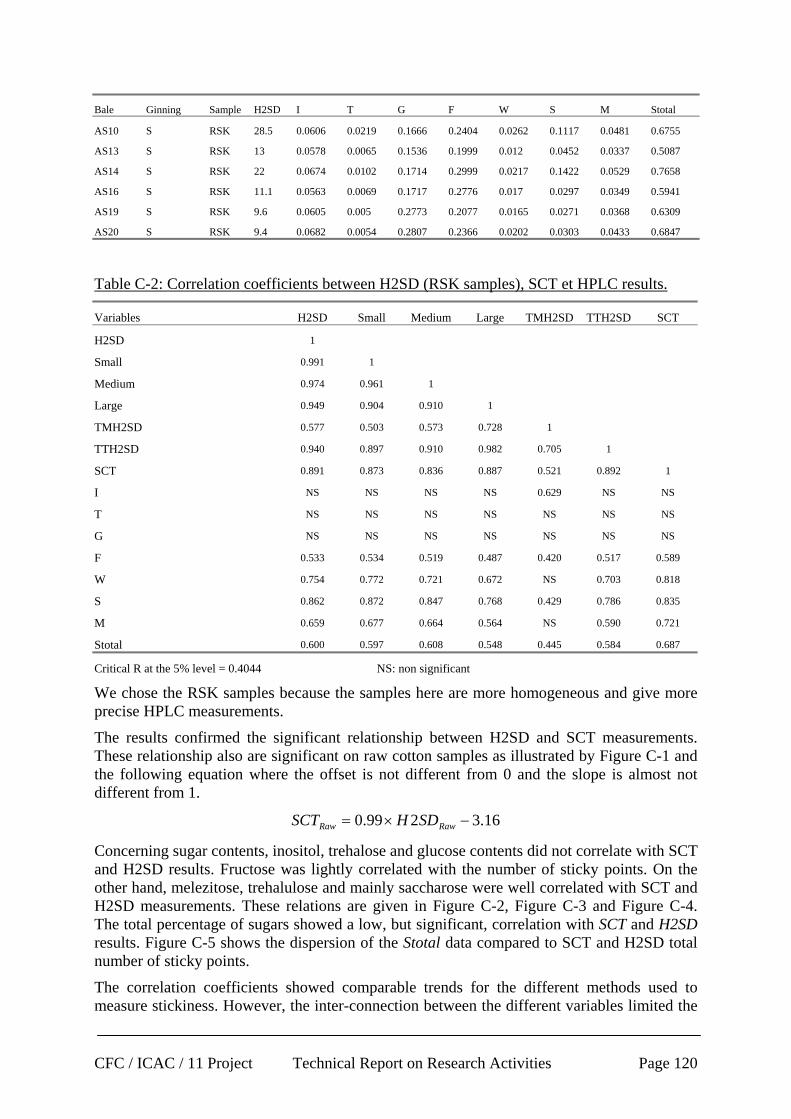
Table C-1: HPLC results.
Bale Ginning Sample H2SD I T G F W S M Stotal
AC1 S RSK 3.1 0.0302 0.0539 0.1061 0.0988 0.0087 0.0064 0.0393 0.3435
AC2 S RSK 1.4 0.0269 0.0335 0.0797 0.0836 0.0032 0.0129 0.0295 0.2693
AR02 R RSK 8.6 0.0643 0.0039 0.1527 0.2366 0.0194 0.0541 0.0442 0.5753
AR05 R RSK 24.3 0.0639 0.0109 0.1567 0.2735 0.0324 0.1025 0.0557 0.6955
AR07 R RSK 16.2 0.0469 0.0058 0.0836 0.0984 0.0277 0.0426 0.0267 0.3317
AR08 R RSK 24.4 0.0523 0.0062 0.127 0.1863 0.0424 0.0741 0.0425 0.5308
AR14 R RSK 22.3 0.0575 0.0091 0.1637 0.235 0.0462 0.1108 0.0532 0.6755
AR16 R RSK 28.8 0.0517 0.0114 0.1127 0.1643 0.0271 0.0636 0.0422 0.473
AR18 R RSK 34.5 0.0542 0.0073 0.1025 0.1574 0.0104 0.0601 0.0321 0.424
ARNC1 R RSK 8 0.0631 0.0074 0.2434 0.1921 0.0196 0.0303 0.0413 0.5971
ARNC2 R RSK 11 0.0604 0.0073 0.225 0.1763 0.0128 0.0229 0.0362 0.541
AS01 S RSK 16.4 0.0584 0.0147 0.1286 0.1475 0.0032 0.0308 0.0309 0.4141
AS02 S RSK 37.3 0.0647 0.0179 0.1659 0.2858 0.0467 0.1482 0.0641 0.7934
AS04 S RSK 14.6 0.065 0.0174 0.135 0.212 0.0099 0.0558 0.0373 0.5325
AS05 S RSK 49.5 0.0593 0.0117 0.2159 0.3466 0.094 0.1836 0.0635 0.9745
AS06 S RSK 31.9 0.0631 0.0091 0.1577 0.2545 0.0767 0.1082 0.0576 0.7269
AS08 S RSK 29.2 0.0608 0.0172 0.1105 0.1757 0.0297 0.117 0.0448 0.5557
AS09 S RSK 12.9 0.063 0.0223 0.1246 0.163 0.0144 0.0422 0.0405 0.4701
CFC / ICAC / 11 Project Technical Report on Research Activities Page 120
Bale Ginning Sample H2SD I T G F W S M Stotal
AS10 S RSK 28.5 0.0606 0.0219 0.1666 0.2404 0.0262 0.1117 0.0481 0.6755
AS13 S RSK 13 0.0578 0.0065 0.1536 0.1999 0.012 0.0452 0.0337 0.5087
AS14 S RSK 22 0.0674 0.0102 0.1714 0.2999 0.0217 0.1422 0.0529 0.7658
AS16 S RSK 11.1 0.0563 0.0069 0.1717 0.2776 0.017 0.0297 0.0349 0.5941
AS19 S RSK 9.6 0.0605 0.005 0.2773 0.2077 0.0165 0.0271 0.0368 0.6309
AS20 S RSK 9.4 0.0682 0.0054 0.2807 0.2366 0.0202 0.0303 0.0433 0.6847
Table C-2: Correlation coefficients between H2SD (RSK samples), SCT et HPLC results.
Variables H2SD Small Medium Large TMH2SD TTH2SD SCT
H2SD 1
Small 0.991 1
Medium 0.974 0.961 1
Large 0.949 0.904 0.910 1
TMH2SD 0.577 0.503 0.573 0.728 1
TTH2SD 0.940 0.897 0.910 0.982 0.705 1
SCT 0.891 0.873 0.836 0.887 0.521 0.892 1
I NS NS NS NS 0.629 NS NS
T NS NS NS NS NS NS NS
G NS NS NS NS NS NS NS
F 0.533 0.534 0.519 0.487 0.420 0.517 0.589
W 0.754 0.772 0.721 0.672 NS 0.703 0.818
S 0.862 0.872 0.847 0.768 0.429 0.786 0.835
M 0.659 0.677 0.664 0.564 NS 0.590 0.721
Stotal 0.600 0.597 0.608 0.548 0.445 0.584 0.687
Critical R at the 5% level = 0.4044 NS: non significant
We chose the RSK samples because the samples here are more homogeneous and give moreprecise HPLC measurements.
The results confirmed the significant relationship between H2SD and SCT measurements.These relationship also are significant on raw cotton samples as illustrated by Figure C-1 andthe following equation where the offset is not different from 0 and the slope is almost notdifferent from 1.
16.3299.0 −×= RawRaw SDHSCT
Concerning sugar contents, inositol, trehalose and glucose contents did not correlate with SCTand H2SD results. Fructose was lightly correlated with the number of sticky points. On theother hand, melezitose, trehalulose and mainly saccharose were well correlated with SCT andH2SD measurements. These relations are given in Figure C-2, Figure C-3 and Figure C-4.The total percentage of sugars showed a low, but significant, correlation with SCT and H2SDresults. Figure C-5 shows the dispersion of the Stotal data compared to SCT and H2SD totalnumber of sticky points.
The correlation coefficients showed comparable trends for the different methods used tomeasure stickiness. However, the inter-connection between the different variables limited the

CFC / ICAC / 11 Project Technical Report on Research Activities Page 121
complementarity of these measurements. Thus, we will probably have to choose only onecriterion to measure stickiness and predict its effect during spinning.
C.1.3.3. What is the best indicator ?
By best indicator, we mean the measurement that gives the best correlation coefficient withthe disruptions observed during spinning, for both productivity and quality parameters.
Efficiencies and breakages were calculated for all the machines. Breakages were expressedper unit length of produce (sliver, …, yarn) to be independent of time and operator know-how. Thus, breakages provide information about productivity that is completed by machineefficiency, the latter being dependent on operator work-load.
Different breakage rates were calculated depending on machine type, the nature of the breaksand on their causes . However, to simplify the presentation of the results, only efficiencies andbreakages are presented here
Quality-wise, the characterization of the samples collected in the course of the processprovides information about yarn evenness, imperfections, and resistance parameters from thesliver to the yarn in most of the cases.
These results were matched to the stickiness determination performed on RSK samples. Thefibers are well mixed at this point and these samples are therefore representative of the rawmaterial with low variability of the stickiness within the fibers. This can be observed in TableC-1 where the dispersion indexes (ratio of the variance to the mean) are reported for each stepin the process where samples can be taken for stickiness measurements. The best place to getsamples for both measuring devices is the RSK opener-mixer.
Table C-1: Over-dispersion index of the SCT and H2SD number of sticky points at differentoperating levels.
SCT H2SD
Raw cotton 3.01 4.40
Laroche Opener 2.11 2.71
RN Opener Cleaner 2.27 2.13
RSK Opener mixer 1.75 1.93
Card sliver 2.44 1.20
In parallel to the comparison between the SCT and H2SD number of sticky points, we alsocompared the quality and productivity parameters with the parameters described in Table C-2
Correlation coefficients between stickiness measurements and productivity parameters aregiven in Table C-2
Correlation coefficients between stickiness measurement and quality parameters are given inTable C-3
CFC / ICAC / 11 Project Technical Report on Research Activities Page 122
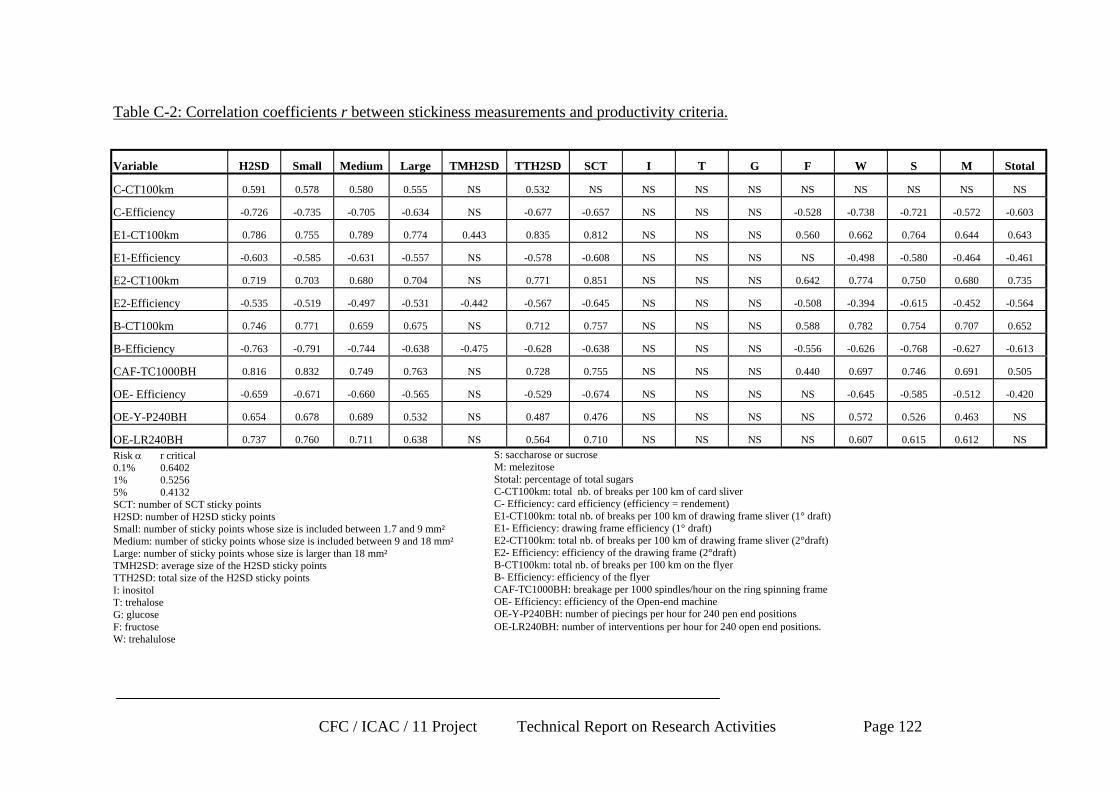
Table C-2: Correlation coefficients r between stickiness measurements and productivity criteria.
Variable H2SD Small Medium Large TMH2SD TTH2SD SCT I T G F W S M Stotal
C-CT100km 0.591 0.578 0.580 0.555 NS 0.532 NS NS NS NS NS NS NS NS NS
C-Efficiency -0.726 -0.735 -0.705 -0.634 NS -0.677 -0.657 NS NS NS -0.528 -0.738 -0.721 -0.572 -0.603
E1-CT100km 0.786 0.755 0.789 0.774 0.443 0.835 0.812 NS NS NS 0.560 0.662 0.764 0.644 0.643
E1-Efficiency -0.603 -0.585 -0.631 -0.557 NS -0.578 -0.608 NS NS NS NS -0.498 -0.580 -0.464 -0.461
E2-CT100km 0.719 0.703 0.680 0.704 NS 0.771 0.851 NS NS NS 0.642 0.774 0.750 0.680 0.735
E2-Efficiency -0.535 -0.519 -0.497 -0.531 -0.442 -0.567 -0.645 NS NS NS -0.508 -0.394 -0.615 -0.452 -0.564
B-CT100km 0.746 0.771 0.659 0.675 NS 0.712 0.757 NS NS NS 0.588 0.782 0.754 0.707 0.652
B-Efficiency -0.763 -0.791 -0.744 -0.638 -0.475 -0.628 -0.638 NS NS NS -0.556 -0.626 -0.768 -0.627 -0.613
CAF-TC1000BH 0.816 0.832 0.749 0.763 NS 0.728 0.755 NS NS NS 0.440 0.697 0.746 0.691 0.505
OE- Efficiency -0.659 -0.671 -0.660 -0.565 NS -0.529 -0.674 NS NS NS NS -0.645 -0.585 -0.512 -0.420
OE-Y-P240BH 0.654 0.678 0.689 0.532 NS 0.487 0.476 NS NS NS NS 0.572 0.526 0.463 NS
OE-LR240BH 0.737 0.760 0.711 0.638 NS 0.564 0.710 NS NS NS NS 0.607 0.615 0.612 NS
Risk α r critical0.1% 0.64021% 0.52565% 0.4132SCT: number of SCT sticky pointsH2SD: number of H2SD sticky pointsSmall: number of sticky points whose size is included between 1.7 and 9 mm²Medium: number of sticky points whose size is included between 9 and 18 mm²Large: number of sticky points whose size is larger than 18 mm²TMH2SD: average size of the H2SD sticky pointsTTH2SD: total size of the H2SD sticky pointsI: inositolT: trehaloseG: glucoseF: fructoseW: trehalulose
S: saccharose or sucroseM: melezitoseStotal: percentage of total sugarsC-CT100km: total nb. of breaks per 100 km of card sliverC- Efficiency: card efficiency (efficiency = rendement)E1-CT100km: total nb. of breaks per 100 km of drawing frame sliver (1° draft)E1- Efficiency: drawing frame efficiency (1° draft)E2-CT100km: total nb. of breaks per 100 km of drawing frame sliver (2°draft)E2- Efficiency: efficiency of the drawing frame (2°draft)B-CT100km: total nb. of breaks per 100 km on the flyerB- Efficiency: efficiency of the flyerCAF-TC1000BH: breakage per 1000 spindles/hour on the ring spinning frameOE- Efficiency: efficiency of the Open-end machineOE-Y-P240BH: number of piecings per hour for 240 pen end positionsOE-LR240BH: number of interventions per hour for 240 open end positions.
CFC / ICAC / 11 Project Technical Report on Research Activities Page 123
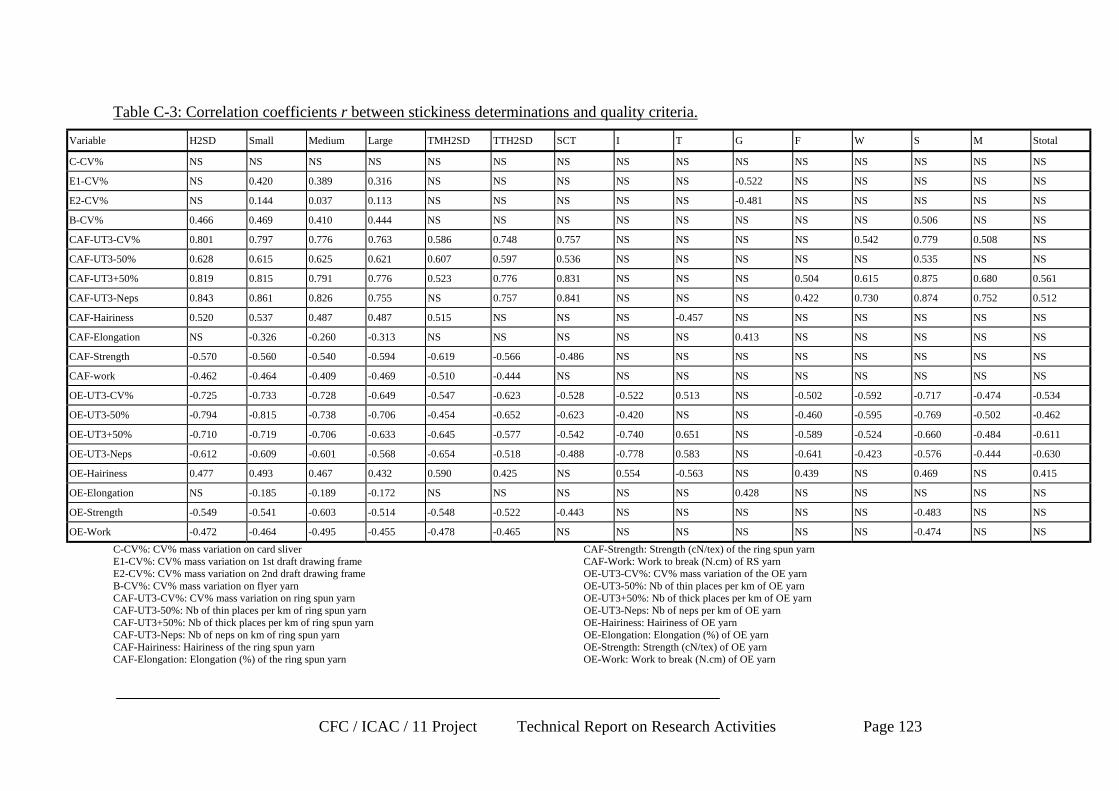
Table C-3: Correlation coefficients r between stickiness determinations and quality criteria.
Variable H2SD Small Medium Large TMH2SD TTH2SD SCT I T G F W S M Stotal
C-CV% NS NS NS NS NS NS NS NS NS NS NS NS NS NS NS
E1-CV% NS 0.420 0.389 0.316 NS NS NS NS NS -0.522 NS NS NS NS NS
E2-CV% NS 0.144 0.037 0.113 NS NS NS NS NS -0.481 NS NS NS NS NS
B-CV% 0.466 0.469 0.410 0.444 NS NS NS NS NS NS NS NS 0.506 NS NS
CAF-UT3-CV% 0.801 0.797 0.776 0.763 0.586 0.748 0.757 NS NS NS NS 0.542 0.779 0.508 NS
CAF-UT3-50% 0.628 0.615 0.625 0.621 0.607 0.597 0.536 NS NS NS NS NS 0.535 NS NS
CAF-UT3+50% 0.819 0.815 0.791 0.776 0.523 0.776 0.831 NS NS NS 0.504 0.615 0.875 0.680 0.561
CAF-UT3-Neps 0.843 0.861 0.826 0.755 NS 0.757 0.841 NS NS NS 0.422 0.730 0.874 0.752 0.512
CAF-Hairiness 0.520 0.537 0.487 0.487 0.515 NS NS NS -0.457 NS NS NS NS NS NS
CAF-Elongation NS -0.326 -0.260 -0.313 NS NS NS NS NS 0.413 NS NS NS NS NS
CAF-Strength -0.570 -0.560 -0.540 -0.594 -0.619 -0.566 -0.486 NS NS NS NS NS NS NS NS
CAF-work -0.462 -0.464 -0.409 -0.469 -0.510 -0.444 NS NS NS NS NS NS NS NS NS
OE-UT3-CV% -0.725 -0.733 -0.728 -0.649 -0.547 -0.623 -0.528 -0.522 0.513 NS -0.502 -0.592 -0.717 -0.474 -0.534
OE-UT3-50% -0.794 -0.815 -0.738 -0.706 -0.454 -0.652 -0.623 -0.420 NS NS -0.460 -0.595 -0.769 -0.502 -0.462
OE-UT3+50% -0.710 -0.719 -0.706 -0.633 -0.645 -0.577 -0.542 -0.740 0.651 NS -0.589 -0.524 -0.660 -0.484 -0.611
OE-UT3-Neps -0.612 -0.609 -0.601 -0.568 -0.654 -0.518 -0.488 -0.778 0.583 NS -0.641 -0.423 -0.576 -0.444 -0.630
OE-Hairiness 0.477 0.493 0.467 0.432 0.590 0.425 NS 0.554 -0.563 NS 0.439 NS 0.469 NS 0.415
OE-Elongation NS -0.185 -0.189 -0.172 NS NS NS NS NS 0.428 NS NS NS NS NS
OE-Strength -0.549 -0.541 -0.603 -0.514 -0.548 -0.522 -0.443 NS NS NS NS NS -0.483 NS NS
OE-Work -0.472 -0.464 -0.495 -0.455 -0.478 -0.465 NS NS NS NS NS NS -0.474 NS NS
C-CV%: CV% mass variation on card sliverE1-CV%: CV% mass variation on 1st draft drawing frameE2-CV%: CV% mass variation on 2nd draft drawing frameB-CV%: CV% mass variation on flyer yarnCAF-UT3-CV%: CV% mass variation on ring spun yarnCAF-UT3-50%: Nb of thin places per km of ring spun yarnCAF-UT3+50%: Nb of thick places per km of ring spun yarnCAF-UT3-Neps: Nb of neps on km of ring spun yarnCAF-Hairiness: Hairiness of the ring spun yarnCAF-Elongation: Elongation (%) of the ring spun yarn
CAF-Strength: Strength (cN/tex) of the ring spun yarnCAF-Work: Work to break (N.cm) of RS yarnOE-UT3-CV%: CV% mass variation of the OE yarnOE-UT3-50%: Nb of thin places per km of OE yarnOE-UT3+50%: Nb of thick places per km of OE yarnOE-UT3-Neps: Nb of neps per km of OE yarnOE-Hairiness: Hairiness of OE yarnOE-Elongation: Elongation (%) of OE yarnOE-Strength: Strength (cN/tex) of OE yarnOE-Work: Work to break (N.cm) of OE yarn

CFC / ICAC / 11 Project Technical Report on Research Activities Page 124
The correlation coefficients show that the number of sticky points measured by SCT, thenumber measured by H2SD and the percentage of melezitose, trehalulose and saccharose arecorrelated with most of the productivity parameters in the spinning mill. Concerning thesticky point sizes, the 3 classes (small, medium and large) and the total size of the stickypoints (TTH2SD) show a comparable to the number of sticky points measured by H2SD. Onthe other hand, the average TMH2SD size was rarely significantly linked to spinningparameters.
The different types of sugars included on the cotton fibers were characterized by HPLC. Thetotal amount of sugar (Stotal, expressed in percent of the fiber sample) was distributed for thecottons used in this experiment as illustrated by Figure C-6.The darker bars corresponds to thecotton considered as non sticky from Central Asia.
HPLC assayed the individual sugars given here in percent of the sample mass (Figure C-7,includes Central Asia cottons). When the different sugar types were compared withoutCentral Asia (Figure C-8) or with these cottons (Figure C-9), significant differences appeared.From the bibliography, we know that some sugars are constituent of both entomological andphysiological sugars. It is also known that insect honeydew from Aphids or White flies aredifferent in terms of sugars types. However, from these characterization results, it is notpossible to deduce the true origin of the honeydew. It may be from Aphids, white flies and/orphysiological sugars.
For the last type of sugars, we know that they may degrade over a short period of time(Hequet, 1999). The spinning experiments were done on a period of time that could have beenlonger than the degradation period of theses physiological sugars, inducing a possible bias insome recorded conclusions.
Melezitose and trehalulose are important to analyse since there are considered as main sugarsinvolved in entomological sugars. On the other hand, saccharose could not explain alone thestickiness during spinning because it is linked to physiological sugars (Hequet & Wyatt1999).
Hendrix et al (1992) analyzed A. gossypii and B. tabacci honeydew using HPLC methodology(Table C-4).
Table C-4: Sugar content (%) of insect honeydew by HPLC (Hendrix et al, 1992).
Insect Monosaccharides Sucrose Turanose Trehalulose Melezitose
A. gossypii on G.hirsutum
B. tabaci on G. hirsutum
24.6
18.9
11.6
16.0
0.0
1.0
1.1
43.8
38.3
16.8
From this table, and if only Melezitose and Trehalulose are considered, it can be seen that A.gossypii mostly contains Melezitose (97%) and some Trehalulose (3%) whereas B. tabaci,honeydew contains more Trehalulose (72%) than Melezitose (38%). All honeydew depositscontain relative high levels of monosaccharides (glucose and fructose) and bisaccharides(sucrose).
All cottons in this project contained Melezitoze and Trehalulose (Table C-1). This indicatesthat these cottons were contaminated by whiteflies at least, and maybe by Aphids + whiteflies.Only one bale was possibly contaminated by Aphids alone. Thus, conclusion can be drawnabout the type of infestation solely from the sugar contents, without any information availablefrom the field.
CFC / ICAC / 11 Project Technical Report on Research Activities Page 125
The bales from Central Asia (AC1 and AC2) contained less physiological sugars (glucose andfructose) than Sudanese bales. In this experiment, we were not able to obtain non-sticky balesfrom Sudan. Thus, we cannot deduce any effect of physiological sugars compared toentomological sugar to the stickiness potential manifestation. However, it was noted thatstickiness increased with the sucrose content.
It should be noted that physiological sugars may disappear over time (Hequet, 1999).
A comparison of the number of H2SD sticky points with the melezitose and trehalulosecontents underlined the advantages of the H2SD readings. Indeed, the best correlationcoefficients to productivity and quality parameters were obtained with H2SD. Correlationcoefficients with melezitose and trehalulose contents were rarely higher than with the H2SDcount, and these sugars did not correlate to all the parameters that correlated with H2SD
As far as disruptions during spinning are concerned, the HPLC results did not provide anysupplementary information beyond that furnished by the H2SD and SCT counts. In view ofthe time and cost of the HPLC analysis, the choice of predictive method is therefore betweenH2SD and SCT. Because of its cost and the operator effect, SCT is not entirely suitable forprecise and reproducible measurements. Thus, H2SD seems to be the most appropriatemethod for measuring stickiness in our research. However, in some cases in the below text,some relations will be given with other stickiness estimators.
C.1.3.4. Contribution of sticky point sizes in the expression of stickiness during spinning
Based on the assumption that a large sticky point will not induce the same disruption as asmall point, the sticky point were divided into 3 categories (small, medium and large). Wehave already observed that this classification of the sticky points according to size does notprovide any helpful information in explaining the problems encountered during the spinningoperations.
To improve the quality of the predictive models, we tried to use the individual sizes of stickypoints to explain the problems encountered during the spinning operations. The collection ofsuch information was rendered possible by the use of specific software developed by Cirad toachieve this objective. For any sticky point detected by the image analysis software on eachsingle image, the following information was recorded in text files:
- coordinates of the sticky point in the image, x and y in pixels
- width and length of the sticky point, dx and dy in pixels
- surface area of the sticky point, S in pixels
This information was then used to calculate other parameters such as proportionality ratio(dx/dy) and surface ratio (S/(dx.dy).
Some of this information was used to define a new variable that places more weight on thesize of sticky points: if X is the variable « size of each sticky point », the number of points is atransformation of X where all sticky points have the same weight. In other words, thecounting is a transformation of the size without weighting compared to this one. This meansthat the total size TTH2SD is a transformation of X with a weighting equal to X for everysticky point.
Thus, we look for a transformation Y = f(X) which would improve the correlation coefficientswith the troubles during the spinning operations. Some transformations were tested, inparticular Cox-box ( Y = Xa with y = log x for a=0) and a threshold function (Y= number ofsticky points whose size is larger than a given threshold X). None of these functions bring

CFC / ICAC / 11 Project Technical Report on Research Activities Page 126
improvement in the observed correlation coefficients with the productivity and qualitycriteria.
Results from HPLC and H2SD demonstrate that the stickiness phenomenon is complex, andthat further research is required to evaluate the effects of the different constitutive sugars inthe honeydew. In this way, bales could be selected from fields only infestated by white flies,others by Aphids, and others by a mix of these insects. These bales could then go through thesame process as that described here.
To conclude, the fact that we did not succeed in using the sticky point size in the definition ofthe best stickiness predictor does not mean that this variable has no effect on the spinningprocess. In fact, if the H2SD image analysis principle is considered carefully, the measuredsize does not always correspond to the real size on the aluminum foil. Indeed, themeasurement is an apparent size estimation due to scattered illumination of the fibers and thesugars that stay on the aluminum foil. This induces an over-estimation of the size of the stickypoints. Thus, the evaluation of the smallest sticky points is biased. Some research is currentlyongoing outside this project so that future measurements are more accurate and this couldmodify all the conclusions drawn here. In fact, it is very likely that the sticky points sizedistribution will be modified and this could well alter the conclusions drawn as regards theimpact of sticky points on the spinning process. Thus, the different size categories couldexplain specific productivity of quality problems encountered in the spinning mill.
C.1.3.5. Results and discussion
Of the 26 bales selected for this spinning study, only 24 could be spun, and only 23 baleswere considered for data analyzis (due to problems in the conditionning rooms, bale AS06was removed). The processing of the other two was impossible because of card clogging.Both of these bales were very sticky. One had been roller ginned and showed 42 sticky points(H2SD measurement). The other had been saw ginned and showed 58 sticky points. We werenevertheless able to spin another bale of similar stickiness, but with great difficulty andextremely low efficiency. Fifty H2SD sticky points would appear to be the threshold abovewhich the stickiness immediately blocks the process when the opening operation is conductedat a relative humidity of 45 to 50%.
No particular stickiness effects occurred during the opening of the other 24 bales, i.e. noproblems were encountered from the bale breaker to the card feeder. An inspection of themagnetic baffles, condenser and most parts of the machines in contact with the fiber did notreveal any fouling that required machine stoppage. Traces of stickiness were neverthelessnoted regularly on the breaker needles and in the waste produced by all the machines. It istherefore very likely that certain very sticky cottons would have clogged this section of theline if production had continued for several days. Detecting clogging of the piping,condensers and magnetic baffles would therefore require a specific study with largerquantities of starting materials.
The machines further downstream in the spinning process were all adversely affected bycotton stickiness. From the card to the spinning frames, the entire production line reacted tostickiness, suffering decreased efficiency and increased breakage. Some examples of theproblems that occurred during the spinning process are shown in Slide C-1 to Slide B-34along with cleaning operations on the production machines up to the spinning machines.
C.1.3.6. Card
Card performance was closely related to cotton stickiness. The stickiness measurementsshowed a negative correlation with card efficiency and all the correlation coefficients were of

CFC / ICAC / 11 Project Technical Report on Research Activities Page 127
approximately the same order of magnitude. The closest correlation coefficients wereobtained with the number of H2SD sticky points - physical measurement - and with thetrehalulose levels (W) - chemical measurement. Figure C-10 shows the fitting of a regressionline where efficiency is plotted against the number of H2SD sticky points. The 94%efficiency in the absence of any stickiness decreases in a linear manner by 6.5% for 10 H2SDsticky points (Equation C-1).
Card-EFF.% = 93.7 – 0.653 H2SD
(Equation C-1)
As far as breakages are concerned, no correlation could be detected between the total numberper 100 km of sliver and the sugar levels determined by HPLC. Therefore, only the H2SDresults could be used for this parameter (Figure C-11). The number of breaks increased in alinear manner with stickiness ((Equation C-2) but, as already seen for efficiency, the resultsobtained showed considerable dispersion around the regression line.
Card-breakages = 6.94 + 0.602 H2SD
(Equation C-2)
C.1.3.7. Drawing frame
The performance of the drawing frame in both drafting passes correlated closely with cottonstickiness. The breakage rate, expressed for 100 km of sliver, increased with cotton stickiness.The correlation was closer for the number of H2SD sticky points than for trehalulose andmelezitose levels. Figure C-12 shows breakage during the first drafting pass plotted againstthe number of H2SD sticky points (Equation C-1). Similar results were obtained during thesecond drafting pass.
Drawing-breakage = 0.68 + 0.02675 (H2SD)²
(Equation C-1)
As far as efficiency is concerned, although a significant negative correlation was obtainedwith the number of H2SD sticky points and the level of trehalulose, the correlation was not asclear as for breakage. Figure C-13 shows the efficiency noted during the second drafting passas a function of H2SD count. The dispersion of the values is excessively high for anyprediction of efficiency based on stickiness. Thus, equation B-4 should be considered simplyas a general trend.
Drawing-EFF.% = 79.7 – 0.875 H2SD
(Equation C-2)
This dispersion may be explained by the relatively short drawing time used for each test.Here, at 400 m/min, the processing of each test sliver lasted from 1.5 hours for the slightlysticky cottons to 2.5 hours for the most sticky cottons. The effects of machine stoppages istherefore excessive under such conditions and induces considerable variability into theefficiency results.
C.1.3.8. Roving frame
The roving frame is extremely sensitive to stickiness. In the course of the tests the fiberscould be seen to rise upwards because of small beads of sugar clearly visible on the draftingrollers and on the aprons. This phenomenon occurred even with cottons that were only very
CFC / ICAC / 11 Project Technical Report on Research Activities Page 128
slightly sticky. The number of breaks was closely correlated to stickiness. Significantcorrelation coefficients were noted with the number of H2SD and SCT sticky points, and withthe trehalulose and melezitose levels. The closest correlation (r = 0.79) was obtained using aquadratic model (Equation C-1) linking the number of H2SD sticky points to total breakagein 100 km of roving (Figure C-14).
Breakage 100 km roving = 1.57 + 0.0195 (H2SD)²
(Equation C-1)
Efficiency also correlated well with the number of sticky points and with the trehalulose andsucrose levels. Figure C-15 shows a substantial fall in efficiency correlated with the numberof H2SD sticky points. The H2SD number of sticky spots is the most reliable marker ofroving frame efficiency (r = 0.76). The equation of the best regression found is:
Roving-EFF.% = 100 – 13.88 (H2SD)1/2
(Equation C-2)
C.1.3.9. Ring spinning frame
The breakage incidence for 1000 spindle positions hour showed a good correlation withstickiness. The number of H2SD sticky points gave the closest correlation with an r value of0.82. Although the sugar levels determined by HPLC showed a good correlation withbreakage rate, this correlation was lower than that provided by the number of sticky points.Here, the trehalulose and melezitose levels gave an r value of only 0.68. Figure C-16 plots thenumber of breaks for 1000 spindle positions hour against the H2SD number of sticky points.The y-intercept at the origin is not significantly different from 0.
Breakage 1000 s.p.h = -29.7 + 11.38 H2SD
(Equation C-1)
C.1.3.10. Open-End rotor spinning frame
The efficiency of the rotor spinning frame decreased as stickiness increased. The closestcorrelation coefficients were obtained with the H2SD and SCT sticky points counts ratherthan with the sugar levels determined by HPLC. Here, the correlation coefficients wereapproximately 0.67 for H2SD whereas they did not exceed 0.64 for the best sugar marker(trehalulose). Efficiency for a non-sticky cotton was about 98%, but this fell to 90% forstickiness exceeding 30 H2SD points. Efficiency can be far lower if clogging occurs, asillustrated by the cotton in Figure C-17 outside the cluster of points. The values predicted bythe number of H2SD points again showed a moderate dispersion.
OE-EFF.% = 98.3 – 0.134 H2SD
(Equation C-1)
The number of yarn piecings was monitored in addition to machine efficiency. Figure C-18shows that the number of piecings per hour for 240 spinning positions increased with thenumber of H2SD points, giving a significant correlation between these two variables with r =0.74.
(OE Y-P 240 s.p.h)1/2 = 5.19 + 1.429 (H2SD)1/2
(Equation C-2)

CFC / ICAC / 11 Project Technical Report on Research Activities Page 129
After making three attempts to re-attach the yarn, the machine abandons the process and alertsthe operator that intervention is necessary at the stopped spinning position. The number ofinterventions by the technician hourly is thus a reliable indicator of rotor spinningproductivity. These interventions general consist of cleaning the feed table and the breaker orthe rotor to remove sticky deposits. The results of the tests conducted here showed that thehourly intervention rate due to clogging for 240 positions is dependent upon the stickiness ofthe cotton. Whereas the number of interventions was very low for non-sticky cottons,interventions exceeded the threshold of 3/hour when spinning cottons with more than 20H2SD sticky points.
The models used in this study to predict productivity parameters were based on the results ofstickiness measurements. In an effort to improve these models, we added different variablesto the H2SD count but all these attempts were inconclusive. When variables concerning thesize of the sticky points were added, this did not improve the models, and neither did theaddition of sugar levels determined by HPLC, even when the tests were based on differentcombinations, e.g. the sum of the trehalulose and melizitose entomological sugars. All themodels tested showed that only a single variable was significant. This effect is due to theclose correlation between the H2SD and SCT sticky points counts and certain sugars, notablytrehalulose and melezitose.
The results obtained showed that the number of sticky points measured by the H2SD is moreclosely correlated to spinning productivity parameters than the SCT and HPLC results. TheH2SD count provides the best prediction of breakage rate and spinning machine efficiency.However, the dispersion of the results may occasionally be too great for practical predictions.This is due to the fact that the confidence intervals around the values determined from theregression curve of the H2SD sticky points are relatively broad for certain machines. Theprediction method cannot differentiate between two cottons showing fairly similar stickinesspotentials. It is therefore difficult to predict different efficiencies or breakage rates for cottonswhose stickiness potentials are similar to within 2 or 3 sticky points. Nonetheless, if theprecision of the results is taken into account, certain limits can be set for stickiness withrespect to the acceptable number of breakage and the efficiency desired during spinning. Inour tests, and under the relative humidity conditions used, the stickiness limits for a highlyautomated production unit would appear to be fairly low, particularly for ring spinning, sincethe roving frame is highly sensitive to stickiness.
C.1.4. Conditions and operating methods to study the effect of stickiness on yarn quality
In addition, productivity parameters were noted and samples of cotton-fibers, waste, sliver,roving and yarn were taken to evaluate and monitor product quality at each step in thespinning process.
The regularity of the sliver on the card and the drawing frame was evaluated by twomeasurements of the mass variation (CV%) using an USTER TESTER3. The roving wasevaluated on 4 spindles of the roving frame for each doffing.
On the ring spinning frame, each doffing was 10% sampled, i.e. one bobbin out of 10. Thesesamples of ring-spun yarn were tested on USTER® TESTER3 and USTER® TENSORAPID3to evaluate the spindle-by-spindle quality for each doffing. The principal characteristicsmeasured consisted of:
• mass variation: Um%, CV%
• imperfections: thin places (-50%), thick places (+50%) and neps

CFC / ICAC / 11 Project Technical Report on Research Activities Page 130
• hairiness: H
• tensile properties: tenacity, elongation and work-to-break.
The same analyses were then repeated for packages of rotor-spun yarn, with a samplingfrequency of 4 packages per section of 24 spinning positions daily.
The evaluation of product imperfections was completed by an analysis of CLASSIMATdefects on the packages of rotor-spun yarn and on the non-cleared packages of ring-spun yarnof the winder.
The effects of stickiness on the quality of spun products was evaluated by comparing thesedifferent characteristics with the stickiness results obtained in the corresponding cotton fibersamples. Stickiness results were generated by measuring the number of sticky points on theSCT thermodetector and the H2SD High Speed Stickiness Detector (Frydrych, 1998) and byusing HPLC (High Performance Liquid Chromatography) to determine the sugar content ofthe fiber: Inositol (I), Trehalose (T), Glucose (G), Fructose (F), Trehalulose (W), Melezitose(M) and Sucrose (S). The results presented for these stickiness-predicting results correspondto the mean of the values determined for 10 samples taken from each bale that underwentprocessing.
C.1.4.1. Results and Discussion: effect on quality
The closest correlation between the quality criteria and the stickiness measurements wasobtained for the H2SD number of sticky points. Here, the correlation obtained was notsignificantly improved when the size of the sticky points was taken into consideration. Thesugar content determined by HPLC did not show such a close correlation with the qualitycriteria. Thus, the rest of this paper is restricted to an examination of the relationship betweenH2SD stickiness measurements and the different quality characteristics. Note that due to itslow UHML, bale AS01 was not considered in the correlation data analysis.
C.1.4.1.1. Sliver and roving quality
No significant correlation could be established between the mass variation and the stickinessresults on the card or the drawing frame. It was only from the roving frame onward thatstickiness had an impact on product quality. The roving regularity was then seen to deteriorateas stickiness increased. Figure C-19 shows a significant correlation between the coefficient ofvariation of roving mass (CV%) and the H2SD number of sticky points.
C.1.4.1.2. Ring Spun Yarn quality
The quality of ring-spun yarn also deteriorated as stickiness increased. Here, yarn regularity,imperfections and certain tensile properties were affected by stickiness.
Figure C-20 shows CV% of yarn mass plotted against the number of H2SD sticky points. Therelation is highly significant (r = 0.80), with a linear relationship between CV% and H2SDsticky points:
RSF-CV% = 17.3 + 0.548 (H2SD)1/2
(Equation C-1)
In this equation, when the cotton is slightly sticky (below 10 H2SD points), the CV% does notexceed 19%, i.e. a value that is within the CV% range noted by 95% of spinners world-wide(USTER® STATISTICS 1997).
The number of imperfections per km of yarn also showed a significant correlation with

CFC / ICAC / 11 Project Technical Report on Research Activities Page 131
stickiness. Here, the number of thin places (-50%), thick places (+50%) and neps (+200%)increased with the number of sticky points.
Figure C-21 shows the relationship between the number of thin places and the number ofH2SD sticky points. This relation ship is represented by the model given hereafter:
RSF-Thin(-50%) = 19.8 + 50.19 (H2SD)1/2
(Equation C-2)
According to this model, the threshold of 100 thin places/km of yarn, i.e. the value noted by95% of spinners world-wide (USTER® STATISTICS 1997) is exceeded even with very lowsticky cotton.
The correlation was even closer for the number of thick places (Figure C-22). Here, with acorrelation coefficient of 0.82, the model describing the increase in the number of thick placesis more precise. The following equation shows that stickiness must not exceed 10 H2SDpoints if the spinner wishes to remain below the thick places threshold of 800/km of yarn(95% of spinners according to USTER Statistics 1997).
RSF-Thick (+50%) = 653.8 + 15.13 H2SD
(Equation C-3)
As already seen for thick places, the number of neps was closely correlated to stickiness(r = 0.84). The relationship given shows clearly the considerable number of these defects inyarn produced using very sticky cotton (Figure C-23).
RSF-Neps = 680.7 + 19.74 H2SD
(Equation C-4)
As seen above, the number of neps per 1000 m of yarn increases with stickiness. Sincedifferent types of neps exist in the UT3 detected neps, a detailed analysis (description in thedescription of output 2.1) of the yarn was conducted on yarn samples. This method stops theevenness tester at each of the detected neps. Then, using a magnifying glass, the nep can beplaced in one of 5 categories:
- fiber neps mainly due to immature fibers (Slide C-1)
- seed coat fragments that are part of the seed coat torn off during the ginning process (SlideC-2)
- sticky neps due to honeydew droplets (Slide C-3)
- neps due to entanglements of fibers on a long part of yarn (Slide C-4)
- neps due to other impurities such as leaves, bark …(Slide C-5)

CFC / ICAC / 11 Project Technical Report on Research Activities Page 132
Slide C-1: Fiber neps.
Slide C-2: Seed coat fragment.
Slide C-3: Sticky neps.
Slide C-4: Entanglement of fibers.
Slide C-5: Bark considered as neps.
On the basis of the results of this detailed analysis, the different neps were classified as shownin Figure C-24. In this chart, cottons were ranked by increasing H2SD stickiness. Anincreasing number of neps were due to stickiness as the stickiness of the bales increased. Acomparable comment is valid for fiber neps.
Table C-1 gives the correlation coefficients between the different nep classes and stickiness,thus expressing stickiness in terms of neps.

CFC / ICAC / 11 Project Technical Report on Research Activities Page 133
Table C-1: Correlation coefficients between H2SD counts and nep classes in RS yarns.
Variable Correlation coefficient
% neps – SCF -0.317 NS
% neps – fibers 0.0473 NS
% neps – entanglement 0.0008 NS
% neps – sticky 0.7634 ***
% neps – miscellaneous 0.3668 NS
Nb neps – SCF 0.3710 NS
Nb neps – fibers 0.6847 ***
Nb neps – entanglement 0.2141 NS
Nb neps – sticky 0.7849 ***
Nb neps – miscellaneous 0.3891 NS
NS: non significant at a 5% risk; ***: significant at a 0.1% risk.
The number of sticky neps (‘Nb neps – sticky’, Figure C-25) and its proportion as apercentage of the total number of neps (‘% neps – sticky’) are closely correlated to the H2SDcount. These relations are expressed in the following formulas:
Nb neps – sticky = 0.86 + 0.087 . (H2SD)²
% neps – sticky = -1 +0.221 . H2SD
(Equation C-5)
The offsets of these equation are not different from 0 and the number of sticky neps increasedas the stickiness of the fibers increased.
Concerning fiber neps, the increase in their number was significant (Figure C-26).
The number of SCF, entanglements and neps of diverse origins were not related to stickiness(Figure C-27 to Figure C-29).
Thus, thanks to the detailed analysis, we can confirm that stickiness induces an increase in thetotal number of neps in the yarn, mainly due to an increase in the number of sticky neps andfiber neps.
The hairiness of ring-spun yarn correlated poorly with stickiness (r = 0.52 significant at 1%).However, hairiness was correlated with the number of H2SD sticky points (Figure C-30). Theregression obtained is given in the equation below.
RSF-H = 6.3 + 0.266 (H2SD)1/2
(Equation C-6)
When considering tensile properties, only yarn strength and work-to-break correlated withstickiness. No significant relation was found between stickiness and yarn elongation. Bycontrast, tenacity and work-to-break fell substantially as the number of H2SD sticky pointsincreased (Figure C-31). Although the correlation coefficient s are fairly low, r = -0.57 fortenacity and -0.46 for work-to-break, the decrease in these two parameters was neverthelesssignificant.
CFC / ICAC / 11 Project Technical Report on Research Activities Page 134
(RSF-Tenacity)1/2 = 3.75 – 0.0531 (H2SD)1/2
(Equation C-7)
Figure C-32 shows the relationship between yarn work-to-break and the number of H2SDsticky points, with considerable dispersion of the results.
(RS-work)1/2 = 2 – 0.0362 (H2SD)1/2
(Equation C-8)
C.1.4.1.3. Rotor Spun Yarn quality
Unlike ring-spun yarn, the quality of rotor-spun yarn was little affected by stickiness. Theonly significant correlation coefficients found concerned tenacity and hairiness. The othervariables were unaffected by stickiness. In fact, we even noted a decrease in the number ofimperfections as stickiness increased, which can be explained by the micronaire. Here,paradoxically, the CV of yarn mass, the number of thin places, the number of thick places andthe number of neps showed a negative correlation with the number of H2SD sticky points. Toexplain this, we sought to determine which fiber characteristics correlated with stickiness andcould explain this effect.
The conclusion that stickiness does not increase the number of imperfections in rotor-spunyarn, unlike ring-spun yarn, was confirmed by the results of the CLASSIMAT® defectsanalysis. In short, most of the defects noted in ring-spun yarn were related to stickinesswhereas no significant relationship could be found between open-end yarn defects andstickiness.
The hairiness of open-end yarn increased slightly with stickiness, i.e. a weak correlation(r=0.48) was noted between the number of H2SD sticky points and hairiness. This increasewas nevertheless perfectly clear (Figure C-33) and the values recorded ranged between 5 and6.
The tenacity of open-end yarn also showed a significant correlation with the number of H2SDsticky points. Equation 8, which represents the model of the linear variation, shows a gradualreduction in tenacity as the number of H2SD sticky points increases (Figure C-34). The slopeis fairly gentle (0.03) but significantly different from 0.
OE-Tenacity = 9.2 - 0.03 H2SD
(Equation C-1)
In the same manner as for tenacity, the work-to-break of open-end yarn correlated withstickiness. This decreased slightly as the number of H2SD sticky points increased.
No correlation was observed for elongation.
C.1.5. Effects of stickiness on CLASSIMAT defects
This paragraph describes ring spun yarn and open end yarn from a commercial standpoint.Yarns were cleared on a winder set to average parameters to eliminate the largest defectswhile keeping the winder productive. It is important to note that even the OE yarn was clearedsince the automatic controlling system on the OE machine was turned off to avoid breakagesdue to this quality control system, and thus avoid bias in the evaluation of productivityparameters.

CFC / ICAC / 11 Project Technical Report on Research Activities Page 135
Defects were classified depending on the importance of their mass variation and their length.For each class, the number of defects was expressed per km of yarn.
Table C-1 shows that most of the CLASSIMAT defects in RS yarn were stickiness-dependent, while no correlation was observed for the OE yarns. Indeed, with the exception ofclasses D1, D4, E, F and G, the number of defects in ring spun yarns increased with the H2SDcount.
Table C-1: Correlation coefficients between CLASSIMAT defects and H2SD count.
Ring spun yarns Open-end yarnsDefect
Class Correlation Coef
R
Prob. Signi.
P(x>r)
Correlation coef
R
Prob. Signi.
P(x>r)
A1 0.8227 0.0000 -0.1405 0.5224
B1 0.8207 0.0000 0.1356 0.5374
C1 0.4818 0.0232 0.0533 0.8090
D1 0.3064 0.1654 0.0304 0.8906
A2 0.7457 0.0001 0.1096 0.6187
B2 0.8613 0.0000 0.1512 0.4912
C2 0.8046 0.0000 0.0634 0.7737
D2 0.5496 0.0081 -0.1450 0.5090
A3 0.6304 0.0017 0.1603 0.4651
B3 0.8450 0.0000 0.1761 0.4216
C3 0.7500 0.0001 0.1822 0.4053
D3 0.4504 0.0354 -0.1932 0.3770
A4 0.4672 0.0284 0.1217 0.5801
B4 0.6106 0.0025 0.0355 0.8722
C4 0.5310 0.0110 -0.1554 0.4790
D4 0.3833 0.0783 -0.3089 0.1516
E 0.1018 0.6523 0.1662 0.4484
F 0.1113 0.6218 0.2108 0.3343
G -0.0586 0.7956 0.0998 0.6506
H1 0.7222 0.0001 0.2066 0.3442
I1 0.4762 0.0251 0.1466 0.5046
H2 0.7651 0.0000 -0.1451 0.5089
I2 0.4868 0.0216 0.0251 0.9096
Results are given below for the most significant relations between the number of yarn defectsand H2SD sticky points (thick places A4, B3, B4, C2, C3, C4, D1, D2, D3, D4) (Figure C-35to Figure C-44) and fineness I1, I2, H1 and H2 (Figure C-45 to Figure C-48).
These figures show that the most important Classimat defects in RS yarn increase with H2SDsticky points, in particular thick places +100% and thin places –30%. Defects les than 8 cm in

CFC / ICAC / 11 Project Technical Report on Research Activities Page 136
length (classes E, F and G) do not depend on stickiness because they have probably beencleared in the winding operation.
In conclusion, RS yarn defects increase with stickiness whereas those in OE yarns areunaffected.
C.1.6. Conclusions
C.1.6.1. Effect on productivity
The performance of spinning machines is dependent upon the stickiness of the cotton startingmaterial they use. In this study, machine performance decreased when sticky cottons wereprocessed under the hygrometric conditions generally recommended, i.e. 45 to 50% RHduring opening and carding, and 55 to 60% RH during spinning. The effects of the stickinesson machine productivity were quantified. The results of the regressions showed that thenumber of sticky points determined by H2SD is a more reliable predictor of stickiness effectsthan the SCT count or the sugar content measured by HPLC. Here, although the SCT countcorrelates with productivity parameters, the correlation coefficients obtained with H2SD areeven better. As far as the sugar contents are concerned, not all correlated with the breakageincidence and machines efficiency. In fact, only trehalulose, melezitose and sucrose could becorrelated with these two parameters, but not for all the machines, and here, when acorrelation was detected, this was generally no better than that obtained with the H2SD stickypoints count.
The blocking threshold for the spinning of sticky cottons under the relative humidityconditions described above was about 50 H2SD sticky points. The spinning process isblocked at the card when the count exceeds this value. In addition, stickiness affects themachines and seriously reduces productivity well below this blocking limit. The roving frameis the most sensitive to stickiness.
The relative humidity appears to be of prime importance. The very sticky bales (50 H2SDsticky points) that initially required machine stoppage were subsequently processedsuccessfully at 40% relative humidity. However, the breakage rate even under theseconditions was prohibitively high and machine efficiency was very low. A study to evaluatethe effects of stickiness at different relative humidity values is presented in paragraph C.5.Some results are also presented in paragraph C.2.
C.1.6.2. Effect on quality
This study concerning the carded spinning of sticky cottons showed that stickiness has effectsboth on the productivity and the quality of industrial spinning under the temperature andrelative humidity conditions usually recommended. Here, the cotton was prepared and cardedat 25 °C and 47.5% RH and was spun at 25 °C and 57.5% RH. These conditions weremaintained within ± 2 °C and ± 2.5% relative humidity throughout the study.
Although card and drawing frame productivity was reduced by stickiness, this stickiness hadno effect on sliver quality at this point. It was only from the roving frame onward that astickiness-induced decrease in regularity was observed. The CV% of the roving mass wasslightly higher, thus increasing the irregularity of the yarn on the ring-spinning frame.
When considering the actual spinning, the quality of ring-spun yarn was more susceptible tostickiness than that of rotor-spun yarn. Monitoring of regularity, imperfections and tensileproperties clearly highlighted this difference between the two processes where the CV% ofmass, number of thin places, number of thick places and number of neps in the ring-spun yarn
CFC / ICAC / 11 Project Technical Report on Research Activities Page 137
increased significantly with the number of H2SD sticky points. The tensile properties of thisring-spun yarn, and particularly its tenacity and work-to-break capacity, decreased asstickiness increased. By contrast, most of the quality characteristics of the rotor-spun yarnwere unaffected by cotton stickiness. Thus, the CV% of mass, the number of thin places, thenumber of thick places and the number of neps were unrelated to cotton stickiness. Only thetenacity and hairiness of the rotor-spun yarn were affected by the stickiness, i.e. a slightdecrease in tenacity and a slight increase in hairiness. The same difference between the twotypes of yarn was also observed for the number of CLASSIMAT® defects.
It has been recognized that relative humidity plays an important role in the effects ofstickiness on productivity. By contrast, its impact on the effects of stickiness on yarn qualityhave not yet been correctly evaluated. A study to evaluate the effects of stickiness at differentrelative humidity values is presented in paragraph C.5. However, some results are alsopresented in paragraph C.2.