an economical model development for a hybrid system of
TRANSCRIPT

University of Wisconsin MilwaukeeUWM Digital Commons
Theses and Dissertations
December 2015
An Economical Model Development for a HybridSystem of Grid Connected Solar PV and ElectricalStorage SystemMohammad Hasan BalaliUniversity of Wisconsin-Milwaukee
Follow this and additional works at: https://dc.uwm.edu/etdPart of the Electrical and Electronics Commons, and the Industrial Engineering Commons
This Thesis is brought to you for free and open access by UWM Digital Commons. It has been accepted for inclusion in Theses and Dissertations by anauthorized administrator of UWM Digital Commons. For more information, please contact [email protected].
Recommended CitationBalali, Mohammad Hasan, "An Economical Model Development for a Hybrid System of Grid Connected Solar PV and ElectricalStorage System" (2015). Theses and Dissertations. 1039.https://dc.uwm.edu/etd/1039

AN ECONOMICAL MODEL DEVELOPMENT FOR A HYBRID SYSTEM OF
GRID CONNECTED SOLAR PV AND ELECTRICAL STORAGE SYSTEM
by
Mohammad Hasan Balali
A Thesis Submitted in
Partial Fulfillment of the
Requirements for the Degree of
Master of Science
in Engineering
at
The University of Wisconsin-Milwaukee
December 2015

ii
ABSTRACT
AN ECONOMICAL MODEL DEVELOPMENT FOR A HYBRID SYSTEM OF
GRID CONNECTED SOLAR PV AND ELECTRICAL STORAGE SYSTEM
by
Mohammad Hasan Balali
The University of Wisconsin-Milwaukee, 2015
Under the Supervision of Professor Hamid Seifoddini
Under the Supervision of Co-Advisor Professor Adel Nasiri
Energy sources management is one of the most important concern in the recent decades.
There are finite amount of non-renewable energy sources and one day they will run out if they
have been used as primary sources of energy. Renewable energy sources have been significantly
reduced the environmental effects. For most of them the source of energy is non-depletable.
One of the concerns associated with renewable resources is uncertainty or unavailability.
Energy Storage Systems (ESSs) can help to have more reliable and more efficient systems by
adjusting the charge and discharge time and rate. In this study, an economic model is developed
for a hybrid system of grid-connected solar photovoltaic, Compressed Air Energy Storage
(CAES), and batteries. PV generation depends on irradiance and it is intermittent in nature.
CAES can store energy in larger amounts and for longer periods than other storage systems and
can offer lower price for stored energy. Batteries are integrated with CAES in this model mainly
for lower demand and shorter periods.

iii
The presented model is a non-linear model and it’s been transformed to a linear model in
this study. Optimal planning for generation and storage is derived based on the developed model
for each day by using operation research techniques to maximize the value of energy which
carried over the time. The results are different for each period and are highly dependent on the
load demand. The results show that using solar PV panels coupled with energy storage systems
increase the efficiency and reliability of the system. In addition to that, efficient use of energy
storage system have a great impact on the final prices of electricity since electricity prices in low
peak demand periods is lower than high peak periods.

iv
© Copyright by Mohammad Hasan Balali
All Rights Reserved

v
To
My Beloved Family
And My Amazing Wife

vi
TABLE OF CONTENTS
ABSTRACT .................................................................................................................................................. ii
LIST OF FIGURES ...................................................................................................................................... x
LIST OF TABLES ………………………………………………………………………………………. xii
LIST OF ABBREVIATIONS .....................................................................................................................xiii
ACKNOWLEDGEMENTS .......................................................................................................................... ii
CHAPTER ONE
1-Introduction and Problem Definition ......................................................................................................... 1
CHAPTER TWO
2- Literature Review ..................................................................................................................................... 6
2-1-Energy Sources ................................................................................................................................... 6
2-1-1 Non-Renewable Energy Resources ............................................................................................. 8
2-1-2 Renewable Energy Resources ..................................................................................................... 8
2-1-2-1 Solar Energy ....................................................................................................................... 10
2-1-2-1-1 Solar Thermal ............................................................................................................. 10
2-1-2-1-1 Photovoltaic ................................................................................................................ 10
2-1-2-2 Wind Energy ...................................................................................................................... 11
2-1-2-3 Hydropower ....................................................................................................................... 12
2-1-2-4 Geothermal ......................................................................................................................... 13
2-2- Electrical Storage ............................................................................................................................ 14

vii
2-2-1 Emerging Needs for ESSs ......................................................................................................... 15
2-2-1-1 Utilizing More Renewable Energy Resources ................................................................... 15
2-2-1-2 Smart Grid .......................................................................................................................... 16
2-2-2 Electrical Storage Systems Applications ................................................................................... 16
2-2-2-1 Storage for Producers ......................................................................................................... 17
2-2-2-2 Storage for Transmission Systems ..................................................................................... 17
2-2-2-3 Storage for Distribution Networks ..................................................................................... 18
2-2-2-4 Storage for Retailers........................................................................................................... 18
2-2-2-5-Storage for Consumers ...................................................................................................... 18
2-2-3 Classification of Electrical Storage Systems ............................................................................. 19
2-2-3-1 Mechanical Storage Systems ............................................................................................. 19
2-2-3-1-1 Pumped Hydro ............................................................................................................ 19
2-2-3-1-2 Flywheel ..................................................................................................................... 21
2-2-3-1-3 Compressed Air Energy Storage................................................................................. 23
2-2-3-2 Electrochemical Storage System ........................................................................................ 25
2-2-3-2-1 Lead Acid Battery ....................................................................................................... 25
2-2-3-2-2 Lithium Ion Battery .................................................................................................... 27
2-2-3-2-3 Zinc Bromine Battery ................................................................................................. 30
2-2-3-3 Chemical Electricity Storage Systems ............................................................................... 31
2-2-3-3-1 Hydrogen Storage Systems ......................................................................................... 32
viii
2-2-3-3-2 Synthetic Natural Gas (SNG) ..................................................................................... 33
2-2-3-4 Electrical Storage Systems ................................................................................................. 34
2-2-3-4-1 Super Capacitor Systems ............................................................................................ 34
2-2-3-4-1 Superconducting Magnetic Energy Storage (SMES) ................................................. 36
2-2-3-5 Thermal Storage Systems ................................................................................................... 36
CHAPTER THREE
3-Optimization of Non-Linear Systems ...................................................................................................... 38
3-1 Operation Research ........................................................................................................................... 38
3-1-1 Formulation of Problem ............................................................................................................ 39
3-1-2 Constructing a mathematical model .......................................................................................... 39
3-1-3 Deriving a solution from the model........................................................................................... 39
3-1-4 Testing the model and its solution ............................................................................................. 39
3-1-5 Controlling the solution ............................................................................................................. 40
3-1-6 Implementation .......................................................................................................................... 40
3-2 Operation Research Techniques and Tools ...................................................................................... 40
3-2-1 Linear Programming.................................................................................................................. 41
3-2-2 Non-Linear Programming ......................................................................................................... 43
3-2-3 Simplex Methods ....................................................................................................................... 44
3-2-3-1 Basic steps of the simplex algorithm ................................................................................. 44
3-2-3-2 Numerical Example of Simplex Method............................................................................ 46

ix
3-2-3-3 Alternative Optimum Solution, Degeneracy, Unboundedness, Infeasibility ..................... 49
3-2-4 Big M Method ........................................................................................................................... 50
CHAPTER FOUR
4-Formulation, Results and Discussion ...................................................................................................... 52
4-1 Model Formulation ........................................................................................................................... 52
4-3 Model Description ............................................................................................................................ 55
4-4 Model Assumptions .......................................................................................................................... 58
4-5 Model Analysis ................................................................................................................................. 59
4-5-1 Cost............................................................................................................................................ 59
4-5-2 Energy Storage System Attributes ............................................................................................ 60
4-6 Optimization and Simulation ............................................................................................................ 61
4-7 Linear Model .................................................................................................................................... 62
4-8 Numerical Example .......................................................................................................................... 63
CHAPTER FIVE
5- Conclusion and Scope of Future Research ............................................................................................. 73
References ................................................................................................................................................... 76

x
LIST OF FIGURES
Figure 1: Schematic view of a hybrid system used in this study by its components. .................................. 3
Figure 2: Pie chart depicting the percentage of contributions of energy resources to the total energy
consumed in the United State in 2008. Data are from the U.S. Energy Information Administration (2009).
...................................................................................................................................................................... 7
Figure 3: Chart depicting the percentage of contribution of renewable non-hydroelectric energy resources
...................................................................................................................................................................... 7
Figure 4: Configuration of a pumped energy storage of hydropower plant. ............................................. 13
Figure 5: Configuration of a geothermal energy generating station. ........................................................ 13
Figure 6: Configuration of a pumped hydro energy storage in a pumped storage plant. .......................... 20
Figure 7: Number of pumped hydro energy storage stations in US, based on data from department of energy
(DOE). ........................................................................................................................................................ 21
Figure 8: Configuration of a flywheel energy storage system. ................................................................. 22
Figure 9: Number of flywheel energy storage stations in US, based on data from department of energy
(DOE). ......................................................................................................................................................... 22
Figure 10: Schematic of a Compressed Air Energy Storage power plant with underground reservoir. .... 23
Figure 11: Number of compressed air energy storage stations in US, based on data from department of
energy (DOE). ............................................................................................................................................ 24
Figure 12: Number of lead acid battery energy storage stations in US, based on data from department of
energy (DOE). ............................................................................................................................................ 26
Figure 13: Schematic views of prismatic and cylindrical Li-Ion battery. ................................................. 28
Figure 14: Configuration of a Lithium-Ion battery energy storage. .......................................................... 29
Figure 15: Number of Li-ion battery energy storage stations in US, based on data from department of
energy (DOE). ............................................................................................................................................ 29

xi
Figure 16: Schematic view of a Zinc-Bromine battery configuration. ...................................................... 30
Figure 17: Number of Zinc-Bromine battery energy storage stations in US, based on data from department
of energy (DOE). ....................................................................................................................................... 31
Figure 18: Simplified schematic of a capacitor design. ............................................................................ 35
Figure 19: Construction of the electrochemical double layer ultra-capacitor with porous electrodes
(activated carbon). ...................................................................................................................................... 35
Figure 20: Operation Research phases. ...................................................................................................... 38
Figure 21: Local optimum points versus global optimum points of a feasible region for a non-linear
problem. ..................................................................................................................................................... 43
Figure 22: Graphical view of the result of numerical example of simplex method. .................................. 48
Figure 23: Load Profile, PV Generation and Grid Generations for the numerical example. ..................... 69
Figure 24: State of charge of CAES and battery for the numerical example. ............................................ 69
Figure 25: Power profile of the CAES and battery for the numerical example. ........................................ 70

xii
LIST OF TABLES
Table 1: Comparison between final electricity prices and capital investments of different types of CAES
and Li-ion battery. ......................................................................................................................................... 4
Table 2: Classification of electrical storage systems. ................................................................................. 19
Table 3: Numerical example of simplex method, iteration 1. .................................................................... 47
Table 4: Numerical example of simplex method, iteration 2. .................................................................... 47
Table 5: Numerical example of simplex method, iteration 3. .................................................................... 48
Table 6: Assumptions of numerical example ............................................................................................. 66
Table 7: Final results of the numerical example. ....................................................................................... 71
xiii
LIST OF ABBREVIATIONS
CAES: Compressed Air Energy Storage
PVt: PV panels generation in period t
SCt: The amount of potential stored electricity in MWh in CAES at the beginning of hour t
SBt: The amount of potential stored electricity in MWh in Batteries at the beginning of hour t
Xt: The amount of energy in MWh generated during hour t from the Grid generation facility
Yt: The amount of energy in MWh generated during hour t from the PV generation facility
∆ SCt: The difference in stored energy level in CAES from period t to t + 1 in MWh
∆ SBt: The difference in stored energy level in Battery from period t to t + 1 in MWh
Vt: The value of any stored energy carried over until the hour t in dollar
ti : Hours of the day, ti ∈ {1, 2,…..,24}
AC(t): Avoided cost of electricity per MWh which is the differences between the cost of electricity on peak
time and off peak time in dollar and it depends on finals price of generated electricity in period t.
AC (t): Avoided cost of PV which is the deference between the cost of electricity from Grid and PV
RCOut: Maximum CAES’s generator rate per hour
RCIn: Maximum CAES’s Compressor rate per hour
RB: Battery’s rate per hour
BC: Battery Capacity at rated depth of discharge
PV: PV Panels Capacity
G: Grid Capacity

xiv
CF: Fuel Cost
f: CAES Conversion Factor
e: Battery Roundtrip Efficiency
Dt: Demand for load during hour t
I: The variable I is an indicator variable equal to one if the subscript condition is satisfied, and zero
otherwise.
S: The amount of shortage
Smax: Maximum amount of shortage
CS: Penalty of the shortage
M: Infinite positive number

ii
ACKNOWLEDGEMENTS
I would like to express the deepest appreciation to my advisor, Dr. Hamid Seifoddini and
my co-advisor, Dr. Adel Nasiri who have the attitude and the substance of a genius. They
continually and convincingly conveyed a spirit of adventure with regard to my research. Without
their guidance and persistent help this dissertation would not have been possible.
Besides my advisor, I would like to thank of my thesis committee member, Dr. Wilkistar
Otieno for her encouragement, insightful comments, and hard questions. Working with her was a
great honor and opportunity for me that taught me invaluable lessons that will be precious asset
for me throughout my academic career.
My sincere thanks also go to Mrs. Betty Warras for offering me help and support for all
graduate matters.
I would like to thank my wife, Jessie, who always helps me to think more creatively. I
would like to thank Nasiri’s family for their indispensable advice, help and support in different
aspects of life. I would like to thank my friends, Amin, Emad, Khosro, Mehdi and their families
for their heart-warming support during these years.
I would like to thank my wife’s family for their encouragement and support. Last but not
least I would like to thank my parent and my sister for providing me with the support needed in
order to continually push myself to succeed.

1
CHAPTER ONE
1-Introduction and Problem Definition
The resource’s limitations, technological and environmental restrictions and the high cost
of storing energy have invoked researchers from all around the world to focus storing energy more
efficiently. The main goal of storing energy is saving energy for future uses when the demands or
the prices are higher or when the sources of energy are not available.
During the last decades, renewable energy resources have been widely used to help
traditional resources. Traditional resources are going to be depleted if they have been used as
primary sources of energy for meeting the demand. Also, the demand for energy grows every year.
Environmental impacts of traditional resources are another reason for making renewable energy
resources a better option.
Most of the renewable energy resources are not always available; for instance, wind energy
is variable and intermittent. The variations in wind speed results in a stochastic output for wind
turbines. Therefore, the peak generation of wind farms and peak load demand typically do not
occur at the same time [1]. Using the Energy Storage Systems (ESSs) will increase the reliability
and efficiency of the system.
Advantages of each ESS can be utilized to achieve specific requirements, optimize the
whole system’s performance or improve cycle efficiency [2]. In this study, hybrid generation
system consists of Grid, Solar PV Panels, Compressed Air Energy Storage and Batteries. The
operational value of storage is determined by comparing the difference in production cost in cases
with and without storage systems. When storage systems are added to the generation mix, overall

2
system costs will be minimized because storage is used to displace the operation of the highest
cost generators [3].
In this study, part of the generation comes from Solar PV panels. The first issue related to
Solar PV panels is the intermittent nature of solar PV generation. The exact amount of generation
varies hour to hour or minute to minute and the utility may need to provide voltage regulation
services when using solar PV generation in order to smooth out supply and continuously balance
electricity supply and load. In addition, an energy utility may need to have backup power available
to meet load for periods when solar radiation is lower than expected [4].
Compressed Air Energy Storage (CAES) can store electricity for longer periods of time
compared to other electricity storing technologies [5]. In this study, CAES uses energy peak
shaving to store the electricity when the prices are lower than peak prices. CAES starts storing
with compressing the air, cooling and storing it within underground or aboveground reservoirs. To
generate electricity, the air is released, mixed with fuel, ignited, and finally expanded through
modified gas turbines to drive generators [5]. Compared with conventional gas turbines, CAES
produces more energy while uses the same amount of natural gas.
Batteries are a common type of ESSs, which have been widely used for a long time. There
are three main types of conventional storage batteries that are used extensively: the lead–acid
batteries, the nickel based batteries and the lithium-based batteries [6]. Researchers from all around
the world are still working on development of batteries to increase efficiency and reliability while
decreasing the final price of electricity.
One of the key design aspects of any energy storage system, including batteries, is safety,
which can be improved by reducing the probability of failure [7]. There is still a need for better

3
understanding of battery response to extreme loading [8]. Battery storage could simply replace
CAES for peak shaving or could cover the short time intermittency of PV produced electricity.
The model in this study combines the PV system with CAES and battery storage for peak
shaving. Using renewable energy sources coupled with storage systems helps meet the demand
with the lowest cost. Wind and solar energy generation sources benefit from energy storage
systems as a backup for their intermittent energy generation. Energy storage systems smooth
power output and meet demand with adequate stored energy [4]. Figure 1 shows a schematic view
of a hybrid system by its components.
Figure 1: Schematic view of a hybrid system used in this study by its components.
Defining the priority for the components of the system is one of the most important
decisions in the hybrid system, and a comparison between the final prices of energy for each
component can be done to determine the priority of generation and storage systems to meet

4
demand. Besides the final price of delivered energy, other parameters like periodic major
maintenance, life cycle and capital investment can impact the final decision. Table 1 shows capital
investment and final price of electricity ($/Kwh) for some types of CAES and Battery.
Table 1: Comparison between final electricity prices and capital investments of different types of CAES
and Li-ion battery [9].
System Capital Investment Final price $/Kwh
CAES 50 MW $60,500,000 1,210
CAES 103 MW $108,801,225 1,053
CAES 136 MW $142,401,000 1,050
CAES 183 MW $174,900,000 957
CAES 322 MW $247,500,000 769
CAES 441 MW $289,300,000 656
Li-ion 1000 Kw $2,551,041 2,551
Li-ion 3000 Kw $4,164,200 1,388
Li-ion 10000 Kw $21,834,238 2,183
The electricity price generated from PV is different than the price of electricity which
comes from a grid. The price of generated electricity from PV panels is going to decrease.
Therefore, without considering the capital investment, it is more affordable to meet demand by PV
generation or the amount of stored energy in storage systems and then respond to unmet demand
by grid generation [10].
Self-discharging is one of the problems in any electrical network. Self-discharging can
occur from generation, transmission, distribution and any steps from generation to delivery. Losses
can have great impact on the final price of electricity. Most of the time, electricity self-discharging
in the distribution phase are greater than other steps. Overload periods can increase electricity loss

5
due to technical limitations. Finding the exact amount of self-discharging in a system is not always
possible due to hidden losses in different systems of a hybrid network. The Top-Down/Bottom-
Up method is a common forecasting loss method [11]. Energy Storage Systems lose small amounts
of stored energy in each cycle, but compared with Grid, PV and other generation systems self-
discharging of ESSs are negligible. On the other hand, ESSs can help the hybrid system to
compensate for loss of energy occurring in each phase.

6
CHAPTER TWO
2- Literature Review
2-1-Energy Sources
Energy sources are one of the most important concern in domestic and international scale.
All the announcements about the energy sources have certainly aware every one of the energy
problems in the recent decades. One of the most critical concern is the availability of the energy
sources. Also, efficient use of resources is rapidly becoming vitally important. Increasing world
population leads to requiring increased availability of the energy and more effective ways of
utilizing the available portion of the energy sources.
The main efforts of research and development in recent years have been directed towards
the development of new alternatives for traditional energy resources or finding more primary
sources of energy [12]. There are different kinds of energy sources in the planet earth. Sometimes
they are not locally available or predictable. For instance, the solar energy is only usable during
the day time when the irradiance of the sun is high enough to generate the expected amount of
energy. As same as solar energy, wind power is not always available and using the wind power as
an energy generation source needs accurate forecasting. Some other times they are dangerous to
be transportable to the other locations. Finding a reliable and safe energy sources is one of the
most important concern in recent years.

7
Figure 2: Pie chart depicting the percentage of contributions of energy resources to the total energy consumed in the
United State in 2008. Data are from the U.S. Energy Information Administration (2009). [13]
Figure 3: Chart depicting the percentage of contribution of renewable non-hydroelectric energy resources [13]
24%
23%37%
2%
5% 9%
Natural Gas Coal
Oil Renewable Hydroelectric
Renewable non-Hydroelectric Nuclear
11 79 8 2
Wind Biomass and Biofuel Heothermal Solar and Photovoltaic

8
2-1-1 Non-Renewable Energy Resources
Non renewable energy sources cannot be replenished in a short period of time. There are
finite amount of these sources in the earth and one day they will run out if they have been used as
primary energy sources. Nonrenewable energy resources generally are energy from fossil fuels
which are made of Carbon. Fossil fuels are a valuable source of energy, but the extraction processes
are inexpensive compared with other energy sources. They also can easily be stored and shipped
to anywhere in the world. Burning fossil fuels leads to several problems for environment like air
pollution, water pollution and etc. Natural gas, Petroleum, Coal, Uranium are some examples of
nonrenewable energy sources in the world.
2-1-2 Renewable Energy Resources
Renewable energy refers to energy from a source which is continuously replenished by
natural processes. State law (Wis. Stat.) defines the following as renewable resources when used
to create electricity:
Wind energy
Solar thermal energy: using heat from the sun to create electric power
Photovoltaic energy: a system that directly converts sunlight into electric power
Biomass: defined as wood or plant material or residue, biological waste
Geothermal technology
Hydroelectric with a capacity of less than 60 megawatts
Tidal or Wave Action

9
Fuel Cell: using a renewable fuel as determined by the Commission
The advantages of electric production from renewable resources include:
Low or no fuel cost (except for some biomass)
Shorter lead-times for planning and construction as compared to conventional power
plants
Utilize relatively small, modular plant sizes
Significantly reduced environmental effects compared to fossil fuels
For many renewable resources, a non-depletable resource base
Public support for use of renewable resources
Minimal impacts to the atmosphere
The water consumed by renewable sources of energy like wind and solar PV is
negligible compared with fossil-fuel power plants [14]
The disadvantages of electric production from renewable resources include:
Public concern for land use, biodiversity, birds and aesthetics in siting a facility
Relatively high capital cost to construct a renewable facility
Uneven geographic distribution of renewable resources
Intermittent availability of some renewable resources for electric production
Lack of maturity or commercial availability of some technologies

10
For some biomass resources, the need to consider environmental implications of the fuel
supply [15].
2-1-2-1 Solar Energy
Solar is the sun’s radiation which reach the earth. This energy can be converted to heat and
electricity. Solar energy can generate electricity in two ways by using photovoltaic panels or solar
thermal methods. Solar energy do not produce CO2 emission or air pollution and also has the
minimum impact on environment when located on the buildings. The generated electricity from
solar source is not always constant amount and it highly depends on the irradiance of the sun and
it varies hour to hour and day to day. Solar is intermittent in nature and climate conditions and
geographical location have a great impact on the amount of generated energy.
2-1-2-1-1 Solar Thermal
Heat from the sun can be used to provide energy in multiple ways. One way is to convert
the sunlight into heat using a solar collector. The heat can be used for space heating, water heating,
or for another processes. Solar water heaters have been commercially available for many years.
The use of solar energy for space heating using “passive” methods has also been popular. Heat
from the sun can also be used to heat a fluid that drives a turbine or heat engine to provide energy
to a conventional electric generator [15].
2-1-2-1-1 Photovoltaic
Another way to use solar energy is by converting sunlight directly into electricity through
the use of photovoltaic cells, which are grouped together to form a panel. Photovoltaic panels can
be used in small groups on rooftops or as part of a substantial system for producing large amounts
of electrical power. The amount of energy produced by a photovoltaic system depends upon the

11
amount of sunlight available and the size of the system. The intensity of sunlight varies by season
of the year, time of day and the degree of cloudiness. As a result of private and government
research, photovoltaic systems are expected to become more efficient and affordable in the future.
Prices may also decrease as the popularity of photovoltaic systems increases and production
increases, producing some economies of scale. Compared to traditional methods of electric
generation, photovoltaic systems have few environmental concerns. The primary environmental
impact of a large system is visual and can be solved by designing the system to blend with its
surroundings [15].
There has been a tremendous development of PV technologies has been realized over the
years. The performances of PV technologies just like most other electronic systems are
standardized by the International Electrochemical Commission (IEC). [16]
2-1-2-2 Wind Energy
Wind energy is converted to electricity when wind passes by blades mounted on a rotating
shaft. As the wind moves the blades, the rotation of the shaft turns a generator which converts the
rotational movement into electricity. Three main factors which have impact on the system are the
length and design of the blades, the density of the air and wind velocity. Longer blades produce
more power output. Cold air is denser than warm air, which means it produces more force, or
ability to turn the blades. Also, in general, as elevations increase wind turbines will encounter
greater wind velocities [15].
Like other energy resources, using wind energy has several positive and negative effects
on environment. One of the major benefits of this technology is that it doesn’t have air pollution
and CO2 emission. Wind energy doesn’t have water consumptions compared with other

12
technologies. Water can be used in initial phases for wind turbines installation and blade washing
which is not frequent. Wind energy doesn’t produce any waste and byproducts. Also, this
technology doesn’t have fuel consumption and therefore, natural gas price fluctuation doesn’t
effect on final price of generated electricity. Final price of electricity is almost low compare to
traditional resources. Wind turbines cause several problems for birds and animals which lead to
death.
2-1-2-3 Hydropower
The energy from moving water is converted to electricity when water passes by blades
similar to those on a ship’s propeller. The blades are connected to a rotating shaft which turns a
generator to produce electricity [15]. Hydropower is a mature and cost competitive renewable
energy source. It plays an important role in today’s electricity mix, contributing to more than 16%
of electricity generation worldwide and about 85% of global renewable electricity. Furthermore,
it helps stabilize fluctuations between demand and supply [17].
Long and productive local generation capability and low life-cycle costs, proven reliability
of electricity production with few service interruptions, environmental and socially sustainable
development by providing climate change mitigation, flexible operations by enhancing grid
stability and enabling use of variable renewables and large-scale energy storage for seasonal load
balancing are some benefits of hydropower sources [17].
Hydroelectric power plants produce no air emissions. The barriers created by dams
constrain fish and other species to specific pools, impacting their ability to survive and reproduce.
The turbines have the potential to damage or kill fish if the fish are not filtered aside on the
upstream side of the dam [15].

13
Figure 4: Configuration of a pumped energy storage of hydropower plant. [13]
2-1-2-4 Geothermal
Geothermal energy, earth heat, can be found anywhere in the world. But the high
temperature energy that is needed to drive electric generation stations is found in relatively few
places [18]. Geothermal energy is the heat from the Earth. It's clean and sustainable. Resources of
geothermal energy range from the shallow ground to hot water and hot rock found a few miles
beneath the Earth's surface, and down even deeper to the extremely high temperatures of molten
rock called magma. Most power plants need steam to generate electricity. The steam rotates a
turbine that activates a generator, which produces electricity. Many power plants still use fossil
fuels to boil water for steam. Geothermal power plants, however, use steam produced from
reservoirs of hot water found a couple of miles or more below the Earth's surface [19].
Figure 5: Configuration of a geothermal energy generating station. [16]

14
2-2- Electrical Storage
Energy storage means absorbing energy, Storing for a period of time and then releasing to
the energy suppliers or power services. In this process, energy storage systems (ESSs) can be
temporal time bridge or covering a geographical gap between energy supply and demand. Energy
storage systems mediate between variable sources and variable loads. Energy storage systems can
implement in large or small scale from generation phase to final delivery.
An energy bank deposit must be made at an earlier time for energy to be an available and
usable form at the time of high peak demand. Most of the energy storage facilities store energy
during low demand and low cost periods and discharged it during high peak demand. Price of
energy in high peak demand periods is much higher than low peak demand periods. Therefore,
efficient using of energy storage systems can have a great impact on the final price of electricity.
In a very general sense, there are only three purposes for the storage of energy: to make an
energy supply portable from essentially non-portable sources, to store from an ongoing source for
use at a later time, and to change the ratio of power-to-energy. There are not many attractive
choices for storage, and most are not portable or cheap. Batteries are the least obtrusive and the
most predictable limited secondary sources, but they are not practical as large-scale primary or
secondary sources [12].
Reliability is one the most important parameters in hybrid networks and electricity storage
systems will increase the total reliability of the network. Most of the time, electricity shortage is
not desirable. ESSs charge when the demand is lower than other period and discharge during high
peak demand to smooth the generation system and prevent any shortage in the hybrid system.

15
Power demand varies from time to time and the prices of electricity change accordingly.
The prices for electricity at peak demand periods are higher and at off-peak periods lower. This is
caused by differences in the cost of generation in each period. During peak periods when electricity
consumption is higher than average, power suppliers must complement the base-load power plants
(such as coal-fired) with less cost-effective but more flexible forms of generation, such as oil and
gas-fired generators. During the off-peak period when the demand is lower than peak periods,
costly types of generation can be stopped. This is a good chance for owners of ESSs to benefit
financially. From the utilities’ viewpoint there is a huge potential to reduce total generation costs
by eliminating the costlier methods, through storage of electricity generated by low-cost power
plants [20].
Maintaining a continuous and flexible power supply for consumers is one of the most
important characteristics of each electricity generation system. If the proper amount of electricity
cannot be provided at the time when consumers need it, the power quality will deteriorate and at
worst this may lead to a service interruption. To meet the total amounts of demand appropriate
amounts of electricity should be generated continuously, relying on an accurate forecast of the
variations in demand [20].
2-2-1 Emerging Needs for ESSs
There are two major market needs for ESSs: to utilize more renewable energy and less
fossil fuel, and the future of Smart Grid
2-2-1-1 Utilizing More Renewable Energy Resources
In on-grid areas, the renewable generation may cause several issues in the power grid. First,
in power grid operation, the fluctuation in the output of renewable generation makes system
frequency control difficult, and if the frequency deviation becomes too wide system operation can

16
deteriorate. Secondly, renewable energy output is undependable since it is relied on weather
conditions. Some actions are available to cope with this. Increasing the amount of renewable
generation installed which leads to provide overcapacity and another is to spread the installations
of renewable generators over a wide area. Installing renewable generators in wide area can take
advantage of weather conditions changing from place to place and of smoothing effects expected
from the complementarity of wind and solar generators [20].
2-2-1-2 Smart Grid
ESS is expected to play an essential role in the future Smart Grid. ESSs installed in
customer side substations can control power flow and mitigate congestion, or maintain voltage in
the appropriate range. Another role expected for ESS is for Energy Management Systems (EMS)
in homes and residential buildings. With a Home Energy Management System, residential
customers will become actively involved in modifying their electricity spending by monitoring
their actual consumptions in real time. EMSs in general will need ESS to store electricity from
local generation when it is not needed and discharge it when necessary, thus allowing the EMS to
function optimally with less power needed from the grid [20].
2-2-2 Electrical Storage Systems Applications
The potential applications for energy storage systems in hybrid network are as follow: [21]
Energy storage for the producers
Energy storage for transmission system
Energy storage for distribution networks
Energy storage for retailers
Energy storage for the consumers
Energy storage for balancing the responsible party (BRP)

17
In the electrical system the need for maintaining the balance between production and
consumption has made the energy storage an issue for long time. The economic conditions for
energy storage system, comprising high cost, economic constraints related to access to the grid,
insufficient financial return and etc. have prevented the level of development which would have
been expected in this area. Every electrical system has its own needs and these lead to the different
applications for energy storage.
2-2-2-1 Storage for Producers
The activity of production or generation consist of exploiting power stations to selling the
produced energy in a wholesale market. The volume of the energy can be generated depends on
the availability of the customers, the power of the system for meeting the demand and the
competitiveness of the cost. Demand is not a constant and always fluctuates and it depends on
events and especial occasions in a year. Therefore, producers encounter the risk of shortage or over
load which both of them have a cost or penalty for producers.
Appropriate management of energy storage can help producers to maximize the revenue
associated with energy production. Electricity can be stored when the prices are low and sold later
when the prices are higher. The storage devices should be able to store energy for dozen of hours
and the capacity should be high enough to enable the system to carried energy from day to night,
weekends or weekdays.
2-2-2-2 Storage for Transmission Systems
Depending on the technical characteristics of the power system, energy storage systems
can be used in transmission line in order to balance the flow by charging and discharging the
storage systems. The main purpose of the power system is generating the energy for customers to

18
respond to the maximum demand at a lowest cost. Transmission system should be reliable and
flexible enough to meet customers demand. Every breakdown or shortage in transmission system
will lead to energy shortage and inconvenience situations for customers. Therefore, storage
systems can balance the transmission system to be more reliable and safer.
2-2-2-3 Storage for Distribution Networks
Energy storage systems had been used for distribution networks for many years.
Emergency power is an example of traditional use of storage devices in distribution networks.
Distributors may use storage to have smoother loads. Occasionally, demand may increase for a
period of time and energy storage systems can be a solution to smooth the demand instead of
reinforcement or building a new one.
2-2-2-4 Storage for Retailers
Retailers are associated with selling electricity and providing services to end customers.
Retail activities and production activities should be able to supply energy sold to their customers
by using their production capacity. Storage management is a method that can manage the risk of
price and volume that weigh on the sourcing of retailers.
2-2-2-5-Storage for Consumers
Energy storage is really important for commercial and industrial uses. In some cases, it can
have a great impact on residential uses too. The price of energy is not same during a different
periods of a day. The prices billed to the customers can show the different prices of electricity in
different times of a day. The subscribed power is the maximum value which rarely happens in
practice. From customer point of view, it is overpaying for energy needs.

19
Peak shaving deals with leveling the loads to reduce the subscribed power. In order to
implement peak shaving method, storage systems recharge when the customer’s load is weak and
discharge when customer calls for high power. Customers can also store energy in order to deferral
of consumption, quality and continuity of supplying energy.
2-2-3 Classification of Electrical Storage Systems
Electrical storage Systems has been classified into different categories based on the form
of energy used. There are five different types of electricity storage systems as mechanical,
electrochemical, chemical, electrical and thermal.
Table 2: Classification of electrical storage systems.
Mechanical Electrochemical Chemical Electrical Thermal
Pumped hydro
Rechargeable
battery
Hydrogen Capacitor Ice storage air
conditioning
Compressed air Super-Capacitors Power to gas Electromagnetic
storage
Sensible heat
storage
Flywheel Ultra-Battery Methane
Biofuels
2-2-3-1 Mechanical Storage Systems
The most common mechanical storage systems are pumped hydroelectric power plants
(PHS), compressed air energy storage (CAES) and flywheel energy storage (FES).
2-2-3-1-1 Pumped Hydro
Pumped hydroelectric energy storage is a large, mature, and commercial utility-scale
technology currently used at many locations in the United States and around the world [9]. With
over 120 GW, pumped hydro storage power plants meet nearly about 3 % of global generation
capacity. Conventional pumped hydro storage systems use two water reservoirs at different

20
elevations to pump water during off-peak hours from the lower to the upper reservoir (charging).
When required, the water flows back from the upper to the lower reservoir, powering a turbine
with a generator to produce electricity (discharging). The first pumped hydro storage plants were
used in Italy and Switzerland in the 1890s. Typical discharge times range from several hours to a
few days and the efficiency of PHS plants is in the range of 70 % to 85 %. Advantages are the very
long lifetime and practically unlimited cycle stability of the installation. Main drawbacks are the
dependence on topographical conditions and large land use [20].
Figure 6: Configuration of a pumped hydro energy storage in a pumped storage plant. [9]
The main limiting factors for PHS appear to be environmental concerns and financial
uncertainties rather than the availability of technically feasible sites. PHS developers are proposing
innovative ways of addressing the environmental impacts, including the potential use of waste
water in PHS applications. Such new opportunities and the increasing need for greater energy
storage may lead policymakers to reassess the potential of PHS in the United States, particularly
for coupling with intermittent renewable energy sources such as wind and solar power [22].

21
There are 45 operational pumped hydro station within the United State which can produce
up to 26645 Megawatts [23].
Figure 7: Number of pumped hydro energy storage stations in US, based on data from
department of energy (DOE). [23]
2-2-3-1-2 Flywheel
Flywheels store energy in the form of the angular momentum of a spinning mass, called a
rotor. The work done to spin the mass is stored in the form of kinetic energy. A flywheel system
transfers kinetic energy into ac power through the use of controls and power conversion systems
[9].
Flywheel energy storage technology can be used as a substitute for batteries to provide
backup power to an uninterruptible power supply (UPS) system. Although the initial cost will
usually be higher, flywheels offer a much longer life, reduced maintenance, a smaller footprint,
and better reliability compared to a battery. The combination of these characteristics will generally
result in a lower life-cycle cost for a flywheel compared to batteries [24].

22
The energy is maintained in the flywheel by keeping the rotating body at a constant speed.
An increase in the speed results in a higher amount of energy stored. To accelerate the flywheel
electricity is supplied by a transmission device. If the flywheel’s rotational speed is reduced
electricity may be extracted from the system by the same transmission device [20].
Figure 8: Configuration of a flywheel energy storage system. [9]
Currently, there are 32 operational flywheel project within the United State of America
which can produce energy up to 98 Megawatts [23].
Figure 9: Number of flywheel energy storage stations in US, based on data from
department of energy (DOE). [23]

23
2-2-3-1-3 Compressed Air Energy Storage
CAES systems use off-peak electricity to compress air and store it in a reservoir, either an
underground cavern or aboveground pipes or vessels. When electricity is needed, the compressed
air is heated, expanded, and directed through an expander or conventional turbine-generator to
produce electricity [9].
Compressed air energy storage is a technology known and used since the 19th century for
different industrial applications. Air is used as storage medium due to its availability. Electricity
is used to compress air and store it in either an underground structure or an above-ground system
of vessels or pipes. When needed the compressed air is mixed with natural gas, burned and
expanded in a modified gas turbine. Typical underground storage options are caverns, aquifers or
abandoned mines. The advantage of CAES is its large capacity; disadvantages are low round-trip
efficiency and geographic limitation of locations [20].
Figure 10: Schematic of a Compressed Air Energy Storage power plant with underground reservoir. [9]

24
One of the most important feature of CAES is its discharge time which is in tens of hours
correspondingly to high size of 1000 MW. There are two operating first generation system one in
Germany and one in Alabama in the US. CAES plant has been operating in the Germany, since
December 1978, demonstrating strong performance with 90-percent availability and 99-percent
starting reliability. In the recent years, researchers tried to find a better way for implementing
second generation of CAES with lower installation cost, high efficiency and faster construction
time [9].
Most of the time, CAES plants using aboveground air are smaller than those using
underground storage. Capacity goes down between 3 to 50 MW and discharge time increases
between 2 to 6 hours. Aboveground plants are more expensive but are easier to site. Underground
CAES storage plants are more cost effective due to their capacity up to 400 MW and discharge
time between 8 to 26 hours [9].
Currently, there are 8 operational compressed air stations within the United State of
America which can produce up to 780 Megawatts.
Figure 11: Number of compressed air energy storage stations in US, based on data from
department of energy (DOE). [23]

25
Compare to other electricity storage systems CAES can store the electricity for longer
periods of time. The final price of generated electricity is lower than other storage systems. The
large capacity of CAES is another advantage of this storage system. CAES can be coupled with
lower capacity storage systems to increase the total efficiency of the hybrid system.
2-2-3-2 Electrochemical Storage System
Battery is the simplest example of a storage system which comes to mind. There are
different types of rechargeable batteries and most of them are mature for practice use. In this study,
some types of batteries will be discussed. Many different types of advanced materials for batteries
are now available, some of which possess functional properties [25]. Some of these advanced
materials are the solution to help the environment and reduce energy dissipation for strategies
toward sustainability and energy efficiency [26].
2-2-3-2-1 Lead Acid Battery
Lead acid batteries are the oldest form of rechargeable batteries which have been used since
mid-1800. Lead acid batteries can be used in both mobile and stationary application in each phase
of generation to final delivery. Typical applications of lead acid batteries are emergency power
supply systems, stand-alone systems with PV, battery systems for mitigation of output fluctuations
from wind power and as starter batteries in vehicles. In the past, batteries mostly had been used as
storage systems in grids.
Compare with mobile batteries, stationary batteries should have better quality and
reliability. Cost of stationary batteries are far higher than starter batteries but mass production of
stationary batteries will lead to price reduction. One disadvantage of lead acid batteries is usable
capacity decrease when high power is discharged. For example, if a battery is discharged in one
hour, only about 50 % to 70 % of the rated capacity is available. Other drawbacks are lower energy

26
density and the use of lead, a hazardous material prohibited or restricted in various jurisdictions.
Advantages are a favorable cost/performance ratio, easy recyclability and a simple charging
technology [20].
All lead acid batteries share a common chemistry that positive electrode is composed of
lead-dioxide, pbO2 and negative electrode is composed of metallic lead, pb. The electrolyte is
sulfuric acid solution. Lead acid energy storage are divided in two categories, lead acid carbon
technologies and advanced lead acid technologies.
One of the most important characteristics of carbon lead acid batteries is the high rate in
both charging and discharging. High current rate is available with Nickel-Metal-Hybrid (Ni-MH)
and Li-ion batteries [27].
Currently, there are 40 operational lead acid battery projects within the United State of
America which can produce energy up to 132 Megawatts.
Figure 12: Number of lead acid battery energy storage stations in US, based on data from
department of energy (DOE). [23]

27
2-2-3-2-2 Lithium Ion Battery
Lithium ion batteries have become the most important storage technology in the areas of
portable and mobile applications (e.g. laptop, cell phone, electric bicycle and electric car). High
cell voltage levels of up to 3.7 nominal Volts means one lithium ion cell can replace three Ni-Cd
cells which have a cell voltage of only 1.2 Volts. Lithium ion batteries generally have a very high
efficiency compared with other batteries, typically in the range of 95 % - 98 %. Discharge time
can be from seconds to weeks which makes them a very flexible and universal storage technology.
Standard cells with 5000 full cycles can be obtained on the market at short notice, but even higher
cycle rates are possible after further development, mainly depending on the materials used for the
electrodes. Since lithium ion batteries are currently still expensive, they can only compete with
lead acid batteries in those applications which require short discharge times. Lithium ion battery
technology is still developing, and there is considerable potential for further progress [20].
The impressive scale of Li-ion battery production is driving a trend in cost reduction and
performance improvements that make this technology attractive for grid storage applications in
the near term. The technology advancements and scale that have made Li-ion systems viable for
consumer portable electronics has driven favorable energy density, safety, and cost. Li-ion systems
designated to satisfy PV Grid Integration applications are primarily employed to smooth PV power
and voltage impacts for durations of seconds to minutes. They may be sited at utility-scale PV
generation sites or on feeders that are affected by high penetrations of distributed rooftop [28].
Common types of liquid Li-ion batteries are cylindrical or prismatic. Prismatic polymer Li-
ion batteries are usually used in the small portable devices like MP3 players and Notebooks. There
are many different Li-ion chemistries. Figure 9 shows a schematic views of prismatic and
cylindrical Li-Ion battery.

28
A Li-ion battery cell contains two reactive materials capable of undergoing an electron
transfer chemical reaction. To undergo the reaction, the materials must contact each other
electrically, either directly or through a wire, and must be capable of exchanging charged ions to
maintain overall charge neutrality as electrons are transferred [9]. Figure 10 shows a schematic
principles of a Li-Ion Battery.
The large manufacturing scale of Li-ion batteries estimated to be 30 GWh by 2015 which
can result in lower cost for battery packs which can also use for grid supporting system which need
less than 4 hours of storage. The life cycle estimates 365 cycle annually for 15 years [9].
Figure 13: Schematic views of prismatic and cylindrical Li-Ion battery. [9]

29
Figure 14: Configuration of a Lithium-Ion battery energy storage. [9]
Currently, there are 186 operational Lithium-Ion battery projects within the United State
of America which can produce energy up to 314 Megawatts.
Figure 15: Number of Li-ion battery energy storage stations in US, based on data from
department of energy (DOE). [23]

30
2-2-3-2-3 Zinc Bromine Battery
Zinc Bromine battery is a kind of flow battery which Zink is solid during charging time
and dissolved when discharged. The Bromine is always dissolve in aqueous electrolyte. Each cell
is composed of two electrode surfaces and two electrolyte flow streams separated by a micro-
porous film. The positive electrolyte is called a catholyte; the negative is the anolyte. Both
electrolytes are aqueous solutions of zinc bromine (ZnBr2). During charge, elemental Zinc is
platted onto the negative electrode and elemental bromine is formed at the positive electrode.
Ideally, this elemental bromine remains only in the positive electrolyte. The micro-porous
separator allows zinc ions and bromine ions to migrate to the opposite electrolyte flow stream for
charge equalization at the same time, it inhibits elemental bromine from crossing over from the
positive to the negative electrolyte, reducing self-discharge because of direct reaction of bromine
with zinc [9].
Figure 16: Schematic view of a Zinc-Bromine battery configuration. [9]
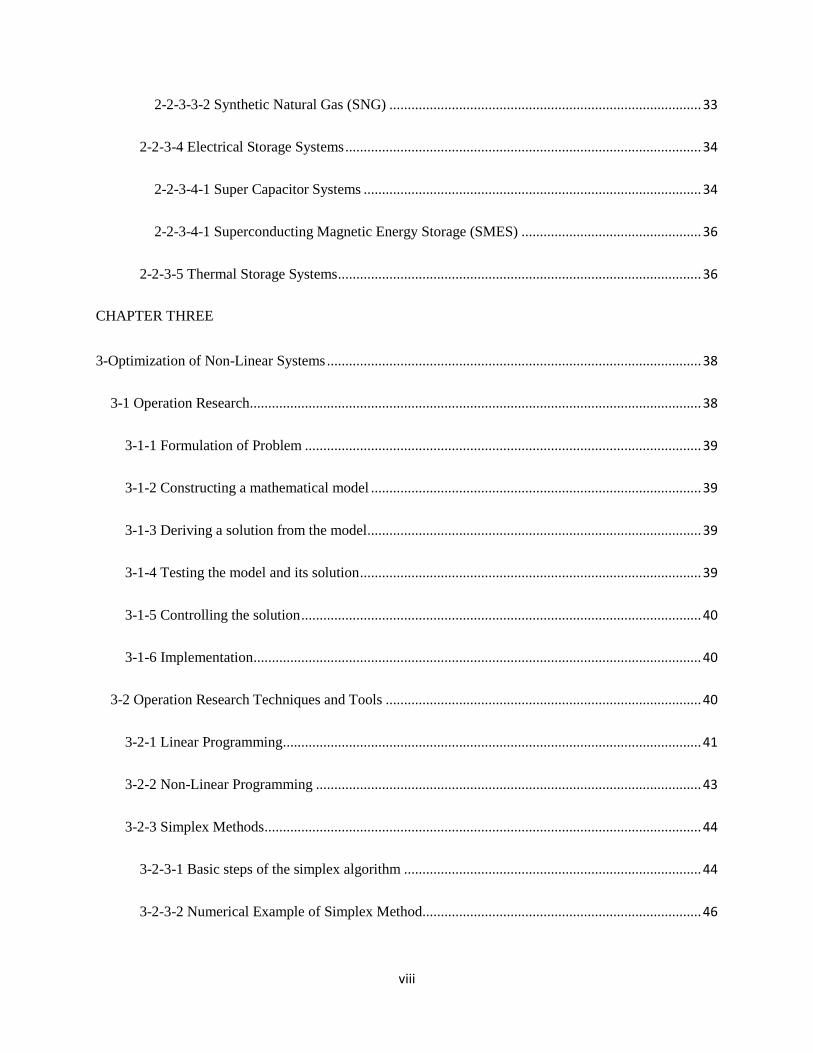
The life time for Zink-Bromine batteries is about 20 years and approximate AC to AC
efficiency is 65 percent [23].
31
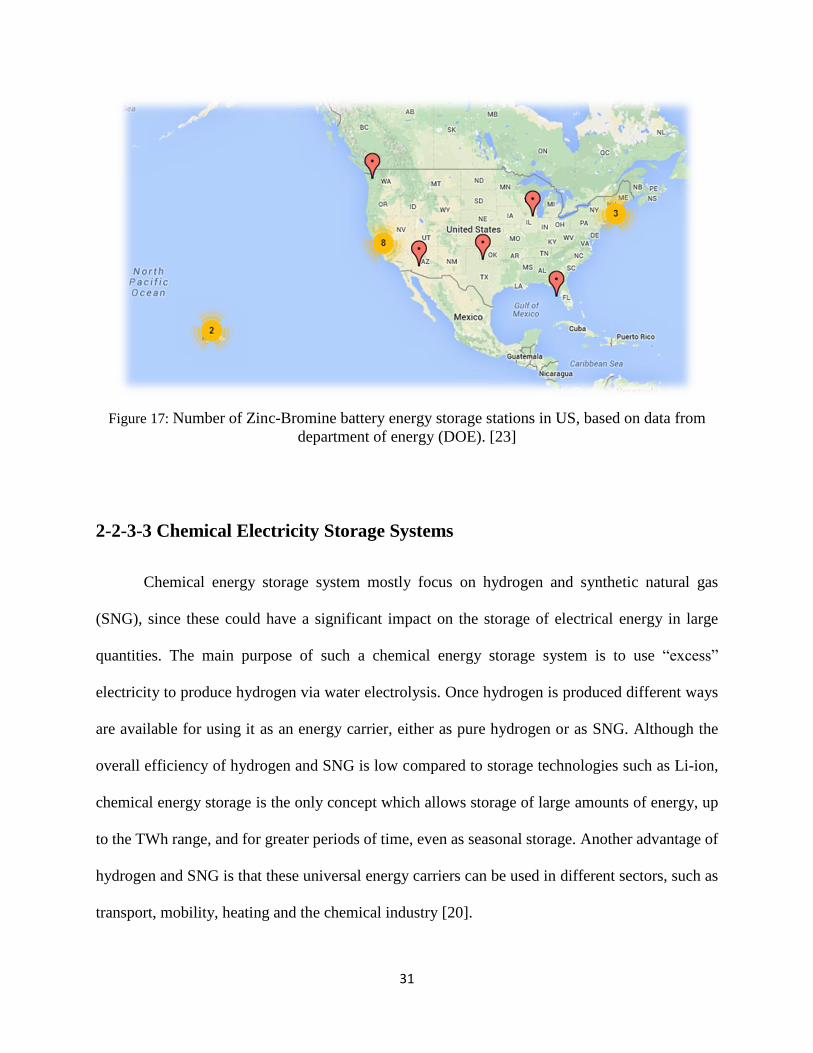
Figure 17: Number of Zinc-Bromine battery energy storage stations in US, based on data from
department of energy (DOE). [23]
2-2-3-3 Chemical Electricity Storage Systems
Chemical energy storage system mostly focus on hydrogen and synthetic natural gas
(SNG), since these could have a significant impact on the storage of electrical energy in large
quantities. The main purpose of such a chemical energy storage system is to use “excess”
electricity to produce hydrogen via water electrolysis. Once hydrogen is produced different ways
are available for using it as an energy carrier, either as pure hydrogen or as SNG. Although the
overall efficiency of hydrogen and SNG is low compared to storage technologies such as Li-ion,
chemical energy storage is the only concept which allows storage of large amounts of energy, up
to the TWh range, and for greater periods of time, even as seasonal storage. Another advantage of
hydrogen and SNG is that these universal energy carriers can be used in different sectors, such as
transport, mobility, heating and the chemical industry [20].

32
2-2-3-3-1 Hydrogen Storage Systems
A typical hydrogen storage system consists of an electrolyzer, a hydrogen storage tank and
a fuel cell. An electrolyzer is an electrochemical converter which splits water with the help of
electricity into hydrogen and oxygen. heat is required during the reaction. Hydrogen is stored under
pressure in gas bottles or tanks, and this can be done practically for an unlimited time. To generate
electricity, both gases flow into the fuel cell where an electrochemical reaction which is the reverse
of water splitting takes place: hydrogen and oxygen react and produce water, heat is released and
electricity is generated. For economic and practical reasons oxygen is not stored but vented to the
atmosphere on electrolysis, and oxygen from the air is taken for the power generation. In addition
to fuel cells, gas motors, gas turbines and combined cycles of gas and steam turbines are in
discussion for power generation. Different approaches exist to storing the hydrogen, either as a gas
under high pressure, a liquid at very low temperature, adsorbed on metal hydrides or chemically
bonded in complex hydrides. However, for stationary applications gaseous storage under high
pressure is the most popular choice. Up to now there have not been any commercial hydrogen
storage systems used for renewable energies [20].
During off-peak hours, electrolyzers could use energy from the wind turbines or the grid
to generate hydrogen and store it in turbine towers. The stored hydrogen could later be used to
generate power via a fuel cell during times of peak demand. This capacity for energy storage could
significantly mitigate the drawbacks to wind’s intermittent nature and provide a cost-effective
means of meeting peak demand. Hydrogen storage creates a number of additional considerations
in turbine tower design. Under certain conditions hydrogen tends to react with steel, adversely
affecting the mechanical properties such as ductility, yield strength, and fatigue life. Additionally,
storing hydrogen at pressure significantly increases the stresses on the tower. These factors require

33
a structural analysis to evaluate how internal pressure may affect the tower’s design life. Hydrogen
storage creates a number of additional considerations in turbine tower design. Under certain
conditions hydrogen tends to react with steel, adversely affecting the mechanical properties such
as ductility, yield strength, and fatigue life [29].
2-2-3-3-2 Synthetic Natural Gas (SNG)
Synthesis of methane is the second option to store electricity as chemical energy. Here a second
step is required beyond the water splitting process in an electrolyzer, a step in which hydrogen and
carbon dioxide react to methane in a methanation reactor. As is the case for hydrogen, the SNG
produced can be stored in pressure tanks, underground, or fed directly into the gas grid. Several
CO2 sources are conceivable for the methanation process, such as fossil-fuelled power stations,
industrial installations or biogas plants. To minimize losses in energy, transport of the gases CO2
(from the CO2 source) and H2 (from the electrolysis plant) to the methanation plant should be
avoided. The production of SNG is preferable at locations where CO2 and excess electricity are
both available. In particular, the use of CO2 from biogas production processes is promising as it
is a widely-used technology. Nevertheless, intermediate on-site storage of the gases is required, as
the methanation is a constantly running process. The main disadvantage of SNG is the relatively
low efficiency due to the conversion losses in electrolysis, methanation, storage, transport and the
subsequent power generation. The overall AC-AC efficiency, < 35 %, is even lower than with
hydrogen [20].

34
2-2-3-4 Electrical Storage Systems
2-2-3-4-1 Super Capacitor Systems
Both batteries and supercapacitors show great potential as electrical energy storage
devices. Although batteries show higher energy densities, they have lower power handling abilities
and shorter cycle lives [30]. Since the 1980s, electrochemical double-layer capacitors (EDLCs or
supercapacitors) have been developed to meet this demand, due to their extremely rapid rates of
charge and discharge and their essentially unlimited cycle life [31].
The storage of electrical energy in supercapacitors relies on the formation of an electric
double layer at the interface between a solid electrode and a liquid electrolyte solution. Upon
charging, energy is stored as the cations and anions are electrostatically attracted to different
electrodes, forming the double layers. Among all potential materials for supercapacitors, carbon
has been widely used as the electrode, because of its high porosity, good electronic conductivity,
and low cost [32].
An electric capacitor has a sandwich structure containing two conductive plates (normally
made of metal) surrounding a dielectric or insulator. An external voltage difference is applied
across the two plates, creating a charging process. During charging, the positive charges gradually
accumulate on one plate (positive electrode) while the negative charges accumulate on the other
plate (negative electrode). When the external voltage difference is removed, both the positive and
negative charges remain at their corresponding electrodes. In this way, the capacitor plays a role
in separating electrical charges. The voltage difference between the two electrodes is called the
cell voltage of the capacitor. If these electrodes are connected using a conductive wire with or

35
without a load, a discharging process occurs the positive and negative charges will gradually
combine through the wire [33].
Figure 18: Simplified schematic of a capacitor design. [33]
Figure 19: Construction of the electrochemical double layer ultra-capacitor with porous electrodes
(activated carbon). [34]
36
2-2-3-4-1 Superconducting Magnetic Energy Storage (SMES)
Superconducting magnetic energy storage (SMES) systems work according to an
electrodynamic principle. The energy is stored in the magnetic field created by the flow of direct
current in a superconducting coil, which is kept below its superconducting critical temperature.
Today materials are available which can function at around 100 °K. The main component of this
storage system is a coil made of superconducting material. Additional components include power
conditioning equipment and a cryogenically cooled refrigeration system [20].
The main advantage of SMES is the very quick response time. The requested power is
available almost instantaneously. Moreover the system is characterized by its high overall round-
trip efficiency (85 % - 90 %) and the very high power output which can be provided for a short
period of time. There are no moving parts in the main portion of SMES, but the overall reliability
depends crucially on the refrigeration system. In principle the energy can be stored indefinitely as
long as the cooling system is operational, but longer storage times are limited by the energy
demand of the refrigeration system. Large SMES systems with more than 10 MW power are
mainly used in particle detectors for high-energy physics experiments [20].
2-2-3-5 Thermal Storage Systems
Thermal energy storage (TES) systems can store heat or cold to be used later under varying
conditions such as temperature, place or power. An active storage system is characterized by forced
convection heat transfer into the storage material. The storage material circulates through a heat
exchanger, a solar receiver or a steam generator. The benefits that can be obtained when
implementing storage in an energy system are better economics by reducing capital and operational
costs, better efficiency by achieving a more efficient use of energy, less pollution of the
environment and less CO2 emissions and better system performance and reliability [35].

37
There are mainly two types of TES systems, that is, sensible (e.g., water and rock) and
latent (e.g., water/ice and salt hydrates). For each storage medium, there is a wide variety of
choices depending on the temperature range and application. TES deals with the storing of energy,
usually by cooling, heating, melting, solidifying, or vaporizing a substance, and the energy
becomes available as heat when the process is reversed. The selection of a TES is mainly
dependent on the storage period required, that is, diurnal or seasonal, economic viability, operating
conditions, and so on [36].

38
CHAPTER THREE
3-Optimization of Non-Linear Systems
3-1 Operation Research
The main origin of Operation Research (O.R.) was during World War II when Britain was
having very limited resources, therefore there was an urgent need to allocate resources to the
various operations and activities. Nowadays, the impact of OR can be seen in many areas. A large
number of management consulting firms are currently engaged in OR activities in areas such as
transportation, libraries, hospitals, city planning and financial institution. There are several
definitions of OR. For instance, “OR is a scientific method of providing executive departments
with a quantitative basis for decisions regarding the operations under their control”, Morse and
Kimbel (1946). Different phases of OR are as follow [37]:
Phase 1: Formulation of the problem
Phase 2: Constructing a mathematical model
Phase 3: Driving a solution from the model
Phase 4: Testing the model and its solution
Phase 5: Controlling the solution
Phase 6: Implementation
Figure 20: Operation Research phases. [37]

39
3-1-1 Formulation of Problem
To find the solution of an OR model, problem should be formulated using the appropriate
model. The following information is needed for problem formulation [37].
1) Decision Makers
2) Objective Function
3) Controllable Variables
4) Uncontrollable Variables
5) Restrictions and Constraints
3-1-2 Constructing a mathematical model
In this phase, problems should using an appropriate model to be more convenient for
further analysis. A mathematical model should be able to represent the system under study in all
aspects. A mathematical model consists of objective function, decision variables and constraints.
3-1-3 Deriving a solution from the model
By using OR techniques and methods, a solution for the mathematical model should be
found. In OR models, it’s always desirable to find the optimal solution. Optimal solution in the
one that maximize or minimize the objective function.
3-1-4 Testing the model and its solution
After getting the solution, it is necessary to test the solution for errors. There is more to
testing the solution that just making a comparison between the problem and the original model
which helps to reveal any mistake.

40
3-1-5 Controlling the solution
The model requires immediate modification as soon as one or more of the variables change.
As the conditions are constantly changing in the real world, the model and optimal solution may
not remain valid for throughout the time horizon and should thus be updated continuously.
3-1-6 Implementation
This is the final phase of each OR model. As changes to the variables occur, the model and
solution should be updated immediately.
3-2 Operation Research Techniques and Tools
Operations Research (O.R.) is a discipline that deals with the application of advanced
analytical methods to help make better decisions [38]. The terms management
science and analytics are sometimes used as synonyms for operations research. Employing
techniques from other sciences like mathematical sciences, such as mathematical modeling,
statistical analysis, and mathematical optimization, operations research arrives at optimal or near-
optimal solutions to complex decision-making problems.
Operations research overlaps with other disciplines, notably industrial engineering and
operations management. It is often concerned with determining a maximum (such as profit,
performance) or minimum (such as loss, risk, or cost.)
Operations research involves a wide range of problem-solving techniques and methods to
improve decision-making and efficiency, such as simulation, mathematical optimization, queuing
theory, Markov decision processes, economic methods, data analysis, statistics, neural networks,

41
expert systems, and decision analysis. Nearly all of these techniques involve the construction of
mathematical models that attempt to describe the system.
Because of the computational and statistical nature of most of these fields, O.R. also has
strong ties to computer science. Operations researchers faced with a new problem must determine
which of these techniques are most appropriate given the nature of the system, the goals for
improvement, and constraints on time and computing power [39].
Operation research gives stress on the analysis of operations as a whole. It uses several
tools and techniques available from the field of mathematics, statistics, cost analysis or numerical
calculation. Some such techniques are linear programming, non-linear programming, integer
programming, dynamic programming, goal programming, game theory, inventory control, PERT-
CPM and simulation.
3-2-1 Linear Programming
The term Linear Programming (LP) is the combination of the two terms. “Linear” means
that all the relations in the problem are linear and “Programming” refers to the process determining
particular program. The linear programming method is a technique of choosing the best alternative
from the set of feasible alternatives while objective functions and constraints can be expressed as
linear mathematical function. The linear function that is going to be optimized is the objective
function and the conditions of the problems are constraints. Linear programming is a widely used
in field of optimization since many practical problems in operations research can be expressed as
linear programming problems. A general linear problem can be stated as follows [37]:

42
Find X1, X2, …Xn which optimize the linear function.
Z= C1X1 + C2X2 + ……… + CnXn
Subject to the constraints:
A11X1 + A12X2 + ……. + A1nXn ( < = > ) b1
A21X1 + A22X2 + ……. + A2nXn ( < = > ) b2
………………………………….
Am1X1 + Am2X2 + ……. + AmnXn ( < = > ) bn
Xi > 0
The problem of solving a system of linear inequalities dates back at least as far as Fourier,
who in 1827 published a method for solving them [40]. The first linear programming formulation
of a problem that is equivalent to the general linear programming problem was given by Leonid
Kantorovich in 1939, who also proposed a method for solving it. He developed the LP problem
during World War II as a way to plan expenditures and returns so as to reduce costs to the army
and increase losses incurred by the enemy [41].
The main advantages of linear programming are as follows [37]:
It indicates how the available resources can be used in the best way to optimize
the objective function.
It helps in attaining the optimum use of the productive resources and manpower.
It improves the quality of decisions.
It also reflects the drawbacks of the production process.

43
It helps in re-evaluation of a basic plan with changing conditions.
3-2-2 Non-Linear Programming
Minimize f(x)
S.t. gi (x) ≤ 0 for i=1,…..,m
hi (x) = 0 for i=1,……,l
x ϵ X
Where f, g1,..., gm, h1, …., hl, are functions defined on Rn, X is a subset of Rn, and x is a
vector of n components x1, ..., xn. The above problem must be solved for the values of the variables
xl,.., xn that satisfy the restrictions and meanwhile minimize the function f [42].
In general, the main difference between nonlinear programming and linear programming
is that nonlinear programming consist of at least one nonlinear function which could be the
objective function, one or more constraints. Most of the systems in real world are inherently
nonlinear. The problem is that nonlinear models are much more difficult to optimize. There are
several reasons as follows:
It’s hard to distinguish a local optimum from a global optimum point
Figure 21: Local optimum points versus global optimum points of a feasible region for a
non-linear problem. [32]

44
There may be multiple disconnected feasible regions
Different starting points may lead to different final solution
It may be difficult to find a feasible starting point
It’s difficult to keep satisfy equality constraints
Different algorithms and solvers arrive at different solutions
3-2-3 Simplex Methods
The basic computational step in the simplex algorithm is the same as that in most of
elementary linear algebra. This is the operation on matrices used to solve systems of linear
equations [43]. The simplex method is a method for solving problems in linear programming. This
method, invented by George Dantzig in 1947.
3-2-3-1 Basic steps of the simplex algorithm
Step 1: Write the linear programming problem in standard form
Turning a problem into standard form involves the following steps.
1) Turn Maximization into minimization and write inequalities in standard order. This step
is obvious. Multiply expressions, where appropriate, by −1.
2) Introduce slack variables to turn inequality constraints into equality constraints with
nonnegative unknowns. Any inequality of the form a1 x1 + · · · + an xn ≤ c can be replaced
by a1 x1 + · · · + an xn + s = c with s ≥ 0.
3) Replace variables which are not sign-constrained by differences. Any real number x can
be written as the difference of nonnegative numbers x = u − v with u, v ≥ 0.
Step 2: Write the coefficients of the problem into a simplex tableau

45
The coefficients of the linear system are collected in an augmented matrix as known from Gaussian
elimination for systems of linear equations; the coefficients of the objective function are written
in a separate bottom row with a zero in the right hand column. In the following steps, the variables
will be divided into m basic variables and n − m non-basic variables. We will act on the tableau
by the rules of Gaussian elimination.
Step 3: Gaussian elimination
For a given set of basic variables, we use Gaussian elimination to reduce the corresponding
columns to a permutation of the identity matrix. This amounts to solving Ax = b in such a way that
the values of the non-basic variables are zero and the values for the basic variables are explicitly
given by the entries in the right hand column of the fully reduced matrix. In addition, we eliminate
the coefficients of the objective function below each pivot. The solution expressed by the tableau
is only admissible if all basic variables are non-negative. At later stages in the process, the selection
rules for the basic variables will guarantee that an initially feasible tableau will remain feasible
throughout the process.
Step 4: Choose new basic variables
If, at this stage, the objective function row has at least one negative entry, the cost can be lowered
by making the corresponding variable basic. This new basic variable is called the entering variable.
Correspondingly, one formerly basic variable has then to become non-basic, this variable is called
the leaving variable.
(i) The entering variable shall correspond to the column which has the most negative entry
in the cost function row. If all cost function coefficients are non-negative, the cost
cannot be lowered and we have reached an optimum. The algorithm then terminates.

46
(ii) Once the entering variable is determined, the leaving variable shall be chosen as
follows. Compute for each row the ratio of its right hand coefficient to the
corresponding coefficient in the entering variable column. Select the row with the
smallest finite positive ratio. The leaving variable is then determined by the column
which currently owns the pivot in this row. If all coefficients in the entering variable
column are non-positive, the cost can be lowered indefinitely, i.e., the linear
programming problem does not have a finite solution. The algorithm then also
terminates.
(iii) Choosing the right entering variable can guarantee that the objective function will not
be worsen in each iterate.
If entering and leaving variable can be found, go to Step 3 and iterate.
Step 5: Read off the solution
The solution represented by the final tableau has all non-basic variables set to zero, while the
values for the basic variables can be can be read off the right hand column. The bottom right
corner gives the negative of the objective function.
3-2-3-2 Numerical Example of Simplex Method
Suppose that this linear problem is solved by using Simplex method.
Max Z = 3x1 + 5x2
S.t. x1 ≤ 4
2x2 ≤ 12
3x1 + 2x2 ≤ 18
x1 , x2 ≥ 0

47
First, LP should be re-written in the standard form as follows:
Min -Z = -3x1 -5x2
S.t. x1 + S1 = 4
2x2 + S2 = 12
3x1 + 2x2 + S3 = 18
x1 , x2 ≥ 0
Table 3: Numerical example of simplex method, iteration 1.
X1 X2 S1 S2 S3 RHS
S1 1 0 1 0 0 4
S2 1 2 0 1 0 12
S3 3 2 0 0 1 18
Z
-3
-5
0
0
0
0
In the first iteration, x2 has been selected as entering variable and S2 has to leave the basic
solution since Min {4/0, 12/2, and 18/2} is 12/2 which is related to S2.
Table 4: Numerical example of simplex method, iteration 2.
X1 X2 S1 S2 S3 RHS
S1 1 0 1 0 0 4
X2 0 1 0 1/2 0 6
S3 3 0 0 -1 1 6
Z
-3
0
0
5/2
0
30
In the second iteration, x1 has been selected as entering variable and S3 has to leave the basic
solution since Min {4/1, 6/0, and 6/3} is 6/3 which is related to S3.

48
Table 5: Numerical example of simplex method, iteration 3.
X1 X2 S1 S2 S3 RHS
S1 0 0 1 1/3 -1/3 2
X2 0 1 0 1/2 0 6
X1 1 0 0 -1/3 1/3 2
Z
0
0
0
3/2
1
36
Table 5, is the optimum table since all the coefficients of objective function (Z) are positive. The
optimum value of the objective is 36.
This example was a simple example of simplex method and due to the limited number of
constraints and variables, it could be solved by graphical method as follows:
Figure 22: Graphical view of the result of numerical example of simplex method.
B is the optimum point for this example since the objective value for B is better than both A and
C which are the two adjacent points of A.

49
3-2-3-3 Alternative Optimum Solution, Degeneracy, Unboundedness,
Infeasibility
A) Alternative Optimum Solution
In the optimum simplex table, if the coefficient of a non-basic variable in the Row Z be
equal to zero, it has to select as an entering variable. If the minimum ratio test be not
zero, problem has alternative optimum solutions. It means that two or more different
points have a same objective value.
B) Degeneracy
In the simplex table, if the minimum ration test would not be unique degeneracy has been
occurred. It means that there are more than one variable to enter among basic variables
since the value of minimum ratio test are same for them. If the minimum ration test be
equal to zero, degeneracy is not solvable. Otherwise, we can leave the degeneracy point.
C) Unboundedness
If one of the non-basic variables has the conditions as an entering variable but there are
no minimum ration test to be calculated unboundedness has been occurred. There is no
ration test since there is no positive entry in the row of entering variable.
D) Infeasibility
The simplest definition of infeasibility is the set of constraint that have no solution.
There are three possible outcomes for a linear program: it is infeasible, it has an unbounded
optimum or it has an optimal solution.
50
3-2-4 Big M Method
Simplex method starts with a basic feasible solution (BFS) and moves to find an improved
BFS, until the optimal point is reached or else unboundedness of the objective function is verified.
In order to initialize this algorithm a BFS must be available. In many cases, finding such a BFS is
not straightforward and some work may be needed to get the simplex algorithm started. To this
end, there are two techniques in linear programming literature: two-phase method and big-M
method. But there may be some LP models for which there are not any BFSs, i.e., the model is
infeasible. Both two-phase method and big-M method distinguish the infeasibility [44], [45] and
[46].
Consider a generic LP model. After manipulating the constraints and introducing the
required slack variables, the constraints are put in the format Ax=b, x⩾0 where A is a m×n matrix
and b⩾0 is an m×1 vector. Considering c as cost vector, the following LP model is dealt with:
Min cx (P)
s.t. Ax = b
X > 0
Suppose that there is not a starting BFS for simplex method. In this case we shall resort to
the artificial variables to get a starting BFS, and then use the simplex method itself and get rid of
these artificial variables. The use of artificial variables to obtain a starting BFS was first provided
by Dantzig [47].
To illustrate, suppose that the restrictions have been changed by adding an artificial
vector Xa leading to the system Ax + xa = b, (x, xa) ⩾ 0. This gives an immediate BFS of the new
system, namely (x=0,xa=b). Even though we now have a starting BFS and the simplex method can

51
be applied, we have in effect changed the problem. In order to get back to the original problem,
these artificial variables have to forced to be zero, because
Ax=b ⇔ Ax + xa = b, xa=0
There are various methods that can be used to eliminate the artificial variables. One of
these methods is to assign a large penalty coefficient to these variables in the original objective
function in such a way as to make their presence in the basis at a positive level very unattractive
from the objective function point of view. “P” has been changed to:
Min cx + Mxa (PM)
s.t. Ax + xa= b
x, xa > 0
Where M is a very large positive number. The term Mxa can be interpreted as a penalty
to be paid by any solution with xa≠0. Therefore the simplex method itself will try to get the
artificial variables out of the basis, and then continue to find an optimal solution of the original
problem. This technique is named the big-M method [46].
52
CHAPTER FOUR
4-Formulation, Results and Discussion
4-1 Model Formulation
There are several studies about economic analysis of CAES, PV panels and batteries.
“Arizona Research Institute for Solar Energy” presented a basic model in their final report named
“Study of Compressed Air Energy Storage with Grid and Photovoltaic Energy Generation”. The
cost benefit analysis for CAES and PV and the system cost analysis and optimization for the hybrid
system had been done in their research. The battery has been added to the hybrid system in the
presented model in this study. This model studies the hybrid system in detail and several
constraints had been added to the basic model. Most parts of the information about the energy
storage systems comes from Sandia report named “DOE/EPRI 2013 Electricity Storage Handbook
in Collaboration with NRECA”.
The model in this study can find the optimized value in any category including optimized
generation for Grid and PV panels and optimized amount of storage for CAES and batteries. Also,
this model is able to find the optimized solution with respect to satisfying the demand and reducing
the total cost. Analysis of generation and storage performances in the absence of PV panels is
another capability of this model. Some days, the irradiance for PV power generation is not enough.
Therefore, the system should be able to use another source of energy as a backup power.
In this case, the backup plan can use stored energy in CAES and batteries or increase Grid
power generation. Generally, this model needs load demand to provide accurate result for
variables. The demand for each day of a year is different, meaning the model has various results
for each load profile. But, based on the capacity of the facilities and estimation for using the PV
panels, the model can quickly update the optimum amount of generation and storage. In addition

53
to that, sensitivity analysis can be done using this model. The model is able to answer the “what-
if….?” questions. For instance, “What if the price of natural gas doubles?” or “What if the final
cost of energy produced by PV decrease?”.
These parameters will use in this study as follows:
A) Variables:
Xt: The amount of energy in MWh generated during hour t from the Grid to meet the
demand
Yt: The amount of energy in MWh generated during hour t from the PV to meet the demand
∆ SCt: Difference in stored energy level in CAES from period t to t + 1
∆ SBt: Difference in stored energy level in Battery from period t to t + 1
B) Definitions:
SCt: The amount of potential stored electricity in CAES at the beginning of hour t
SBt: The amount of potential stored electricity in Batteries at the beginning of hour t
Vt: The value of any stored energy carried over until the hour t
C) Parameters:
ti : Hours of the day, ti ∈ {1, 2,…..,24}
AC(t): Avoided cost of electricity per MWh which is the differences between the cost of
energy on peak time and off peak time and it depends on finals price of generated electricity
in period t.
AC (t) : show the different price of generated electricity from Grid and PV
RCOut: Maximum CAES’s generator rate per hour
RCIn: Maximum CAES’s Compressor rate per hour
RB: Battery’s rate per hour

54
BC: Battery Capacity at rated depth of discharge
PVt: PV panels generation in period t
G: Grid capacity
CF: Fuel cost
f: CAES conversion Factor
e: Battery roundtrip efficiency
Dt: Demand for load during hour t in MW
I: The variable I is an indicator variable equal to one if the subscript condition is satisfied,
and zero otherwise.
S: The amount of shortage
Smax: Maximum amount of shortage
CS: Penalty of the shortage
M: Infinite positive number

55
4-2 Non-Linear Model
The non-linear model is as follows:
Maximize Vt = I∆SC(t) ≥0, ∆SB(t) ≥0 [AC(t)*(∆SCt + ∆SBt )] +
I∆SC(t) ≤0, ∆SB(t) ≤0 { – [∆SBt *(AC(t) ) * e] – [∆SCt ( AC(t) – CF ) * f ]} + (AC (t) * Yt )
S.t.
(1) SCt+1 = SCt + ∆ SCt
(2) SBt+1 = SBt + ∆ SBt
(3) ∆ SCt ≥ - min { SCt , RCOut }
(4) ∆ SBt ≥ - min { SBt , RB }
(5) ∆ SCt ≤ min { Yt , RCIn }
(6) ∆ SBt ≤ min { Yt , RB }
(7) Yt + ∆ SCt + ∆ SBt < PV
(8) Xt + Yt + SCt + SBt ≥ Dt
(9) Yt ≤ Dt
(10) Yt ≤ PVt
(11) Xt < G
ti ∈ {0, 1, 2,…..,23}, I ∈ {0,1}, Xt , Yt , ∆ SCt , ∆ SB ≥ 0
4-3 Model Description
In this model, hourly time intervals have been used for ease of study. However, in the real
world it can be defined for second to second time intervals. Equation (1) and (2) show levels of
stored energy in storage systems at the beginning of next period is equal to levels of the stored

56
energy at the beginning of current period plus the amount of energy which is stored or given from
the storage systems in the current period.
When ∆SCt or ∆SBt are negative, it means that energy is taken out from the storage system.
In inequality (3), energy cannot be taken out from the CAES faster than the maximum generator’s
rate and more than available stored energy. Similarly, inequality (4) shows that energy cannot be
taken out from the batteries faster than the battery’s rate and more than available stored energy in
the battery.
Inequality (5) and (6) show that energy cannot be charged into the system faster than the
maximum compressor’s rate and the maximum battery’s rate. Also, the difference in energy levels
cannot exceed PV generation.
Inequality (7) shows the total amount of stored energy by all storage systems plus part of
PV generation that goes for meeting the demand during hour t cannot exceed the PV generation
during that time, since PV generation is the only source for feeding all storage systems. Although,
most of the time, RCIn and RB are smaller than PV generation. PV generation varies day to day
and it highly depends on time of a day. It usually has its peak around 10:00 AM to 3:00 PM. In
case PV generation is zero, storage systems will be discharged when extra energy is needed and it
means ∆SCt and ∆SBt are negative and inequality (7) still will be satisfied.
Inequality (8) can guarantee that we do not have any shortage in the system, because in
each period, generation plus stored amount of energy should be equal to or greater than demand.
Shortage can be added to this model, but maximum amount of shortage and the penalty for the
shortage should be considered.
(8’) Xt + Yt + SCt + SBt – S ≥ Dt
(12) S ≤ Smax

57
Inequality (9) and (10) show that the part PV generation that goes for meeting the demand
cannot exceed the demand and PV generation. Inequality (11) is the capacity limitation for the grid
generation.
In the objective function, it has been assumed that storage systems don’t have energy at the
beginning of the day (t=1). The value of energy at this period is equal to difference between
avoided cost and the cost for taking out the stored energy multiplied by CAES convention factor
(f) or battery efficiency (e).
To take out energy from CAES fuel cost (CF) need to be paid. CAES uses fuel to preheat
the air before putting air into the generator to increase the efficiency of the storage system.
Objective function calculates the value of energy for periods of a day. It depends on the stored
energy taken out or given into each energy storage system.
There are two possible states for ∆SCt, ∆SBt. They are either both greater than or equal to
zero or less than or equal to zero. It means that there is no situation when ∆SCt ≥0 and ∆SBt ≤0 or
vice versa. The reason is when there is not enough generation to meet the demand, PV generation
would be used to compensate the shortage and if it wasn’t enough either of the two storage systems
will be used so, there is no more PV generation to feed the other one.
Objective function is highly depended on the avoided cost (ACt) and (AC t). ACt has been
added to system to show the effect of different price of electricity generation during a day. AC t is
added to the system to show the different price of generated electricity from Grid and PV. ACt
always vary from a period to another period. It is obvious that the load profile of demand has a
great impact on the prices. Consequently, by fluctuating in demand, electricity prices fluctuate
constantly. For instance, price of electricity in 10:00 AM is cheaper than 10:00 PM. Therefore,
avoided cost (ACt) has been selected to show the impact of different price of electricity during a

58
day. As an example, if the storage systems start charging on off peak demand periods when the
prices are lower, avoided cost (ACt) has greater value compared to situation when storage systems
start charging on high peak demand periods since, price of electricity is different in off peak and
high peak periods. Therefore, electricity prices can change the optimum solution for generation
and storage planning since higher electricity prices lead to lower avoided cost.
Fuel cost (CF) is one of the most important parameters in this model due to its fluctuation.
Energy will be stored in CAES as long as fuel cost has reasonable value compared to the avoided
cost for using CAES.
Load profile is fluctuating inherently and it changes second to second. It depends on
different occasions in each day. Therefore, the exact amount of demand is always unknown and
we only have an estimation based on the previous data.
Variable I is 1 when the subscript condition is satisfied and zero otherwise.
4-4 Model Assumptions
The presented model is general and can be used in any system consists of grid and PV
generation, CAES and batteries. In this section, some assumptions will be used for ease of study.
Hourly time intervals have been used
The level of stored energy at the beginning of each day (t=1) have been assumed to be zero.
PV is the only source feeding ESSs.
All hybrid system’s components are already existed and there is no capital investment.
No storage system can be charged while, the other ESSs are discharging.
Shortage is not allowed in this model.
It has been assumed that one type of battery is being used in this system.

59
Demand is constant during each time interval.
Grid generation is always constant during a day for all intervals.
Due to the final price of electricity, first priority for meeting the demand is by PV and then
Storage systems. Grid is the last option for responding to unmet demand.
It has been assumed that there is not priority between CAES and battery.
It has been assumed that energy loss is zero.
4-5 Model Analysis
4-5-1 Cost
As mentioned earlier, this model can have different objectives. For instance, one of the
common objectives is based on the cost and define the best set of variables to minimize the cost.
This model supposes that all the facilities are existed and there is no extra cost for buying a new
ESS.
Capital investment is one of the most important parameters for investors. To modify this
model, we can assume the network already has CAES and PV panels but, batteries are an optional
choice to reduce the cost, shortage and etc.
Batteries can be used for short term storage to shave the peak periods in load profile.
Sometimes, load is not that much high to expand air into CAES. In this case, batteries can give
energy to the system to reduce total cost, increase CAES and network efficiency, and reduce fuel
consumptions. All these decisions need accurate analysis. In this scenario, capital investment for
the batteries can be added to the objective. Also, by using this model, comparison between different
batteries can be done.

60
Each battery has several attributes like capacity, depth of discharge, capital investment, power
rate and etc. One step further, we can find the optimum number of each type of batteries. Different
objectives can be defined based on the cost because, there are different kinds of cost associated
with ESSs. Moreover, we can specify the objective function to maximize the value of energy
carried over each period.
This model is able to do sensitivity analysis for variables by investigating effects of natural gas
price fluctuation on the total cost. CAES is one of the ESSs that uses natural gas to preheat the
compressed air to increase the efficiency of the storage system. So, to use stored energy a fuel cost
(CF) need to be paid. On the other hand, when energy is stored in CAES, the amount of ACt will
be saved. That is why fuel cost is considered in objective function.
Sensitivity analysis is able to answer what-if questions like what will happen if the price of
natural gas or fuel gas increases 2 percent. Therefore, the impact of fuel cost fluctuation on the
system can be find because, change in one variable leads to different values for other variables.
4-5-2 Energy Storage System Attributes
There are different kinds of batteries, PV panels and CAES. This model can analyze and
compare different kinds of each storage system. For instance, an analysis can be done between
1000KW and 2000KW of Lithium-Ion battery. This model can find what will happen if the CAES
capacity increase for example from 322MW to 441MW. Each of these scenarios have different
associated costs and model will find the best solution with various input data and objective
function.
Size of storage devices is an important parameter for many applications. For a given
amount of energy, the higher the power and energy densities are, the smaller the volume of the
required energy storage system will be. Lifetime and cycling times are two factors which affect

61
the overall investment cost. Low lifetime and low cycling times will increase the cost of
maintenance and replacement.
4-6 Optimization and Simulation
Optimization is a method to find the optimum or near to the optimum solution for a model
with respect to the objective and constraints. Optimization methods try to find the best value for
variables to satisfy the constraints and maximize or minimize a real objective from a set of
alternative solutions. To solve operational research problems there are different methods like
Genetic Algorithm, Dynamic Programing, Integer Programing, Linear Programing, Non-linear
Programing and etc. [48].
The presented model in this study is a kind of Non-Linear Programming. Based on the
operation Research principles, the non-linear model has been transformed to a linear model to be
solvable with any operation research method or software.
As mentioned earlier, load demand is not a constant value and it fluctuates second to
second. Moreover, some other inputs like PV generation and natural gas price are fluctuating
constantly. Moreover, each interval of a day is somehow depended on the other periods. The
amount of energy carried over each period impacts on the amount of generation and storage of
current period. To find the accurate optimum value for the objective, model should be updated
every time that one of the inputs changes.
On the other hand, simulation techniques usually use for more complex models when the
input variables change a lot. Simulation methods try to find the behavior of a real model over the
time. Simulation is able to answer what if questions about changes in the model. When one or
more inputs change over the time, simulation software can update the model quickly and do the

62
analyses under the new conditions. Although, there is no guarantee in simulation methods to find
the optimal solutions but, they are still the best way for the systems which change constantly.
The optimization is useful for the strong models with known inputs while simulation is
being used in the situations which inputs are conditional and dynamic. Since some inputs of this
model change a lot, simulation can be run to find a solution for a set of variables. Although, by
defining a constant value for inputs, optimization can s find the solution.
4-7 Linear Model
The non-linear model has been transformed to a linear model as follow:
Maximize Vt = I * [AC(t)*(∆SCt + ∆SBt )] +
(1-I) {– [∆SBt (AC(t) ) * e] – [∆SCt ( AC(t) – CF ) * f ]} + (AC (t) * Yt )
S.t.
(1) SCt+1 = SCt + ∆ SCt
(2) SBt+1 = SBt + ∆ SBt
(3) (-) ∆ SCt ≤ SCt
(4) (-) ∆ SCt ≤ RCOut
(5) (-) ∆ SBt ≤ SBt
(6) (-) ∆ SBt ≤ RB
(7) ∆ SCt ≤ Yt
(8) ∆ SCt ≤ RCIn
(9) ∆ SBt ≤ Yt
(10) ∆ SBt ≤ RB
(11) Yt + ∆ SCt + ∆ SBt < PV
(12) ∆SCt > (1-I)*(-M)

63
(13) ∆SBt> (1-I)*(-M)
(14) ∆SCt < IM
(15) ∆SBt < IM
(16) Xt + Yt + SCt + SBt ≥ Dt
(17) Yt < Dt
(18) Yt ≤ PVt
(19) Xt < G
ti ∈ {0, 1,…..,23}, I ∈ {0,1}, {Xt , Yt , ∆ SCt , ∆ SB } ≥ 0
Each of the inequalities of (3), (4), (5) and (6) have been transformed to two separate
inequalities to eliminate Min function. In non-linear model, objective function was not linear.
Equations (12), (13), (14), and (15) are the linear substitution for objective function to define the
amount of “I” and satisfaction of the subscripts. The value of “M” that has been added to linear
model is an infinite positive number.
4-8 Numerical Example
In this section, an example is presented to illustrate the numerical calculation of some
parameters like avoided cost (AC) for one period and fuel cost (CF). To apply Operation Research
methods or simulation software, the value of these attributes must be known. Although, these
values vary in each time interval.
CAES attributes are as follows: [4]
CAES Capacity: 13 Hours at max generation
RCIn is 600 MW per hour

64
RCOut is 500 MW per hour
0.75 KWh of power used to store energy yields 1.0 kWh of energy while combined with
4300 BTU of natural gas. f = 1/0.75=1.33
As an example, Lead-Acid battery has been selected: [3]
BC is 10,000 KW
Hours of energy storage at rated capacity is 2
Depth of Discharge is 85% per cycle
RB is 1C rated, 10,000 KW per hour
e is 90 %
20 Battery exist in the system
The value for other parameters in this assumption are as follow:
CF is $0.080 per KWh [48]
PV capacity is 10000 MW [4]
AC is different for each period of a day. As an example, $0.277 (per KWh on peak) -
$0.058 (per KWh off peak) = $0.219 [13]. It is not always a constant value even in a day
and it depends on the electricity generation prices.
PV and Grid generation and demand profile depend on the time of a day.
As mentioned earlier, this model can have different functions. In this example, shortage is not
allowed in this network. Consequently, this model tries to find the results to meet the whole
demand. Cost function can be used as a target to minimize the cost based on the associated cost
like generation cost, avoided cost, natural gas cost and etc. For real problems, different cost
parameters can be added to the model.

65
In this example, we used a Lead-Acid battery while in real cases, different types and numbers
of batteries can be tested and be compared. Although one of the assumptions is that one type of
batteries being used in this system, it’s possible that the optimal solution offers a mix of various
kinds of batteries if different types of batteries add to the system. Unlike the batteries, types of
CAES are limited but, still a comparison between underground or above ground CAES with
different system size can be done by using this model. In this example, it is assumed that the
network has all the storage systems but, most of the time, the capital cost of ESSs is expensive
enough to change the results. Therefore, in real cases, the capital cost, maintenance cost and other
types of cost associated with ESSs should be considered.
Some of the parameters are estimated and it’s not possible to find the exact value for them. In
presence of uncertainty, sensitivity analysis can be done to illustrate the effect of changing a
parameter on the final solution. For instance, natural gas price is fluctuating constantly and it is
not accurate enough to use a constant value. On the other hand, estimating the CF (Fuel Cost)
based on dollar per KWh depends on several factors like the CAES system’s attribute. Sensitivity
analysis can find what will be the result if one of the parameters like CF change. Sensitivity
analysis is able to provide a range for each parameters to keep the same optimal solution.
Based on this model, hybrid system can consist of one of the following scenarios:
Grid without ESSs
Grid + CAES
Grid + Batteries
Grid + CAES + Batteries
Grid + PV without ESSs
Grid + PV + CAES
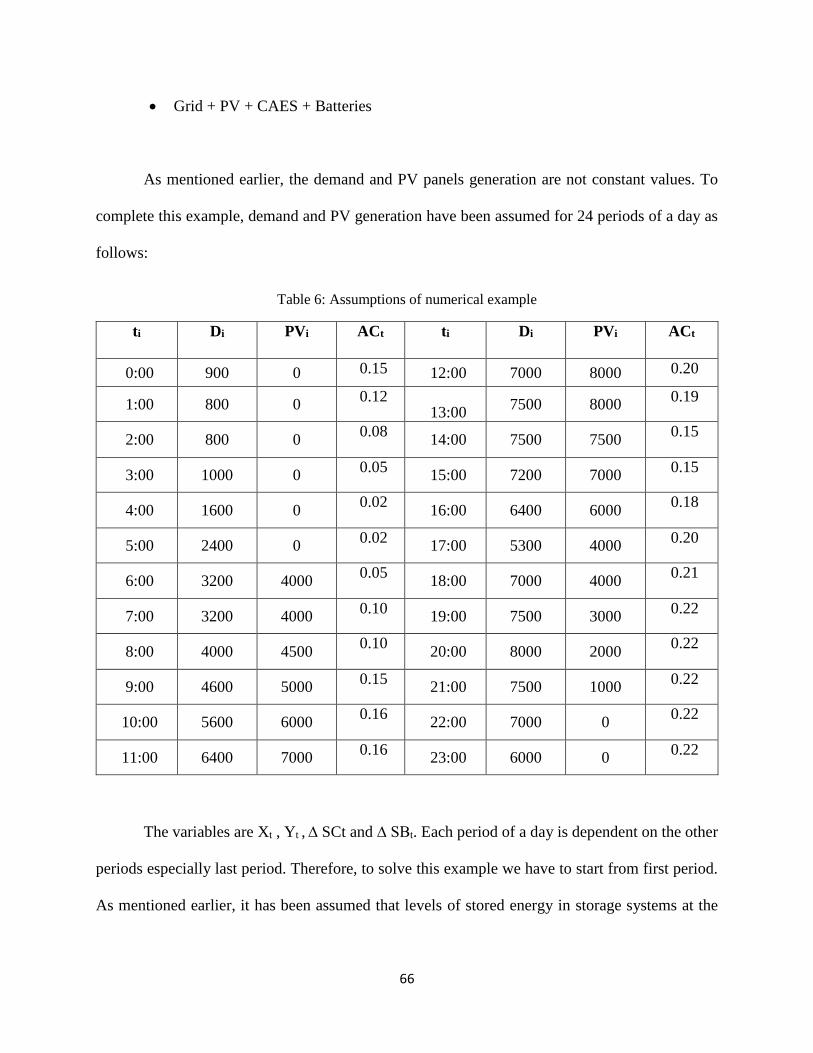
66
Grid + PV + CAES + Batteries
As mentioned earlier, the demand and PV panels generation are not constant values. To
complete this example, demand and PV generation have been assumed for 24 periods of a day as
follows:
Table 6: Assumptions of numerical example
The variables are Xt , Yt , ∆ SCt and ∆ SBt. Each period of a day is dependent on the other
periods especially last period. Therefore, to solve this example we have to start from first period.
As mentioned earlier, it has been assumed that levels of stored energy in storage systems at the
ti Di PVi ACt ti Di PVi ACt
0:00 900 0 0.15 12:00 7000 8000 0.20
1:00 800 0 0.12
13:00 7500 8000
0.19
2:00 800 0 0.08
14:00 7500 7500 0.15
3:00 1000 0 0.05
15:00 7200 7000 0.15
4:00 1600 0 0.02
16:00 6400 6000 0.18
5:00 2400 0 0.02
17:00 5300 4000 0.20
6:00 3200 4000 0.05
18:00 7000 4000 0.21
7:00 3200 4000 0.10
19:00 7500 3000 0.22
8:00 4000 4500 0.10
20:00 8000 2000 0.22
9:00 4600 5000 0.15
21:00 7500 1000 0.22
10:00 5600 6000 0.16
22:00 7000 0 0.22
11:00 6400 7000 0.16
23:00 6000 0 0.22
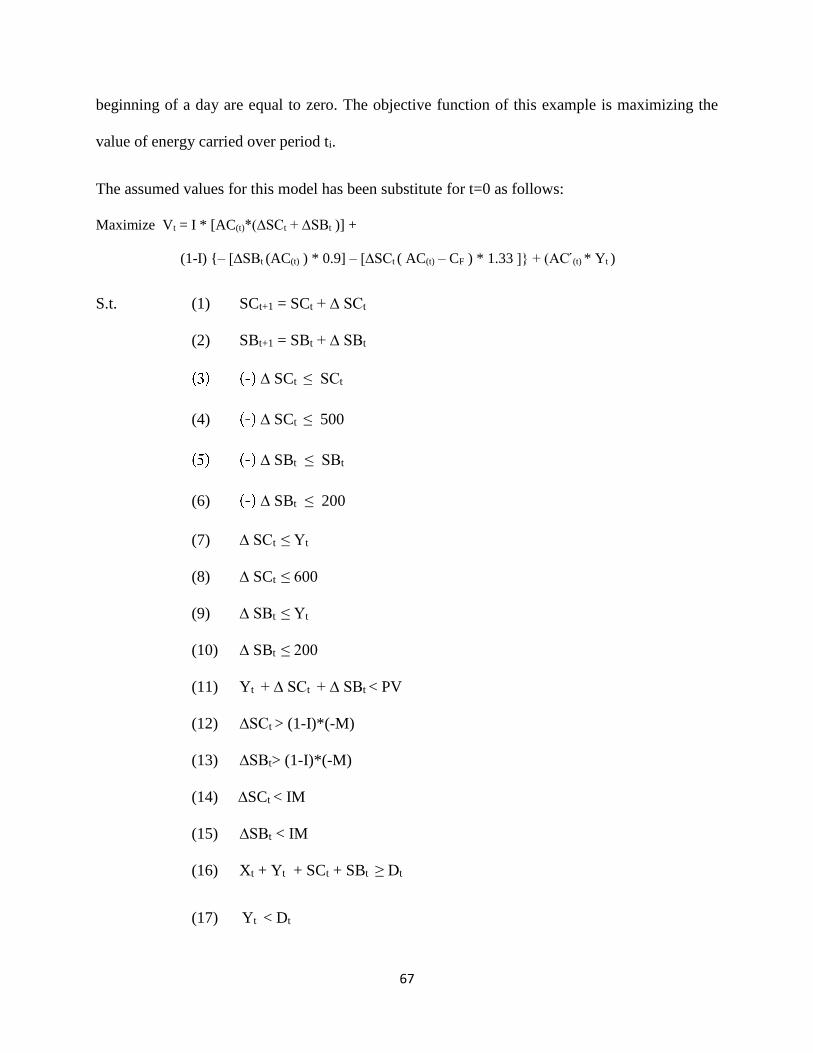
67
beginning of a day are equal to zero. The objective function of this example is maximizing the
value of energy carried over period ti.
The assumed values for this model has been substitute for t=0 as follows:
Maximize Vt = I * [AC(t)*(∆SCt + ∆SBt )] +
(1-I) {– [∆SBt (AC(t) ) * 0.9] – [∆SCt ( AC(t) – CF ) * 1.33 ]} + (AC (t) * Yt )
S.t. (1) SCt+1 = SCt + ∆ SCt
(2) SBt+1 = SBt + ∆ SBt
∆ SCt ≤ SCt
(4) ∆ SCt ≤ 500
∆ SBt ≤ SBt
(6) ∆ SBt ≤ 200
(7) ∆ SCt ≤ Yt
(8) ∆ SCt ≤ 600
(9) ∆ SBt ≤ Yt
(10) ∆ SBt ≤ 200
(11) Yt + ∆ SCt + ∆ SBt < PV
(12) ∆SCt > (1-I)*(-M)
(13) ∆SBt> (1-I)*(-M)
(14) ∆SCt < IM
(15) ∆SBt < IM
(16) Xt + Yt + SCt + SBt ≥ Dt
(17) Yt < Dt
68
(18) Yt ≤ PVt
(18) Xt < 20000
ti ∈ {0, 1, 2,…..,23}, I ∈ {0,1}, {Xt , Yt , ∆ SCt , ∆ SBt } ≥ 0
Price of electricity which comes from Grid is higher than price of generated electricity from
PV panels. In this model, it has been assumed that PV is the only source for feeding the storage
systems. It means that it doesn’t have economic justification to store the electricity that comes
from Grid. Although, in real world it may happen to prevent shortage but it this model it has been
assumed that PV is the only source for feeding storage systems.
To start solving this model, it has been assumed that level of stored energy in storage
systems is equal to zero at starting of the first period. For next days, energy can be carried over
from a day to next day. In t=0, PV doesn’t generate electricity and grid is the only source for
meeting the demand till PV starts generation in the morning. “Figure 22” shows the graphical
result of this example. It represents the demand profile, Grid generation, PV generation and level
of stored energy in storage systems.

69
Figure 23: Load Profile, PV Generation and Grid Generations for the numerical example.
Figure 24: State of charge of CAES and battery for the numerical example.

70
Figure 25: Power profile of the CAES and battery for the numerical example.

71
Table 7: Final results of the numerical example.
ti Xt Yt ∆ SCt
SCt ∆ SBt
SBt Vt
0:00 850 0 0 0 0 0 0
1:00 750 0 0 0 0 0 0
2:00 750 0 0 0 0 0 0
3:00 750 0 0 0 0 0 0
4:00 2500 0 0 0 0 0 0
5:00 3900 0 0 0 0 0 0
6:00 4200 100 0 0 0 0 5
7:00 3700 200 0 0 0 0 10
8:00 1800 1500 0 0 0 0 75
9:00 0 3500 0 0 0 0 175
10:00 0 3900 600 0 200 0 199.8
11:00 0 4200 600 600 200 200 215.6
12:00 0 5400 0 1200 100 400 270.8
13:00 0 4000 600 1200 200 500 205.6
14:00 0 3300 600 1800 200 700 171.4
15:00 0 3100 600 2400 200 900 162.2
16:00 0 2600 -500 3000 -100 1100 125.2
17:00 3400 1000 -500 2500 -200 1000 50
18:00 7000 500 -500 2000 -200 800 25
19:00 7100 0 -500 1500 -200 600 0
20:00 4600 0 -500 1000 -200 400 0
21:00 3000 0 -500 500 -200 200 0
22:00 0 0 0 0 0 0 0
23:00 0 0 0 0 0 0 0
For this example, Vt is equal to $1690.6. It shows the value of energy, which has been
stored by energy storage systems and the value of energy that generated by PV panels for a day in
this example.

72
By using this model, sensitivity analysis can be done for parameters. For instance, If AC
increases %20, V will be increased %19.5. It means that V is highly depends on AC. As an another
example, if Y(t) increases %5, V will be increased %4.9. Therefore, V is too sensitive to Y(t) and
AC.
1)
AC = $0.05 AC = $0.06 Increases %20
V = $1690.6 V = $2023.6 Increases %19.5
2)
Y(t) 1.05 Y(t) Increases %5
V = $1690.6 V = $1773.8 Increases %4.9

73
CHPATER FIVE
5- Conclusion and Scope of Future Research
Energy resource management is one of the most attractive topics in the last decades.
Scientist from all around the world try to use energy resources more efficiently. Traditional
resources are going to deplete if they are used as a primary source of energy. Renewable energy
resources have been emerged to help traditional resources, increase efficiency, decrease pollution,
help the environment, etc.
Renewable sources are clearer than traditional sources and are renewable quickly. One of
the problem associated with renewable sources is availability. They are not always available like
traditional resources. As an example, wind is not always the same speed, and climate changes have
a great impact on the output of wind turbines. Another example of renewable sources is solar PV
panels, which highly depend on the irradiance and climate. Because renewable energy sources are
not always available the reliability of the hybrid system will be decreased. Traditional sources
were more reliable than renewable sources. Adding energy storage systems can help the hybrid
system to increase the reliability of the system.
Energy storage systems can charge whenever that the energy source is available or the price
of electricity is less than peak demand. Storage systems can discharge during peak demand periods.
Also, they can be used as a backup for energy source or when the energy should be transported to
another location.
In this research, several types of energy storage systems have been studied in detail. The
topic is mainly focused on a hybrid system consisting of grid generation, renewable energy sources
and energy storage systems. The main purpose of this research was modeling and formulating a

74
hybrid system with respect to the most important constraints. This model can be studied in more
detail from various aspects by using different tools and methods of operation research. Generally,
when the model is ready, most of the analysis can be done more easily.
In this study, the hybrid system consist of Grid generation, PV generation, Compressed Air
Energy Storage and battery. The grid can feed the system in cases which the PV generation and
storage systems cannot respond to the demand. PV generation depends on the time of the day and
weather conditions. Battery is the common storage system which has been widely used to store
energy when the shortage is not too high or the storing period is not too long. Compressed air
energy storage can store the energy for longer periods of time and in larger amount. Recently,
researchers added fuel to preheat the gas before expansion to increase the efficiency of the system.
As a result, CAES uses natural gas to store and release the electricity.
For ease of study, some assumptions have been made. The presented model was first
nonlinear, since there were non-linear relation between some parameters. Using the big M method
could transfer the model to a linear one. The linear model can be solved by Simplex method,
Operation Research software like Math-lab or Simulation software like Simulink. All the
parameters should be specified to get a result.
The demand for electricity is not a constant value and it varies minute to minute. Based on
the demand, this model can find the best set of solutions for variables to maximize the value of
energy carried over and determine a schedule for charging and discharging the storage systems for
each day. The presented model is a theoretical model and in the real world, some assumptions may
be different.

75
Operation Research softwares need a linear model to find the optimum solution. So in this
study a linear model has been presented to make the mathematical model ready for software or
manual calculation. Using this model, sensitivity analysis can be done for some of the parameters
such as fuel cost to see the impact of any change on the objective value.
For further studies, PV panels can be studied more accurately with respect to irradiance
and reliability. Different types of batteries or a mix of other energy storage systems can be added
to the hybrid system. To have a more reliable system, wind turbines can be added to the system
to smooth out the generation, since PV and wind sources are complementary during a day.

76
References
[1] A. Nasiri and A. Esmaeili, "Evaluation of Impact of Energy Storage on Effective Load
Carrying Capability of Wind Energy," IEEE, Vols. 978-1-4673-0803-8/12/$31.00, p. 6,
2012.
[2] X. Luo, J. Wang, M. Dooner and J. Clarke, "Overview of current development in electrical
energy storage technologies and the application potential in power system operation,"
ELSEVIER, vol. 137, pp. 511-536, 2015.
[3] P. Denholm, J. Jorgenson, M. Hummon, T. Jenkin and D. Palchak, "The Value of Energy
Storage for Grid Applications," National Renewable Energy Laboratory, 2013.
[4] E. M. Mazhari, J. Zhao, N. Koyuncu, V. Kachanovskaya and B. Lyons, "Study of
Compressed Air Energy Storage with Grid and Photovoltaic Energy Generation," The
Arizona Research Institute for Solar Energy (AzRISE), 2010.
[5] B. &. Associates, Review of Environmental Studies and Issues on Compressed Air Energy
Storage, Pacific Northwest Laboratory, 1983.
[6] I. Hadjipaschalis, A. Poullikkas and V. Efthimiou, "Overview of current and future energy
storage technologies for electric power applications," ELSEVIER, vol. 13 (2009) 1513–
1522, p. 1513, 2009.
[7] D. Doughty and E. Roth, Electrochem. Soc. Interface, 37-44, 2012.
[8] I. Avdeev and M. Gilaki, "Structural analysis and experimental characterization of
cylindrical lithium-ion battery cells subject to lateral impact," Journal of Power Sources,
ELSEVIER, vol. 271, pp. 382-391, 2014.
[9] A. A. Akhil, G. Huff, A. B. Currier, B. C. Kaun, D. M. Rastler and S. B. Chen, "DOE/EPRI
2013 Electricity Storage Handbook in Collaboration with NRECA," SANDIA NATIONAL
LABORATORIES, 2013.
[10] M. H. Balali, N. Nouri, A. Nasiri and H. Seifoddini, "Development of an Economical Model
for a Hybrid System of Grid, PV and Energy Storage Systems," in ICRERA, 2015.
[11] Tappehsari, H. G. Takami, K. Mousavi and D. Erik, "Estimation of electricity losses by
numerical approach to present a solution for losses reduction," International Journal of
Advanced Engineering Applications,, vol. 7, no. 4, pp. 30-40, 2014.
[12] R. Zito, Energy Storage: New Approach, Scrivener Publishing LLC, 2010.

77
[13] USGS, "The U.S. Geological Survey Energy Resources Program," Science for Changing
World, 2010.
[14] N. Nouri, M. H. Balali and A. Nasiri, " Water Withdrawal and Consumption Reduction
Analysis for Electrical Energy Generation Systems," Journal of Environmental Studies and
Sciences, The Food-Energy-Water Nexus, no. March, 2016.
[15] P. S. C. o. Wisconsin, "Renewable Energy Resources," Madison, 2011.
[16] W. Otieno and L. Bosman, "Solar PV Selection Decision Tool: The case of U.S.A. Midwest
Region," Journal of Civil Engineering and Environmental Technology , 2014.
[17] I. E. Agency, "Technology Roadmap Hydropower," 2012.
[18] R. DiPippo, Geothermal Power Plants - Principles, Applications, Case Studies and
Environmental Impact (2nd Edition), ELSEVIER, 2012.
[19] R. E. World, "Geothermal Sources," reneableenergyworld.com.
[20] I. E. Comission, Electrical Energy Storage, 2011.
[21] Yusef Brunet, Energy Storage, Electric Drivers, ISTE Ltd, 2011.
[22] C.-J. Yang and R. B. Jackson, "Opportunities and barriers to pumped-hydro energy storage
in the United States," Renewable and Sustainable Energy Reviews, vol. 15, pp. 839-844,
2011.
[23] U. D. o. E. (DOE).
[24] F. E. M. P. (FEMP), Flywheel Energy Storage, US Department of Energy.
[25] A. D. Moghadam, B. F. Schultz, J. Ferguson, E. Omrani, P. K. Rohatgi and N. Gupta,
"Functional Metal Matrix Composites; Self-Lubricating, Self-Healing and Noncomposites-
An Outlook," The Minerals, Metals and Materials Society , 2014 .
[26] E. Omrani, A. D. Moghadam, P. L. Menezes and P. K. Rohatgi, "Influences of graphite
reinforcment on the tribological propertise of self-lubricating aluminum matrix composites
for green tribology, sustainability, and energy efficiency- A review," Int J Adv Manuf
Technol , 2015.
[27] EPRI and E. I. 1017811, Energy Storage and Distributed Generation Technology
Assessment: Assessment of Lead-Acid-Carbon, Advanced Lead-Acid, and Zinc-Air
Batteries for Stationary Application, Palo Alto: EPRI, 2009.
[28] EPRI, "Demonstration Initiative for a Grid Support Energy Storage System Using Li-ion
Technology," EPRI, California, 2012.

78
[29] R. Kottenstette and J. Cotrell, "Hydrogen Storage in Wind Turbine Towers: Design
Considerations," in National Renewable Energy Laboratory, Chicago, IL, 2004.
[30] J. M. Tarascon and M. Armand, "review article Issues and challenges facing rechargeable
lithium batteries," Nature, pp. 359-367, 2001.
[31] P. Simon and Y. Gogotsi, "Materials for electrochemical capacitors," Nature Materials, pp.
845 - 854, 2008.
[32] E. Frackowiak and F. Beguin, "Carbon materials for the electrochemical storage of energy
in," Carbon, 2001.
[33] A. Yu, V. Chabot and J. Zhang, Fundamentals of Electric Capacitors, 2013.
[34] P. Grbovic and J. Wiley, Ultra-Capacitors in Power Conversion Systems : Analysis,
Modeling and Design in Theory and Practice., 2013.
[35] Cabeza and L. F, Advances in Thermal Energy Storage Systems, ELSEVIER , 2015.
[36] I. Dincer and M. Rosen, THERMAL STORAGE SYSTEMS AND ENERGY
APPLICATIONS, SECOND EDITION, John Wiley & Sons, 2015.
[37] D. Mishra and S. Agarwal, Operation Research, Word Press, 2009.
[38] INFORMS.org, " About Operations Research," 2012.
[39] INFORM, "OPERATION RESEARCH," 2015.
[40] L. V. Kantorovich, "A new method of solving some classes of extremal problems," Doklady
Akad Sci USSR, vol. 28, pp. 211-214, 1940.
[41] F. L. Hitchcock, "The distribution of a product from several sources to numerous localities,"
1941.
[42] M. S. Bazaraa, H. D. Sherali and C. M. Shetty, Nonlinear Programming: Theory and
Algorithms, 2005.
[43] D. Gale, "Linear Programming and the Simplex Method," 2007.
[44] M. Bazara, J. J. and H. Sherali, "Linear Programming and Network Flows," John Wiley &
Sons , 1990.
[45] I. Maros, "A general phase-I method in linear programming," European Journal of
Operational Research, vol. 23, p. 64–77, 1986.
[46] M. Soleimani-damaneh, "Modified big-M method to recognize the infeasibility of linear
programming models," Knowledge-Based Systems, pp. 377-382, 2008.

79
[47] G.B. Dantzig, rogramming in a linear structure. Comptroller, United Air Force, Washington,
D.C.,, Washington DC, 1948.
[48] J. Pare, "Tabular comparisons of the costs of various electric generation technologies
presented in Tidal Power Technology," 2007.
[49] R. Draba, "Electric Wisconsin Electric Power Company," Michigan Public Service
Commission, 2012.