compilation of data to support development of a pesticide ... · yankton sioux tribe, charles mix...
TRANSCRIPT

Compilation of Data to Support Developmentof a Pesticide Management Plan by theYankton Sioux Tribe, Charles Mix County,South Dakota
Open-File Report 2004-1032
Prepared in cooperation with the U.S. Environmental Protection Agency
U.S. Department of the InteriorU.S. Geological Survey

Compilation of Data to Support Development of a Pesticide Management Plan by the Yankton Sioux Tribe, Charles Mix County, South Dakota
By Bryan D. Schaap
U.S. Department of the Interior U.S. Geological Survey
Prepared in cooperation with the U.S. Environmental Protection Agency
Open-File Report 2004-1032

U.S. Department of the InteriorGale A. Norton, Secretary
U.S. Geological SurveyCharles G. Groat, Director
U.S. Geological Survey, Reston, Virginia: 2004For sale by U.S. Geological Survey, Information Services Box 25286, Denver Federal Center Denver, CO 80225
For more information about the USGS and its products: Telephone: 1-888-ASK-USGS World Wide Web: http://www.usgs.gov/
Any use of trade, product, or firm names in this publication is for descriptive purposes only and does not imply endorsement by the U.S. Government.
Although this report is in the public domain, permission must be secured from the individual copyright owners to repro-duce any copyrighted materials contained within this report.
Suggested citation:Schaap, B.D., 2004, Compilation of data to support development of a pesticide management plan by the Yankton Sioux Tribe, Charles Mix County, South Dakota: U.S. Geological Survey Open-File Report 2004-1032, 23 p.

iii
Contents
Abstract. . . . . . . . . . . . . . . . . . . . . . . . . . . . . . . . . . . . . . . . . . . . . . . . . . . . . . . . . . . . . . . . . . . . . . . . . . . . . . . . . . . . . . . . . . . . . . . . . . . . . 1Introduction . . . . . . . . . . . . . . . . . . . . . . . . . . . . . . . . . . . . . . . . . . . . . . . . . . . . . . . . . . . . . . . . . . . . . . . . . . . . . . . . . . . . . . . . . . . . . . . . . 1
Purpose and Scope . . . . . . . . . . . . . . . . . . . . . . . . . . . . . . . . . . . . . . . . . . . . . . . . . . . . . . . . . . . . . . . . . . . . . . . . . . . . . . . . . . . 1Description of Study Area . . . . . . . . . . . . . . . . . . . . . . . . . . . . . . . . . . . . . . . . . . . . . . . . . . . . . . . . . . . . . . . . . . . . . . . . . . . . . 2
Data Sets. . . . . . . . . . . . . . . . . . . . . . . . . . . . . . . . . . . . . . . . . . . . . . . . . . . . . . . . . . . . . . . . . . . . . . . . . . . . . . . . . . . . . . . . . . . . . . . . . . . . 2Pesticide Use . . . . . . . . . . . . . . . . . . . . . . . . . . . . . . . . . . . . . . . . . . . . . . . . . . . . . . . . . . . . . . . . . . . . . . . . . . . . . . . . . . . . . . . . . 2Pesticide Concentrations in Surface Water. . . . . . . . . . . . . . . . . . . . . . . . . . . . . . . . . . . . . . . . . . . . . . . . . . . . . . . . . . . 10Topographic Data . . . . . . . . . . . . . . . . . . . . . . . . . . . . . . . . . . . . . . . . . . . . . . . . . . . . . . . . . . . . . . . . . . . . . . . . . . . . . . . . . . . . 10Geohydrologic Data. . . . . . . . . . . . . . . . . . . . . . . . . . . . . . . . . . . . . . . . . . . . . . . . . . . . . . . . . . . . . . . . . . . . . . . . . . . . . . . . . . 16Land Cover and Use. . . . . . . . . . . . . . . . . . . . . . . . . . . . . . . . . . . . . . . . . . . . . . . . . . . . . . . . . . . . . . . . . . . . . . . . . . . . . . . . . . 17Precipitation . . . . . . . . . . . . . . . . . . . . . . . . . . . . . . . . . . . . . . . . . . . . . . . . . . . . . . . . . . . . . . . . . . . . . . . . . . . . . . . . . . . . . . . . . 18Irrigation . . . . . . . . . . . . . . . . . . . . . . . . . . . . . . . . . . . . . . . . . . . . . . . . . . . . . . . . . . . . . . . . . . . . . . . . . . . . . . . . . . . . . . . . . . . . . 18Orthophotos. . . . . . . . . . . . . . . . . . . . . . . . . . . . . . . . . . . . . . . . . . . . . . . . . . . . . . . . . . . . . . . . . . . . . . . . . . . . . . . . . . . . . . . . . . 18
Selected References. . . . . . . . . . . . . . . . . . . . . . . . . . . . . . . . . . . . . . . . . . . . . . . . . . . . . . . . . . . . . . . . . . . . . . . . . . . . . . . . . . . . . . . 20Supplemental Information . . . . . . . . . . . . . . . . . . . . . . . . . . . . . . . . . . . . . . . . . . . . . . . . . . . . . . . . . . . . . . . . . . . . . . . . . . . . . . . . . . 21
Figures
1. Map showing the location of the historic Yankton Sioux Reservation and ecoregions . . . . . . . . . . . . . . .32. Map showing locations of selected water-quality sampling sites and hydrologic units . . . . . . . . . . . . 113. Graph showing concentrations of selected pesticides at Lake Andes above
Ravinia (06452390), 1990-2002 . . . . . . . . . . . . . . . . . . . . . . . . . . . . . . . . . . . . . . . . . . . . . . . . . . . . . . . . . . . . . . . . . . . . . 124. Graph showing atrazine concentrations at selected Lake Andes sites, 1990-2002 . . . . . . . . . . . . . . . . . 12
Tables
1. Pesticide data available for this report . . . . . . . . . . . . . . . . . . . . . . . . . . . . . . . . . . . . . . . . . . . . . . . . . . . . . . . . . . . . . .42. Estimated use of 31 herbicides in Charles Mix County, South Dakota, in 1987. . . . . . . . . . . . . . . . . . . . . . . .93. Statistical summaries of analytical results for selected total pesticide constituents for
Lake Andes stations, 1990-2000. . . . . . . . . . . . . . . . . . . . . . . . . . . . . . . . . . . . . . . . . . . . . . . . . . . . . . . . . . . . . . . . . . . 134. Analytical results for selected dissolved pesticide constituents for Lake Andes
stations, 2001-2002. . . . . . . . . . . . . . . . . . . . . . . . . . . . . . . . . . . . . . . . . . . . . . . . . . . . . . . . . . . . . . . . . . . . . . . . . . . . . . . . 145. Analytical results for selected dissolved pesticide constituents for Lake Francis
Case and the Missouri River, 2002 . . . . . . . . . . . . . . . . . . . . . . . . . . . . . . . . . . . . . . . . . . . . . . . . . . . . . . . . . . . . . . . . 156. Summary of geohydrologic data sets for the study area. . . . . . . . . . . . . . . . . . . . . . . . . . . . . . . . . . . . . . . . . . . 167. Land cover and use . . . . . . . . . . . . . . . . . . . . . . . . . . . . . . . . . . . . . . . . . . . . . . . . . . . . . . . . . . . . . . . . . . . . . . . . . . . . . . 178. Normal precipitation (1961-90), in inches, for selected South Dakota stations within
and near the historic Yankton Sioux Reservation area . . . . . . . . . . . . . . . . . . . . . . . . . . . . . . . . . . . . . . . . . . . . 189. Irrigation within the study area . . . . . . . . . . . . . . . . . . . . . . . . . . . . . . . . . . . . . . . . . . . . . . . . . . . . . . . . . . . . . . . . . . . 19

iv
Conversion Factors, Datums, and Acronyms
Vertical coordinate information is referenced to the the National Geodetic Vertical Datum of 1929 (NGVD 29).
Horizontal coordinate information is referenced to either the North American Datum of 1927 (NAD 27) or the North American Datum of 1983 (NAD 83). See metadata of the individual data sets for specific horizontal datum.
Multiply By To obtain
acre 4,047 square meter
acre 0.4047 hectare
cubic foot per second 0.02832 cubic meter per second
foot 0.3048 meter
gallon per minute 0.06309 liter per second
inch 2.54 centimeter
inch 25.4 millimeter
square mile 259.0 hectare
square mile 2.590 square kilometer
CD-ROM Compact Disk—Read Only MemoryDEM Digital Elevation ModelESRI Environmental Systems Research Institute, Inc.GIS Geographical Information SystemHTM Hypertext Markup LanguageHTML Hypertext Markup LanguageMRLC Multi-Resolution Land CharacteristicsMrSID Multi-Resolution Seamless Image DataNASS National Agricultural Statistics ServiceNCFAP National Center for Food and Agricultural PolicyNLCD National Land Cover DataNRCS U.S. Department of Agriculture, Natural Resource Conservation ServiceNWIS USGS National Water Information SystemNWS National Weather ServiceOPP Office of Pesticide ProgramsPDF Portable Document FormatPMP Pesticide Management PlanSDASS U.S. Department of Agriculture, South Dakota Agricultural Statistics ServiceUSDA U.S. Department of AgricultureUSEPA U.S. Environmental Protection AgencyUSGS U.S. Geological Survey

Compilation of Data to Support Development of a Pesticide Management Plan by the Yankton Sioux Tribe, Charles Mix County, South Dakota
By Bryan D. Schaap
Abstract
The U.S. Environmental Protection Agency is working with the Yankton Sioux Tribe to develop a pesticide manage-ment plan to reduce potential for contamination of ground water that may result from the use of registered pesticides. The purpose of this study was to compile technical information to support development of a pesticide management plan by the Yankton Sioux Tribe for the area within the Yankton Sioux Reservation, Charles Mix County, South Dakota. Five pesti-cides (alachlor, atrazine, cyanazine, metolachlor, and simazine) were selected by the U.S. Environmental Protection Agency for the management plan approach because they had been identi-fied as probable or possible human carcinogens and they often had been associated with ground-water contamination in many areas and at high concentrations.
This report provides a compilation of data to support development of a pesticide management plan. Available data sets are summarized in the text of this report, and actual data sets are provided in one Compact Disk—Read-Only Memory that is included with the report.
The compact disk contains data sets pertinent to the devel-opment of a pesticide management plan. Pesticide use for the study area is described using information from state and national databases. Within South Dakota, pesticides commonly are applied to corn and soybean crops, which are the primary row crops grown in the study area. Water-quality analyses for pesticides are summarized for several surface-water sites. Pesticide concentrations in most samples were found to be below minimum reporting levels. Topographic data are presented in the form of 30-meter digital elevation model grids and delineation of drainage basins. Geohydrologic data are provided for the surficial deposits and the bedrock units. A high-resolution (30-by-30 meters) land-cover and land-use database is provided and summarized in a tabular format. More than 91 percent of the study area is used for row crops, pasture, or hay, and almost 6 percent of the study area is covered by water or wetlands. Average monthly and yearly precipitation data are summarized in a tabular format. Irrigation information associated with permitted and licensed diversion points is provided. A composite of aerial photographs of Charles Mix County is provided. This report also describes and summarizes the data sets and files, and how the data are relevant to develop-ment of a pesticide management plan.
Introduction
Surface water and ground water are used for domestic, stock-watering, and irrigation purposes within Charles Mix County (Amundson, 2002). Various pesticides, including herbi-cides, insecticides, fungicides, and nematocides, are applied to row crops, which cover approximately 316 square miles, or about 46 percent of the historic Yankton Sioux Reservation. The U.S. Environmental Protection Agency (USEPA) is working with the Yankton Sioux Tribe to develop a pesticide management plan to reduce potential for contamination of ground water that may result from the use of registered pesti-cides. An important component of developing a pesticide management plan is to determine specific areas where ground water may be vulnerable to contamination.
The purpose of the study was to compile technical infor-mation in support of development of a pesticide management plan by the Yankton Sioux Tribe for Tribal lands. This study was performed by the U.S. Geological Survey (USGS) in cooperation with the USEPA.
Purpose and Scope
The purpose of this report is to provide information that can be used by the Yankton Sioux Tribe to develop a pesticide management plan for Tribal lands within the historic Yankton Sioux Reservation. The report provides a compilation of exist-ing technical data relevant to the process including pesticide-use, water-quality, topographic, geohydrologic, land-cover and land-use, precipitation, and irrigation data, and orthophotos. The report contains descriptions and summaries of the data sets, and describes how they might be used to evaluate aquifer vulnerability to pesticide contamination. The report also describes the organization of the data sets that are provided on one Compact Disk—Read-Only Memory (CD-ROM) that is included with the report. Five pesticides (alachlor, atrazine, cyanazine, metolachlor, and simazine) were selected by the USEPA for the management plan approach because they had been identified as probable or possible human carcinogens and they often had been associated with ground-water contamina-tion in many areas and at high concentrations (U.S. Environ-mental Protection Agency, 1996).

2 Data to Support Development of a Pesticide Management Plan by the Yankton Sioux Tribe
Description of Study Area
At one time, the Yankton Sioux Reservation consisted of the eastern part of Charles Mix County (fig. 1). As of 2003, Yankton Sioux Tribal lands were distributed throughout the historic Yankton Sioux Reservation. Information about owner-ship of individual parcels of land within the historic Yankton Sioux Reservation is not included in this report, but, when possible, the data have been presented in such a way that location-specific information can be retrieved. In this report, the historic Yankton Sioux Reservation is referred to as the study area.
The study area includes about 686 square miles, which includes the westernmost extent of continental glaciation and the eastern edge of the Great Plains (Bryce and others, 1998). This area includes parts of the Southern Missouri Coteau, Southern Missouri Coteau Slope, and Southern River Breaks ecoregions (fig. 1), which are distinguished on the basis of topography, soil types, and plant types. The Southern Missouri Coteau ecoregion is characterized by gradual changes in alti-tude and small areas of high density wetlands. The Southern Missouri Coteau Slope ecoregion is a transitional area between the Southern Missouri Coteau ecoregion to the north and the Southern River Breaks ecoregion to the south. The Southern River Breaks ecoregion, located along the Missouri River, is characterized by deciduous forest in the draws and northern aspects (Bryce and others, 1998).
The general geology of the study area consists of varying thickness of glacial drift on top of a bedrock shale. Glacial drift consists of till, glaciofluvial (stream) sediments, and glaciola-custrine (lake) sediments. Glacial till is a heterogeneous mixture of clay, silt, sand, gravel, and boulders, and is often very low in permeability. Glaciofluvial sediments include glacial-outwash deposits of sand and gravel deposited by flowing glacial meltwaters. Glaciolacustrine sediments are composed of layered deposits of clay, silt, and sand transported into ancient lakes by glacial meltwaters. Alluvium may be found along recent flood plains or lakebeds, and generally consists of deposits of silt, sand, and gravel. Loess and other wind-blown deposits are found on topographic highs near the Missouri River and consist of angular, well-sorted, fine-grained particles (Kume, 1977).
Data Sets
Several data sets are available for the study area and are included on the CD-ROM. Geospatial data are provided in Arc/Info coverages, which are compatible with several Geographical Information System (GIS) software packages. The geospatial coverages presented on the CD-ROM are in the Universal Transverse Mercator projection. Pesticide-use data are provided in Adobe Acrobat (.pdf) format or hypertext markup language (.htm). Water-quality data are presented in both Microsoft Excel Spreadsheet (.xls) format and tab-delimited text (.txt) format. A description and summary of each
data set and relevance to a pesticide management plan are provided, along with any special comments regarding format on the CD-ROM. The contents of the CD-ROM are listed in the Supplemental Information section at the end of this report.
Data for this study were obtained from a variety of sources, and those sources are described as completely as possible. Some data came from published maps and reports, and these are cited using traditional formats. Some data were downloaded from Internet sites, and the address and date of downloading are reported for these sources. Some data were downloaded from links created to the U.S. Department of Agriculture (USDA) Geospatial Data Gateway (http://lighthouse.nrcs.usda.gov/ gateway/gatewayhome.html). For this information, a request was submitted to the USDA Geospatial Data Gateway site, and a temporary link for downloading the data was created. Citing this link as the source of information would not be useful because it became inactive 5 days after it was created. For those data, the USDA Geospatial Data Gateway is cited as the source of the information, and the date that the data were downloaded also is cited.
Pesticide Use
Pesticide use within the study area mainly is to control weeds and insects on crops, although fungicides and nemato-cides may be used on certain crops. Information describing pesticide usage in the study area or parts of it were available from three sources. Herbicide-use data in 1987 by county for South Dakota are available from the USGS (Battaglin and Goolsby, 1994). Statewide pesticide-use data for South Dakota are available from the U.S. Department of Agriculture, South Dakota Agricultural Statistics Service (SDASS) (2001). A pesticide-use database for 1992 and 1997 is searchable by pesti-cide type, region, State, and crop (National Center for Food and Agricultural Policy Pesticide Use Database, 2001). Table 1 lists all of the pesticides that are included in at least one of these three sources of information or were analyzed for in the sampling programs described in the section “Pesticide Concen-trations in Surface Water.” A description of the pesticide-use data from each source and its format on the CD-ROM follows.
A 1987 compilation of annual use estimates of 96 herbi-cides for all counties in the conterminous United States was published by Battaglin and Goolsby (1994). The data are published digitally and are intended for estimating regional herbicide use and for producing maps showing relative rates of herbicide use across regions (Battaglin and Goolsby, 1994). Estimated use of 31 herbicides in Charles Mix County in 1987 is shown in table 2. Use estimates show that 2,4-D was applied to the greatest number of acres, whereas EPTC was applied at the highest rate. Data downloaded from the South Dakota Agri-cultural Statistics Service web site (http://www.nass.usda.gov/ sd/dnlds/dnld_c.htm) on August 28, 2003, show that 110,000 acres of corn, 23,300 acres of soybeans, and 38,000 acres of wheat were planted in Charles Mix County in 1987.

Data Sets 3
Figure 1. Location of the historic Yankton Sioux Reservation and ecoregions.
46
281
281
281 46
Lake
LakeAnd
es
CaseFrancis
FortRandallDam
MISSO
UR
I
RIVER
Choteau
Choteau
Creek
Creek
Cre
ekC
reek
Cho
teau
Choteau
Creek
Cre
ek
Cho
teau
WagnerWagner
RaviniaRavinia
Lake AndesLake Andes
PickstownPickstown
MartyMarty
Wagner
DanteDanteDante
Ravinia
Lake Andes
Pickstown
Marty
SouthernSouthern
MissouriMissouri
CoteauCoteau
Southern MissouriSouthern Missouri
Coteau SlopeCoteau SlopeSouthern
Southern
RiverRiver
BreaksBreaks
Southern
Missouri
Coteau
Southern Missouri
Coteau SlopeSouthern
River
Breaks0 2 4 6 8 10 KILOMETERS
0 2 4 6 8 10 MILES
Base from U.S. Geological Survey digital line graph 1:100,000, 1995Universal Transverse Mercator projection, zone 14
98º30'
98º20'
98º10'
43º 43º
98º10'
98º20'
43º10'43º10'
43º20' 43º20'
Boundary of Historic Yankton Sioux Reservation
Charles Mix County
SOUTHSOUTH DAKOTADAKOTASOUTH DAKOTA
Studyarea

4 Data to Support Development of a Pesticide Management Plan by the Yankton Sioux Tribe
Table 1. Pesticide data available for this report.
[Bold indicates detections in water-quality studies. Shaded rows indicate the five pesticides selected for the pesticide management plan approach]
Pesticide
Source of data
Battaglinand
Goolsby1
South DakotaAgricultural
StatisticsService2
National Centerfor Food andAgricultural
Policy3
Lake Andes4Lake Francis
Case/Missouri River5
2,4-D x x x X6,7
2,4-DB x x x7
2,4-DP X6
2,4,5-T x6,7
Acetochlor x x X7 X
Acifluorfen x x x7
Alachlor x x X6,7 x
Aldicarb x6,7
Aldicarb sulfone x6,7
Aldicarb sulfoxide x6,7
Aldrin x6
Alpha BHC x6,7 x
Ametryne X6
2,6-Diethyl aniline x7 x
Atrazine x x x X6,7 X
De-ethyl atrazine X6,7 X
De-isopropyl atrazine X6
Methyl azinphos x7 x
Benfluralin x7 x
Beta benzene hexachloride x6
Bentazon x x x x7
Bromacil X6,7
Bromoxynil x x x x7
Butachlor x6
Butylate x x x6,7 x
Carbaryl x x6,7 x
Carbofuran x x6,7 x
3-Hydroxy carbofuran x6,7
Carboxin x6
Chloramben x
Chlorethoxyfos x
Chlorimuron x
Chlordane x6
Chlorothalonil x x6,7
Chlorpyrifos x X6,7
Chlorsulfuron x x
Clethodim x x

Data Sets 5
Clomazone x
Clopyralid x x x7
Copper x
Cyanazine x x X6,7 x
Cycloate x6
Cyfluthrin x
Dacthal x7
DCPA x7 x
DEF x6
Delta benzene hexachloride x6
Diazinon x6,7 x
Dicamba x x x x7
Dichlobenil x7
Dichlorprop x7
Diclofop x x
Dieldrin x6,7 x
Difenzoquat x x
Dimethenamid x
Dimethoate x
Dinoseb x7
Diphenamid x6
Diquat x
Disulfoton x x6,7 x
Diuron X7
DNOC x7
Endosulfan x6
Endrin x6
EPTC x x x X7 X
Esfenvalerate x
Ethalfluralin x x x7 x
Ethion x6
Ethoprop x x7 x
Ethyl parathion x
Fenoxaprop x
Fenuron x7
Fluazifop x x
Flumetsulam x x
Table 1. Pesticide data available for this report.—Continued
[Bold indicates detections in water-quality studies. Shaded rows indicate the five pesticides selected for the pesticide management plan approach]
Pesticide
Source of data
Battaglinand
Goolsby1
South DakotaAgricultural
StatisticsService2
National Centerfor Food andAgricultural
Policy3
Lake Andes4Lake Francis
Case/Missouri River5

6 Data to Support Development of a Pesticide Management Plan by the Yankton Sioux Tribe
Flumiclorac x
Fluometuron x7
Fomesafen x
Fonofos x x6,7 x
Glyphosate x x x
Guthion x6
Halosulfuron x
Heptachlor epoxide x6
Hexazinone x6
Imazamethabenz x
Imazamox x
Imazapyr x
Imazaquin x
Imazethapyr x x x
Isoxaflutole x
Lactofen x
Lambdacyhalothrin x
Lindane x6,7 x
Linuron x7 x
Malathion x x6,7 x
Maleic hydrazide x
Mancozeb x
Maneb x
MCPA x x x x7
MCPB x7
Metalaxyl x
Methiocarb x6,7
Methomyl x6,7
Methoxychlor x6
Methylmetsulfuron x
Methylparathion x x6,7 x
Methyltribenuron x
Methyltrithion x6
Metolachlor x x x X6,7 X
Metribuzin x x X6,7 x
Metsulfuron x x
Mirex x6
Table 1. Pesticide data available for this report.—Continued
[Bold indicates detections in water-quality studies. Shaded rows indicate the five pesticides selected for the pesticide management plan approach]
Pesticide
Source of data
Battaglinand
Goolsby1
South DakotaAgricultural
StatisticsService2
National Centerfor Food andAgricultural
Policy3
Lake Andes4Lake Francis
Case/Missouri River5

Data Sets 7
Molinate x7 x
1-Napthol x6
Napropamide x7 x
Neburon x7
Nicosulfuron x x
Norflurazon x7
Oryzalin x7
Oxyamyl x6,7
P,P’-DDD x6
P,P’-DDE x6,7 x
P,P’-DDT x6
Paraquat x
Parathion x6,7 x
PCB x6
PCN x6
PCNS x6
Pebulate x7 x
Pendimethalin x x x x7 x
Permethrin x
Permethrin cis x7 x
Perthane x6
Phorate x x6,7 x
Picloram x x x7
Primisulfuron x x
Prometone X6,7 X
Prometryne x6
Pronamide x7 x
Propachlor x x x6,7 x
Propanil x7 x
Propargite x7 x
Propazine x6
Propham x6,7
Propiconazole x
Propoxur x6,7
Prosulfuron x
Quizalofop x
Rimsulfuron x x
Table 1. Pesticide data available for this report.—Continued
[Bold indicates detections in water-quality studies. Shaded rows indicate the five pesticides selected for the pesticide management plan approach]
Pesticide
Source of data
Battaglinand
Goolsby1
South DakotaAgricultural
StatisticsService2
National Centerfor Food andAgricultural
Policy3
Lake Andes4Lake Francis
Case/Missouri River5

8 Data to Support Development of a Pesticide Management Plan by the Yankton Sioux Tribe
Sethoxydim x x x
Silvex x6,7
Simazine x x X6,7 x
Simetryne x6
Sulfosate x
Tebuthiuron x7 x
Tefluthrin x
Terbacil x6,7 x
Terbufos x x7 x
Thiameturon x
Thifensulfuron x x
Thiobencarb x7 x
Thiophanate methyl x
Toxaphene x6
Tralomethrin x
Triallate x x x7 x
Triasulfuron x
Tribenuron x
Triclopyr x7
Trifluralin x x x x6,7 x
Triphenyltin hyd x
Trithion x6
Vernolate x6
1Only includes those pesticides in this database for Charles Mix County (Battaglin and Goolsby, 1994).2Accessed on the Internet at URL http://www.nass.usda.gov/sd/releases/agchem01.pdf on January 15, 2003. The report describes pesticide use in the State
of South Dakota.3Indicated for those pesticides with use greater than 0 pounds applied in 1997. Accessed on the Internet at URL http://pestdata.ncsu.edu/ncfap/search.cfm
on February 25, 2003. Estimates are for the State of South Dakota.4Sando and Neitzert (2003) and U.S. Geological Survey (1996-2003).5Samples collected during April and May 2002 by the Yankton Sioux Tribe (U.S. Geological Survey, 2003).6Samples collected during 1990-2000 (Sando and Neitzert, 2003).7Samples collected during 2001-2002 (U.S. Geological Survey, 2002-2003).
Table 1. Pesticide data available for this report.—Continued
[Bold indicates detections in water-quality studies. Shaded rows indicate the five pesticides selected for the pesticide management plan approach]
Pesticide
Source of data
Battaglinand
Goolsby1
South DakotaAgricultural
StatisticsService2
National Centerfor Food andAgricultural
Policy3
Lake Andes4Lake Francis
Case/Missouri River5

Data Sets 9
Table 2. Estimated use of 31 herbicides in Charles Mix County, South Dakota, in 1987.
[Data from Battaglin and Goolsby (1994). Shaded rows indicate pesticides selected for the pesticide management plan approach]
Pesticide Acres treated1 Pounds of activeingredient applied2
Pounds appliedper treated acre3
Pounds used persquare mile of
Charles Mix County4
2,4-D 55,921 23,831 0.426 21.145
2,4-DB 357 357 1.000 .317
Acifluorfen 1,149 287 .250 .255
Alachlor 35,042 54,636 1.559 48.479
Atrazine 21,102 19,505 .924 17.307
Bentazon 4,135 3,473 .840 3.082
Bromoxynil 13,502 4,402 .326 3.906
Butylate 2,087 8,349 4.000 7.408
Chloramben 763 1,756 2.301 1.558
Chlorsulfuron 1,861 33 .018 .029
Cyanazine 9,393 11,178 1.190 9.918
Dicamba 51,220 13,709 .268 12.164
Diclofop 1,607 1,206 .750 1.070
Difenzoquat 203 152 .749 .135
EPTC 26,273 115,516 4.397 102.498
Ethalfluralin 2,519 2,291 .909 2.033
Fluazifop 230 46 .200 .041
Glyphosate 4,595 2,365 .515 2.098
Imazethapyr 2,297 115 .050 .102
MCPA 20,846 7,921 .380 7.028
Metolachlor 12,915 27,052 2.095 24.003
Metribuzin 2,482 953 .384 .846
Metsulfuron 2,355 24 .010 .021
Pendimethalin 5,931 8,018 1.352 7.114
Picloram 2,532 1,266 .500 1.123
Propachlor 6,338 30,571 4.823 27.126
Sethoxydim 459 92 .200 .082
Simazine 1,333 1,999 1.500 1.774
Thiameturon 2,217 44 .020 .039
Triallate 542 542 1.000 .481
Trifluralin 20,056 15,714 .784 13.943
1Rounded to nearest acre.2Rounded to nearest pound.3Calculated for this report from columns 2 and 3.4Rounded to three decimal places.

10 Data to Support Development of a Pesticide Management Plan by the Yankton Sioux Tribe
Because Battaglin and Goolsby (1994) used cropping data from the 1987 Census of Agriculture, it is possible that crop management practices, herbicide use, and application methods have changed and the data may no longer represent current pesticide use. However, other available data sets do not give pesticide-use data on a county basis and are less specific in relating data to the study area. The Battaglin and Goolsby data are provided as a GIS coverage on the CD-ROM in the /pestuse/battaglin/ directory.
Statewide pesticide usage information (South Dakota Agricultural Statistics Service, 2001) shows that herbicides were applied to 100 percent of corn acreage in South Dakota and insecticides were applied to 15 percent of corn acreage in 2000. Atrazine was the most common herbicide applied, used on 42 percent of corn acreage, while acetolachlor was used on 34 percent of corn acreage. In 2000, herbicides were used on 98 percent of all soybean acreage, with glyphosate used on 67 percent of soybean acreage (South Dakota Agricultural Statistics Service, 2001). SDASS data for 2000 indicated that 120,000 acres of corn and 141,700 acres of soybeans, with fewer acres of wheat, hay, oats, and sunflowers, were harvested in Charles Mix County (South Dakota Agricultural Statistics Service, 2003a). SDASS data for 2002 indicated that 79,300 acres of corn and 128,800 acres of soybeans were harvested in Charles Mix County (South Dakota Agricultural Statistics Service, 2003b).
The National Center for Food and Agricultural Policy has a web-based database of pesticide use that is accessible at URL http://pestdata.ncsu.edu/ncfap/search.cfm. The database was constructed using available published reports of pesticide use and a survey of Extension Service specialists; thus, this database may overlap other data sources presented in this report.
Pesticide Concentrations in Surface Water
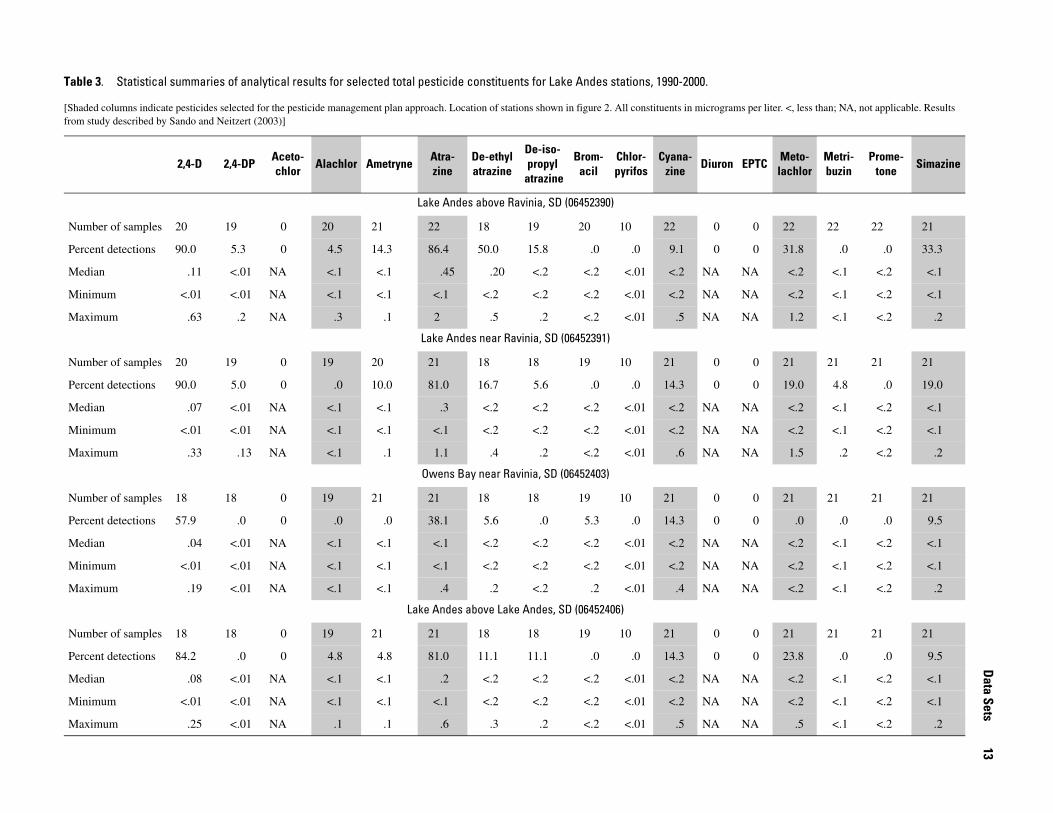
Surface water in the study area has been sampled for pesti-cides by the USGS and the Yankton Sioux Tribe at selected locations (fig. 2). Lake Andes was sampled from 1990-2002 by the USGS. Table 3 summarizes selected total pesticide concen-trations in Lake Andes during 1990-2000, and table 4 summa-rizes selected dissolved pesticide concentrations in Lake Andes during 2001-2002. Because of changes in analytical methods over time for some constituents, the minimum report-ing level is not consistent for all samples. Figure 3 shows concentrations for selected pesticides at Lake Andes above Ravinia (station 06452390) from 1990-2002. Figure 4 shows atrazine concentrations at four Lake Andes sampling sites from 1990-2002. For both figures 3 and 4, concentrations less than the minimum reporting level were plotted at one-half of the minimum reporting level. Samples were collected during April, May, or June. A total of 116 pesticides and pesticide
metabolites were analyzed for in samples from Lake Andes, and 17 of these were detected at least once (table 1).
The Yankton Sioux Tribe started sampling Lake Francis Case and the Missouri River at Fort Randall Dam in 2002 (fig. 2). Table 5 summarizes selected pesticide concentrations in Lake Francis Case and the Missouri River in April and May 2002. A total of 46 pesticides and pesticide metabolites were analyzed for in samples from Lake Francis Case and the Missouri River, and six of these analytes were detected in at least one sample (table 1).
Analytical results for samples collected from Lake Andes, Lake Francis Case, and the Missouri River at Fort Randall Dam are provided on the CD-ROM in the /watqual/ directory in Microsoft Excel Spreadsheet (.xls) format and tab-delimited text (.txt) format. The QWDATA.xls and QWDATA.txt files present the pesticides results, and the yst_organics.xls and yst_organics.txt files present the organics results, including pesticides.
Topographic Data
Topographic data for the study area are from the USGS 30-meter Digital Elevation Model (DEM) and are available on the CD-ROM. The DEM can be used to determine the altitude of the land surface at any point within the study area. For the study area, the minimum altitude is about 1,211 feet above NGVD 29, the maximum altitude is about 1,944 feet above NGVD 29, and the mean altitude is about 1,523 feet above NGVD 29. If the water-table altitude for a location within the study area is known, the DEM can be used to calculate the depth to the water table for that location. Slope determinations also can be made, which is a determining factor in the amount of runoff. Precipitation that falls on an area of steeper slope is more likely to run off into surface water and less likely to infil-trate into an aquifer than precipitation that falls on an area of lesser slope. The DEM also can be used to determine drainage patterns, delineate drainage basins, and generate summary statistics, such as minimum, maximum, and mean altitudes for selected areas.
The study area includes parts of the 10140101 Fort Randall Reservoir and 10170101 Lewis and Clark Lake hydro-logic units (fig. 2). These hydrologic units were defined at a scale of 1:250,000, and the data were accessed on the Internet on April 25, 2003, at URL http://water.usgs.gov/GIS/huc.html. Within the study area, the primary surface-water features of hydrologic unit 10140101 are Lake Andes and Lake Francis Case, and the primary surface-water features of hydrologic unit 10170101 are Choteau Creek and the Missouri River.

Data Sets 11
Figure 2. Locations of selected water-quality sampling sites and hydrologic units.
46
281
281
281 46
Lake
LakeAnd
es
CaseFrancis
FortRandallDam
MISSO
UR
I
RIVER
Choteau
Choteau
Creek
Creek
Cre
ekC
reek
Cho
teau
Choteau
Creek
Cre
ek
Cho
teau
WagnerWagner
RaviniaRavinia
Lake AndesLake Andes
PickstownPickstown
MartyMarty
Wagner
DanteDante
Ravinia
Lake Andes
Pickstown
Marty1017010110170101
1014010110140101
10170101
10140101
Owens Bay near RaviniaOwens Bay near Ravinia
Lake Andes near RaviniaLake Andes near Ravinia
Lake Andes above RaviniaLake Andes above Ravinia
Lake Andes above Lake AndesLake Andes above Lake Andes
Lake Francis CaseLake Francis Casenear Lake Andesnear Lake Andes
Missouri River at Fort Randall DamMissouri River at Fort Randall Dam
Owens Bay near Ravinia
Lake Andes near Ravinia
Lake Andes above Ravinia
Lake Andes above Lake Andes
Lake Francis Casenear Lake Andes
Missouri River at Fort Randall Dam
0 2 4 6 8 10 KILOMETERS
0 2 4 6 8 10 MILES
Base from U.S. Geological Survey digital line graph 1:100,000, 1995Universal Transverse Mercator projection, zone 14
98º30'
98º20'
98º10'
43º 43º
98º10'
98º20'
43º10'43º10'
43º20' 43º20'
Boundary of Historic Yankton Sioux Reservation

12 Data to Support Development of a Pesticide Management Plan by the Yankton Sioux Tribe
Figure 3. Concentrations of selected pesticides at Lake Andes above Ravinia (06452390), 1990-2002.
Figure 4. Atrazine concentrations at selected Lake Andes sites, 1990-2002.
1990 1991 1992 1993 1994 1995 1996 1997 1998 1999 2000 2001 20020
1
2
3
PE
ST
ICID
E C
ON
CE
NT
RA
TIO
N, I
N M
ICR
OG
RA
MS
PE
R L
ITE
RAlachlorAtrazine
MetolachlorCyanazine
Simazine
2,4-D
++
+
++ ++ ++ ++ ++ ++ ++ ++ ++++
+
+
++
1990 1991 1992 1993 1994 1995 1996 1997 1998 1999 2000 2001 20020
1
2
3
AT
RA
ZIN
E C
ON
CE
NT
RA
TIO
N, I
N M
ICR
OG
RA
MS
PE
R L
ITE
R
Lake Andes above Ravinia (06452390)
Lake Andes near Ravinia (06452391)
Owens Bay near Ravinia (06452403)
Lake Andes above Lake Andes (06452406)
Data Sets
13
er. <, less than; NA, not applicable. Results
Meto-lachlor
Metri-buzin
Prome-tone
Simazine
22 22 22 21
31.8 .0 .0 33.3
<.2 <.1 <.2 <.1
<.2 <.1 <.2 <.1
1.2 <.1 <.2 .2
21 21 21 21
19.0 4.8 .0 19.0
<.2 <.1 <.2 <.1
<.2 <.1 <.2 <.1
1.5 .2 <.2 .2
21 21 21 21
.0 .0 .0 9.5
<.2 <.1 <.2 <.1
<.2 <.1 <.2 <.1
<.2 <.1 <.2 .2
21 21 21 21
23.8 .0 .0 9.5
<.2 <.1 <.2 <.1
<.2 <.1 <.2 <.1
.5 <.1 <.2 .2
Table 3. Statistical summaries of analytical results for selected total pesticide constituents for Lake Andes stations, 1990-2000.
[Shaded columns indicate pesticides selected for the pesticide management plan approach. Location of stations shown in figure 2. All constituents in micrograms per litfrom study described by Sando and Neitzert (2003)]
2,4-D 2,4-DP Aceto-chlor
Alachlor Ametryne Atra-zine
De-ethylatrazine
De-iso-propyl
atrazine
Brom-acil
Chlor-pyrifos
Cyana-zine
Diuron EPTC
Lake Andes above Ravinia, SD (06452390)
Number of samples 20 19 0 20 21 22 18 19 20 10 22 0 0
Percent detections 90.0 5.3 0 4.5 14.3 86.4 50.0 15.8 .0 .0 9.1 0 0
Median .11 <.01 NA <.1 <.1 .45 .20 <.2 <.2 <.01 <.2 NA NA
Minimum <.01 <.01 NA <.1 <.1 <.1 <.2 <.2 <.2 <.01 <.2 NA NA
Maximum .63 .2 NA .3 .1 2 .5 .2 <.2 <.01 .5 NA NA
Lake Andes near Ravinia, SD (06452391)
Number of samples 20 19 0 19 20 21 18 18 19 10 21 0 0
Percent detections 90.0 5.0 0 .0 10.0 81.0 16.7 5.6 .0 .0 14.3 0 0
Median .07 <.01 NA <.1 <.1 .3 <.2 <.2 <.2 <.01 <.2 NA NA
Minimum <.01 <.01 NA <.1 <.1 <.1 <.2 <.2 <.2 <.01 <.2 NA NA
Maximum .33 .13 NA <.1 .1 1.1 .4 .2 <.2 <.01 .6 NA NA
Owens Bay near Ravinia, SD (06452403)
Number of samples 18 18 0 19 21 21 18 18 19 10 21 0 0
Percent detections 57.9 .0 0 .0 .0 38.1 5.6 .0 5.3 .0 14.3 0 0
Median .04 <.01 NA <.1 <.1 <.1 <.2 <.2 <.2 <.01 <.2 NA NA
Minimum <.01 <.01 NA <.1 <.1 <.1 <.2 <.2 <.2 <.01 <.2 NA NA
Maximum .19 <.01 NA <.1 <.1 .4 .2 <.2 .2 <.01 .4 NA NA
Lake Andes above Lake Andes, SD (06452406)
Number of samples 18 18 0 19 21 21 18 18 19 10 21 0 0
Percent detections 84.2 .0 0 4.8 4.8 81.0 11.1 11.1 .0 .0 14.3 0 0
Median .08 <.01 NA <.1 <.1 .2 <.2 <.2 <.2 <.01 <.2 NA NA
Minimum <.01 <.01 NA <.1 <.1 <.1 <.2 <.2 <.2 <.01 <.2 NA NA
Maximum .25 <.01 NA .1 .1 .6 .3 .2 <.2 <.01 .5 NA NA

14 D
ata to Support Developm
ent of a Pesticide Managem
ent Plan by the Yankton Sioux TribeTable 4. Analytical results for selected dissolved pesticide constituents for Lake Andes stations, 2001-2002.
er liter. <, less than; --, no data;
Meto-lachlor
Metri-buzin
Prome-tone
Simazine
0.036 <0.006 E0.013 0.087
.235 <.006 .015 .072
E.010 <.006 <.01 <.005
E.010 <.006 <.01 <.005
E.017 <.006 E.007 .018
.340 <.006 E.008 .032
<.013 <.006 E.01 <.005
E.012 <.006 <.01 <.005
E.012 <.006 <.015 .031
.022 <.006 <.015 .018
E.005 <.006 <.01 <.005
E.011 <.006 <.01 <.005
E.010 <.006 E.007 E.010
-- -- -- <0.1
E.011 <.006 E.01 .005
.023 <.006 E.01 <.008
[Shaded columns indicate pesticides selected for the pesticide management plan approach. Location of stations shown in figure 2. All constituents in micrograms pE, estimated. Data from U.S. Geological Survey (2002, 2003)]
Date 2,4-D 2,4-DPAceto-chlor
Ala-chlor
Ame-tryne
Atra-zine
De-ethylatra-zine
De-iso-propylatra-zine
Bro-macil
Chlor-pyri-fos
Cyana-zine
Diuron EPTC
Lake Andes above Ravinia, SD (06452390)
April 18, 2001 <0.11 -- <0.004 <0.002 -- 0.181 E.028 -- <0.54 <0.005 <0.018 <0.06 <0.002
June 26, 2001 <.15 -- .015 <.002 -- .286 <.006 -- <.17 <.005 <.018 <.06 .003
April 9, 2002 <.17 -- <.006 <.004 -- .028 E.005 -- <.09 <.005 <.018 <.12 <.002
June 11, 2002 <.16 -- <.006 <.004 -- .071 E.012 -- <.09 <.005 <.018 <.12 .013
Lake Andes near Ravinia, SD (06452391)
April 18, 2001 <0.14 -- <0.004 <.002 -- .141 E.032 -- <.45 <.005 <.018 <.13 <.002
June 27, 2001 <.96 -- .026 <.002 -- .220 <.006 -- <.11 <.005 <.018 <.06 .005
April 9, 2002 <.16 -- <.006 <.004 -- .024 E.004 -- <.09 <.005 <.018 <.12 <.002
June 11, 2002 <.16 -- <.006 <.004 -- .083 E.015 -- <.09 <.005 <.018 E.04 <.002
Owens Bay near Ravinia, SD (06452403)
April 18, 2001 <.11 -- <.004 <.002 -- .051 E.012 -- <.26 <.005 <.018 <.06 <.002
June 27, 2001 <.11 -- .039 <.002 -- .119 <.006 -- <.09 E.002 <.018 <.06 E.002
April 9, 2002 <.21 -- <.006 <.004 -- .011 E.002 -- <.09 <.005 <.018 <.12 <.002
June 11, 2002 <.16 -- .024 <.004 -- .100 E.019 -- <.09 <.005 <.018 <.12 <.002
Lake Andes above Lake Andes, SD (06452406)
April 18, 2001 <.11 -- <.004 <.002 -- .216 E.032 -- <.42 <.005 <.018 <.11 <.002
June 27, 2001 <.82 -- -- -- -- -- -- -- <.09 -- -- <.06 --
April 9, 2002 <.23 -- .007 <.004 -- .068 E.008 -- <.14 <.005 <.018 <.18 <.002
June 11, 2002 <.16 -- .021 <.004 -- .100 E.020 -- <.09 <.005 <.018 <.13 .005

Data Sets
15
ents for Lake Francis Case and the Missouri River, 2002.
approach. Location of stations shown in figure 2. All constituents in micrograms per liter. <, less than; --, no data;
-De-
ethylatra-zine
De-iso-propylatra-zine
Bro-macil
Chlor-pyri-fos
Cyana-zine Diuron EPTC
Meto-lachlor
Metri-buzin
Pro-me-tone
Sima-zine
ncis Case near Lake Andes, SD (430419098401600)
3 E0.006 -- -- -- <0.018 -- <0.002 E0.010 <0.006 E0.01 <0.005
5 E.004 -- -- -- <.018 -- .004 E.005 <.006 <.01 <.005
souri River at Fort Randall Dam, SD (06453000)
1 E.005 -- -- -- <.018 -- <.002 E.009 <.006 <.01 <.005
7 E.005 -- -- -- <.018 -- .003 E.006 <.006 <.01 <.005
Table 5. Analytical results for selected dissolved pesticide constitu
[Shaded columns indicate pesticides selected for the pesticide management plan E, estimated. Data from U.S. Geological Survey (2003)]
Date 2,4-D 2,4-DPAceto-chlor
Ala-chlor
Ame-tryne
Atrazine
Lake Fra
April 22, 2002 -- -- <0.006 <0.004 -- 0.02
May 20, 2002 -- -- E.005 <.004 -- .02
Mis
April 23, 2002 -- -- <.006 <.004 -- .02
May 21, 2002 -- -- .009 <.004 -- .02

16 Data to Support Development of a Pesticide Management Plan by the Yankton Sioux Tribe
Geohydrologic Data
Coverages for geohydrologic data for the study area include generalized geology, extent of surficial aquifers, thick-ness of surficial deposits, estimated potential yield of surficial deposits, and extent of bedrock units (table 6). These coverages were produced by scanning, registering, and digitizing the published figures. A boundary for the Codell aquifer, which is a bedrock aquifer, is not provided because it underlies the entire study area (Kume, 1977). The geohydrologic data can be used to determine which areas are vulnerable to pesticide contamina-tion.
The polygon coverage representing the generalized geol-ogy of the study area is based on Kume (1977, fig. 4). The coverage shows that most of the study area is covered with Quaternary-age deposits of alluvium, outwash, loess, and till. The alluvium generally is along Choteau Creek and the Missouri River. The outwash areas are generally along the allu-vium of Choteau Creek. The mapped loess deposits are along the Missouri River. Most of the study area is covered with till. The Cretaceous-age deposits of Pierre Shale and Niobrara Marl are primarily along Lake Francis Case and the Missouri River in the southern part of the study area. Narrow areas of Niobrara Marl were mapped between the Missouri River alluvium and the Pierre Shale.
The polygon coverage representing the surficial aquifers of the study area is based on Kume (1977, fig. 11). These aqui-fers (Choteau, Corsica, Geddes, Tower, Greenwood, Delmont, and minor aquifers) are composed of Quaternary-age sand and gravel deposits. A comparison with the generalized geology
coverage shows that some of these aquifers approximately correspond to units in the general geology coverage. For example, the Delmont aquifer is associated with the alluvium deposits along Choteau Creek, and the Tower and Greenwood aquifers are associated with mapped alluvium along the Missouri River. Other aquifers, such as the Choteau aquifer, which covers the largest area of any of the surficial aquifers, consist of several layers within the till (Kume, 1977, p. 16).
The arc coverage representing the thickness of the Quaternary-age surficial deposits is based on Kume (1977, fig. 9). The arcs indicate areas where the surficial deposits are 50, 100, 200, 300, and 400 feet thick. The areas with thick-nesses of 50 feet or less of surficial deposits are primarily along Lake Francis Case and the Missouri River. In the northwestern part of the study area, the surficial deposits are more than 300 feet thick, and in the northeastern part of the study area, the surficial deposits are more than 400 feet thick.
The polygon coverage representing the estimated potential yield of surficial deposits is based on Kume (1977, fig. 16). The polygons indicate areas where the estimated potential yield ranges from less than 50 gallons per minute to more than 500 gallons per minute. The estimates are based on aquifer properties (thickness, extent, and material grain size) and reported yields of irrigation and municipal wells (Kume, 1977, p. 18). Most of the study area (49 percent) has an estimated potential yield of less than 50 gallons per minute, but about 17 percent of the study area has an estimated potential yield of more than 500 gallons per minute. Some of the area with an estimated potential yield of more than 500 gallons per minute is along the Missouri River and is associated with the Tower
Table 6. Summary of geohydrologic data sets for the study area.
Geohydrologic data setArc/Info
coverage name
Contents of coverage
Generalized geology geology Polygon coverage of alluvium, loess, till, outwash, Pierre Shale, and Niobrara Marl (Kume, 1977, fig. 4)
Extent of surficial aquifers surficial_aq Polygon coverage of the Choteau, Corsica, Geddes, Tower, Greenwood, Delmont, and minor surficial aquifers (Kume, 1977, fig. 11)
Thickness of surficial deposits thicknessdep Arc coverage of thickness of surficial deposits (50, 100, 200, 300, and 400 feet) (Kume, 1977, fig. 9)
Estimated potential yield of surficial deposits
est_yield Polygon coverage of estimated potential yield (less than 50, 50 to 100, 100 to 150, 150 to 250, 250 to 500, and more than 500 gallons per minute) (Kume, 1977, fig. 16)
Extent of bedrock units bedrock Polygon coverage of Ogallala undifferentiated, Pierre Shale, Niobrara Marl, and Carlile Shale (Hedges, 1975, fig. 5)

Data Sets 17
and Greenwood aquifers, but most of this area appears to be associated with the Choteau and Delmont aquifers and surficial deposits with thicknesses of more than 200 feet.
The polygon coverage representing the bedrock geology of the study area is based on Hedges (1975, fig. 5). For most of the study area, the uppermost bedrock unit is the Cretaceous-age Carlile Shale, Niobrara Marl, or Pierre Shale. The Carlile Shale is found along the Missouri River and Choteau Creek. The Niobrara Marl is found to the north of the Carlile Shale along the Missouri River and in an irregularly shaped body trending northwest to southeast. The Pierre Shale is the uppermost bedrock unit in the rest of the study area, except for some isolated areas of Tertiary-age Ogallala undifferentiated deposits (Hedges, 1975).
Land Cover and Use
Land-cover data were developed for the Multi-Resolution Land Characteristics (MRLC) Consortium, an interagency project involving the USGS, the USEPA, the National Oceano-graphic and Atmospheric Administration, and the USDA, Forest Service. The National Land Cover data sets are high-resolution (30-by-30-meters) digital data describing land cover
for the conterminous United States. Twenty-one general land-cover classes were developed for mapping 30-meter Landsat thematic mapper satellite data. Only 13 of the 21 land-cover classes were present within the study area. The data are orga-nized by State and were downloaded with the metadata from the Internet on January 16, 2003, using links to the Geospatial Data Gateway. The National Land Cover data set for South Dakota was preliminary at the time this study was completed; therefore, the accuracy assessment of the data set was not completed. Land-cover and land-use data can be used to determine where pesticides and fertilizers are likely to be applied, where crops are irrigated, and where urban development is located. Land-cover and land-use data for Charles Mix County and the study area are summarized in table 7. Information for Charles Mix County is included because some information, including pesti-cide use, is only available on a county-by-county basis. Using the number of acres within Charles Mix County and within the study area, estimates can be made of the pesticide use within the study area.
Within the study area, three categories account for more than 91 percent of the land cover and use. Row crops (46.02 percent) cover the most area of any category, followed by pasture/hay (33.20 percent) and grasslands/herbaceous plants (11.86 percent).
Table 7. Land cover and use.
Land cover and useCharles Mix County
Within historicreservation boundary
Acres Percent Acres Percent
Row crops (corn, soybeans, sunflowers, etc.) 313,356.7 42.53 202,115.5 46.02
Pasture/hay (may be used for grazing or seed/hay crops) 237,796.2 32.27 145,811.0 33.20
Grasslands/herbaceous plants (grasses and forbs often utilized for grazing) 104,155.0 14.14 52,090.4 11.86
Open water 38,660.2 5.25 15,528.7 3.54
Deciduous forest 17,295.8 2.35 10,516.7 2.39
Emergent herbaceous wetlands 17,099.6 2.32 9,200.9 2.10
Evergreen forest 4,502.2 .61 1,390.3 .32
Commercial/industrial/transportation (infrastructure, such as roads and railroads) 1,787.3 .24 1,004.0 .23
Low intensity residential (most commonly single-family housing) 750.2 .10 367.0 .08
Small grains (wheat, barley, oats, etc.) 733.8 .10 560.9 .13
Woody wetlands 445.1 .06 410.4 .09
Urban/recreational grasses (parks, lawns, golf courses, air strips, etc.) 184.2 .02 124.6 .03
Bare rock, sand, clay 38.5 .01 29.8 .01
Total 736,793.6 100.00 439,150.2 100.00

18 Data to Support Development of a Pesticide Management Plan by the Yankton Sioux Tribe
Precipitation
Precipitation data can be used to determine when pesti-cides are likely to be applied. The data also may be used to esti-mate recharge to the ground-water system, which is often used as a factor in assessing sensitivity of ground-water systems to contamination (Focazio and others, 2002).
Precipitation data from 1961-90 for six National Weather Service (NWS) stations in or near the study area are presented in table 8. The average monthly values were downloaded from the Internet on February 13, 2003, at URL http://climate.sdstate.edu/web/GIS_index.htm. Two of the stations, Pickstown and Wagner (fig. 1), are within the study area and represent the smallest and second-largest annual precipitation totals, respectively, of the group. The average annual precipitation during the 30-year period was 22.25 inches at Pickstown and 25.20 inches at Wagner. For all six stations, the largest monthly averages were during May, June, or July and ranged from 3.63 to 4.10 inches. The smallest monthly averages for all six stations were during January and ranged from 0.32 to 0.58 inches.
Irrigation
Irrigation information was obtained from the South Dakota Department of Environment and Natural Resources, Water Rights Program (Ron Duvall, written commun., 2003). That information was used to create an Arc/Info point coverage with the data fields and values described in table 9. Irrigation data can be used to determine when and where pesticides are
likely to be applied. Irrigation data also may be used to improve recharge estimates.
The irrigation point coverage contains information about 58 permits (39 ground water and 19 surface water) for a total of 66 diversion points. Of the 58 permits, 51 have been licensed and the remaining 7 have not yet received the license from the State. The licensed irrigation withdrawals are for a total of 9,187.1 acres and 102.13 cubic feet per second. Of the 39 ground-water permits, 32 are for the Choteau aquifer, 3 are for the Delmont aquifer, 2 are for Pleistocene series aquifers, and 2 are for the Geddes aquifer. It should be noted that these aqui-fer designations are assigned by the State of South Dakota, and the locations of the withdrawals may be known only to the nearest 160 acres.
Orthophotos
The orthophotos data set for Charles Mix County is a composite of aerial photographs that have been registered to the Universal Transverse Mercator coordinate system. The photographs were taken from August 14, 1991, through September 3, 1998. The orthophoto data set was downloaded with the metadata from the Internet on February 21, 2003, using a link to the Geospatial Data Gateway.
The orthophotos can be used to compare surface features, such as roads and buildings, to subsurface information, such as estimated potential yield. They also can be used to compare reported irrigation diversion point locations to areas where the water is used and to observe changes in roads, drainages, land use, etc., over time.
Table 8. Normal precipitation (1961-90), in inches, for selected South Dakota stations within and near the historic Yankton Sioux Reservation area.
[Monthly values retrieved from URL http://climate.sdstate.edu/web/GIS_index.htm on Feb. 13, 2003]
Station Jan. Feb. Mar. Apr. May June July Aug. Sep. Oct. Nov. Dec. Annual
Armour 0.52 0.69 1.67 2.34 3.18 3.88 3.12 2.16 2.38 1.56 0.84 0.72 23.06
Bonesteel .32 .65 1.79 2.78 4.10 3.96 3.35 2.75 2.82 1.66 .83 .53 25.54
Pickstown .40 .52 1.57 2.35 2.97 3.97 2.74 2.28 2.46 1.51 .84 .64 22.25
Platte .48 .62 1.72 2.46 3.69 3.77 2.83 2.31 2.27 1.54 .86 .66 23.21
Tyndall .43 .64 1.55 2.31 3.38 3.60 3.63 2.41 2.56 1.50 1.05 .71 23.77
Wagner .58 .79 1.68 2.56 3.61 3.84 3.12 2.45 2.87 1.70 1.09 .91 25.20

Data Sets 19
Table 9. Irrigation within the study area.
[Data from the South Dakota Department of Environment and Natural Resources, Water Rights Program (Ron Duvall, written commun., 2003). PLSS, public land survey system]
Field name in Arc/Info
coverageDescription Values
permit Permit identifier, alphanumeric Various
totaldp Total number of diversion points for the permit 1, 2, or 3
dpnum Number of the specified diversion point for the permit 1, 2, or 3
qq Sub-section identifiers A, B, C, D, or L (lot)
section Section number of the PLSS description 1-6, 8, 10-17, 19-22, 25-30, 32-36
township Township number of the PLSS description, all are N (north) 93, 94, 95, 96, 97, or 98
range Range number of the PLSS description, all are W (west) 62, 63, 64, 65, or 66
latitude Latitude in decimal degrees 42.85796 - 43.32386
longitude Longitude in decimal degrees 98.11019 - 98.67093
aquifer Aquifer code CH (Choteau)PS (Pleistocene Series)D (Delmont)GE (Geddes)
unit Management unit (for ground-water withdrawals only)
W (Wagner)M (Missouri River)
diversion Diversion name GROUNDWATERMISSOURI RIVERCHOTEAU CREEKBULL CREEK DRAINAGEWELL & DUGOUTSLOUGH
status2003 Permitted or licensed status as of March 2003 LC (licensed)PE (permitted)
permit_acres Permitted acres(permits are issued prior to licenses)
0.0 - 600.0
license_acres Licensed acres(licensed values take precedence over permit values)
0.0 - 660.0
permit_cfs Permitted withdrawals in cubic feet per second 0.00 - 8.57
license_cfs Licensed withdrawals in cubic feet per second 0.00 - 9.43
HUC Hydrologic unit code 10140101 (Fort Randall Reservoir)10170101 ( Lewis and Clark Lake)

20 Data to Support Development of a Pesticide Management Plan by the Yankton Sioux Tribe
Selected References
Amundson, F.D., 2002, Estimated use of water in South Dakota: U.S. Geological Survey Open-File Report 02-440, 17 p.
Battaglin, W.A., and Goolsby, D.A., 1994, Spatial data in geo-graphic information systems format on agricultural chemical use, land use, and cropping practices in the United States: U.S. Geological Survey Water-Resources Investigations Report 94-4176, 87 p. (available online at URL http://water.usgs.gov/pubs/wri/wri944176/).
Bryce, S.A., Omernik, J.M., Pater, D.E., Ulmer, Michael, Schaar, Jerome, Freeouf, Jerry, Johnson, Rex, Kuck, Pat, and Azevedo, S.H., 1998, Ecoregions of North Dakota and South Dakota: Dynamac Corporation, 1 sheet.
Environmental Systems Research Institute, Inc., 2000, ArcDoc version 8.0.2, patch 1: Redlands, Calif., ESRI.
Focazio, M.J., Reilly, T.E., Rupert, M.G., and Helsel, D.R, 2002, Assessing ground-water vulnerability to contamina-tion—Providing scientifically defensible information for decision makers: U.S. Geological Survey Circular 1224, 33 p.
Hedges, L.S., 1975, Geology and water resources of Charles Mix and Douglas Counties, South Dakota—Part 1, Water resources: South Dakota Geological Survey Bulletin 22, 43 p.
Kolpin, D.W., Burkart, M.R., and Thurman, E.M., 1994, Herbicides and nitrate in near-surface aquifers in the midcon-tinental United States, 1991: U.S. Geological Survey Water-Supply Paper 2413, 34 p.
Kume, Jack, 1972, Major aquifers in Charles Mix and Douglas Counties, South Dakota: South Dakota Geological Survey Information Pamphlet No. 2, 6 p.
Kume, Jack, 1977, Geology and water resources of Charles Mix and Douglas Counties, South Dakota—Part 2, Water resources: South Dakota Geological Survey Bulletin 22, 31 p.
National Center for Food and Agricultural Policy Pesticide Use Database, 2001, accessed on July 31, 2001, at URL http://pestdata.ncsu.edu/ncfap/search.cfm
Neitzert, K.M., 1995, Records of wells and chemical analyses of ground water in Charles Mix and Douglas Counties, South Dakota: U.S. Geological Survey Open-File Report 95-153, 129 p.
Sando, S.K., and Neitzert, K.M., 2003, Water and sediment quality of the Lake Andes and Choteau Creek Basins, South Dakota: U.S. Geological Survey Water-Resources Investiga-tions Report 03-4148, 114 p.
South Dakota Agricultural Statistics Service, 2001, South Dakota 2000 agricultural chemical usage: U.S. Department of Agriculture, accessed on August 28, 2003, at URL http://www.nass.usda.gov/sd/releases/agchem01.pdf
South Dakota Agricultural Statistics Service, 2003a, Snapshot of county 023: U.S. Department of Agriculture, accessed on August 28, 2003, at URL http://www.nass.usda.gov/sd/cp/cpco0230.htm
South Dakota Agricultural Statistics Service, 2003b, Snapshot of county 023: U.S. Department of Agriculture, accessed on August 28, 2003, at URL http://www.nass.usda.gov/sd/cp/cpco0232.htm
U.S. Environmental Protection Agency, 1996, Pesticides and ground water state management plan regulation: Federal Register, June 26, 1996, v. 61, no. 124, p. 33259-33301.
U.S. Geological Survey, 1996-2003, Water resources data, South Dakota, water years, 1995-2002: U.S. Geological Survey Water-Data Reports SD-95-1 to SD-02-1 (published annually).

Supplemental Information

22 Data to Support Development of a Pesticide Management Plan by the Yankton Sioux Tribe
Disk 1
A_document (contains metadata in HTML format for coverages on the disk)
A_notice.txt
bedrock bedrock (polygon coverage) info
dem dem_ft (grid format) info dem_ft.aux
estimated_yield est_yield (polygon coverage) info
geology geology (polygon coverage) info
huc hucs (polygon coverage) info
irrigation info irrigation (point coverage)
landuse ecoregions (polygon coverage) info landuse_grid (grid format) landuse_grid.aux
orthophotos info ortho1-1_sd023.aux ortho1-1_sd023.sdw ortho1-1_sd023.sid (MrSID format) ortho1-1_sd023.sid.xml

Disk 1 23
pestuse battaglin cm_agchem (polygon coverage) cm_herb1 (polygon coverage) cm_herb2 (polygon coverage) cm_herb3 (polygon coverage) cm_herb4 (polygon coverage) cm_herb5 (polygon coverage) info
agchem2000.pdf cmco1997.htm cmco1998.htm cmco1999.htm cmco2000.htm
surficial_aquifers info surficial_aq (polygon coverage)
thickness info thicknessdep (arc coverage)
watqual yst_organics.xls yst_organics.txt info QWDATA.xls QWDATA.txt wq_sites (point coverage)