competitiveness of poultry sector in east and south africa
TRANSCRIPT

Competitiveness of poultry sector in East and South Africa
Peter van Horne
Wageningen University and Research
Webinar, 1 September 2021

Project: Support Agri-Economic Analysis for Africa
Funding by EU / European Commission
▪ Lead by BFAP, South Africa (Tracy Davids)
• Bureau for Food & agricultural Policy
▪ Cooperation with Wageningen UR, Netherlands
▪ Wageningen Economic Research (peter van Horne
▪ Tanzania: Sokoine University of Agriculture
▪ Ghana: University of Ghana
▪ Kenya: Egerton University

Support Agri-Economic Analysis for Africa
Focus:
▪ Support model framework
▪ International Cooperation (research)
▪ Literature review
▪ Poultry production / infra structure
▪ Linkage livestock and feed products
▪ Outlook study
▪
Countries:
- South Africa: details economics
- Tanzania: details economics
- Kenya
- Ghana

Sub Sahara region: poultry meat
• Consumption
+5.4% per year
• Production
+4.2% per year
• Growth in
imports
• In recent years
50% of imports
by SAF, Angola
and Ghana.

Poultry imports: in 4 focus countries

EU-27 exports Imports Exporters of poultry meat:
- Low costs countries
• USA and Brazil
- Leg meat
/USA and EU
2018 2019 2020
Ghana 163 184 214
Philippines 160 216 196
Ukraine 177 178 146
Congo 75 78 101
HongKong 112 94 89
South Africa 84 130 89
Saudi Arabia 82 67 76
Benin 91 69 61
EU-27 export of poultry meat (1000 tonnes)

Consumer preference: poultry
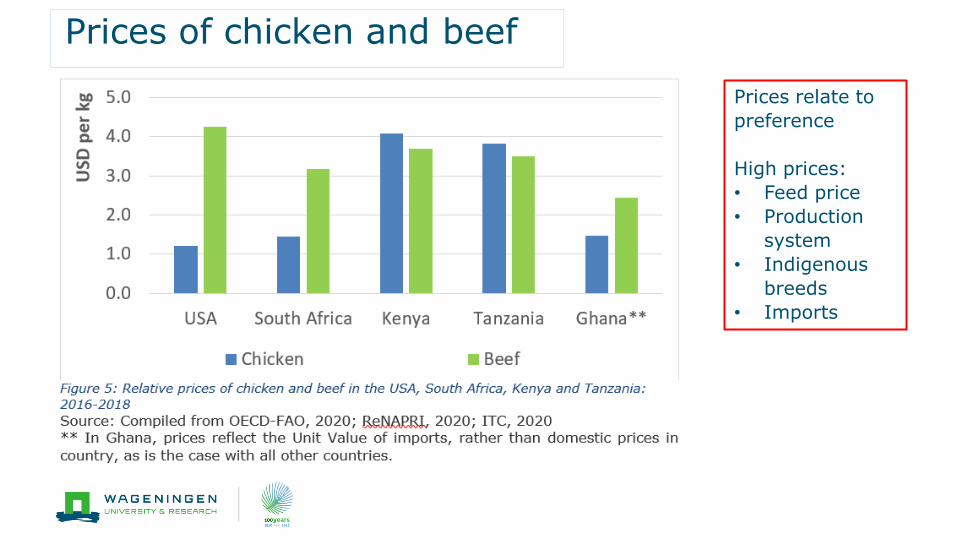
Prices of chicken and beef
Prices relate to
preference
High prices:
• Feed price
• Production
system
• Indigenous
breeds
• Imports
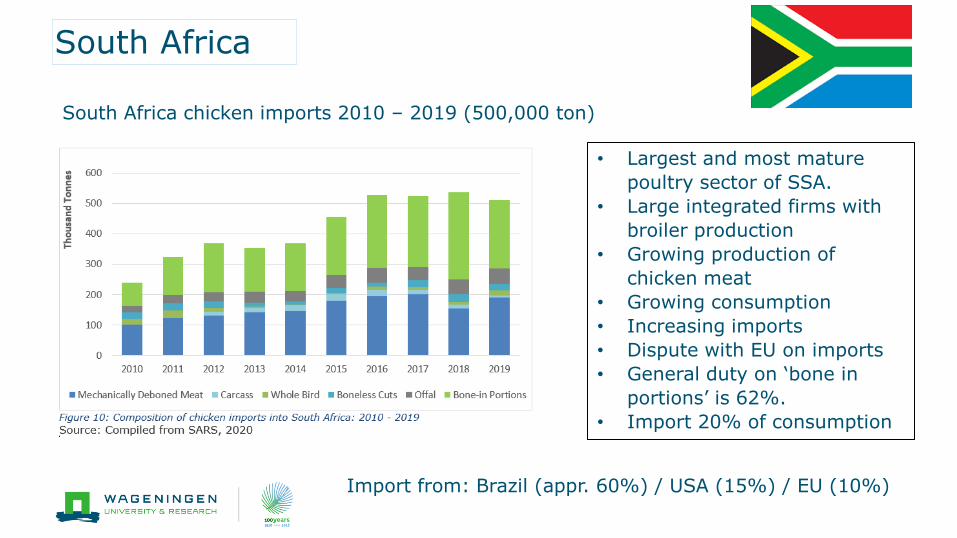
South Africa
• Largest and most mature
poultry sector of SSA.
• Large integrated firms with
broiler production
• Growing production of
chicken meat
• Growing consumption
• Increasing imports
• Dispute with EU on imports
• General duty on ‘bone in
portions’ is 62%.
• Import 20% of consumption
South Africa chicken imports 2010 – 2019 (500,000 ton)
Import from: Brazil (appr. 60%) / USA (15%) / EU (10%)

Kenya
• Poultry is 55% of the
livestock sector
• Poultry is widespread in rural
and peri-urban areas
• Indigenous poultry is main
production system
• Chicken production around
80,000 ton.
• Import low amounts from
Brazil and Uganda.
• General duty is 25%, Duty
free import from EAC (East
Africa community)
Kenya chicken imports 2001 – 2019 (1,500 ton)
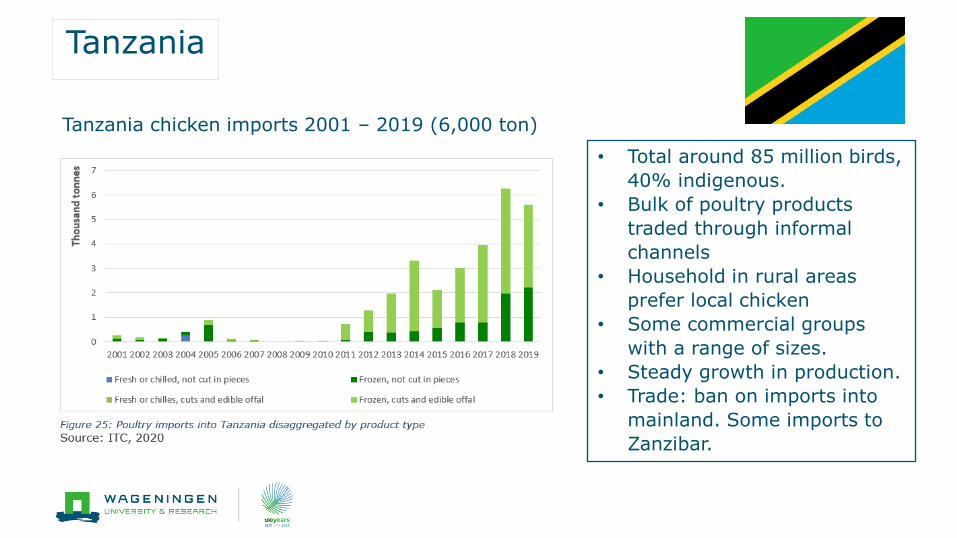
Tanzania
• Total around 85 million birds,
40% indigenous.
• Bulk of poultry products
traded through informal
channels
• Household in rural areas
prefer local chicken
• Some commercial groups
with a range of sizes.
• Steady growth in production.
• Trade: ban on imports into
mainland. Some imports to
Zanzibar.
Tanzania chicken imports 2001 – 2019 (6,000 ton)

Ghana
• In poultry extensive system
dominates production.
• Commercial poultry with two
segments; layers and
broilers.
• In Poultry meat high
competition with imports
• Increasing local production /
increasing imports.
• Imports from USA and EU
• General duty is 35%. Free
trade ECOWAS (econ. Com. of
west Africa states).
• Policy to reduce imports
Ghana chicken imports 2001 – 2019 (250,000 ton)

Competitiveness of Africa poultry sector
• Rising import of poultry products
• Calculation tool of Wageningen UR:
• Production costs at farm level
• Cost of slaughter
• Cost of transport
• Impact of import levies
• Countries in Wageningen model:
• EU countries: NL, Germany, Poland
• Brazil
• USA
• South Africa
• Tanzania (example)

Production cost at farm level (2018) (euro/kg LW)
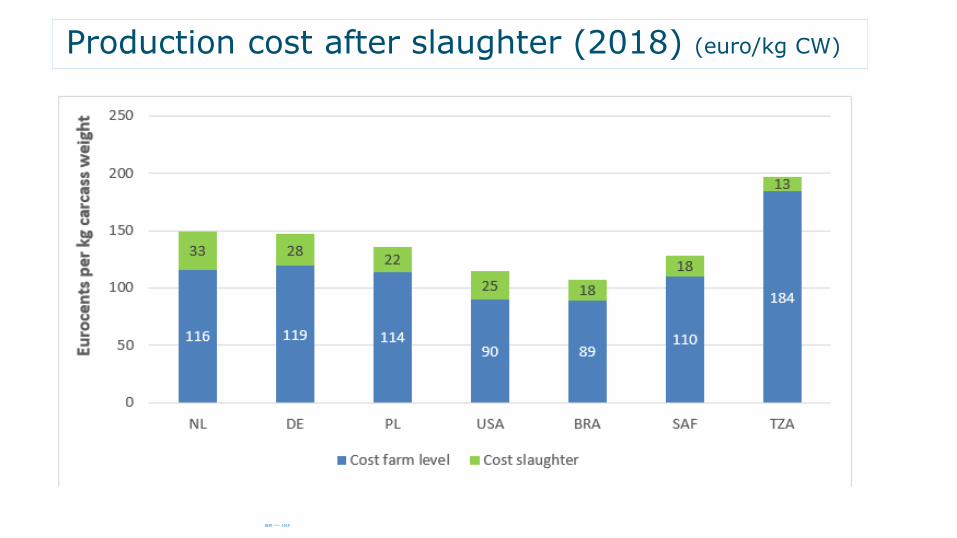
Production cost after slaughter (2018) (euro/kg CW)

Offer price of the WHOLE BIRD to SAF (euro/kg CW)
No import of whole birds. Only Brazil competitive

Offer price of mixed portions in SAF and TZA (euro/kg product)
SAF is IQF
mixed portion
EU/USA and
Brazil offer leg
meat / bone-
in products

SAF: scenario 1, import levy of 35% (euro/kg product)
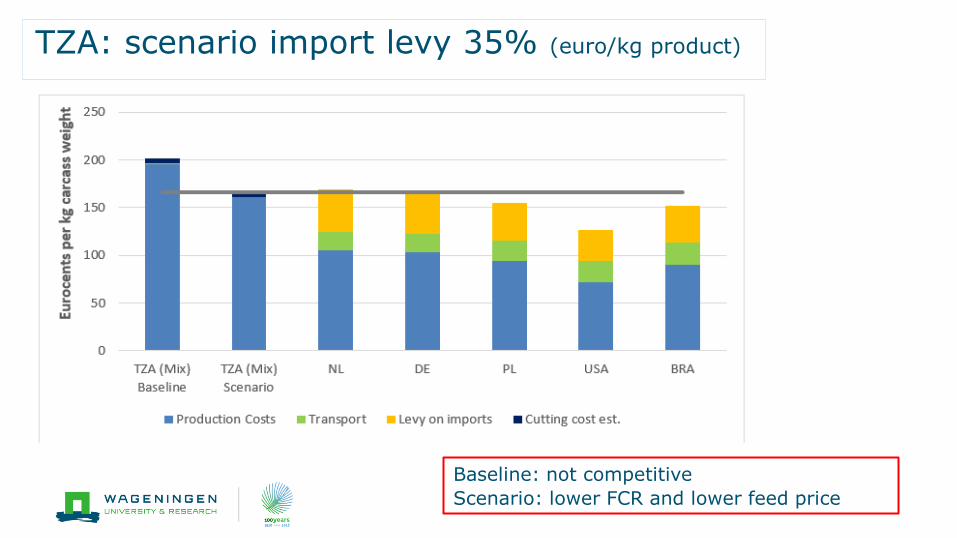
TZA: scenario import levy 35% (euro/kg product)
Baseline: not competitive
Scenario: lower FCR and lower feed price
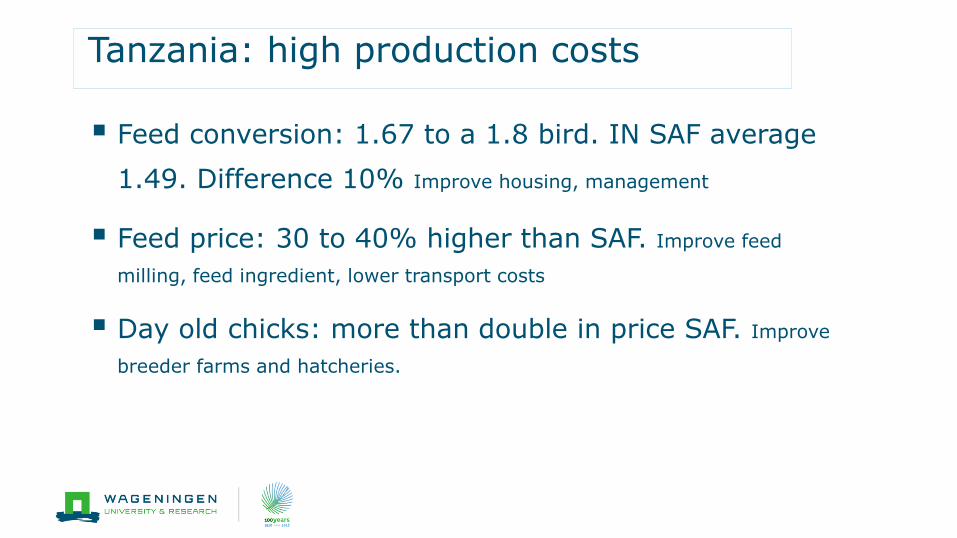
Tanzania: high production costs
▪ Feed conversion: 1.67 to a 1.8 bird. IN SAF average
1.49. Difference 10% Improve housing, management
▪ Feed price: 30 to 40% higher than SAF. Improve feed
milling, feed ingredient, lower transport costs
▪ Day old chicks: more than double in price SAF. Improve
breeder farms and hatcheries.
Conclusions 1
▪ Sub Sahara Africa: rising demand for animal protein / poultry
▪ Africa: Poultry market in the region are not homogeneous and
production systems vary significantly across countries.
▪ Consumer prefer locally produced chicken. Import are cheaper
and available in more convenient forms.
▪ Many countries: domestic production needs to compete with
imports
Conclusions 2
▪ SAF: moderate production costs. Import of bone in products at
very low price, due to premium price at local market in EU/USA.
Import levies are needed to protect local poultry sector.
▪ Tanzania: very high production costs. As a result of high feed
conversion, high feed price and expensive day-old-chick.
Strategic plan to improve efficiency in combination with import
levies on poultry product from EU/USA is needed.
▪ Ghana: ongoing project.....
