enhancing manufacturing competitiveness in south africa. - deloitte
TRANSCRIPT

Enhancing Manufacturing competitiveness in South Africa.

B

Deloitte Manufacturing Competitiveness Report 1
Contents
A message to the industry .....................................................................pg1
Introduction ........................................................................................... pg2
SA results and discussion insight .......................................................... pg9
The competitive advantage of nations ................................................pg13
Local market attractiveness .................................................................pg19
The role of government ...................................................................... pg23
Cost and availability of labour ............................................................ pg27
Physical infrastructure and energy ......................................................pg31
The role of the trusted business advisor ............................................ pg36
Contributors ......................................................................................... pg37
References ............................................................................................ pg38

Deloitte Manufacturing Competitiveness Report
The Manufacturing Circle was called into existence five years ago by a group of manufacturers concerned at the worrying tide of de-industrialisation that has been washing over South Africa in ever-greater waves over the last two decades.
Our purpose was to embark on some high-octane government and other key stakeholder engagement around key challenges in the domestic and foreign policy environments that have compounded the mounting obstacles local manufacturers have had to face in remaining competitive with their counterparts in other countries.
This has not proven to be an easy task to clearly demonstrate, as there are numerous variables and barriers which contribute to cost and competitiveness. In this quest, having resources such as Deloitte partner with us to draw down key aspects in their Global Manufacturing Competitiveness Report, provides the Manufacturing industry and policy decision makers with credible comparative qualitative and quantitative information. This in turn will lead to possible solutions and better competitiveness through new or improved Manufacturing processes and cost structures and changes in government policies to support the Manufacturing sector.
A particular word of thanks to the Deloitte team, as well as to my predecessor Stewart Jennings, who not only started this partnership with Deloitte as one of his last initiatives as Chairperson of the Manufacturing Circle, but who since the inception of the Manufacturing Circle has driven our engagement with government to seek understanding, solutions and policy shifts aimed at growing both the Manufacturing base and employment in South Africa.
Mike Arnold – Chairman of the Manufacturing Circle
A message to the industry
1

Introduction
In these globally competitive times, I find myself asking, what will South Africa and indeed Africa be famous for 15 years from now? I believe the answer is Manufacturing. Manufacturing is among the top three multiplier sectors in terms of value addition, job creation, export earnings and revenue generation for every R1 invested. The reality is that it is difficult to be globally competitive when your population size is 3.86% of China, and 4.3% of India, but as Africa we have the critical mass to compete. Sure, there are challenges to achieve this, but I believe if we have a strong political will, these challenges will be overcome.
Following the global financial crisis and the effect it had on many of our large established trading partners, as well as the relatively stronger rand, total exports took a serious hit over the last period. Coupled with competition from the more aggressively growing emerging
markets and the threats they present, this is making it more and more difficult for local players to compete. Over 300 000 South African Manufacturing jobs have been lost or exported to other countries since the beginning of 2008, with the majority going to China. The South African business environment has worsened while administered prices in Brazil, Russia, India and China have decreased by over 36% in the last decade. By contrast, electricity costs have been raised by over 170% in South Africa, and this is predicted to continue to escalate at more than double the forecasted inflation rate. All this while our domestic market is vulnerable to imports from China, India, Brazil and other countries who offer much higher incentives and protection to their manufacturers.
The result is that, as a nation, we are losing ground in the battle to provide a business-friendly environment to local and global manufacturers. In 2010 South Africa was ranked 22nd (out of 38 countries) in terms of the Global Manufacturing Competitiveness Index put together by Deloitte and the World Economic Forum. South Africa was expected to move up to the 19th spot in the five years following. Three years later, in 2013, we have dropped to 24th and the expectation is a further drop to 25th over the next five years. In an effort to understand the underlying factors contributing to our decreasing competitiveness as a nation, we at Deloitte, through the partnership with the Manufacturing Circle, conducted a survey of our local manufacturers. Together with the Manufacturing Circle and its member companies we have unpacked market challenges and issues like labour, input costs, the threat of cheaper imports, rising electricity costs and the impact of government on industry. The purpose of this report is to unravel the key issues and their real implications on the South African Manufacturing industry. It looks at how we, both industry and government, can together forge a roadmap that will not only alleviate current issues, but will also look to capitalise on the competitive advantages we have as a continent. Through continental collaboration and fostering effective private–public partnerships, there is incredible opportunity to position Africa and South Africa as global Manufacturing hubs.
I would like to thank Stewart Jennings and the Manufacturing Circle for partnering with us to conduct this survey, and I look forward to a successful journey together where we focus on improving Manufacturing in South Africa and beyond. A special thank you to Mike Vincent, our Deloitte Advisory Manufacturing Leader, and the rest of the Deloitte Manufacturing team for ensuring that this project is a success.
Karthi Pillay – Deloitte, South Africa Manufacturing Industry Leader
Deloitte Manufacturing Competitiveness Report 2

Summary of global results
ApproachThe Global Manufacturing Competitiveness Index report is a multi-year initiative by the Deloitte Touche Tohmatsu Limited (DTTL)’s Global Manufacturing industry group and the US Council on Competitiveness, a leadership organisation comprising Chief Executive Officers (CEOs), university presidents and labour leaders committed to strengthening America’s competitive advantage by acting as a catalyst for innovative public policy solutions. It is based on a global survey of more than 550 CEOs and senior Manufacturing executives worldwide and ranks 38 nations on global competitiveness in the Manufacturing industry.
Figure 1: Respondents by region Figure 2: Respondents by revenue size
Figure 3: Respondents by title Figure 4: Respondents by industry
5.4% 5.4%
39.7%
28.5%
21.0%
6.2%
17.1%
26.6%
50.1%
22.3%
15.4%
15.2%13.1%
12.2%
7.7%
7.1%
3.0% 2.3% 1.7%
4%
46%
40%
10%
North AmericaAsiaEuropeSouth AmericaAustralia
CEO, Chairman, President and CFO/COOManaging Director, Sr. VP. and General ManagerDirector and Legal CounselOthers (responded on behalf of the CEO)
ProcessIndustrial productsConsumer goodsAuto and auto componentsHi-tech
TextileOthersAgricultural productsAerospace and defencePharmaceuticals
Less than $100 million$100 million to $1 billion$1 billion to $10 billionMore than $10 billion
3
Source: Deloitte Touche Tohmatsu Limited and US Council on Competitiveness, 2013 Global Manufacturing Competitiveness Index

ResultsTable 1: Global CEO Survey: 2013 Country Manufacturing Competitiveness Index rankings
Source: Deloitte Touche Tohmatsu Limited and US Council on Competitiveness, 2013 Global Manufacturing Competitiveness Index
Rank Country Index score
10 = High 1= Low
1 China 10.00
2 Germany 7.98
3 The United States ofAmerica
7.84
4 India 7.65
5 South Korea 7.59
6 Taiwan 7.57
7 Canada 7.24
8 Brazil 7.13
9 Singapore 6.64
10 Japan 6.60
11 Thailand 6.21
12 Mexico 6.17
13 Malaysia 5.94
14 Poland 5.87
15 The United Kingdom 5.81
16 Australia 5.75
17 Indonesia 5.75
18 Vietnam 5.73
19 The Czech Republic 5.71
20 Turkey 5.61
21 Sweden 5.50
22 Switzerland 5.28
23 The Netherlands 5.27
24 South Africa 4.92
25 France 4.64
26 Argentina 4.52
27 Belgium 4.50
28 Russia 4.35
29 Romania 4.09
30 The United Arab Emirates
3.93
31 Colombia 3.85
32 Italy 3.75
33 Spain 3.66
34 Saudi Arabia 3.57
35 Portugal 3.39
36 Egypt 3.24
37 Ireland 3.23
38 Greece 1.00
Rank Country Index score
10 = High 1= Low
1 China 10.00
2 India 8.49
3 Brazil 7.89
4 Germany 7.82
5 The United of America 7.69
6 South Korea 7.63
7 Taiwan 7.18
8 Canada 6.99
9 Singapore 6.64
10 Vietnam 6.50
11 Indonesia 6.49
12 Japan 6.46
13 Mexico 6.38
14 Malaysia 6.31
15 Thailand 6.24
16 Turkey 5.99
17 Australia 5.73
18 Poland 5.69
19 The United Kingdom 5.59
20 Switzerland 5.42
21 Sweden 5.39
22 The Czech Republic 5.23
23 Russia 5.04
24 The Netherlands 4.83
25 South Africa 4.77
26 Argentina 4.58
27 France 4.02
28 Colombia 4.01
29 Romania 3.98
30 Belgium 3.63
31 Spain 3.58
32 The United Arab Emirates
3.58
33 Saudi Arabia 3.46
34 Italy 3.45
35 Egypt 3.45
36 Ireland 3.03
37 Portugal 2.87
38 Greece 1.00
Deloitte Manufacturing Competitiveness Report 4
Source: Deloitte Touche Tohmatsu Limited and US Council on Competitiveness, 2010 Global Manufacturing Competitiveness Index
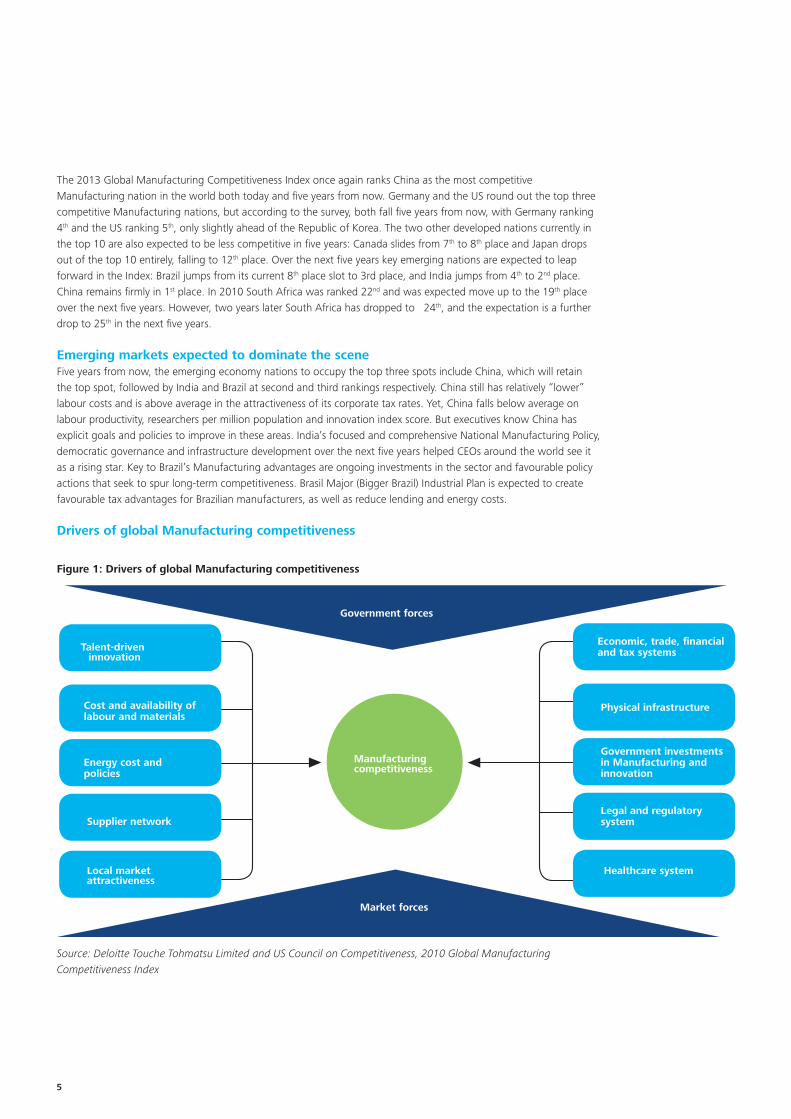
Figure 1: Drivers of global Manufacturing competitiveness
The 2013 Global Manufacturing Competitiveness Index once again ranks China as the most competitive Manufacturing nation in the world both today and five years from now. Germany and the US round out the top three competitive Manufacturing nations, but according to the survey, both fall five years from now, with Germany ranking 4th and the US ranking 5th, only slightly ahead of the Republic of Korea. The two other developed nations currently in the top 10 are also expected to be less competitive in five years: Canada slides from 7th to 8th place and Japan drops out of the top 10 entirely, falling to 12th place. Over the next five years key emerging nations are expected to leap forward in the Index: Brazil jumps from its current 8th place slot to 3rd place, and India jumps from 4th to 2nd place. China remains firmly in 1st place. In 2010 South Africa was ranked 22nd and was expected move up to the 19th place over the next five years. However, two years later South Africa has dropped to 24th, and the expectation is a further drop to 25th in the next five years.
Emerging markets expected to dominate the sceneFive years from now, the emerging economy nations to occupy the top three spots include China, which will retain the top spot, followed by India and Brazil at second and third rankings respectively. China still has relatively “lower” labour costs and is above average in the attractiveness of its corporate tax rates. Yet, China falls below average on labour productivity, researchers per million population and innovation index score. But executives know China has explicit goals and policies to improve in these areas. India’s focused and comprehensive National Manufacturing Policy, democratic governance and infrastructure development over the next five years helped CEOs around the world see it as a rising star. Key to Brazil’s Manufacturing advantages are ongoing investments in the sector and favourable policy actions that seek to spur long-term competitiveness. Brasil Major (Bigger Brazil) Industrial Plan is expected to create favourable tax advantages for Brazilian manufacturers, as well as reduce lending and energy costs.
Drivers of global Manufacturing competitiveness
Manufacturing competitiveness
Government forces
Market forces
Economic, trade, financial and tax systemsTalent-driven
innovation
Government investments in Manufacturing and innovation
Energy cost and policies
Physical infrastructureCost and availability of labour and materials
Legal and regulatory systemSupplier network
Healthcare systemLocal market attractiveness
5

Rank Competitive driver
1 Talent-driven innovation
2 Economic, trade, financial and tax system
3 Cost and availability of labour and materials
4 Supplier network
5 Legal and regulatory system
6 Physical infrastructure
7 Energy cost and policies
8 Local market attractiveness
9 Healthcare system
10 Government investments in Manufacturing
Table 2: Ranking as to the importance of each factor to competitiveness
Germany and the US are the most competitive in talent-driven innovationTalent-driven innovation was viewed by global CEOs as the most important drive to global Manufacturing competitiveness. Executives surveyed thought that Germany’s historical strength in key sectors, and its focus on “mechatronics,” its “dual system” of vocational training and close links between industry and universities were key factors that resulted in its top ranking of talent-driven innovation capabilities. Improving education systems and raising the human capital bar even higher are still challenges for developed nations and emerging nations alike.
Developed Manufacturing nations have the edge in local economic, trade, financial and tax systems The second-most-important competitive driver is the economic, trade, financial and tax system of a nation, moving up from fourth place in 2010. Trade, financial and tax policies have now supplanted labour and materials costs, supplier networks, infrastructure and energy costs, as a more important driver of a nation’s competitiveness demonstrating executives’ recognition of government leaders’ increasing efforts to use public policy as an enabler of economic development. Executives attributed a number of factors to country competitiveness such as economic, trade, financial and tax systems – specifically, tax rate burdens and system complexity, along with the clarity and stability of policies, as huge hurdles for less competitive countries to overcome in order to create an attractive Manufacturing destination. Closely following these sub-components were the relative health of economic and financial systems overall and the comprehensiveness and competitiveness of trade policies. While India and Brazil fell short in their economic, trade, financial and tax systems as providing competitive advantage, China appears to be moving up the maturity path in this area with its ranking on this competitive driver on par with Japan.
China and India lead in terms of cost and availability of labour. Cost and availability of labour and materials continue to transform the global landscape significantly with respect to creating Manufacturing competitive advantage. Historically, as reflected in the prior section regarding exports, numerous companies moved their production to emerging economies where labour and materials were less expensive. As a result, the economic prosperity of the citizens in these once-low-cost destinations has improved, giving rise to a growing middle class and demands for higher wages. As these countries continue to evolve and move up the product complexity ladder – and in turn, grow their economies and become involved in the production of more complex products – they are becoming less competitive on their labour advantage. They look more like developed countries and are beginning to shift production to lower-cost countries for more commoditised products. China is one example of this dynamic, by now shifting its production to countries like Thailand and Vietnam. The 2013 Global Manufacturing Competitiveness survey felt that China and India continue to provide the most significant labour and material cost advantage of the six focus countries highlighted. Not surprisingly, Brazil rounds out this group of three countries that executives felt provide a substantial advantage over the US, Germany and Japan. In ranking the compo-nents, executives viewed cost competitiveness of raw materials as the most important driver, followed closely by competitive wage rates, availability of raw materials and lastly, cost competitiveness of labour outside of wages (e.g. benefits).
Source: Deloitte Touche Tohmatsu Limited and US Council on Competitiveness, 2013 Global Manufacturing Competitiveness Index
Deloitte Manufacturing Competitiveness Report 6

The newest of the emerging superpowers have a long way to go when it comes to supplier networks. Executives surveyed ranked supplier network as the fourth-most-important driver of Manufacturing competitiveness. CEOs considered supplier networks increasingly more important than in 2010, when supplier network ranked eighth. This improvement may be attributed to a number of factors, including the increasing globalisation of Manufacturing organisations and supply chains and intensifying efforts to localise production near emerging consumer markets. The sheer scale of today’s global supply networks is staggering. In addition, CEOs and senior executives have elevated the standing of supply chains as they are taking strategic actions to mitigate supply chain risks in response to natural disasters and to gain more control and transparency of sources. In evaluating a country’s competitive advantage in this area, executives cited financial stability and resources within a supplier network as the most important factor contributing to competitiveness, followed closely by its ability to innovate, cost competitiveness, and suppliers’ availability and responsiveness. The old adage “getting the right products to the right markets at the right time in the right amounts at the right cost” translates into efficient and effective supply chain management.
Emerging Manufacturing nations will likely struggle to be competitive as regards to their legal and regulatory systems. In Europe, business leaders see only the continent’s intellectual property protection policies contributing to a competitive advantage for them from the 19 policy selection choices. At the other end, only three policies were cited by European business leaders as contributing to a clear disadvantage. They include labour policies, immigration policies and policies resulting in government intervention and ownership in companies. According to the US executives, from the 19 policy selection choices offered, only intellectual property protection policies and policies supporting technology adoption, integration and transfer help to contribute a competitive advantage for their businesses. On the negative side of the ledger, environmental policies, energy policies, corporate tax policies and healthcare policies were seen as contributing to a competitive disadvantage for manufacturers in the US. In China, policies either encouraging or directly funding investments in science and technology, employee education, infrastructure development along with safety and health regulations and sustainability policies are helping to provide a competitive advantage according to Chinese executives surveyed. Policies that Chinese business leaders see inhibiting their competitiveness in China include anti-trust laws and regulations, government financial intervention and ownership in companies, foreign direct investment policies, immigration policies and corporate tax policies.
Newer Manufacturing players face an uphill battle when it comes to physical infrastructure competitiveness. Fewer than a quarter of business executives “strongly agree” or “agree” that India’s infrastructure makes it extremely competitive, but almost nine in ten say that the US, Germany and Japan have a strong infrastructure advantage.
China and the US are viewed as being most competitive from an energy cost side. Clean, reliable energy directly influences production costs and is an increasingly important factor in determining global Manufacturing competitiveness. The world’s energy supplies are expected to be transformed with the International Energy Agency projecting the US to be the world’s largest oil producer by 2020, ahead of Saudi Arabia driven by the shale-oil boom – a potential game changer likely to help US manufacturers be more competitive.
China and the US edge out others in terms of local market attractiveness. Size and access to local markets is the most important driver in terms of local market attractiveness, according to the survey results. It is perhaps no surprise that China – with its large population and explosive economic growth – is considered among the most competitive of the six focus nations highlighted in this report, along with the US and Germany. In contrast, it is interesting that a similar percentage of executives rate Japan, India and Brazil as competi-tive in terms of local market attractiveness. Surprisingly, China, India and Brazil experienced substantial 10-year current annual growth (CAGR) growth on per capita personal disposable income between 2001 and 2011. Yet, executives surveyed ranked Brazil and India far behind China. At the same time, relative market attractiveness parity among China, the US and Germany demonstrates that country size is not the only factor. Rather, such parity between emerging and developed economies on competitive advantage is driven by a vibrant domestic consumer base with significant spending power.
7
Superior healthcare systems will likely give developed nations an advantage over emerging players, thanks to their access to quality care and regulatory policies for public health. Seven in ten business leaders indicated that they believe that the healthcare systems in the US, Germany and Japan make them extremely competitive, but no more than three in ten said that about China, India and Brazil.
China and Germany are seen to lead in government investments in Manufacturing and innovation. Countries that lead in developing public – private collaborations not only bring together the skills required to spur innovation, but also create an ecosystem that thrives on innovation through collaboration.
Source: Deloitte Touche Tohmatsu Limited and US Council on Competitiveness, 2013 Global Manufacturing Competitiveness Index
Deloitte Manufacturing Competitiveness Report 8

SA results and discussion insight
ApproachThe most recent Global Manufacturing Index results saw South Africa drop two places and the report projected that we would continue to drop over the next five years. These results (together with an overall decline in South African global competitiveness, as per the World Economic Forum’s 2012–2013 Competitiveness Index) have spurred us at Deloitte South Africa to partner with the Manufacturing Circle to conduct our own local Manufacturing competiveness survey in line with the global survey. The objectives were to understand what is working and what is not working in the South African context. Moreover, it is more and more important that we begin to forge a roadmap that will enable our industry to compete on a global scale. We will spend time unpacking local results with the ultimate objective of knowing how we can position and improve the South African Manufacturing industry.
Using the Top 10 drivers indicated by the Global Manufacturing competitiveness report, we asked the Manufacturing Circle member companies to rate how important they think each of these is to their ability to compete on a global scale. This (together with secondary data from other competiveness indices, interviews with the Manufacturing Circle and a facilitated discussion with member companies’ CEOs and leaders) formulated the basis for the findings.
24%
27%29%
10%
7%3%
< R300 mR301 – R999 mR1 bn – R3 bnR3 bn – R5 bnR6 bn -–R10 bn> R10 bn
Figure 1: Respondents by turnover
Figure 2: Respondents by number of employees
Figure 3: Respondents by sector
Figure 4: Respondents by operations geography
0 - 100101 - 500501 - 10001001 - 20002001 - 5000>5001
4%
39%
15%
21%
13%
8%
Global/MultinationalPan-AfricanSouth Africa
34%
15%
51%
Aerospace and DefenceAutomotiveChemicalsConstructionForestry, Paper and PackagingIndustrial Products andServices
33%
1%
27%
7%
15%
10%4% 3%
9

ResultsThe members of the Manufacturing Circle reviewed the global ranking of the Manufacturing competitiveness drivers and then ranked the drivers from a South African perspective. The results are shown in the table below.
While the rankings are completely different to those of their global peers, local market attractiveness and energy costs and policies were the most significant movers up the standings, and talent-driven innovation and legal and regulatory system were the biggest movers down the rankings.
Deloitte facilitated a workshop in its state-of-the-art innovationZone™ with members of the Manufacturing Circle, and various Deloitte industry subject matter experts participated in the workshop. The purpose of the workshop was to gain a deeper insight into the reasons for the rankings and to better understand some of the competitiveness issues faced by manufacturers in South Africa. A summary of the key discussion points is set out below.
Cost and availability of labour and materialsThis was ranked as the single biggest driver of competitiveness in South Africa. It is common cause that labour costs in South Africa have increased at a faster rate than is the case with global peers, and there has not been a commensurate increase in labour productivity. This is borne out by numerous studies and is dealt with in greater detail in other sections of this report. Given that the South African Manufacturing sector was built on the basis of relatively cheap labour, there is little wonder why this factor has been ranked so highly by respondents.Education, skills development, spatial development and community safety are social factors that have impinged on South Africa’s ability to be competitive.
Local market attractivenessRespondents felt that the South African Manufacturing sector is currently in survival mode as a result of many factors, including the small size of the domestic market, the threat of cheap imports, policy uncertainty, high input costs and a limited skills base. It is important to the future of the sector that the local market be dynamic, growing and competitive. Compared to large developed markets it is very small, and respondents felt that this undermines our ability to compete against global peers, especially in adjacent African markets.
Energy cost and policiesIt is unsurprising that this competitiveness driver is so highly ranked, given the recent cost increases envisaged by the power build programme initiated by Eskom. While the importance of this factor is dependent on the power demands of the individual respondents, its impact will be felt across the sector. This matter is dealt with in other sections of this report.
Economic, trade, financial and tax systemGovernment has an important role to play in creating an enabling environment in which Manufacturing can thrive. Respondents felt that there was a significant need for improved incentives or import protection in the short term. This matter is dealt with in other sections of this report.
SA rank
Competitiveness driver Score Global rank
1 Cost and availability of labour and materials 3.16 3
2 Local market attractiveness 4.43 8
3 Energy cost and policies 4.80 7
4 Economic, trade, financial and tax system 4.88 2
5 Physical infrastructure 4.99 6
6 Supplier network 5.38 4
7 Talent-driven innovation 5.63 1
8 Government investments in Manufacturing 6.18 10
9 Legal and regulatory system 6.43 5
10 Healthcare system 8.80 9
Deloitte Manufacturing Competitiveness Report 10
Table 3: South African ranking as to the importance of each factor of competitiveness

Physical infrastructureRespondents felt that while infrastructure expenditure proposals were laudable, it was important that the process be expedited. The need to improve rail, road and port infrastructure is paramount but has to be supported by improvements at the Department of Home Affairs and in education. An integrated approach should be adopted to improve South African competitiveness.
Talent-driven innovationTalent-driven innovation was not as highly rated when compared to global peers. Respondents felt that there were more fundamental issues to deal with, such as primary and secondary education. It was noted that the extensive brain drain has severely diluted our intellectual skills in the country. However, if South African Manufacturing companies wish to be competitive, they would need to be innovative and, in doing so, they would have to attract the right talent.
Government investments in ManufacturingAn adversarial relationship between government, labour and business severely hampers a coordinated approach for the good of the sector. The state’s primary responsibility is to create an enabling environment to promote the competi-tiveness of the sector. To this end, consistent trade and industrial policy implementation is a prerequisite for improved competitiveness. This should be applied irrespective of changes in political leadership.Respondents pointed to a need for government to focus on long-term issues such as education and not short-term “quick fixes”. In addition, there is a need for greater collaboration between government departments on policy matters to achieve the intended.
11

Deloitte Manufacturing Competitiveness Report 12
So what can be done?Delegates at the workshop were asked to discuss ideas for improving the competitiveness of the South African Manufacturing industry and to rank the themes by importance. The ranked themes, together with some high-level inputs, are set out below.
Proactive engagement between government, labour and businessFor the Manufacturing sector to become more competitive it is critical that a trust-based working relationship be established between government, labour and industry. Respondents felt that alignment is required around a long-term vision and that key building blocks and actions should be agreed between the parties. The idea of an economic indaba was discussed as one way in which to create positive momentum.
Regulatory adjustmentsRespondents felt that there was a need for government to review duties for in-bound products in order to make these more comparable to other emerging countries. In addition, more stringent control on administered prices to keep them competitive is required, and greater flexibility is required in labour laws. The implementation of the National Development Plan should also receive priority.
EducationEducation is a cornerstone of any progressive state, and significant investment is required to achieve a better standard of education in South Africa. Respondents recognised that this was a longer-term solution but that they needed to make it a priority. In the short term, a focus on artisan training, together with an overhaul of SETAs, could be implemented.
IncentivesThe rapid implementation of current Manufacturing initiatives, subsidies and import protection were all identified as important strategies.
Industry collaborationRespondents endorsed the buyback South Africa campaign, emphasising the need for business and labour to agree on jobs as a priority and local beneficiation. They also agreed on the need to create a sub-Saharan body to coordinate and fund cross-border infrastructural projects.
LabourLabour is an important stakeholder in the future of the Manufacturing sector, and there is a need to engage on wages and job creation. It is also important to depoliticise labour.
Finally, the idea of an industry colloquium was mooted where all the key industry stakeholders would engage on the best way forward to improve the Manufacturing sector’s competitiveness.

P
The competitiveadvantage of nations

Deloitte Manufacturing Competitiveness Report 13
The competitive advantage of nations
Every day, somewhere in the world, investors are making strategic choices on where to invest their capital. From the perspective of country competitiveness, how attractive is South Africa and how likely is it to be a beneficiary of this investment decision? It is the case that countries compete in order to strengthen their economies and to create, and develop, a better living environment for their citizens. With the advent of globalisation in the latter part of the 20th century a country’s competitiveness to attract investment, together with its ability to produce goods and services at globally competitive levels, has become critical.
Defining competitiveness is a complex business because the notion of how one country’s competitiveness stacks up against its peers is based on a number of factors. In a world where investment decisions are dependent on a country’s ability to deliver superior returns, many factors need to align to give comfort to investors.
It is useful to note that the World Economic Forum (WEF) defines competitiveness as “the set of institutions, policies and factors that determine the level of productivity of a country”. The fundamental premise is that the level of productivity sets the level of prosperity that can be earned by an economy which in turn determines the rates of return that can be achieved by investors. This drives growth.
The WEF uses 12 measures to determine competitiveness – institutions, infrastructure, macroeconomic environment, health and primary education, higher education and training, goods and market efficiency, labour market efficiency, financial market development, technological readiness, market size, business sophistication and innovation.
A nation’s standard of living depends on the capacity of its companies to achieve high levels of productivity and this requires collaboration between government and the private sector.

14
South Africa is an important market on the African continent as a member of BRICS and a southern hemisphere competitor. So how does it stack up against some of these peers?
The current global league table is set out below:
Country Rank/142 Score 2011/12 Rank
Switzerland 1 5.72 1
Singapore 2 5.67 2
Finland 3 5.55 4
Sweden 4 5.53 3
The Netherlands 5 5.50 7
Germany 6 5.48 6
The United States 7 5.47 5
The United Kingdom 8 5.45 10
Hong Kong SAR 9 5.41 11
Japan 10 5.40 9
Global competitiveness league table – selected countries – BRICS, Africa and southern hemisphere
Country Rank/142 Score 2012/13 Rank
Australia 20 5.12 20
New Zealand 23 5.09 25
China 29 4.83 26
Brazil 48 4.40 53
South Africa 52 4.37 50
Mauritius 54 5.35 54
India 59 4.32 56
Peru 61 4.28 67
Rwanda 63 4.24 70
Russia 67 4.20 66
Source: The Global Competitiveness Report 2012-2013, World Economic Forum
Source: The Global Competitiveness Report 2012-2013, World Economic Forum
Table 4: The current global league table
Table 5: Gloabl competitiveness league table

Deloitte Manufacturing Competitiveness Report 15
While it is disappointing to note that African countries occupy 12 of the 20 bottom of the league table positions, from a South African perspective what is pleasing to note is that the country has improved its position on the league table to 50 from 54 during the 2011–2012 period. South Africa has experienced 18 years of economic growth‚ only briefly interrupted in 2009. It produces 30% of Sub-Saharan Africa’s gross domestic product, but only constitutes 6.5% of its population. According to the WEF, the regulation of South Africa’s stock exchange and accounting standards are the best in the world. Recent market challenges have, however, caused South Africa to drop two places to 52 on the global rankings in 2012–2013.
There are major challenges that undermine South Africa’s competitiveness. South Africa is in the bottom 20% with regard to the quality of its education system, the business cost of crime and violence, HIV prevalence and labour market efficiency.
A country’s competitiveness needs to be led, directed and facilitated by national government in partnership with the private sector. Greater collaboration between government and the private sector is required, but so too is collaboration within the private sector.
The idea of collaboration lies in 1+1=3. To assess why CEOs place prominence on industry collaboration, a simple question needs to be asked – why are business leaders choosing to collaborate? One consideration lies in the increasing convergence taking place across industries. This context drives the need for knowledge sharing and pooling of resources in order to survive and to push for growth through innovation.
Through increased business-to-business collaboration, the ability to target new markets and to serve consumers and lower costs becomes possible. For example, the increased collaboration between industries such as telecommunications and banking has generated mobile payment services for previously underserved pockets of the market. While in Manufacturing, collaboration between different players, customers and suppliers could contribute to lowering research and development costs.
At a macro-level, governments are increasingly indicating the need to collaborate with the private sector to overcome skills and capacity constraints. Such collaboration is imperative to enable the public sector to gain access to expertise and funding to deliver infrastructure and create jobs. More importantly, collaboration between the private and public sector is a cornerstone of ensuring national competitiveness, a central preoccupation of government and industry in just about every nation. The prime determinant of a nation’s competitiveness is productivity, which has a direct bearing on national per capita income. A nation’s standard of living depends on the capacity of its companies to achieve high levels of productivity, and this requires collaboration between government and the private sector.
Through increased business-to-business collaboration, the ability to target new markets, serve consumers and lower costs becomes possible.

16
It is clear from the chart above that South Africa lags behind its peers by some margin in per capita GDP. South Africa’s pay-to-productivity ratios compound the problem and severely limit its competitiveness.
Source: World Bank. 2010. World Development Indicators Database
Source: World Economic Forum. 2010–2011, 2011–2012 and 2012–2013 Global Competitiveness Index
Figure 2: GDP per capita growth (2010 annual %)
Figure 3: GDP per capita growth (2010 annual %)
Deloitte Manufacturing Competitiveness Report 17
While countries such as China, India and Brazil have improved or maintained relatively lower pay-to-productivity rankings year on year, South Africa appears to be trailing and even losing ground. South Africa currently ranks 134 out of 142 countries (from being 112 out of 142 countries in 2010–2011), a ranking far less competitive than that of the BRIC nations and other top African Manufacturing countries.
Collaboration between government and industry should begin at an industry segment level to understand how and why competitive advantage against foreign rivals has and can be achieved. For example, Germany has focused its motor Manufacturing on high-performance cars, while Korean exports are all compacts and subcompacts.
As countries have to increasingly compete in a global economy, local companies now compete with global companies where trade and foreign investment play a critical role. Governments need to prioritise industries to provide a favourable home base for companies that compete internationally. This will allow competitive advantages of the company to be created and sustained, core product and process technology to be developed and the most productive jobs and most advanced skills to be located around the chosen industry or sub-industry. There are positive spin-offs to this collaboration – linked domestic industries can simultaneously grow and flourish.
Collaboration between government and industry should lead to segmented markets, differentiated products, technology differences, economies of scale, improved product quality and features, and new product innovation.
As countries strive to improve the standards of living for their citizens, so greater collaboration is required between industries and between government and the private sector. The alternative to poor or no collaboration is oblivion.
Mike Vincent
South Africa Manufacturing Advisory Leader

18
Local market attractiveness

Deloitte Manufacturing Competitiveness Report 19
Local market attractiveness
Manufacturing activity and economic prosperityThe Manufacturing sector is considered to be a major contributor to a country’s ability to grow its economy, to innovate and to build intellectual capital. Recent research from Harvard and MIT researchers Ricardo Hausman and César Hidalgo suggests that there is a direct link between the advancement of Manufacturing capabilities in a country, the complexity of its economy and its ability to grow and create prosperity for its citizens1. Once a country begins to manufacture goods it builds knowledge and capabilities that allow it to prosper more easily. Using export data for manufactured goods from 128 countries over 60 years, the study found that over 70% of the income variations between countries can be explained by differences in manufactured product export data alone.
Over the last few decades, rapid globalisation has driven a significant shift in the distribution of global Manufacturing activity away from developed countries towards emerging markets. Emerging economies with lower-cost labour rates, an improving skills base and infrastructure have been successful in attracting both multinational manufacturers and growing domestic producers. According to a report by the WEF2, the growth of Manufacturing activity has been a key driver of higher-value job creation and rising living standards in major emerging economies such as China, India, South Korea, Mexico and Brazil. By contrast, Manufacturing growth in major developed country centres, including the US, Japan, the United Kingdom and Canada, slowed considerably over the past decade, Germany being an exception.
As an emerging economy, South Africa has lagged its peers in taking advantage of the globalisation of the Manufacturing ecosystem. While exports of manufactures have increased since the country’s integration into the global economy in the early 1990s, growth has not been sufficient to generate the export-led growth boom experienced by emerging economies in East Asia and Latin America. In the Deloitte Global Manufacturing Competitiveness Index 20133, South Africa was ranked only 24th out of the 38 economies surveyed.
Key determinants of Manufacturing competitivenessWhat then are key determinants of Manufacturing competitiveness and in which areas is South Africa falling short?
Economic theory would suggest that the openness of an economy to trade, real unit labour costs, labour productivity and investment in physical capital are among the important determinants of a country’s industrial competitiveness.
The results of the 2013 Deloitte Global Manufacturing survey suggests that the availability, productivity and quality of skilled labour remain the most critical factors in driving a nations industrial competitiveness. “Talent -driven innovation,” which encompasses the quality and availability of skilled labour, including researchers, scientists and engineers, and the quality of primary and secondary education was ranked by over 550 Global Manufacturing executives as the most critical factor in determining a country’s ability to compete in Manufacturing. The economic, trade, financial and tax system, which includes clarity and stability of economic policy, the tax burden and system complexity was ranked second, followed by the cost and availability of labour and raw materials, the supplier network, legal and regulatory system and quality of physical infrastructure in third place.
Once a country begins to manufacture goods, it builds knowledge and capabilities that allow it to prosper more easily.

20
The Manufacturing landscape in South AfricaThe Manufacturing industry in South Africa employs around 1.7 million people and is currently the second-largest sector in the economy, accounting for 15.3% of GDP in 20114. The dominant Manufacturing activities in South Africa by value are petroleum and chemical products (25%), food and beverages (25%), iron steel and metal (20%), motor vehicles (10%) and wood products (8%)5. Manufacturing activity also has a multiplier effect on other sectors in South Africa, with a R1 increase in Manufacturing output likely to result in a R1.16 increase in output in other sectors6.
Historically, South Africa used to be seen as an attractive Manufacturing destination because of relatively low unit labour costs, cheap energy (until recently South Africa had one of the lowest electricity tariffs in the world) and relatively good transport and logistics infrastructure and a large natural resource endowment.
However, the recent performance of the South African Manufacturing industry can only be described as lacklustre, with real growth in Manufacturing production having averaged only 1.6% per annum from 1998 to 20127.
Impediments to Manufacturing competitiveness in South AfricaWhen asked which factors were currently influencing Manufacturing competitiveness in South Africa, South African Manufacturing CEOs identified the availability and cost of labour as the most problematic factor. Unit labour costs (the ratio of wages to labour productivity) in the Manufacturing sector rose by an average of 5.8% per year from 1998 to 2012. Over the same period, unit labour costs in many European countries have fallen due to productivity gains. According to research by Lawrence Edwards and Stephen Golub, South African unit labour costs are quite high relative to other newly industrialising countries, which compete with South Africa in developed country markets8. In addition, man-days lost to a recent surge in violent industrial action in 2012, particularly in the mining, agricultural and transport sectors are likely to have had a negative impact on Manufacturing productivity.
Local market attractiveness which refers to the size and access of the domestic market and intensity of local competition was ranked as the second-most-critical factor in Manufacturing competitiveness in South Africa, followed by energy cost and policies, clarity and stability of economic policy and the quality and efficiency of physical infrastructure (including ports, railways, road, IT and communications networks, etc).
With respect to local market attractiveness, South Africa is geographically remote from most major markets and shipping routes and as such does not benefit from the presences of large proximate market for its goods and services. While difficult to overcome, its proximity to fast-growing African economies could become a source of comparative advantage in the future.
Energy costs and policies ranked the third-most-critical issue faced by South African Manufacturing executives and have garnered much attention in recent years. For much of the past three decades, electricity prices in South Africa have been low and declining (in real terms). From 2008, however, the trend in real electricity prices took a dramatic turn and increased by 78% between 2008 and 20119. Increases in prices have been necessary to finance a massive increase in power generation capacity – a direct response to a decade of underinvestment in capacity, which resulted in critical supply shortages in 2008. However, the sharp and sudden increases in energy costs, coupled with an unfavourable economic climate, have put many manufacturers under pressure.
... proximity to fast-growing African economies could become a source of comparative advantage in the future.

Deloitte Manufacturing Competitiveness Report 21
The prospects for Manufacturing and the drive for increased competitivenessManufacturers within South Africa also currently hold a pessimistic view of the outlook for the industry with a large percentage of manufacturers regarding the current outlook as being fragile or weak10. This sentiment is linked to the effect of the strikes on the South African economy, the declining investment in the mining industry, high production costs, cheap imports, the impact of the Eurozone crisis and high domestic consumer debt. The results of the Deloitte 2013 Manufacturing Competitiveness survey suggest that South Africa’s competitiveness ranking will decline over the next five years, with the country likely to slip from 24th to 25th place.
Since the first democratic elections in 1994, the government has tried to promote export-led growth and position South Africa as a Manufacturing centre. Trade reform and increasing openness, new macroeconomic policies to promote economic stability and an overhaul of discriminatory social and welfare policies have no doubt influenced growth in the sector. But given the lacklustre performance of the Manufacturing sector in recent years and evidence of declining competitiveness, it is clear that further improvements to the economic and business environment will be required.
The Department of Trade and Industry (dti), in a bid to increase the Manufacturing competitiveness and in line with the Industrial Policy Action Plan (IPAP II), recently introduced the R5.8 billion Manufacturing and Competitiveness Enhancement Programme (MCEP). The objectives of the MCEP are to promote competitiveness and job creation through the provision of production incentives and industrial financing loan facilities. The dti is also planning to revitalise special economic zones (SEZs) in an attempt to mirror some of the successes Asian countries have had in using SEZs to promote industrial development. These zones will give manufacturers an opportunity to cluster activity around key transport infrastructure nodes and benefit from targeted tax incentives. Government is also embarking on an ambitious infrastructure programme in a bid to address current constraints in transport and energy infrastructure. Multi-billion rand planned investments in infrastructure are currently being coordinated by the Presidential Infrastructure Coordinating Committee (PICC), which established in 2011, will attempt to oversee and fast-track investments in critical transport, energy, water and other infrastructure programmes.
While targeted initiatives are welcome, there is no silver bullet that will provide the solution to South Africa’s declining competitiveness. Attempts to boost Manufacturing output and exports in South Africa will require a broader and more consolidated approach. In the 2013 Deloitte survey, Global Manufacturing CEOs highlighted that the availability and cost and productivity of labour and in particular the availability of quality of skilled labour remains are currently the most critical factor in driving a nation’s industrial competitiveness. Government will need to address the long-term structural problems in the labour market, which stem in part from inflexible labour legislation and the poor quality of primary and secondary education if sustainable increases in the productivity and availability of skilled labour are to be achieved.
Kay Walsh
Executive Lead Strategy and Innovation

22
The role of government

Deloitte Manufacturing Competitiveness Report 23
The role of government
Do incentives really work?Interest in investment on the African continent has increased over the past few years. But there have been comments in the press that “investment in Africa is no more risky than investing in South Africa” and inward investors have reported that “it is easier to talk to other African governments about investments than to talk to the South African government about investments”.
Such negative sentiments about the investment landscape in South Africa (when compared to other African and globally competing countries) naturally lead to the question of the commitment from the South African Government to improve and increase the competitiveness of the South African Manufacturing industry. In this regard, one must look at what has been promised, and achieved, in order to increase the competitiveness of the South African Manufacturing industry.
It is important to understand that the (dti) does offer a number of attractive incentives to the Manufacturing industry. However, these incentives must be fully understood in order to reap the full benefits. If handled appropriately, the incentives available can be as much as 10% – 30% off the cost of a capital project, whether greenfields or brownfields. Currently, the incentives are highly regulated and rigid, but considering the problems encountered in incentive administration in the past, this is understandable.
With correct planning from the start of the investment process, incentives can be rather lucrative. It is important that an investor fully understands the requirements of the various programmes, but it holds true that incentives can have an extremely positive impact on capital projects and that it may impact investment decisions. However, there are certain questions that must be asked: do the incentives on offer address the needs of the Manufacturing industry in its quest to become globally competitive? Are these incentives globally competitive, and do the incentives on offer adequately compete with what is on offer elsewhere?
To address the further question on whether the government has adequately assisted in improving the competitiveness of South African manufacturers through fiscal policy and incentives, it is important to remind ourselves of the responsibility of government – in this instance the dti – towards industrial policy development. But, the awareness by the Manufacturing industry when it comes to the availability and relevance of incentives must also be considered.The dti’s mission has been published as follows:
•Promote structural transformation towards a dynamic industrial and globally competitive economy.
•Provide a predictable, competitive, equitable and socially responsible environment, conducive to investment, trade and enterprise development.
•Broaden participation in the economy to strengthen economic development
•Continually improve the skills and capabilities of the dti to effectively deliver on its mandate and respond to the needs of South Africa's economic citizens.
Are these incentives globally competitive, and do the incentives on offer adequately compete with what is on offer elsewhere?

24
The dti has made it its mission to increase the competitiveness of the South African economy and to “provide a predictable, competitive, equitable and socially responsible environment, conducive to investment, trade and enterprise development”. In parallel, the Manufacturing industry asks for nothing more than an environment that is conducive to investment. If such an environment is created, competitiveness will increase without doubt.
To fulfil its operational mandate the dti is divided into five different areas of responsibility. The first is the industrial development area which is responsible for the development and implementation of the Industrial Policy Action Plan (IPAP) seeking to promote long-term industrialisation and industrial diversification. The other areas are trade, export and investment, broadening participation, regulation and lastly administration and coordination (with the latter focusing on the effective coordination and implementation of the Department and its agencies´ programmes, as well as integration of the dti´s work into government´s broader Plan of Action). It is mainly these areas of industrial policy development and administration and coordination that impact directly on the availability and administration of incentives. These areas also determine the competitiveness of the incentives that are being offered in South Africa: a country can have the best industrial policy, but if this does not carry through to delivery, the development of the industrial policy would bear no fruit.
The dti aims to deliver on its mission to provide an environment conducive to investment, trade and enterprise development through its IPAP. The latest version of IPAP, published in February 2011, identified employment creation as the main criterion for economic policy. The New Growth Path, launched in November 2010 by the Ministry of Economic Development, also made it clear that the government intends to establish an improved labour-absorbing growth path indicating that job creation is the main objective, featuring strongly in its economic policies.
The dti has followed through, to some extent, on this promise in the incentives that are available to the Manufacturing industry. Two of the three capital project grant options available to the Manufacturing industry, the Industrial Policy Project Programme (in terms of Section 12 I of the Income Tax Act) and the Manufacturing Competitiveness Enhancement Programme (MCEP), offer grant support to training initiatives. In the instance of the MCEP, support could be as much as 50% of training costs. There are of course still other training support measures on offer through other tax allowances. But the question on whether the support to the Manufacturing industry is sufficient to stimulate growth and ultimately job creation in the Manufacturing industry still needs to be asked. In this regard it is important to consider that IPAP identified different clusters as priority areas for economic development:
Cluster 1: Qualitatively new areas of focus
Cluster 2: Scaled-up and broadened interventions in existing IPAP sectors
Cluster 3: Sectors with potential for long-term advanced capabilities
Realising the potential of the metal fabrication, capital and transport equipment sectors, particularly arising from large public investments
Automotive products and components, and medium andheavy commercial vehicles
Nuclear
Oil & Gas Plastics, pharmaceuticals and chemicals
Advanced materials
Green and energy-saving industries Clothing, textiles, footwear and leather
Aerospace
Agro-processing, linked to food security and food pricing
Biofuels
Imperatives Forestry, paper, pulp and furniture
Boatbuilding Strengthening of linkages between cultural industries and tourism
Business process servicing
Table 6: Priority areas for economic development

Deloitte Manufacturing Competitiveness Report 25
It is right to expect targeted incentives aimed at improving the competitiveness of the identified clusters and, taking a long-term view, to expect specific focus on the third cluster which should have followed through to the incentives on offer by the dti. Sadly there are priority areas that do not qualify for any incentives or, due to the nature of the specific area (such as agro-processing), find it difficult to meet the qualifying criteria of the available incentives. It is also peculiar to note that the Industrial Policy Project Programme (Section 12 I of the Income Tax Act) does in fact have no relevance to any of the identified priority sectors of the Industrial Policy Project Action Plan and that one of the priority areas, aerospace, may in some instances actually be excluded from incentives offered in terms of Section 12 I.
It is critical that the dti follows its economic policy through to the incentives and that, if the identified priority clusters can deliver on the potential to create long-term sustainable employment opportunities, a targeted approach be taken. There are numerous countries that use incentives effectively to lure investors while supporting and growing its existing Manufacturing industries. It is a simple fact that although South Africa has some lucrative incentives, we cannot compete with countries that offer as much as 75% in grants to some capital projects. Government will also have to act in a cohesive manner with regard to economic development. Labour costs, the availability and cost of an adequately trained labour force and the availability, cost and reliability of energy and water are probably more important to the competitiveness of the Manufacturing sector than the availability of incentives. As indicated in its mission statement, the dti wants to “provide a predictable, competitive, equitable and socially responsible environment, conducive to investment, trade and enterprise development”. Despite all the efforts of the dti this cannot be done in isolation. Aspects like the availability and cost of the labour force, water and energy availability must be addressed by the government as a whole.
Furthermore, targeted incentives that would promote the more effective use of scarce resources like water, and similarly incentives available to companies that incur costs on electricity co-generation projects, could be an option. But sadly, this is not available in South Africa. It is also important that the policies of the dti and the incentives developed by the dti receive support from other government departments and that we do not have the situation where legislation is changed, which reduces the benefits offered in terms of incentives by the dti. In this regard the introduction of Section 12 P to the Income Tax Act undermines the efforts of the dti. The fact that there has been a substantial improvement in incentive administration at the dti and, in most instances, that incentive applications are submitted online, adjudicated and approved in globally competitive timelines must not be overlooked.
In closing, companies operate in a global economy where shareholders expect results and profits. These expectations drive investment decisions. The South African Manufacturing industry competes with countries where companies have a myriad of incentives available. These incentives range from cash incentives through to complete tax holidays and low cost industrial funding. South Africa needs to compete in this landscape, but, in order to compete, we need to know what we are competing against. This is the duty of both the dti and the Manufacturing industry.
The industry needs certainty when it comes to incentives,, but in an ever changing economic environment we also need flexibility. The industry also needs awareness with regard to what is on offer from the dti and from other government departments. The dti must, in turn, understand the needs of, and the threats to, the South African Manufacturing industry and, where appropriate, must be prepared to introduce new programmes to target these needs and threats.
If the Manufacturing industry fully understands and utilises the incentives on offer and if the dti addresses the needs and threats to the South African Manufacturing industry we may just become “the” African country to invest in, rather than “just another” African country to invest in.
Newton Cockcroft
Director Tax Incentives

26
Cost and availability of labour
Deloitte Manufacturing Competitiveness Report 27
Cost and availability of labour
Survey results indicate that talent has emerged as a top challenge on the business agendas of South African manufacturers. From boards of directors to CEOs to business unit leaders, there is consensus that talent is fundamental to business success. At the same time, however, there is growing concern among these executives about talent. Specifically, they are worried about the scarce supply of critical skills, how best to retain the people they have, and their leadership bench-strength.
South Africa has a widely recognised skills shortage, largely due to a mismatch of the skills in demand versus those in supply. This is in line with global trends, and the factors contributing to skills shortages have been widely documented – the developed world with its aging baby boomer generation, while the developing world suffers from its own rapid pace of development. According to the WEF in its 2012 Future of Manufacturing report, talented human capital will be the most critical resource differentiating the prosperity of countries and companies. It is estimated that worldwide 10 million jobs with Manufacturing organisations cannot be filled today due to a growing skills gap. This is particularly true in South Africa where despite the high unemployment rate, companies are struggling to fill Manufacturing jobs with the right talent.
Furthermore, the education system is not preparing work seekers with the necessary skills to take up the challenges in modern business. This leads to the need to carry out extensive training, both on the job and in classrooms. The additional expense and time taken greatly undermines the competitiveness of our businesses. Challenges increase incrementally with underperforming SETAs and skills levies being used inappropriately.
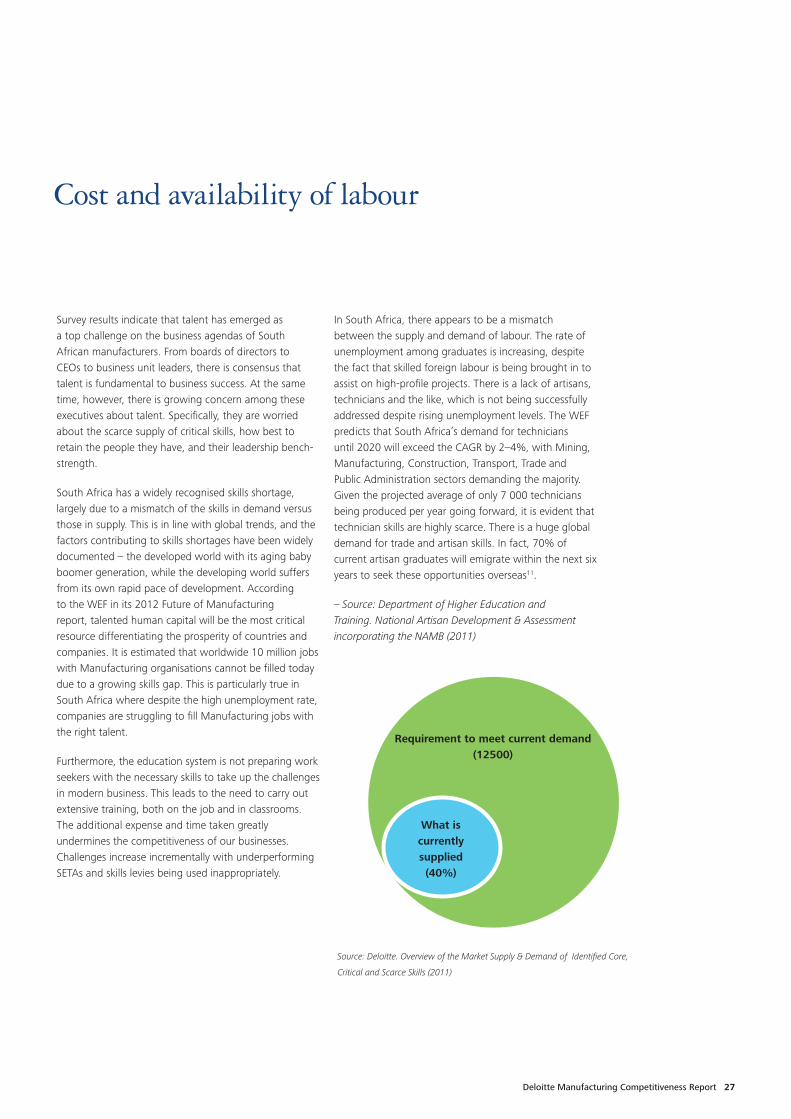
In South Africa, there appears to be a mismatch between the supply and demand of labour. The rate of unemployment among graduates is increasing, despite the fact that skilled foreign labour is being brought in to assist on high-profile projects. There is a lack of artisans, technicians and the like, which is not being successfully addressed despite rising unemployment levels. The WEF predicts that South Africa’s demand for technicians until 2020 will exceed the CAGR by 2–4%, with Mining, Manufacturing, Construction, Transport, Trade and Public Administration sectors demanding the majority. Given the projected average of only 7 000 technicians being produced per year going forward, it is evident that technician skills are highly scarce. There is a huge global demand for trade and artisan skills. In fact, 70% of current artisan graduates will emigrate within the next six years to seek these opportunities overseas11.
– Source: Department of Higher Education and Training. National Artisan Development & Assessment incorporating the NAMB (2011)
Source: Deloitte. Overview of the Market Supply & Demand of Identified Core,
Critical and Scarce Skills (2011)
Requirement to meet current demand(12500)
What iscurrentlysupplied(40%)

28
Source: The Global Competitiveness Report 2012–2013, World Economic Forum
Increased margins and overheads as a result of more rigid labour regulation can substantially reduce the sustainability of any Manufacturing operation, if economies of scale cannot be achieved. With other developing nations attracting more and more Manufacturing FDI, due to higher labour-related efficiencies, it is becoming increasingly difficult to compete with those economies. In the figure above it can be seen that South Africa has one of the lowest labour market efficiencies on the WEF Global Competitiveness Index for 2012–2013.
With other developing nations attracting more and more Manufacturing FDI, due to higher labour-related efficiencies, it is becoming increasingly difficult to compete with those economies.
Figure 4: Labour market efficiency - SA vs. top emerging economies and top 10 WEF GCI average

Deloitte Manufacturing Competitiveness Report 29
Source: The Global Competitiveness Report 2012–2013, World Economic Forum
South Africa’s pay and productivity ratio is the lowest among the emerging market group, making South African labour the last alternative to foreign investors and rigidity in the hiring and firing practices contribute to making South Africa’s labour market less and less attractive. Proposed amendments to labour laws surrounding the use of a non-permanent workforce exacerbate the rigidity issue and will increase overheads, as well as reduce margins for manufacturers. Construction and other cyclical project-based operations inherently require a non-permanent workforce. This prevents redundant costs during less busy periods.
Low cooperation in labour–employer relations, a significant power base of the unions and the lack of flexibility in wage determination reinforce our weak competitive standing in the global market. Recent mining and transport strikes strongly affect the Manufacturing industry by causing massive delays and backlogs, as well as raising the cost of doing business.
Figure 5: Lfactors contributing to labour market efficiency
Chris kotze
Associate DirectorRisk Advisory
Lewis Rosen
Senior Associate Human Capital

30
Physical infrastructure and energy

Deloitte Manufacturing Competitiveness Report 31
Physical infrastructure and energy
The impact of current infrastructure on ManufacturingThe bulk of South Africa’s existing infrastructure such as roads, railways, ports and energy, which are essential to the Manufacturing sector, require sizable investment on upgrades and maintenance. In areas such as transport and energy, new investment is required for new-build infrastructure projects, which are expected to complement existing capacities and also to meet future demand.
In 2011, fixed investment in the Manufacturing sector increased in real terms over 10%, and capacity utilisation stood at 80.6%, which was due to weak economic conditions12. Optimal capacity utilisation for Manufacturing ranges between 80% and 90%, and if it exceeds 90% consistently this warrants capital investment. The existing capacity underutilisation has more to do with the prevailing macro-economic conditions as opposed to the insufficiency of infrastructure. Manufacturing does, however, face infrastructure-related challenges such as high economic distances for goods which are transported using the least efficient transportation means, i.e. the use of roads instead of railways, leading to higher operating costs and lower returns for manufacturers. Ports in South Africa which serve industries such as vehicle Manufacturing lack sufficient capacity, leading to high freight costs, delays and high port charges, which impact manufacturing’s export competitiveness. Despite South Africa having competitively priced electricity, uncertainty of electricity availability forces many manufacturers to rely on back-up power from diesel generators, which is often more expensive than electricity supplied by Eskom, increasing production costs in some cases.
Manufacturing expects promptness from government and the enterprises it owns in developing infrastructure such as power plants, ports, roads and railway networks. Stagnation in infrastructure development has impelled the Presidential Infrastructure Coordinating Committee (PICC) to develop a 20-year infrastructure pipeline, which in addition to addressing infrastructure development backlogs, will ensure the following:
• Better financial mobilisation – capital requirements for developing and upgrading infrastructure are significant and require a combination of both public and private sector investment.
• Provide greater certainty to the construction industry – this will lead to better business planning, which will in turn support growth of the construction industry.
• Give educational institutions a framework around which to plan their skills development strategies.
• Provide a framework for investors and communities.
Manufacturing is also a key supplier of commodities that are used during the development of infrastructure. The current impetus shown by government in stemming under-investment in infrastructure by initiating projects will increase productivity within the sector.

32
What impact will the electricity price hikes have on the economy?Numerous stakeholders have come before Nersa (National Energy Regulator of South Africa) to express their concerns over Eskom’s request for an annual average 16% tariff increase in its third Multi-Year Price Determination (MYPD) application. The possibility that Eskom will earn net profits over the course of its capital expansion phase is in contrast to the norm for private companies, which often experience low profitability when they embark on capital investments. Stated upfront the effects of electricity price increases include, but are not limited to: erosion of South Africa’s electricity price competitiveness, job creation and lower disposable incomes for consumers. The unavoidability of electricity price increases will, however, drive innovation, efficiency and prudence, in turn lessening the impacts to the economy.
It is difficult to state with certainty what the impact of electricity price increases will be on the entire Manufacturing sector due to the differences in electricity intensity and consumption behaviours of its industries. For example:• Metal Manufacturing is highly energy intensive and relies
heavily on electricity. - For non-ferrous metal Manufacturing the value of electricity consumed constitutes 11% of total intermediate inputs, which is very high relation to a figure of about 1.7% for the entire Manufacturing sector. • Cement production relies heavily on electricity, however,
the industry is concentrated and can pass on costs to consumers.
• For chemicals and petrochemicals, and pulp and paper, energy intensity varies depending on the plant and the sophistication of its processes and machinery.
The unavoidability of electricity price increases will, however, drive innovation, efficiency and prudence, in turn lessening the impacts to the economy.

Deloitte Manufacturing Competitiveness Report 33
The Energy Intensive User’s Group (EIUG), which includes manufacturers, has stated that South Africa’s international competitiveness will be affected by the fast rate at which electricity prices are increasing. Eskom prefers implementing the price increases rapidly and is under the impression that consumers will adjust their consumption behaviours in response to being charged cost-reflective tariffs. This may be true for household consumers, but for energy-intensive consumers, if prices increase faster than consumers can adjust behaviour, this may lead to higher energy costs, falling output and ultimately the affected industries could face lower profitability levels.
Most large power users are under the impression that demand-side management (DSM) is costly and the cost reductions that result from implementing energy efficiency measures are not significant enough to warrant pervasive action. Eskom’s Integrated Demand Management (IDM) division provides financial incentives for the adoption of DSM practices, but driven mostly by a lack of knowledge and resistance to change, some apathy to becoming more energy efficient persists. In the past, most of Eskom IDM’s programmes were based on product replacement, but the division is willing to provide technical and financial assistance to firms wishing to explore other viable DSM initiatives such as self-generation using renewables. Some Manufacturing plant product replacements result in inconsequential efficiency gains, whereas process optimisation or rooftop PV installations can lead to sizable benefits. Interestingly, firms in sectors such as Finance, which are more resilient to electricity price increases when compared to Manufacturing, seem to be exhausting all opportunities that can improve efficiency. According to energy efficiency practitioners the Manufacturing sector can still implement more DSM measures such as process optimisation in order to complement product replacements and essentially cushion themselves from some of the economic effects on imminent price increases.
Are the electricity hikes necessary?In essence the underlying reason for electricity price increases is to improve energy security, which in turn will stimulate economic growth. Through increasing electricity tariffs, Eskom aims to achieve the following financial objectives:
• Cover the cost of its expansion programme• Cover rising primary energy costs – coal and liquid fuel in particular• Cover the cost of its DSM and power conservation programmes• Ensure financial sustainability and maintain positive credit ratings • Become an entity that is self-funding with limited financial support from government and is also able to attract private sector capital
Eskom, as a state-owned enterprise and in line with government directives, is expected to operate under a cost-recovery model in order to wean itself off capital injections by government. Eskom’s capacity expansion programmes require funding from tariff increases due to the utility not being able to accumulate sufficient cash during the time when the electricity price was kept low. Additionally, the rise in primary energy costs also necessitates above-inflation price increases.
In addition to the above-stated financial objectives, Eskom has a role in assisting government in meeting other objectives such as job creation, transformation, environmental sustainability and continuity in infrastructure development. As such, requiring Eskom to exclude government’s objectives by removing charges that are not related to electricity from tariffs is unfeasible.
What is the planned infrastructure spend in SA? Can we fund it, can we deliver it, and what impact will it have on Manufacturing?Table 1 summarises the sectorial breakdown of the R3.2 trillion worth of public sector infrastructure projects from 2010 to 2012 which are currently underway. Government’s funding of these investments is expected to come from the fiscus and cost-reflective pricing of resultant services. The drive towards cost-reflective pricing is currently being driven by Eskom, thus supporting government’s intent to deliver infrastructure projects. The PICC will be responsible for planning and implementation of major capital projects. Each of the projects will undergo rigorous assessments to ascertain their feasibility. The PICC aims to address infrastructure backlogs caused by underinvestment and ensure to continuity of infrastructure development. Government acknowledges the lack of public sector skills which are required for its infrastructure programmes and is enforcing measures to strengthen planning and implementation capacity at all levels. Furthermore the active involvement of the private sector in implementation of Strategic Infrastructure Projects (SIPs) is likely to drive implementation best practice.

34
Infrastructure that will best serve the Manufacturing sector should be centred on minimal raw material usage and higher efficiencies. The second Industrial Policy Action Plan (IPAP2) identifies the development of an energy efficiency industry to counteract higher electricity prices as a possible future benefit to Manufacturing. The availability of robust transport infrastructure will result in quicker channels to market, as well as affordable, more efficient distribution of products, which will benefit both the customer and the manufacturer. The evolution of energy sector policy could drive other manufacturers whose waste can be converted to energy to follow the example of the pulp and paper industry which self-generates some of its electrical energy requirements.
Source: National Treasury, 2012 Budget Review
Shamal Sivasanker
South Africa Power, Utilities and Infrastructure Leader
Table 7: Mega projects under consideration, 2012 - 2020
R (billion) Concept Pre-feasability Feasability Financing Detailed design
Tender Construction Ongoing programmes
Total
Water 20 0 0 32 0 5 18 0 75
Transport 310 0 78 17 12 88 8 71 584
Elecricity 720 268 314 0 95 103 345 101 1946
Liquid Fuels 0 0 211 0 2 0 0 0 213
Education 20 0 0 40 0 0 0 125 185
Health 0 0 50 29 0 0 0 31 110
Telecommunication 12 0 0 0 0 0 3 0 15
Human settlement 0 0 0 78 0 0 0 0 78
Total 1085 268 653 196 109 196 375 328 3206
% of Expenditures 33.75% 8.36% 20.37% 6.11% 3.40% 6.11% 11.67% 10.23% 100%

Deloitte Manufacturing Competitiveness Report 35
Role of the trusted business advisor
R (billion) Concept Pre-feasability Feasability Financing Detailed design
Tender Construction Ongoing programmes
Total
Water 20 0 0 32 0 5 18 0 75
Transport 310 0 78 17 12 88 8 71 584
Elecricity 720 268 314 0 95 103 345 101 1946
Liquid Fuels 0 0 211 0 2 0 0 0 213
Education 20 0 0 40 0 0 0 125 185
Health 0 0 50 29 0 0 0 31 110
Telecommunication 12 0 0 0 0 0 3 0 15
Human settlement 0 0 0 78 0 0 0 0 78
Total 1085 268 653 196 109 196 375 328 3206
% of Expenditures 33.75% 8.36% 20.37% 6.11% 3.40% 6.11% 11.67% 10.23% 100%

36
The list goes on in an increasingly complex business environment. Not only is it cost intensive, it also detracts from the organisation’s core business. Modern organisations are making sure that they retain their core skills on their books and are starting to outsource specialist skills. This allows organisations to draw on the expertise when needed and not to incur the ongoing costs of these experts.
Consequently, professional advisors are becoming more accountable to their clients to add significant value to their business. Professional advisory firms in South Africa are faced with challenges significantly more complex than many of their global peers and cannot just deliver their singular service – they need to go beyond the expected in order to exceed their clients expectations. Clients in turn, should be more demanding and expect deeper insights, global reach and technical excellence from their professional advisors.
Local manufacturers should demand that their advisor assists them in mitigating or taking advantage of the future and current market challenges. These advisors need to ensure that they have invested time in understanding the business, the industry and all the existing value chain influencers. With real understanding of the trends and issues in the industry, as well as an interpretation of how it impacts each business, an advisor should map unique solutions for problems by capitalising on extensive experience and expertise. It is imperative that the advisor provides a long-term perspective to ensure a sustainable competitive advantage for the business and in so doing, continue to foster a long, beneficial relationship.
The role of the trusted business advisor
With the advent of globalisation, the business world has become increasingly complex. This complexity is driven off the back of:
• The proliferation of information that is currently available (the volume of information requires in-depth analysis to allow the users to understand and process the information, to prioritise what needs to be done and to act accordingly).
• Improved global access, which allows companies to compete in new jurisdictions and get their products and services to markets, which were previously reserved for local companies.
• Pricing, right skills in right places and consequently driving efficiencies in organisations.
• Improved communication and infrastructure in the developing countries.
Global value chains, market presence and diversified cultures have resulted in organisations becoming more sensitive to managing diversity. Globalisation, technology and the information age have made the world smaller and, in doing so, have significantly raised the stakes to compete. This has demanded that local Manufacturing companies become more competitive with their global peers.
Given this increased complexity, how can organisations realistically employ all of the experts on their books?• Legal experts need to not only keep abreast of legal and global regulatory requirements, but also nned to manage how they impact the business today and going forward.• Business architects and IT experts need to ensure the best systems (including technological) are implemented to manage cross-border operations.• Tax specialists need to ensure that the tax processes in place best benefit the organisation in every jurisdiction it operates in as well as to ensure that all material tax risks are addressed and mitigated. (Operating across a number of different geographies, with differing political views, only serves to increase the tax risks faced.)
Bronwyn Kilpatrick
South Africa Manufacturing Assurance Leader

Deloitte Manufacturing Competitiveness Report 37
Contributors
Karthi Pillay
Southern Africa Manufacturing Industry Leader [email protected]: +27 (0)11 806 5173
Lewis Rosen
Senior Associate Human [email protected] Tel: +27 (0)11 806 5400
Mike Vincent
South Africa Manufacturing Advisory Leader [email protected]: +27 (0)11 806 5339
Shamal Sivasanker
South Africa Power, Utilities and Infrastructure Leader [email protected]: +27 (0)11 209 6592
Bronwyn Kilpatrick
South Africa Manufacturing Assurance Leader [email protected]: +27 (0)11 806 6047
Kay Walsh
Executive Lead Strategy and Innovation [email protected]
Newton Cockcroft
Director Tax Incentives [email protected] Tel: +27 (0)11 806 5298
Anisa Collins
Manufacturing Analyst Solution Centre [email protected]: +27 (0)11 209 6881
Chris kotze
Associate DirectorRisk Advisory [email protected] Tel: +27 (0)11 806 5389

38
References
Hausmann, R., Hidalgo, C.A. et al. (2011) The Atlas of Economic Complexity: Mapping Paths to Prosperity in World Economic Forum in collaboration Deloitte Touche Tohmatsu Limited (2012) The Future of Manufacturing - Opportunities to drive economic growth. Available at http://www3.weforum.org/docs/WEF_MOB_FutureManufacturing_Report_2012.pdf
World Economic Forum in collaboration Deloitte Touche Tohmatsu Limited (2012) The Future of Manufacturing - Opportunities to drive economic growth. Available at http://www3.weforum.org/docs/WEF_MOB_FutureManufacturing_Report_2012.pdf
The Deloitte 2013 Global Manufacturing Competitiveness Index was a study conducted in conjunction with the U.S. Council on Competitiveness which gathered data from more than 550 international CEOs and senior manufacturing leaders in 2012. Available at: http://www.deloitte.com/assets/Dcom-Global/Local%20Assets/Documents/Manufacturing/dttl_2013%20Global%20Manufacturing%20Competitiveness%20Index_11_15_12.pdf
Deloitte analysis based on data from Statistics South Africa official GDP and employment statistics.
Deloitte analysis based on Statistics South Africa manufacturing data, December 2012
Deloitte analysis based on Quantec social accounting matrix for South Africa 2013
Deloitte analysis based on data from Statistics South Africa official manufacturing production data
Edwards, L. and Golub, B. (2004) ‘South Africa’s International Cost Competitiveness and Exports in Manufacturing’, World Development Vol. 32, No. 8, pp. 1323–1339. Available at: http://preview.swarthmore.edu/Documents/academics/economics/Golub%20and%20Edwards.pdf
Deloitte (2012) The Economic Impact of Electricity Price Increases on Various Sectors of the South African Economy, A Report consolidating the findings of recent research, a report for Eskom. Available at: http://www.eskom.co.za/c/article/1727/independent-economic-impact-studies/
Pan African Investment and Research Services, 2012
Department of Higher Education and Training. National Artisan Development & Assessment incorporating the NAMB (2011)
Manufacturing is often linked to HCE – household consumption expenditure, increasing with an increase in income per capita.
1.
2.
3.
4.
5.
6.
7.
8.
9.
10.
11.
12.


Deloitte refers to one or more of Deloitte Touche Tohmatsu Limited (DTTL), a UK private company limited by guarantee, and its network of member firms, each of which is a legally separate and independent entity. Please see www.deloitte.com/about for a detailed description of the legal structure of Deloitte Touche Tohmatsu Limited and its member firms. Deloitte provides audit, tax, consulting and financial advisory services to public and private clients spanning multiple industries. With a globally connected network of member firms in more than 150 countries, Deloitte brings world-class capabilities and high-quality service to clients, delivering the insights they need to address their most complex business challenges. Deloitte has in the region of 200 000 professionals, all committed to becoming the standard of excellence. This communication contains general information only, and none of Deloitte Touche Tohmatsu Limited, its member firms, or their related entities (collectively, the “Deloitte Network”) is, by means of this publication, rendering professional advice or services. Before making any decision or taking any action that may affect your finances or your business, you should consult a qualified professional adviser. No entity in the Deloitte Network shall be responsible for any loss whatsoever sustained by any person who relies on this communication. © 2013 Deloitte & Touche. All rights reserved. Member of Deloitte Touche Tohmatsu Limited (00000/den)
www.deloitte.co.za