competitive dynamics in mortgage ... - · pdf fileshifting sands and crumblingowerst...
TRANSCRIPT

SHIFTING SANDS AND CRUMBLING TOWERS COMPETITIVE DYNAMICS IN MORTGAGE ORIGINATIONS
AUTHORS
Biniam Gebre, Partner
Ahmet Hacikura, Partner
Alina Lantsberg, Principal
Tom McAndrews, Engagement Manager

Since the financial crisis of 2007–08 the US mortgage market has changed dramatically.
While most of the banking industry has continued its decades-long consolidation—with
the top 10 banks increasing their share of deposits from 40 percent pre-crisis to 53 percent
today1 —the mortgage industry has moved in exactly the opposite direction. Instead of
consolidating, the post-crisis origination market has been characterized by the resurrection
of independent mortgage lenders, the emergence of modularity, and overall fragmentation.
1 Source: SNL Financial, an offering of S&P Global Market Intelligence
Exhibit 1: Market share by size and types
YEAR
2010 2015
$1,570 BN $1,735 BN
$BN IN ORIGINATIONS
FOR ALL ORIGINATIONS
Top 5 banks
Other top banks
Top nonbanks
Smaller lenders
27%
8%
30%
35%
64%
21%
8%
7%
YEAR
2010 2015
$535 BN $908 BN
$BN IN ORIGINATIONS
FOR PURCHASE LOANS
Top 5 banks
Other top banks
Top nonbanks
Smaller lenders
60%
15%
6%
19%
27%
5%
18%
50%
YEAR
2010 2015
$1,095 BN $827 BN
$BN IN ORIGINATIONS
FOR REFINANCING LOANS
Top 5 banks
Other top banks
Top nonbanks
Smaller lenders
27%
4%
26%
42%
62%
15%
8%
15%
YEAR
2010 2015
$104 BN $328 BN
$BN IN ORIGINATIONS
FOR JUMBO LOANS
Top 5 banks
Other top banks
Top nonbanks
Smaller lenders
49%
14%
8%
29%
47%
9%
6%
38%
Source Inside Mortgage Finance. Threshold for “top” lenders analyzed across loan purposes/products varies due to number of lenders listed in annual Inside Mortgage Finance league tables. Sum of IMF estimates of overall purchase and refi loans does not match IMF’s estimate of total overall originations for 2010.
Copyright © 2016 Oliver Wyman 2

CRUMBLING TOWERS
The shift (illustrated in Exhibit 1) has been sweeping.
• Over the past five years, the top five deposit-taking banks in the league table rankings have seen their share of mortgage origination fall from 64 percent in 2010 to 27 percent in 2015. In other words, more than $500 billion in originations has shifted away from the top five bank originators.
• Independent mortgage lenders (also referred to as “nonbanks”) among the top 40 overall originators have increased their market share from 8 percent to 30 percent over the past five years. Strikingly, over that period 21 nonbanks2 have entered the top 40 mortgage lenders. Collectively, these nonbanks originated approximately $528 billion in 2015 versus $128 billion in 2010. The top five banks, meanwhile, originated $999 billion in 2010 versus only $468 billion in 2015 (see Exhibit 2).
• Smaller lenders (including banks and nonbanks) outside of the top 40, which controlled only 7 percent of originations in 2010, now control 35 percent of the market, a fact that calls into question the conventional wisdom that blames nonbanks with little regulatory constraint for the growing fragmentation in the market.
These trends are consistent across both the purchase and refinance markets, though they
are less pronounced in the jumbo market. And these trends may very well continue.
2 Twenty-one is the net number of nonbanks entering the top 40 Inside Mortgage Finance origination rankings since 2010. Twenty-three entered while Provident Funding exited and Affiliated Mortgage Company was acquired by Benchmark Bank, which is no longer in the top 40.
Exhibit 2: US mortgage originations by institution type
$BN IN ORIGINATIONS
YEAR
2010 2015
$468 BN
$999 BN
$128 BN
$528 BN
Nonbanks in top 40 largest lenders
Top 5 banks (by originations)
Source Inside Mortgage Finance
Copyright © 2016 Oliver Wyman 3

Brokers accounted for 30% of originations pre-crisis but only 10% in 2015
SHIFTING SANDS
What is driving this decline of large bank dominance of mortgage originations? Many people
theorize that larger banks themselves have caused the change by abandoning certain
segments of the market. They point to several specific areas:
• Broker channel: Banks have all but abandoned brokers, which accounted for 30 percent of originations before the crisis but only 10 percent in 2015. The volume of loan originations coming through the broker channel remains at an all-time low and close to where it was during the crisis.
• Correspondent channel: A few institutions have also pulled back from correspondent lending. This channel is not as attractive as it used to be, due to relatively punitive MSR risk weighting from Basel III, the MSR cap relative to Tier 1 Capital, and the reduced financing advantage vis-à-vis GSEs due to g-fee parity. Nonetheless, most large banks continue to actively pursue correspondent lending.
• FHA lending: The threat of lawsuits launched by the Department of Justice has caused most banks to pull back significantly from government-insured loans. But government-insured lending accounts for a relatively small share of the overall market, $416 billion in 2015, or only 24 percent of the market—not nearly enough to explain the overall market’s much larger swing.
Other shifts in the landscape have not had as pronounced an impact on bank market share:
• Subprime lending: A corollary to the above is the claim that the mortgage market has returned to the go-go days of weak credit. While it may be true that some lower-credit borrowers have shifted away from banks, every measure of credit suggests that there has been no material change in the quality of credit being originated in aggregate across the industry since 2010.
• Consumer shift from refinance to purchase: Such a shift can’t explain banks’ loss of share—which is being seen across both the purchase and the refi market.
None of these explanations, alone or in aggregate, can fully explain why big banks have lost
so much market share over the past five years. Given how large the shift is—over $500 billion
in origination volume—there has to be more to the story than banks simply deciding to
abandon sub-segments of the market.
We believe there are other fundamental shifts in the industry that are leading to a
more fragmented and competitive marketplace. The evolving industry landscape is
characterized by:
• Disintermediation of client relationships: Banks no longer have a distinctive advantage in acquiring customers through their retail networks because of the gradual re-emergence of brokers, shifting choices of real estate agents due to regulatory constraints, growth of online shopping, expanded options for correspondents, and the continued growth of direct-to-consumer lending.
Copyright © 2016 Oliver Wyman 4

• Ecosystem expansion: The back office has become fully modular—meaning that different chunks of origination systems and operations are being delivered by different companies. Lenders have their pick of specialty servicers, data aggregation companies, and specialized technology offerings including pricing, closing, and document management. Meanwhile, companies such as Quicken and PHH continue to push white-labeling and platform renting.
• Better, cheaper and more accessible technology: In many areas of consumer banking, rapidly advancing technology has made fulfillment operations more effective and efficient — inadvertently throwing a spotlight on just how slowly the customer experience has been evolving in mortgage banking. In recent years, this has led customers to demand a more seamless experience, leading to the rise of nonbanks (such as Quicken) that offer a digitally driven fulfillment experience.
Copyright © 2016 Oliver Wyman 5

KEEPING SCORE
As the landscape grows more competitive, there are factors that hurt large banks, others that
favor them, and still others on which the jury is still out.
Competitive factors putting downward pressure on large bank market share include:
• Real estate agents: The influence of real estate agents on mortgage buying remains very strong—38 percent of purchase borrowers and 21 percent of refinance borrowers begin their mortgage shopping experience by talking with a real estate agent.3 Just a few years ago, many banks had joint ventures and marketing service agreements (MSAs) with home builders and real estate agents (e.g., paying for a sign or even a desk in the their office). Recent regulatory trends have been running against such deals; the Real Estate Settlement Procedures Act (RESPA) bans kickbacks, while the Consumer Financial Protection Bureau (CFPB) discourages participation in MSAs. Neither explicitly prohibits joint ventures and MSAs, but they have led many large banks to terminate such arrangements. This has eliminated the institutional relationships between real estate agents and banks, and has led to a street battle among sales agents.
• Digital channels: The growing importance of digital channels favors nonbank disrupters. One-third of borrowers already begin their application process online, and these shoppers clearly favor digital-savvy providers. For example, 15 percent of borrowers who began the shopping process online chose online-focused mortgage originators such as Quicken, LoanDepot or GuaranteedRate, compared to only 5 percent overall.4 Third party providers such as Roostify and Blend offer banks a way to catch up without having to build everything in-house or completely revamp their loan origination systems, but until banks are able to provide a seamless digital experience, digital mortgage originators are likely to continue capturing market share.
• Availability of financing/capital and relationships with government-sponsored enterprises: Large banks’ large balance sheets used to give them an advantage in the marketplace, but the more intense capital regulation of the past few years has caused it to erode. They are also subject to post-crisis Basel III risk-weighting of MSRs and capitalization relative to Tier 1 capital. Lastly, the guarantee-fee parity that larger banks used to enjoy has all but disappeared.
• Focus and attention: Distracted by significant regulatory requirements and burdened by legacy systems and operations, large banks find it difficult to maintain a laser focus on improving their offerings the way nonbank and smaller competitors do. This makes it difficult for traditional banks to build and compete with more distinctive business models.
Competitive factors protecting large bank market share include:
• Physical distribution: Bricks and mortar are still important; 26 percent of borrowers ranked having a local branch and being able to apply in person as the most important factor in the mortgage application experience.5 No other factor was selected as often. Borrowers who chose banks for their mortgage were particularly likely to focus on physical presence. This is an area where most nonbanks—which manage distribution through aggressive call centers, a strong online presence, or third parties—are not challenging banks.
3 Source: Oliver Wyman Mortgage Consumer Survey 2016
4 Source: Oliver Wyman Mortgage Consumer Survey 2016
5 Source: Oliver Wyman Mortgage Consumer Survey 2016
38% of purchase borrowers begin their mortgage shopping experience by talking with a real estate agent
26% of borrowers ranked having a local branch and being able to apply in person as the most important factor in the mortgage application experience
Copyright © 2016 Oliver Wyman 6

• Leveraging existing relationships: Mortgages are not highly cross-sold; only 24 percent of borrowers obtain their mortgage from their primary bank. Nonetheless, 37 percent of borrowers do list “having an existing relationship with the institution” among their top three factors for choosing a lender, and those borrowers overwhelmingly favor banks. Banks also have the potential to provide a superior customer experience by using tools such as predictive analytics to leverage existing relationships—though few banks have done much yet to capitalize on that opportunity.
Factors for which there is no clear winner… yet:
• Customer experience: Survey data suggests that Quicken is the only institution truly differentiating on customer experience. Large banks, smaller banks, and nonbanks are considerably behind in this effort (see Exhibit 3).
Exhibit 3: Borrowers ranking reputation for good customer service as important in deciding where to apply
% OF BORROWERS RANKING FACTOR AMONG THE TOP THREE MOST IMPORTANT TO THEM
41%
NONBANKS
43%
LARGEST BANKS
42%
OTHER BANKS
62%
QUICKEN
Source Oliver Wyman Mortgage Consumer Survey 2016, “Which factors were most important to you as you chose institutions to apply for a mortgage to?”. “Largest banks” includes Wells Fargo, Bank of America, JP Morgan Chase, US Bank and Citibank, which comprise the top 5 banks by mortgage originations in Inside Mortgage Finance’s2015 league tables.
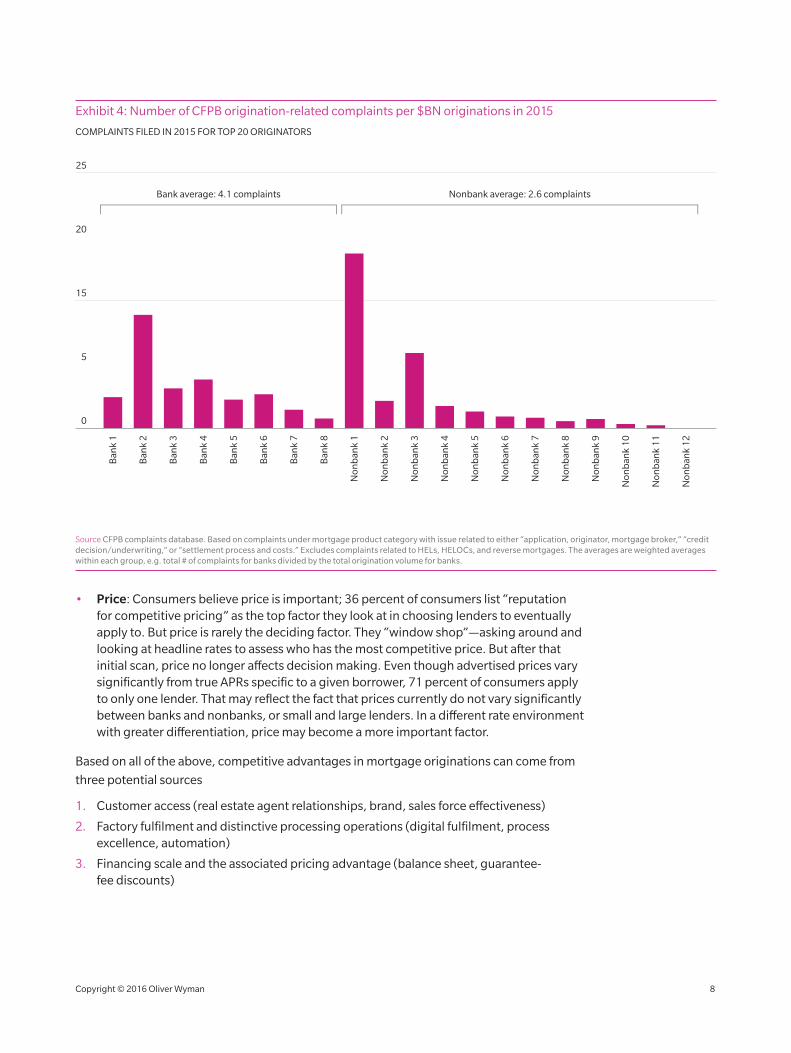
Customer experience comes in three potential forms: delightful, average, and terrible. A delightful experience is difficult to achieve, and may well not be perceived by customers who have nothing to compare it with. An average experience tends not to attract much attention one way or another. A terrible experience, on the other hand, gets talked about, and important influencers such as friends, family, and real estate agents are likely to hear about it and remember. If we take CFPB complaint data as a proxy, nonbanks are much better than banks at avoiding terrible experiences (see Exhibit 4). They may not deliver a superior experience across the board, but they have learned how to deliver a hassle-free one.
Copyright © 2016 Oliver Wyman 7
• Price: Consumers believe price is important; 36 percent of consumers list “reputation for competitive pricing” as the top factor they look at in choosing lenders to eventually apply to. But price is rarely the deciding factor. They “window shop”—asking around and looking at headline rates to assess who has the most competitive price. But after that initial scan, price no longer affects decision making. Even though advertised prices vary significantly from true APRs specific to a given borrower, 71 percent of consumers apply to only one lender. That may reflect the fact that prices currently do not vary significantly between banks and nonbanks, or small and large lenders. In a different rate environment with greater differentiation, price may become a more important factor.
Based on all of the above, competitive advantages in mortgage originations can come from
three potential sources
1. Customer access (real estate agent relationships, brand, sales force effectiveness)
2. Factory fulfilment and distinctive processing operations (digital fulfilment, process excellence, automation)
3. Financing scale and the associated pricing advantage (balance sheet, guarantee-fee discounts)
Exhibit 4: Number of CFPB origination-related complaints per $BN originations in 2015B
ank
1
Ban
k 2
Ban
k 3
Ban
k 5
Ban
k 4
Ban
k 6
Ban
k 7
Ban
k 8
Non
ban
k 1
Non
ban
k 2
Non
ban
k 3
Non
ban
k 4
Non
ban
k 5
Non
ban
k 6
Non
ban
k 9
Non
ban
k 12
Non
ban
k 8
Non
ban
k 11
Non
ban
k 7
Non
ban
k 10
COMPLAINTS FILED IN 2015 FOR TOP 20 ORIGINATORS
15
5
25
20
0
Bank average: 4.1 complaints Nonbank average: 2.6 complaints
Source CFPB complaints database. Based on complaints under mortgage product category with issue related to either “application, originator, mortgage broker,” “credit decision/underwriting,” or “settlement process and costs.” Excludes complaints related to HELs, HELOCs, and reverse mortgages. The averages are weighted averages within each group, e.g. total # of complaints for banks divided by the total origination volume for banks.
Copyright © 2016 Oliver Wyman 8

Before the financial crisis, larger banks maintained a clear upper hand relying primarily on
the third source of advantage. They had the balance sheet capacity that conferred numerous
benefits (cheaper funding costs, higher leverage, capacity for mortgage servicing rights),
GSE partnership deals that gave them lower guarantee-fees, the scale and money to build
institutional relationships with influencers, etc. Many of those benefits are now gone, forcing
banks to have to compete more aggressively on customer access and factory delivery. And
these are clearly much harder to get right. What’s next?
The last significant origination share increase for larger banks came about largely as a result
of the global financial crisis, which saw many nonbanks (and banks) implode. Some will
argue that the current trends are simply a manifestation of the credit cycle; that many of
these institutions will once again collapse when the credit cycle turns.
Even if that is the case, what is the best bet to make from the perspective of
traditional banks?
Do those banks have a desire to stem the tide? And if they do have the desire, will they be
able to or are they destined to continue ceding market share? What will the next major shift
in mortgage originations look like?
• The digital revolution: Will top lenders make major strides in digital capabilities and be able to provide a seamless end-to-end origination experience, transforming the mortgage process from a necessary evil to a pleasant, one-click shopping experience? Will these banks be able to catch up to Quicken?
• Honesty is the best policy: Will regulators force more transparent advertised rates, simplifying price comparisons and making price a more prominent competitive angle?
• Reversion to the mean: Will newer lenders, or those with short-term memories, venture back into more risky lending and drive another bubble?
Time will tell.
Copyright © 2016 Oliver Wyman 9

Oliver Wyman is a global leader in management consulting that combines deep industry knowledge with specialized expertise in strategy, operations, risk management, and organization transformation.
For more information please contact the marketing department by email at [email protected] or by phone at one of the following locations:
AMERICAS
+1 212 541 8100
EMEA
+44 20 7333 8333
ASIA PACIFIC
+65 6510 9700
Copyright © 2016 Oliver Wyman
All rights reserved. This report may not be reproduced or redistributed, in whole or in part, without the written permission of Oliver Wyman and Oliver Wyman accepts no liability whatsoever for the actions of third parties in this respect.
The information and opinions in this report were prepared by Oliver Wyman. This report is not investment advice and should not be relied on for such advice or as a substitute for consultation with professional accountants, tax, legal or financial advisors. Oliver Wyman has made every effort to use reliable, up-to-date and comprehensive information and analysis, but all information is provided without warranty of any kind, express or implied. Oliver Wyman disclaims any responsibility to update the information or conclusions in this report. Oliver Wyman accepts no liability for any loss arising from any action taken or refrained from as a result of information contained in this report or any reports or sources of information referred to herein, or for any consequential, special or similar damages even if advised of the possibility of such damages. The report is not an offer to buy or sell securities or a solicitation of an offer to buy or sell securities. This report may not be sold without the written consent of Oliver Wyman.
www.oliverwyman.com