compendium of materials boston
TRANSCRIPT

Change and InnovatIon In the a/e Industry
PeoPle and Practices that Build success!
#ACECFall2015octoBer 14-17 l Westin coPley Place l Boston2015 Fall ConFerenCe
BOSTONBOSTON CompEndium oF mAtEriAls

Annual ESOP Valuati onTrustee Advisor
Annual ESOP Valuati onTrustee Advisor
Sale of Company to ESOPCorporate Advisor
Executi ve Compensati on Consulti ng
Corporate Advisor
Sustainability Consulti ngTrustee Advisor
Annual ESOP Valuati onTrustee Advisor
Chartwell’s expertise in fi nancial advisory, corporate fi nance, and valuation services is focused on the unique needs of middle market companies. Our diverse team of professionals is passionate about delivering innovative, unbiased solutions of the highest quality to address our clients’ fi nancial complexities. Chartwell’s dedicated AEC team provides services to more than 50 companies in the industry.
For nearly 20 years, our team at Chartwell has not only done a great job of conducting our annual valuation, they have been our strategic partner as we grew our ESOP from inception in 1995 to the mature 100% ESOP ownership structure we enjoy today. Chartwell has consistently provided us with timely and valuable counsel regarding our options as our ESOP evolved, and helped us educate our employee owners along the way. Jon Carlson
CEO — Braun Intertec Corporation
Sustainability Consulti ngTrustee Advisor
Buy-side Transacti on Consulti ng
Trustee Advisor
UNCOMPROMISING VALUES INNOVATIVE SOLUTIONS PROVEN EXECUTION www.chartwellfa.com 866.232.8258UNCOMPROMISING VALUES INNOVATIVE SOLUTIONS PROVEN EXECUTION www.chartwellfa.com 866.232.8258UNCOMPROMISING VALUES INNOVATIVE SOLUTIONS PROVEN EXECUTION www.chartwellfa.com 866.232.8258UNCOMPROMISING VALUES INNOVATIVE SOLUTIONS PROVEN EXECUTION www.chartwellfa.com 866.232.8258UNCOMPROMISING VALUES INNOVATIVE SOLUTIONS PROVEN EXECUTION www.chartwellfa.com 866.232.8258

Is BIM and the virtual explosion of data it creates blowing holes in your quality control processes?Don’t miss the CIO Track Session “Delivering on the Promise of BIM”
Thursday, October 15 from 1:45-3:00 p.m.
presented by Michael O’Toole, Associate, Building CAD/BIM Design Services, WSP, and Allen Preger, Co-founder & VP of Global Strategy, Newforma.
For a free whitepaper on how to protect your ISO 9001 accreditation, visit Newforma in Booth #10 or online at www.newforma.com/ISO.
ACEC Fall Conference, Boston | Booth #10

Global infrastructure challenges are huge. Current methods aren’t good enough. What innovations and technologies will be necessary to ensure resilient and equitable infrastructure for the 21st century?
Water, energy, and transportation infrastructure make social, economic, and environmental vitality possible, but demand is relentless, budgets are tight, and complexity is multiplying.
A better tomorrow is in sight. Ways of intellectual and physical production are changing. Big data, boundless connectivity, and infinite computing power are changing what’s possible.
The way you deliver infrastructure is about to change.
Discover for yourself the benefits and what’s possible:Autodesk.com/advancingBIM
Accelerate what’s possible.
Autodesk and the Autodesk logo are registered trademarks or trademarks of Autodesk, Inc., and/or its subsidiaries and/or affiliates in the USA and/or other countries. All other brand names, product names, or trademarks belong to their respective holders. Autodesk reserves the right to alter product and services offerings, and specifications and pricing at any time without notice, and is not responsible for typographical or graphical errors that may appear in this document.
© 2015 Autodesk, Inc. All rights reserved.

Cracking the Strategy Paradox – Hands-on Scenario Planning to Decipher
and Prepare for the Future
Friday, October 16, 2015 – 2:30pm – 5:15pm
Presented by Kyle Davy, Kyle V. Davy Consulting; Geordie Aitken, Aitken Leadership Group; and Rod Hoffman, S&H Consulting
Strategic success demands commitment to specific actions and investments in the face of uncertainty. Take part in a rapid scenario planning exercise to a deeper understanding of your critical role in managing strategic uncertainty. SEI Alumni Reception to follow.
ABOUT THE SPEAKERS
Kyle established his firm to help engineering and architecture firms develop the leadership and management capacities they need to thrive in an increasingly turbulent environment. He has facilitated vision, strategic planning, and scenario planning processes for many leading firms across the country. He has also assisted firms in establishing corporate universities, internal leadership development and leadership succession programs. He is a principal faculty member of ACEC’s Senior Executive Institute (SEI).
Geordie is dedicated to awakening high-performance in AE firms professional service organizations. He brings an understanding of how to drive behavior change and motivate accountability. With over a decade of professional practice, Geordie also understands what it takes to design learning experiences that truly accelerate leadership capacity-building. He is a faculty member of ACEC’s Senior Executives Institute. He has co-taught the Personal Mastery and Leadership session since 2003.
Rod Hoffman is co-founder of S & H Consulting, a management consulting firm with expertise in leadership development, strategic planning, change management, and business marketing. Mr. Hoffman serves as CEO where he works with firms to develop national and international business strategies for the future. Rod served as a faculty member for the Senior Executive Institute (SEI) for a decade, a curriculum for developing leaders in the A/E/C consulting industry.

Data Security for A/E Firms
Friday, October 16 – 3:00pm – 4:15pm
Presented by Jim Jacobi, Walter P Moore; Eric Quinn, C&S Companies; and
Ray Judge, Diligent Examine the key technological challenges facing CIOs responsible for protecting and maintaining security of both firm and client data.
ABOUT THE SPEAKERS

Capital Market Trends
Friday, October 16 – 3:00pm – 4:15pm
Presented by Will Bloom, Chartwell Financial and Bruce Daniels, Boston
Private Banks; Marc Pressler, BMO Harris Bank; Paul Lipson, Fort Point
Capital Transformational trends facing the A/E sector that are likely to affect prospects for firm growth.
ABOUT THE SPEAKERS
Will leads Chartwell’s Chicago office. He is an investment banker for the firm’s Corporate Finance practice and heads the firm’s Capital Markets practice. Will has worked on both mergers and acquisitions as well as capital markets transactions within a variety of industries while executing high profile ESOP buyouts, terminations, and restructurings.

How to Reduce Your Professional
Liability Insurance Costs
Friday, October 16 – 3:00pm – 4:15pm
Presented by Timothy Corbett, SmartRisk Explore today’s risks and liability exposures, the underwriting criteria used by insurance carriers, and the steps you can take to minimize PL costs.
ABOUT THE SPEAKER
Timothy J. Corbett, Founder and President of SmartRisk. He has extensive experience developing and implementing strategic risk and performance management programs for design professional and environmental firms. Mr. Corbett has been published and holds copyrights to risk analysis processes for design firms.

1
How to Reduce Your Professional Liability (PL) Insurance Costs
ACEC 2015 Fall Conference, Boston, Mass
Presented By:
SmartRisk, LLC
Timothy J. Corbett, BSRM, MSM, LEED GAPasadena, CA
www.smartrisk.biz626‐665‐8150
Improving performance, profitability and lowering insurance costs through customized risk
management solutions

2
“Pulling Back the Curtain”
Agenda
• A/E Risks
• Standard of Care and Negligence
• Underwriting Strategy
• Cost of Insurance
• Limits, Increasing Limits & Deductibles
• Professional Liability (PL) Application
• Risk Management Efforts
• Selecting and Insurance Carrier

3
Architect, Engineers, Consultants (AEC)at Risk
• Multitude of risks
• Devastating ‐ litigation alleging negligence
• Professional Liability (PL) insurance, important risk management component
• Absorbs claims in exchange for premium
• Safety‐net when things go wrong
Standard of Care
• Corner stone of A/E Professional responsibility
• Professional Liability ‐ Standard of Care, negligence based coverage
• Negligence acts, errors, omissions in performance of services
• Comparative with reasonable, prudent professionals, similar situations
• Failure ‐ Held negligence in performance of professional duties

4
Negligence Action Against A/E
• Duty: Owns legal duty, an obligation
• Breach: Fails to perform duty
• Cause: Breach of duty causes harm
• Damage: Harm or damage resulted from breach
Insurability• Contractual conditions increasing risk:
– Warrantees & Guarantees– Project Performance– Green Certification & Energy Performance– Indemnity (hold harmless)– Duty to Defend
• Not negligent based• Other person legally responsible• Out of Scope of Professional Liability
Insurance Coverage• Risk and out of pocket $

5
Exclusions
Contract Liability
“This policy does not apply to any Claim based upon or arising out of liability assumed by an Insured under any contract or agreement, whether oral or written, except to the extent that the Insured would have been liable in the
absence of such contract or agreement.”
Exclusions
Warranties Or Guarantees
“This policy does not apply to any Claim based upon or arising out of any expressed warranty
or guarantee that would generally be accepted as standard of care applicable to
that Professional Service.”

6
Underwriting Criteria
• Type of Practice• Annual Revenue• Claim History• Type and Location of
Projects• Location of Firm• Firm Experience• Training• Contracting Practices• Risk Management
Program
Cost of Insurance
• Varies: Can be significant• Time and effort can reduce costs
(discussed later)• Rule of Thumb: % of Annual
Revenue– $1M Rev @ 1% = $10,000
• 61% of firms: .5 ‐ 1.5%
% Revenue % of Firms
– .50% 13%– .75% 12%– 1.0% 16%– 1.25% 11%– 1.50% 9%

7
Insurance Limits
• Function of financial needs, risk tolerance, contractual requirements
• Minimum: $100,000• Maximum: >$25 million• Yearly Limit: paying for claims and
legal expenses
– $1,000,000 limit: 41.5% – $2,000,000 limit: 31.1% – $3,000,000 limit: 4%– $5,000,000 limit: 12.3%– $10,000,000 limit: 4%
Increasing Limits
• Higher limits requested
• Larger, higher risk projects
• Public project trend, contractors insurance requirement
• Option: – Project specific excess limit instead of practice policy limit with increased cost
– Removes fees from practice policy in calculating premium
– Opportunity to negotiate cost as reimbursable

8
Increased Limits
• Availability and cost
• Underwriting analysis:– Firm size, discipline, services
– Construction costs
– Request for $5M limit on $500k project = unbalanced risk
• Increased exposure
• Creates target for firm
• Claim Trend:– PL Policies used as cost recovery on public projects
Increased Limit Request Approach
• Contract Administrator: “Firm carries E&O limit consistent with industry”:– Acceptable?
• Line‐out higher limit replace with current limits
• Work with agent to obtain a project specific increased limit
• Contract Language:– The expense of any additional insurance
coverage or limits, including professional liability insurance, requested by the Owner in excess of that normally carried by the firm and firm’s consultants shall be a reimbursable expense paid by the Owner.

9
Deductible
• Out of pocket $: – Defend a claim or
– After determination of negligence
• Sharing risk, reducing insurance costs
• Important:– Financially handle the deductible
– Used for each claim
– Multiple claims could put firm in jeopardy
– Advice from insurance professional
DeductiblePercentage of Gross Billings:
– 1% on “average” ($1M Billings = $10K Ded.)– 2% used as “maximum” ($1M = $20K Ded)
Deductible % of Firms <$5,000 3%$5,000 12%
$10,000 17% $25,000 21% $50,000 14%$75,000 5%$100,000 10%$150,000 6%$200,000 5%

10
How much time do you spend each year completing your PL application?
How Important is 1‐ 1.5% of your annual revenue?
Professional Liability (PL) Application
• Completing and delivering before renewal– 30 days prior
– Start 60 days before renewal date
• Helps tell your story
• Regulated Industry
• PL Application ‐ documenting and determining insurance cost
• Carrier Research: Website, internet, marketing, services, revenue, size, etc.

11
Annual Revenue
• Underwriting Process:
– Total “at risk” billings for a firm
– Review billings
– Breakout billings “not at risk”
– Reducing annual “at risk” revenue
• Not At Risk or Lower Risk
– Consultants fees, lower risk
– Reimbursable expenses, paid no risk
– Abandoned Projects that will not be built
Services• Insurance rates vary by services offered
• Details and accurate % on services is important
Lower Risk:– Master Plans
– Reports and Opinions
– Feasibilities Studies
– Non‐Structural Interior Design
– Program Management as Owners Representative
Higher Risk:
– Design Only
– Construction Management
– Design and Construction Observation
• Realize higher risk, methods applied mitigating exposures
12
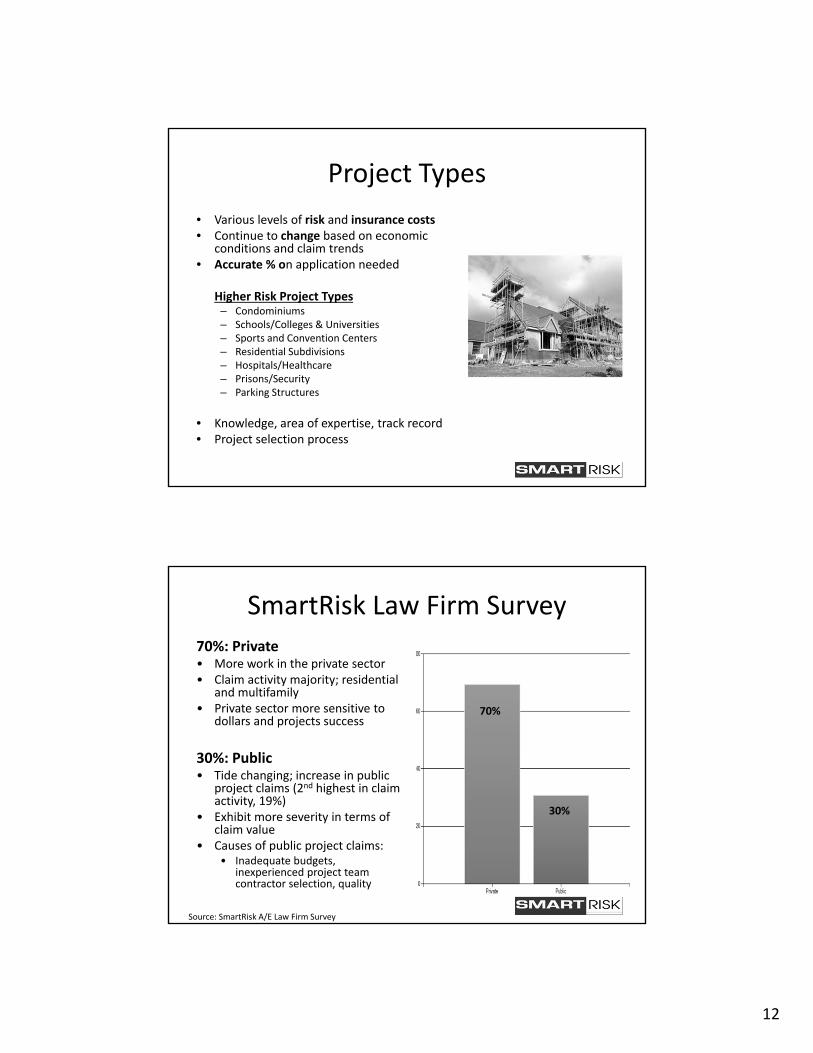
Project Types
• Various levels of risk and insurance costs• Continue to change based on economic
conditions and claim trends• Accurate % on application needed
Higher Risk Project Types– Condominiums– Schools/Colleges & Universities– Sports and Convention Centers– Residential Subdivisions– Hospitals/Healthcare– Prisons/Security– Parking Structures
• Knowledge, area of expertise, track record• Project selection process
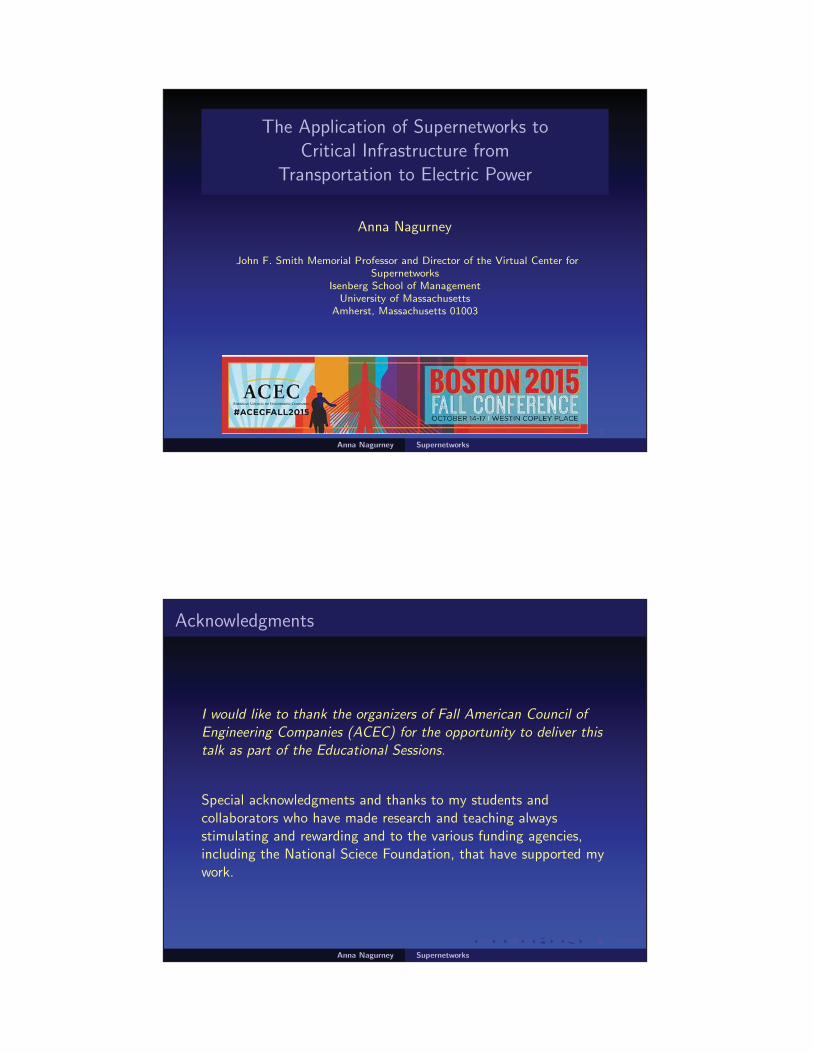
SmartRisk Law Firm Survey
70%: Private• More work in the private sector• Claim activity majority; residential
and multifamily • Private sector more sensitive to
dollars and projects success
30%: Public• Tide changing; increase in public
project claims (2nd highest in claim activity, 19%)
• Exhibit more severity in terms of claim value
• Causes of public project claims: • Inadequate budgets,
inexperienced project team contractor selection, quality
30%
70%
Source: SmartRisk A/E Law Firm Survey

13
Project Claims
• Condominiums: 28%
• Residential Sub‐Divisions: 19%
• Public Projects: 19%
• Schools: 13%
• Commercial: 6%
• High‐Rise Residential: 4%
• Medical: 4%
• Shopping Centers: 2%
• Office: 2%
• Sports Facilities: 2%
Source: SmartRisk A/E Law Firm Survey
Project Types with Largest Claims
• 14% Highways & Streets *• 9% Land Development• 7% Water or Wastewater Treatment *• 7% Water or Wastewater Conveyance *• 7% Healthcare• 6% Condominium• 6% Industrial & Process• 6% School K – 12 Higher Ed *• 6% Residential, Single Family• 6% Bridges & Tunnels *• 4% Utility *
Source: ACEC Member Firm Survey
• 6 out of 11Public Projects

14
Insurance Rates by Discipline • Rates vary by discipline ‐ higher risk,
increased insurance costs
• Disciplines with highest % of claims, or count (frequency and/or severity) compared to premium:– Architects
– Structural
– Civil
– MEP
– Surveyors
– Geotechnical
• Accurately identify % of work by discipline
• Knowledge of exposures, methods mitigating exposures
Claims By Discipline Disciplines with Highest Frequency of Claims:
• Architects: 29%• Prime, fees, peer review, complexity
• Structural: 24%• Reduced fees, scope, problematic
• Civil: 16%• Land development, grading, drainage
• MEP: 13%• Client expectations, system performance
• Geotechnical/Soil: 11%• Low fee, limited scope, high risk
• Surveyors: 5%• Technical errors, GPS, staking
• Electrical: 2%• Client expectations, scope, fee
Source: SmartRisk A/E Law Firm Survey

15
Clients
• Risk vary based on experience, knowledge, category, etc.
• Higher Risk Clients– Real Estate Developers– Public Institutions– Local Governments– Manufacturing/Industrial
• Lower Risk Clients– Federal Government– Private Institutions– Design Professionals
• Varying– Financial Institutions– Design‐Build Contractors
• Client Selection Process
Risk Management Efforts
• More than contracts and insurance
• Starts from the top down
• Strong, sound risk management program needed
• Results in reduced claims and lower insurance costs
• Risk should be considered in every business decision
• Impacts every aspect of a firm’s operation

16
Risk Management Efforts
• Identify knowledge and methodsto Underwriter. Increase comfort level.
– Experience and expertise
– Staffing levels
– Project and client selection
– Training efforts
– Communication and documentation
– Contracts development, LOL provisions
– QA/QC program
– Claim activity and lessons learned
– Risk management culture
Contracts and Limitation of Liability (LOL)
Identify methods for review, approval of contracts
– Revisions to firms terms and conditions– Owner generated contracts
Clients Do Not Generate LOL’s:
– Allocate risk in proportion to the benefit each party receives – Insist on at least: Limits of insurance; Fee total; Sum certain
Track Percentage:
– Signed contracts– LOL’s obtained, type

17
Claim Activity
• Loss runs, the basics
• Provide all pertinent information
• What happened, why, what have you done to correct reoccurrence?
• Lessons learned, changes to practices and procedures
• Be realistic and objective
• Clear picture for the underwriter will help you on renewal
All Insurance Is NotThe Same

18
Selecting an Insurance Carrier
• 60+ carriers today, <20 five years ago
• Enormous capacity, difficult decision, challenging economics
• Wide Variations:– Underwriting expertise
– Claim management
– Policy language
– Risk Management
– Reputation
• Quality‐Based Selection Process
• Requested of Clients when selecting Project team, contractor
• Selection of Business Partner
Changed PLI Carrier
• 51% ‐ Lower Premium
• 31% ‐ Better Policy Terms
• 22% ‐ Advice of Broker
• 17% ‐ Risk Management
• 14% ‐ Claims Handling
• 10% ‐ Could Not Renew
• 5% ‐ Pre‐Claims Assistance
Source: SmartRisk Survey of A/E Firms

19
Conclusion
• Many insurance options
• Vital for risk transfer and risk management program
• Can be costly, lower costs where possible
• Implement effective risk management practices
• Same time/effort on contracts given to PL application
• Look for advise fitting your firms needs
Copyrights & Legal Disclaimer
This Presentation is a protected by U.S. andInternational Copyright laws. The reuse, duplicationor reproduction in part, or in whole, is prohibitedwithout the written approval of SmartRisk.
This material is intended for informational purposeson the subject and should not be taken as legaladvice. Please consult appropriate advisors forguidance applicable to your individual circumstancesand/or state requirements.

20
Thank you
Timothy J. CorbettPasadena, CA 91101
T: 626‐665‐8150
www.smartrisk.biz

Architecture Council Roundtable
Friday, October 16 – 3:00pm – 4:15pm
Presented by Bruce Faudree, Hankins & Anderson; Jason Chandler, Epstein
Architecture and Laurie Goscha, Mead & Hunt Join this panel of experts as they discuss better ways to achieve on-time delivery, team collaboration, greater project efficiency, and profitability.
ABOUT THE SPEAKERS
Drawing on her expertise as an Associate Value Specialist, Laurie works with the entire project team to bring focus to the fundamental needs and desired outcomes for each assignment. From kitchen and toilet room remodeling to a new $50m Army Aviation and Support Facility and Readiness Center, Laurie understands the unique requirements for military construction and leverages that understanding to effectively manage projects from start to completion.

The Application of Supernetworks
to Critical Infrastructure from
Transportation to Electric Power
Friday, October 16 – 3:00pm – 4:15pm
Presented by Anna Nagurney, Isenberg School of Management, University of
Amherst Examine currently separate critical networks including power, transportation, financial systems and how they will be integrated into high performing unified supernetworks.
ABOUT THE SPEAKER
Anna Nagurney is the John F. Smith Memorial Professor of Operations Management and the Director of the Virtual Center for Supernetworks at the Isenberg School of Management at the University of Massachusetts Amherst. She is the author of 11 books, as well as over 170 journal articles on network themes, including supply chains (from pharmaceutical ones to electric power) and transportation and logistics (including humanitarian logistics), as well as social networks and financial networks and the Internet.
The Application of Supernetworks toCritical Infrastructure from
Transportation to Electric Power
Anna Nagurney
John F. Smith Memorial Professor and Director of the Virtual Center forSupernetworks
Isenberg School of ManagementUniversity of Massachusetts
Amherst, Massachusetts 01003
Anna Nagurney Supernetworks
Acknowledgments
I would like to thank the organizers of Fall American Council ofEngineering Companies (ACEC) for the opportunity to deliver thistalk as part of the Educational Sessions.
Special acknowledgments and thanks to my students andcollaborators who have made research and teaching alwaysstimulating and rewarding and to the various funding agencies,including the National Sciece Foundation, that have supported mywork.
Anna Nagurney Supernetworks

Outline
� What Are Supernetworks?
� Why Behavior Matters and Paradoxes
� Methodologies for Formulation, Analysis, and Computations
� An Empirical Application to Electric Power Supply Chains
� Which Nodes and Links Really Matter?
� Some Applications of the N-Q Measure
� From Transportation Networks to the Internet
� What About Transportation Network Robustness?
� Which Nodes and Links Matter Environmentally?
� What About Disaster Relief?
� Summary, Conclusions, and Suggestions for Future Research
Anna Nagurney Supernetworks
What Are Supernetworks?
Anna Nagurney Supernetworks
We Are in a New Era of Decision-Making Characterized by:
� complex interactions among decision-makers in organizations;
� alternative and, at times, conflicting criteria used indecision-making;
� constraints on resources: human, financial, natural, time, etc.;
� global reach of many decisions;
� high impact of many decisions;
� increasing risk and uncertainty;
� the importance of dynamics and realizing a timely response toevolving events.
Anna Nagurney Supernetworks
The Era of Supernetworks
Supernetworks are Networks of Networks, and their prevalence inthe world around us is illustrated by:
• multimodal transportation networks;
•complex supply chain networks consisting of manufacturers,shippers and carriers, distributors, and retailers;
• electric power generation and distribution networks,
•multitiered financial networks, and
• social network platforms such as Facebook and Twitter, alongwith the Internet itself.
Anna Nagurney Supernetworks

Supernetworks are Networks of Networks, and their prevalence inthe world around us is illustrated by:
• multimodal transportation networks;
•complex logistical networks consisting of manufacturers, shippersand carriers, distributors, and retailers;
• electric power generation and distribution networks,
•multitiered financial networks, and
• social network platforms such as Facebook and Twitter, alongwith the Internet itself.
Anna Nagurney Supernetworks
Multimodal Transportation
Anna Nagurney Supernetworks

Complex Logistical Networks
Anna Nagurney Supernetworks
Electric Power Generation and Distribution Networks
Anna Nagurney Supernetworks

Financial Networks
Anna Nagurney Supernetworks
Social Networks
Anna Nagurney Supernetworks

Visual Image of the Internet (opte.org)
Anna Nagurney Supernetworks
Characteristics of Networks Today
� large-scale nature and complexity of network topology;
� congestion, which leads to nonlinearities;
� alternative behavior of users of the networks, which may leadto paradoxical phenomena;
� possibly conflicting criteria associated with optimization;
� interactions among the underlying networks themselves, suchas the Internet with electric power, financial, andtransportation and logistical networks;
� recognition of their fragility and vulnerability ;
� policies surrounding networks today may have major impactsnot only economically, but also socially, politically, andsecurity-wise.
Anna Nagurney Supernetworks

Many of today’s networks are characterized by both a large-scalenature and complexity of the underlying network topology, so weare in an era of Supernetworks.
In Chicago’s Regional Transportation Network, there are 12,982nodes, 39,018 links, and 2,297,945 origin/destination (O/D) pairs,whereas in the Southern California Association of Governmentsmodel there are 3,217 origins and/or destinations, 25,428 nodes,and 99,240 links, plus 6 distinct classes of users.
In the case of the Internet, there are now over 3 billion users, 40%of the world’s population.
Anna Nagurney Supernetworks
The Most Congested US Metropolitan Areas in 2013
According to INRIX Inc. which publishes a National TrafficScorecard, the 2013 Top Congested Metropolitan Areas Were:
Anna Nagurney Supernetworks

The Costs of Congestion
According to the 2015 Urban Mobility report, prepared by theTexas A&M Transportation Institute and INRIX Inc., Americansspend 6.9 billion hours battling traffic and burn 3.1 billion gallonsof fuel while nudging inch by inch down the roadway.
The total nationwide price tag: $160 billion or $960 per commuter.
There is also a freight capacity crisis in parts of the USespecially in the Northeast.
The United States economy depends on trucks to delivernearly 70 percent of all freight transported annually in theU.S., accounting for $671 billion worth of manufactured andretail goods transported by truck in the U.S. alone.
Anna Nagurney Supernetworks
Capturing Link Congestion
In a typical user link travel time (or cost) function, the free flowtravel time referes to the travel time to traverse the link whenthere is zero flow or traffic on the link (zero vehicles).
Anna Nagurney Supernetworks

Congestion is Not a New Phenomenon
The study of the efficient operation of transportation networksdates to ancient Rome with a classical example being the publiclyprovided Roman road network and the time of day chariot policy,whereby chariots were banned from the ancient city of Rome atparticular times of day.
Anna Nagurney Supernetworks
Anna Nagurney Supernetworks
Anna Nagurney Supernetworks
Network Components
The components of networks as a theoretical (modeling, analysis,and solution) construct include: nodes, links, and flows.
We use such a representation to conceptualize formulate andAnna Nagurney Supernetworks

Anna Nagurney Supernetworks
Network Components
It is important to realize that there may be systems that, at firstglance, do not seem to be networks, but, after further thought andcreativity, one may be able to represent the system as a network!
The advantages of doing so are many:
Anna Nagurney Supernetworks

Network Components
It is important to realize that there may be systems that, at firstglance, do not seem to be networks, but, after further thought andcreativity, one may be able to represent the system as a network!
The advantages of doing so are many:
• One can then see similarities and differences in structure acrossdifferent problem domains.
Anna Nagurney Supernetworks
Network Components
It is important to realize that there may be systems that, at firstglance, do not seem to be networks, but, after further thought andcreativity, one may be able to represent the system as a network!
The advantages of doing so are many:
• One can then see similarities and differences in structure acrossdifferent problem domains.
• One can avail oneself of powerful network-based analytical tools.
Anna Nagurney Supernetworks

Network Components
It is important to realize that there may be systems that, at firstglance, do not seem to be networks, but, after further thought andcreativity, one may be able to represent the system as a network!
The advantages of doing so are many:
• One can then see similarities and differences in structure acrossdifferent problem domains.
• One can avail oneself of powerful network-based analytical tools.
• One can represent what may be an extremely complex problemgraphically through a network, which can suggest further insightsand extensions.
Anna Nagurney Supernetworks
Network Problems and Methodologies
Networks consist of nodes, links, flows, and behaviorassociated with their operation, usage, and management.
Network problems are a distinct class of problems and they comein various forms and formulations, i.e., as optimization (linear ornonlinear) problems or as equilibrium problems and even dynamicnetwork problems.
Methodologies that we have been using and extending toformulate, analyze, and compute solutions to large-scale networkproblems have included: network optimization, network theory,game theory, multicriteria decision-making, risk management,variational inequality theory, and projected dynamical systemstheory.
Anna Nagurney Supernetworks
Why Behavior Matters and Paradoxes
Anna Nagurney Supernetworks
Network Models from Analysis to Design Must Capture theBehavior of Users
Anna Nagurney Supernetworks
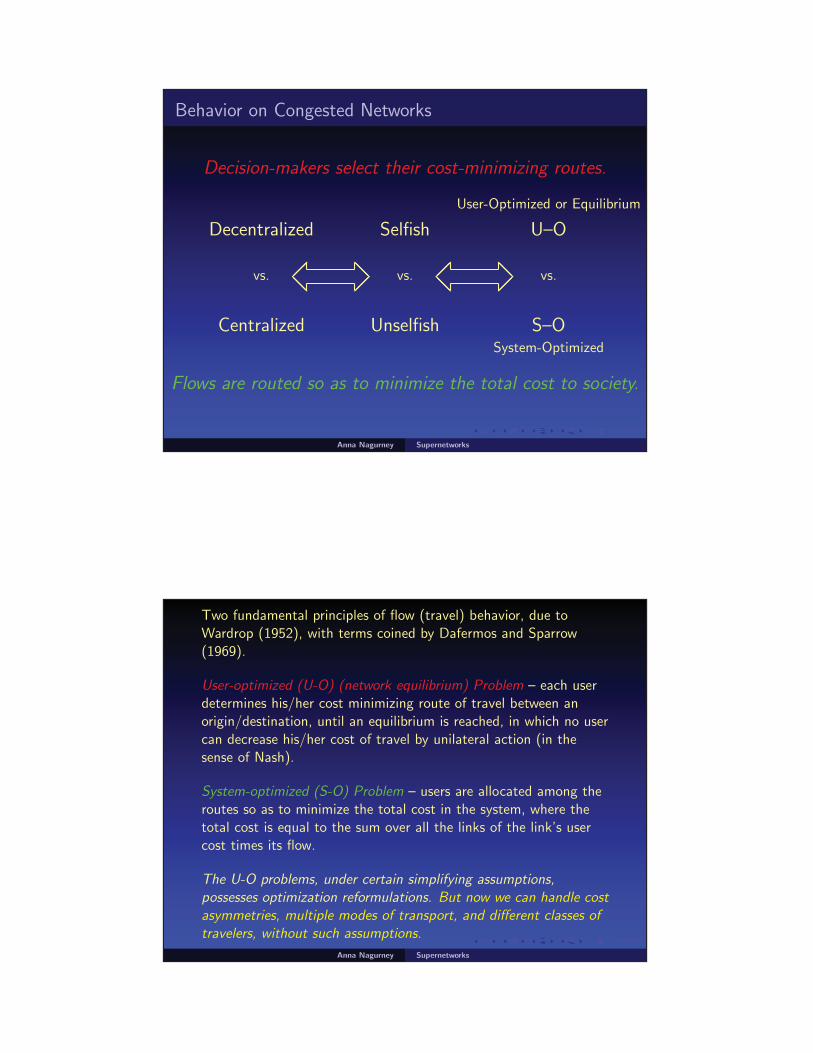
Behavior on Congested Networks
Flows are routed so as to minimize the total cost to society.
System-Optimized
Centralized Unselfish S–O
vs. vs. vs.����
����
����
����
Decentralized Selfish U–O
User-Optimized or Equilibrium
Decision-makers select their cost-minimizing routes.
Anna Nagurney Supernetworks
Two fundamental principles of flow (travel) behavior, due toWardrop (1952), with terms coined by Dafermos and Sparrow(1969).
User-optimized (U-O) (network equilibrium) Problem – each userdetermines his/her cost minimizing route of travel between anorigin/destination, until an equilibrium is reached, in which no usercan decrease his/her cost of travel by unilateral action (in thesense of Nash).
System-optimized (S-O) Problem – users are allocated among theroutes so as to minimize the total cost in the system, where thetotal cost is equal to the sum over all the links of the link’s usercost times its flow.
The U-O problems, under certain simplifying assumptions,possesses optimization reformulations. But now we can handle costasymmetries, multiple modes of transport, and different classes oftravelers, without such assumptions.
Anna Nagurney Supernetworks

We Can State These Conditions Mathematically!
Anna Nagurney Supernetworks
The U-O and S-O Conditions
Definition: U-O or Network Equilibrium – Fixed DemandsA path flow pattern x∗, with nonnegative path flows and O/D pairdemand satisfaction, is said to be U-O or in equilibrium, if thefollowing condition holds for each O/D pair w ∈ W and each pathp ∈ Pw :
Cp(x∗)
{= λw , if x∗
p > 0,≥ λw , if x∗
p = 0.
Definition: S-O ConditionsA path flow pattern x with nonnegative path flows and O/D pairdemand satisfaction, is said to be S-O, if for each O/D pairw ∈ W and each path p ∈ Pw :
C ′p(x)
{= μw , if xp > 0,≥ μw , if xp = 0,
where C ′p(x)=
∑a∈L
∂ca(fa)∂fa
δap, and μw is a Lagrange multiplier.
Anna Nagurney Supernetworks

The Braess Paradox Illustrates
Why Behavior on Networks is Important
Anna Nagurney Supernetworks
The Braess (1968) Paradox
Assume a network with a singleO/D pair (1,4). There are 2paths available to travelers:p1 = (a, c) and p2 = (b, d).
For a travel demand of 6, theequilibrium path flows arex∗p1
= x∗p2
= 3 and
The equilibrium path travel costisCp1 = Cp2 = 83.
����4
����2
��
����
c
����3
��
����
d
����1
��
����
a
��
����
b
ca(fa) = 10fa, cb(fb) = fb + 50,
cc(fc) = fc +50, cd(fd) = 10fd .
Anna Nagurney Supernetworks

Adding a Link Increases Travel Cost for All!
Adding a new link creates a newpath p3 = (a, e, d).
The original flow distributionpattern is no longer anequilibrium pattern, since at thislevel of flow the cost on pathp3,Cp3 = 70.
The new equilibrium flow patternnetwork isx∗p1
= x∗p2
= x∗p3
= 2.
The equilibrium path travel cost:Cp1 = Cp2 = Cp3 = 92.
����4
����2
��
����
c
����3
��
����
d
�e
����1
��
����
a
��
����
b
ce(fe) = fe + 10
Anna Nagurney Supernetworks
Under S-O behavior, the total cost in the network isminimized, and the new route p3, under the samedemand of 6, would not be used.
The Braess paradox never occurs in S-O networks.
Anna Nagurney Supernetworks

The 1968 Braess article has been translated from German toEnglish and appears as:
“On a Paradox of Traffic Planning,”
D. Braess, A. Nagurney, and T. Wakolbinger (2005)Transportation Science 39, 446-450.
Anna Nagurney Supernetworks
The Braess Paradox Around the World
1969 - Stuttgart, Germany - Thetraffic worsened until a newlybuilt road was closed.
1990 - Earth Day - New YorkCity - 42nd Street was closed andtraffic flow improved.
2002 - Seoul, Korea - A 6 laneroad built over theCheonggyecheon River thatcarried 160,000 cars per day andwas perpetually jammed was torndown to improve traffic flow.
Anna Nagurney Supernetworks
Anna Nagurney Supernetworks
Interview on Broadway for America Revealed on March 15,2011
Anna Nagurney Supernetworks

Other Networks that Behave like Traffic Networks
The Internet, electric power networks, and even multitieredfinancial networks!
Anna Nagurney Supernetworks
Representation of Supply Chains as TransportationNetworks
The equivalence between supply chains and transportationnetworks established in Nagurney, Transportation Research E 42(2006), 293-316.
Anna Nagurney Supernetworks

Representation of Supply Chains as Networks
Multilevel supply chain established by Nagurney, Ke, Cruz, Hancock, and
Southworth in Environment & Planning B 29 (2002), 795-818.
Anna Nagurney Supernetworks
In 1952, Copeland in his book, A Study of Moneyflows in theUnited States, NBER, NY, asked whether money flows lie water orelectricity?
In 1956, Beckmann, McGuire, and Winsten in their classic book,Studies in the Economics of Transportation, Yale University Press,hypothesized that electric power generation and distributionnetworks could be transformed into transportation networkequilibrium problems.
Anna Nagurney Supernetworks
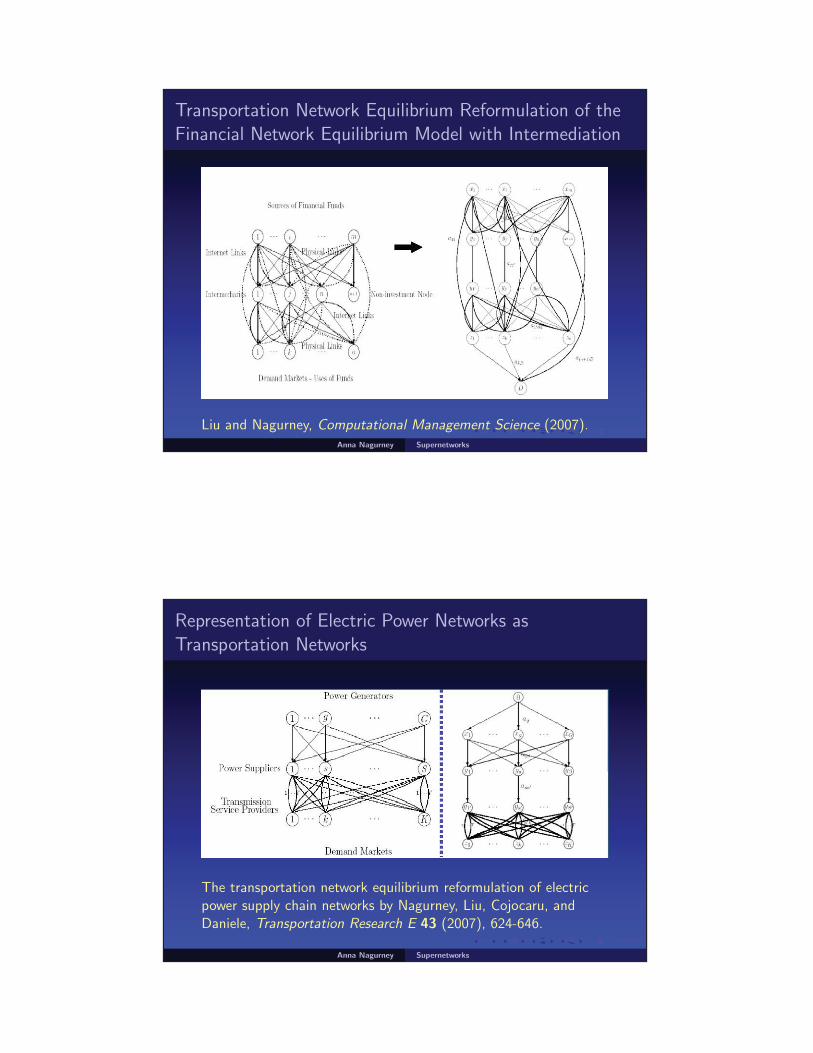
Transportation Network Equilibrium Reformulation of theFinancial Network Equilibrium Model with Intermediation
Liu and Nagurney, Computational Management Science (2007).Anna Nagurney Supernetworks
Representation of Electric Power Networks asTransportation Networks
The transportation network equilibrium reformulation of electricpower supply chain networks by Nagurney, Liu, Cojocaru, andDaniele, Transportation Research E 43 (2007), 624-646.
Anna Nagurney Supernetworks

Hence, we have shown that both electricity as wellas money flow like transportation flows.
Anna Nagurney Supernetworks
Methodologies for Formulation, Analysis, and Computations
Anna Nagurney Supernetworks
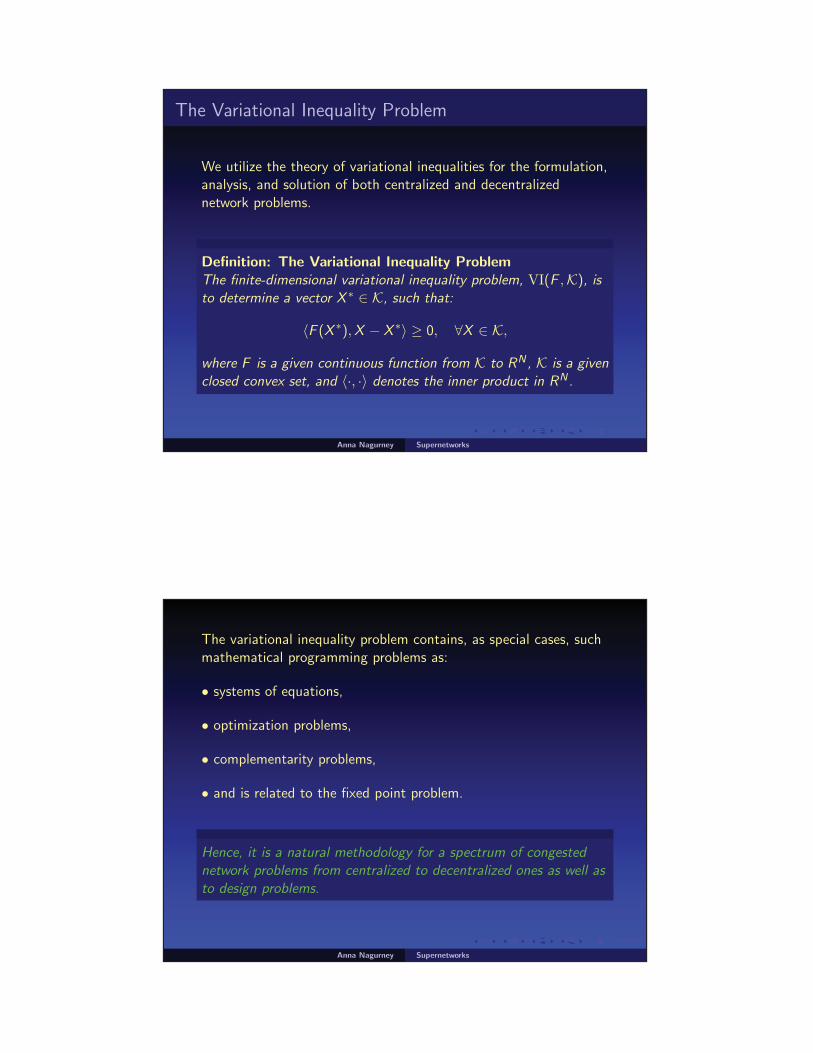
The Variational Inequality Problem
We utilize the theory of variational inequalities for the formulation,analysis, and solution of both centralized and decentralizednetwork problems.
Definition: The Variational Inequality ProblemThe finite-dimensional variational inequality problem, VI(F ,K), isto determine a vector X ∗ ∈ K, such that:
〈F (X ∗),X − X ∗〉 ≥ 0, ∀X ∈ K,
where F is a given continuous function from K to RN , K is a givenclosed convex set, and 〈·, ·〉 denotes the inner product in RN .
Anna Nagurney Supernetworks
The variational inequality problem contains, as special cases, suchmathematical programming problems as:
• systems of equations,
• optimization problems,
• complementarity problems,
• and is related to the fixed point problem.
Hence, it is a natural methodology for a spectrum of congestednetwork problems from centralized to decentralized ones as well asto design problems.
Anna Nagurney Supernetworks

Geometric Interpretation of VI(F ,K) and a ProjectedDynamical System (Dupuis and Nagurney, Nagurney andZhang)
In particular, F (X ∗) is “orthogonal” to the feasible set K at thepoint X ∗.
��������
��
����
��
��
��
���
�
�X ∗
Normal Cone
−F (X ∗)
F (X ∗)
X − X ∗
Feasible Set K
X
�
���X0
Associated with a VI is a Projected Dynamical System, whichprovides a natural underlying dynamics associated with travel (andother) behavior to the equilibrium.
Anna Nagurney Supernetworks
To model the dynamic behavior of supernetworks, includingtransportation networks and supply chains, we utilize projecteddynamical systems (PDSs) advanced by Dupuis and Nagurney(1993) in Annals of Operations Research and by Nagurney andZhang (1996) in our book Projected Dynamical Systems andVariational Inequalities with Applications.
Such nonclassical dynamical systems are now being used in
evolutionary games (Sandholm (2005, 2011)),
ecological predator-prey networks (Nagurney and Nagurney (2011a,b)), and
even neuroscience (Girard et al. (2008)).
Anna Nagurney Supernetworks

Anna Nagurney Supernetworks
Question: When does the U-O solution coincidewith the S-O solution?
Answer: In a general network, when the user linkcost functions are given by:
ca(fa) = c0a f β
a ,
for all links, with c0a ≥ 0, and β ≥ 0.
In particular, if ca(fa) = c0a , that is, in the case of
uncongested networks, this result always holds.
Anna Nagurney Supernetworks

����4
����2
��
����
c
����3
��
����
d
�e
����1
��
����
a
��
����
b
Recall the Braess network with the added link e.
What happens as the demand increases?
Anna Nagurney Supernetworks
For Networks with Time-Dependent Demands
We Use Evolutionary Variational Inequalities
Anna Nagurney Supernetworks
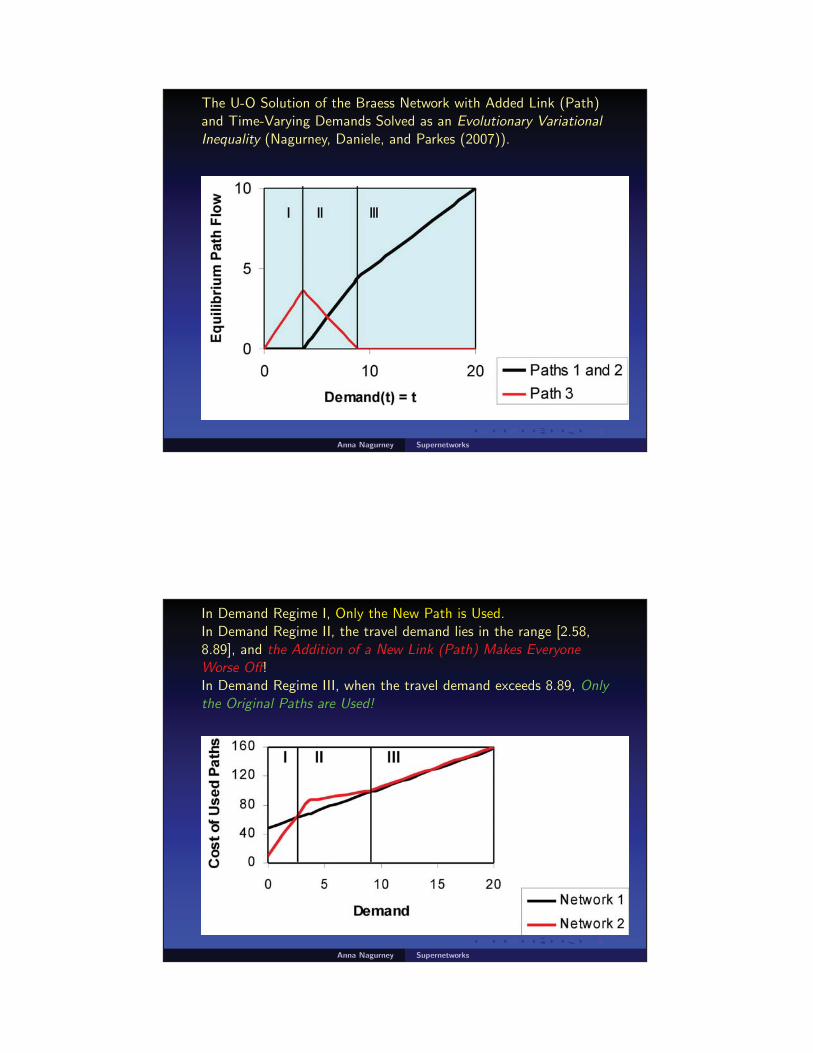
The U-O Solution of the Braess Network with Added Link (Path)and Time-Varying Demands Solved as an Evolutionary VariationalInequality (Nagurney, Daniele, and Parkes (2007)).
Anna Nagurney Supernetworks
In Demand Regime I, Only the New Path is Used.In Demand Regime II, the travel demand lies in the range [2.58,8.89], and the Addition of a New Link (Path) Makes EveryoneWorse Off!In Demand Regime III, when the travel demand exceeds 8.89, Onlythe Original Paths are Used!
Anna Nagurney Supernetworks

The new path is never used, under U-O behavior,when the demand exceeds 8.89, even out to infinity!
Anna Nagurney Supernetworks
An Empirical Application to Electric Power Supply Chains
Anna Nagurney Supernetworks

Electric Power Supply Chains
We developed an empirical, large-scale electric supply chainnetwork equilibrium model, formulated it as a VI problem, andwere able to solve it by exploiting the connection betweenelectric power supply chain networks and transportationnetworks using our proof of a hypothesis posed in the classicbook, Studies in the Economics of Transportation, by Beckmann,McGuire, and Winsten (1956).
The paper, “An Integrated Electric Power Supply Chain and FuelMarket Network Framework: Theoretical Modeling with EmpiricalAnalysis for New England,” by Z. Liu and A. Nagurney waspublished in Naval Research Logistics 56 (2009) pp 600-624;http://supernet.isenberg.umass.edu/articles/LiuNagurneyNRL.pdf
Anna Nagurney Supernetworks
An Empirical Example of an Electric Power Supply Chainfor New England
There are 82 generating companies who own and operate 573generating units. We considered 5 types of fuels: natural gas,residual fuel oil, distillate fuel oil, jet fuel, and coal. The wholearea was divided into 10 regions:1. Maine,2. New Hampshire,3. Vermont,4. Connecticut (excluding Southwest Connecticut),5. Southwestern Connecticut (excluding the Norwalk-Stamfordarea),6. Norwalk-Stamford area,7. Rhode Island,8. Southeastern Massachusetts,9. Western and Central Massachusetts,10. Boston/Northeast Massachusetts.
Anna Nagurney Supernetworks

Graphic of New England
Anna Nagurney Supernetworks
The Electric Power Supply Chain Network with FuelSupply Markets
����1, 1, 1 ����
· · ·G , 1, NG1 · · · ����1, r, 1 · · · ����
G , r, NGr · · · ����1, R, 1 · · · ����
G , R, NGR
Generating Unitsof Gencosin Regions
(genco, region, unit)
Power Pool
Fuel Markets forFuel Type 1
����1, 1 ����
· · · 1, M · · ·
Fuel Markets forFuel Type a
����a, 1 · · · ����
a, M
Fuel Markets forFuel Type A
· · · ����A, 1 · · · ����
A, M
�
�
�
Demand Market
Sectors
Region 1
�
�
�
Demand Market
Sectors
Region r
�
�
�
Demand Market
Sectors
Region R
����1, 1 ����
· · · 1, K ����r, 1 ����
· · · r, K ����R, 1 ����
· · · R, K
Anna Nagurney Supernetworks

We tested the model on the data of July 2006 which included24 × 31 = 744 hourly demand/price scenarios. We sorted thescenarios based on the total hourly demand, and constructed theload duration curve. We divided the duration curve into 6 blocks(L1 = 94 hours, and Lw = 130 hours; w = 2, ..., 6) and calculatedthe average regional demands and the average weighted regionalprices for each block.
The empirical model had on the order of 20, 000 variables.
Anna Nagurney Supernetworks
Actual Prices Vs. Simulated Prices ($/Mwh)
Anna Nagurney Supernetworks
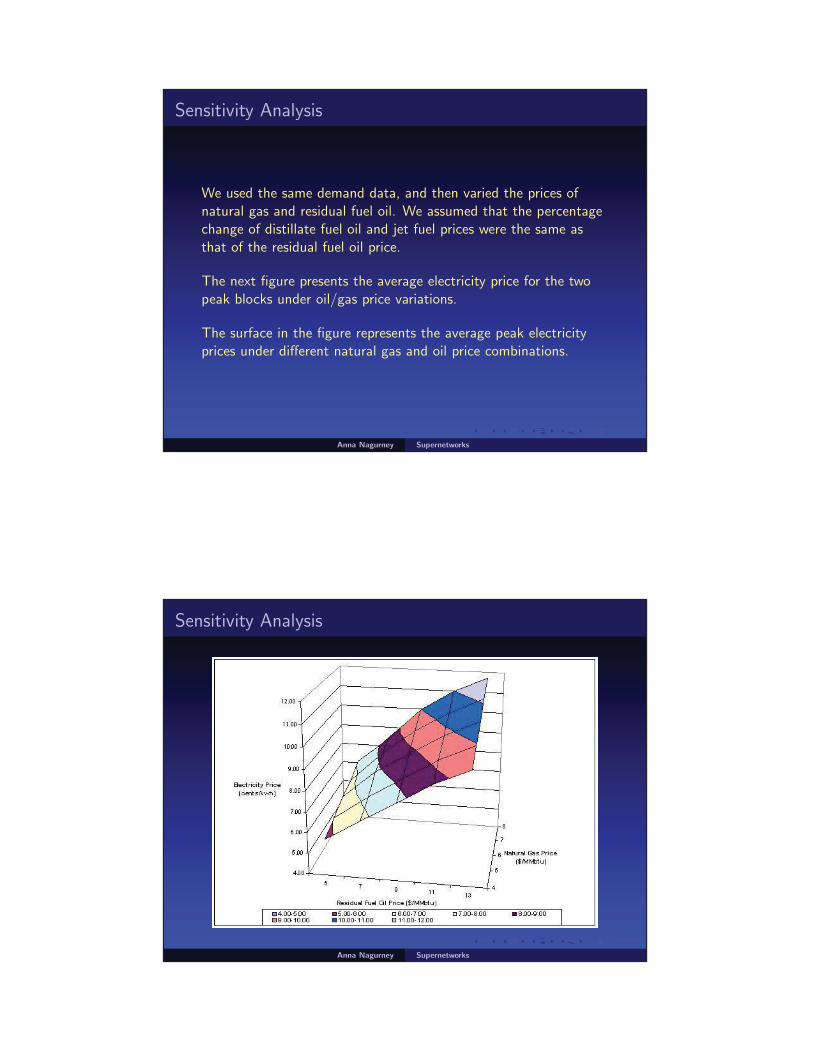
Sensitivity Analysis
We used the same demand data, and then varied the prices ofnatural gas and residual fuel oil. We assumed that the percentagechange of distillate fuel oil and jet fuel prices were the same asthat of the residual fuel oil price.
The next figure presents the average electricity price for the twopeak blocks under oil/gas price variations.
The surface in the figure represents the average peak electricityprices under different natural gas and oil price combinations.
Anna Nagurney Supernetworks
Sensitivity Analysis
Anna Nagurney Supernetworks
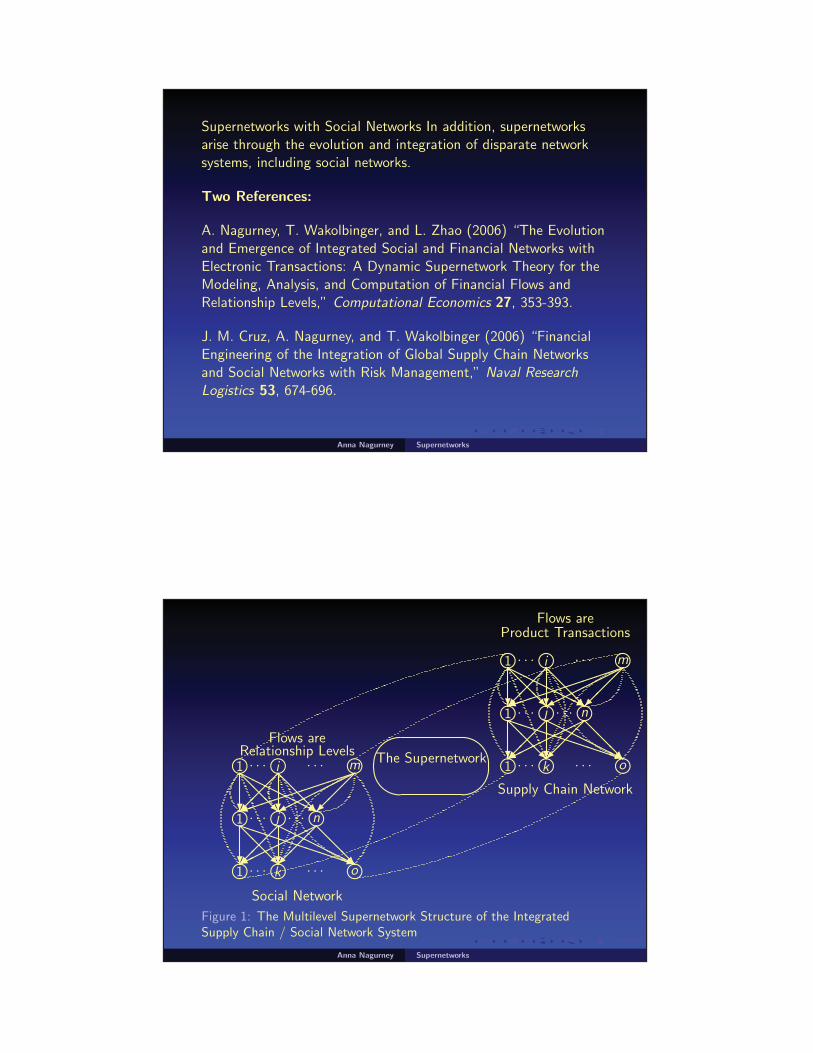
Supernetworks with Social Networks In addition, supernetworksarise through the evolution and integration of disparate networksystems, including social networks.
Two References:
A. Nagurney, T. Wakolbinger, and L. Zhao (2006) “The Evolutionand Emergence of Integrated Social and Financial Networks withElectronic Transactions: A Dynamic Supernetwork Theory for theModeling, Analysis, and Computation of Financial Flows andRelationship Levels,” Computational Economics 27, 353-393.
J. M. Cruz, A. Nagurney, and T. Wakolbinger (2006) “FinancialEngineering of the Integration of Global Supply Chain Networksand Social Networks with Risk Management,” Naval ResearchLogistics 53, 674-696.
Anna Nagurney Supernetworks
Social Network
�1 �· · · j · · · �n
Flows areRelationship Levels�1 · · · �i · · · �m
�1 �· · · k · · · �o�
��
��
�������
��
�� �
��
��
����������
�������
��
��
�
��
��
����������
��
�� �
�������
�������
��
��
��
��
��
The Supernetwork
Supply Chain Network
�1 �· · · j · · · �n
Flows areProduct Transactions�1 �· · · i · · · �m
�1 �· · · k · · · �o�
��
��
�������
��
���
��
��
����������
�������
��
��
�
��
��
����������
��
���
�������
�������
��
��
��
��
Figure 1: The Multilevel Supernetwork Structure of the IntegratedSupply Chain / Social Network System
Anna Nagurney Supernetworks

Social Network
�1 �· · · j · · · �n
Flows areRelationship Levels�1 · · · �i · · · �m
�1 �· · · k · · · �o�
��
��
�������
��
�� �
��
��
����������
�������
��
��
�
��
��
����������
��
�� �
�������
�������
��
��
��
���
��
The Supernetwork
Financial Networkwith Intermediation
�1 �· · · j · · · �n �n+1
Flows areFinancial Transactions�1 �· · · i · · · �m
�1 �· · · k · · · �o��
��
��
�������
��
���
��
��
����������
�������
��
��
�
��
��
����������
��
���
�������
�������
��
��
��
��
����������
��������
Figure 2: The Multilevel Supernetwork Structure of the IntegratedFinancial Network / Social Network System
Anna Nagurney Supernetworks
Transportation Networks Needed Also in Disasters
Networks are the fundamental critical infrastructure for themovement of people and goods in our globalized NetworkEconomy.
Transportation networks also serve as the primary conduit forrescue, recovery, and reconstruction in disasters.
Anna Nagurney Supernetworks
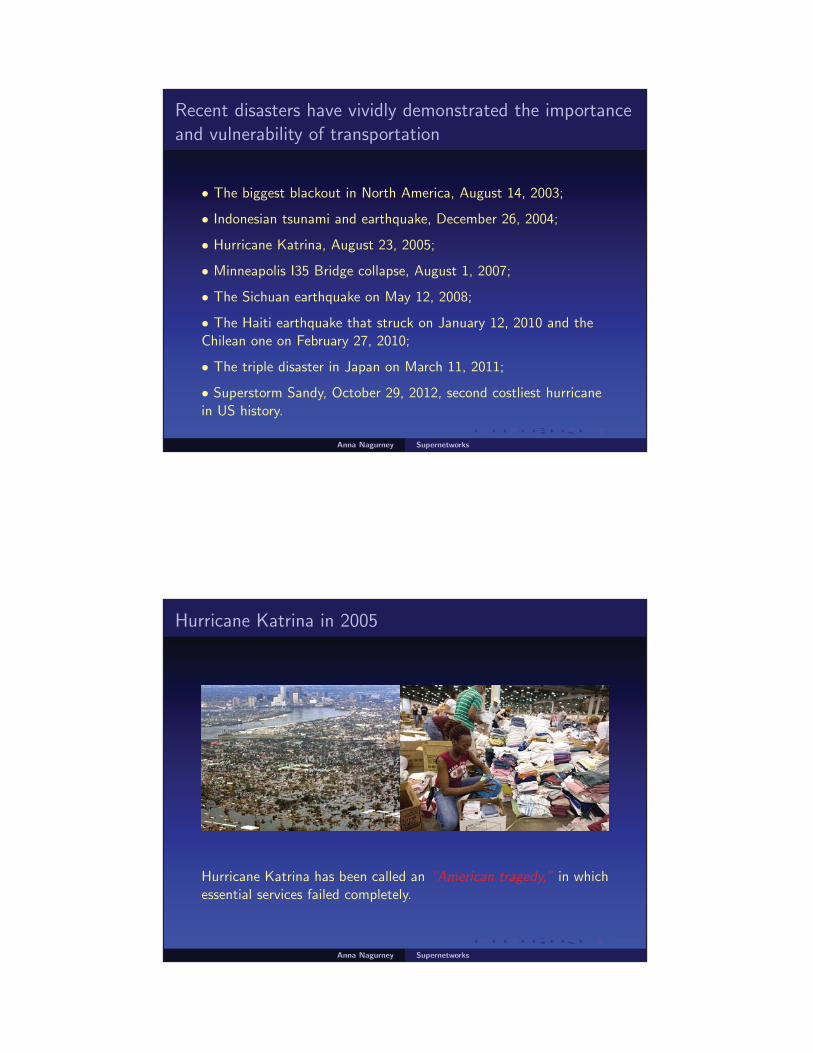
Recent disasters have vividly demonstrated the importanceand vulnerability of transportation
• The biggest blackout in North America, August 14, 2003;
• Indonesian tsunami and earthquake, December 26, 2004;
• Hurricane Katrina, August 23, 2005;
• Minneapolis I35 Bridge collapse, August 1, 2007;
• The Sichuan earthquake on May 12, 2008;
• The Haiti earthquake that struck on January 12, 2010 and theChilean one on February 27, 2010;
• The triple disaster in Japan on March 11, 2011;
• Superstorm Sandy, October 29, 2012, second costliest hurricanein US history.
Anna Nagurney Supernetworks
Hurricane Katrina in 2005
Hurricane Katrina has been called an “American tragedy,” in whichessential services failed completely.
Anna Nagurney Supernetworks

The Haitian and Chilean Earthquakes
Anna Nagurney Supernetworks
The Triple Disaster in Japan on March 11, 2011
Now the world is reeling from the aftereffects of the triple disasterAnna Nagurney Supernetworks
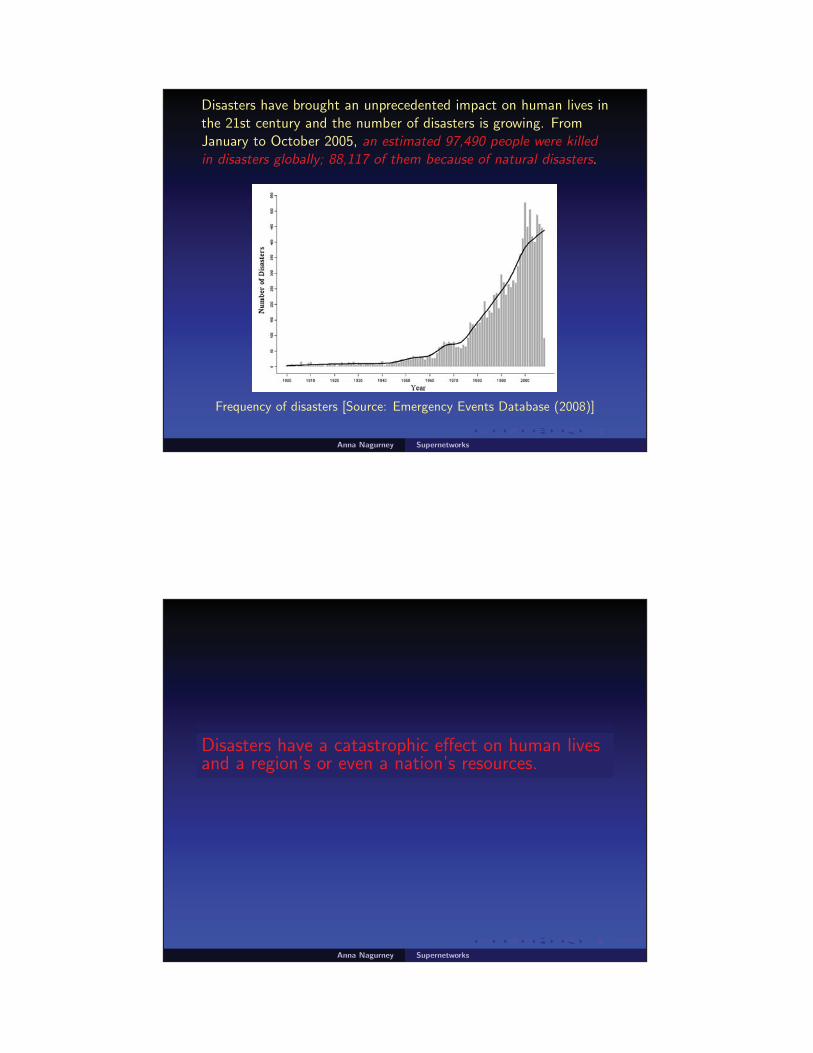
Disasters have brought an unprecedented impact on human lives inthe 21st century and the number of disasters is growing. FromJanuary to October 2005, an estimated 97,490 people were killedin disasters globally; 88,117 of them because of natural disasters.
Frequency of disasters [Source: Emergency Events Database (2008)]
Anna Nagurney Supernetworks
Disasters have a catastrophic effect on human livesand a region’s or even a nation’s resources.
Anna Nagurney Supernetworks
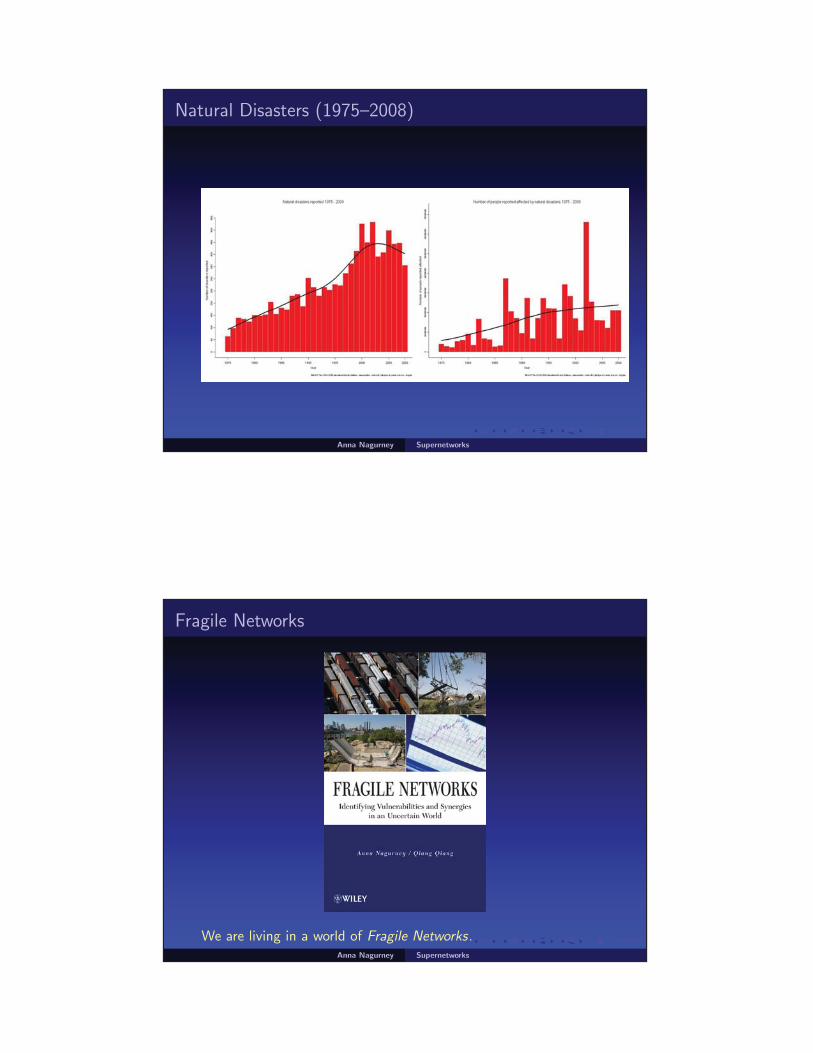
Natural Disasters (1975–2008)
Anna Nagurney Supernetworks
Fragile Networks
We are living in a world of Fragile Networks.Anna Nagurney Supernetworks

Some of the Recent Literature on Network Vulnerability
� Latora and Marchiori (2001, 2002, 2004)
� Holme, Kim, Yoon and Han (2002)
� Taylor and Deste (2004)
� Murray-Tuite and Mahmassani (2004)
� Chassin and Posse (2005)
� Barrat, Barthlemy and Vespignani (2005)
� Sheffi (2005)
� DallAsta, Barrat, Barthlemy and Vespignani (2006)
� Jenelius, Petersen and Mattson (2006, 2012)
� Taylor and DEste (2007)
� Nagurney and Qiang (2007, 2008, 2009)
� Qiang and Nagurney (2012)
� Qiang, Nagurney, and Dong (2009)
� Barker, Nicholson, Ramirez-Marquez (2015)
Anna Nagurney Supernetworks
Network Centrality Measures
� Barrat et al. (2004, pp. 3748), The identification of the mostcentral nodes in the system is a major issue in networkcharacterization.
� Centrality Measures for Non-Weighted Networks• Degree, betweenness (node and edge), closeness (Freeman(1979), Girvan and Newman (2002))• Eigenvector centrality (Bonacich (1972))• Flow centrality (Freeman, Borgatti and White (1991))• Betweenness centrality using flow (Izquierdo and Hanneman(2006))• Random-work betweenness, Current-flow betweenness(Newman and Girvan (2004))
� Centrality Measures for Weighted Networks (Very Few)• Weighted betweenness centrality (Dall’Asta et al. (2006))• Network efficiency measure (Latora-Marchiori (2001))
Anna Nagurney Supernetworks

Which Nodes and Links Really Matter?
Anna Nagurney Supernetworks
The Nagurney and Qiang (N-Q) Network Efficiency /Performance Measure
Definition: A Unified Network Performance MeasureThe network performance/efficiency measure, E(G, d), for a givennetwork topology G and the equilibrium (or fixed) demand vectord, is:
E = E(G, d) =
∑w∈W
dwλw
nW,
where recall that nW is the number of O/D pairs in the network,and dw and λw denote, for simplicity, the equilibrium (or fixed)demand and the equilibrium disutility for O/D pair w, respectively.
Anna Nagurney Supernetworks

The Importance of Nodes and Links
Definition: Importance of a Network ComponentThe importance of a network component g ∈ G, I (g), is measuredby the relative network efficiency drop after g is removed from thenetwork:
I (g) =�EE =
E(G, d) − E(G − g , d)
E(G, d)
where G − g is the resulting network after component g is removedfrom network G.
Anna Nagurney Supernetworks
The Approach to Identifying the Importance of NetworkComponents
The elimination of a link is treated in the N-Q network efficiencymeasure by removing that link while the removal of a node ismanaged by removing the links entering and exiting that node.
In the case that the removal results in no path connecting an O/Dpair, we simply assign the demand for that O/D pair to an abstractpath with a cost of infinity.
The N-Q measure is well-defined even in the case ofdisconnected networks.
Anna Nagurney Supernetworks

The Advantages of the N-Q Network Efficiency Measure
• The measure captures demands, flows, costs, and behavior ofusers, in addition to network topology.
• The resulting importance definition of network components isapplicable and well-defined even in the case of disconnectednetworks.
• It can be used to identify the importance (and ranking) of eithernodes, or links, or both.
• It can be applied to assess the efficiency/performance of a widerange of network systems, including financial systems and supplychains under risk and uncertainty.
• It is applicable also to elastic demand networks.
• It is applicable to dynamic networks, including the Internet.
Anna Nagurney Supernetworks
Some Applications of the N-Q Measure
Anna Nagurney Supernetworks

The Sioux Falls Network
Figure 3: The Sioux Falls network with 24 nodes, 76 links, and 528 O/Dpairs of nodes.
Anna Nagurney Supernetworks
Importance of Links in the Sioux Falls Network
The computed network efficiency measure E for the Sioux Fallsnetwork is E = 47.6092. Links 27, 26, 1, and 2 are the mostimportant links, and hence special attention should be paid toprotect these links accordingly, while the removal of links 13, 14,15, and 17 would cause the least efficiency loss.
Figure 4: The Sioux Falls network link importance rankingsAnna Nagurney Supernetworks
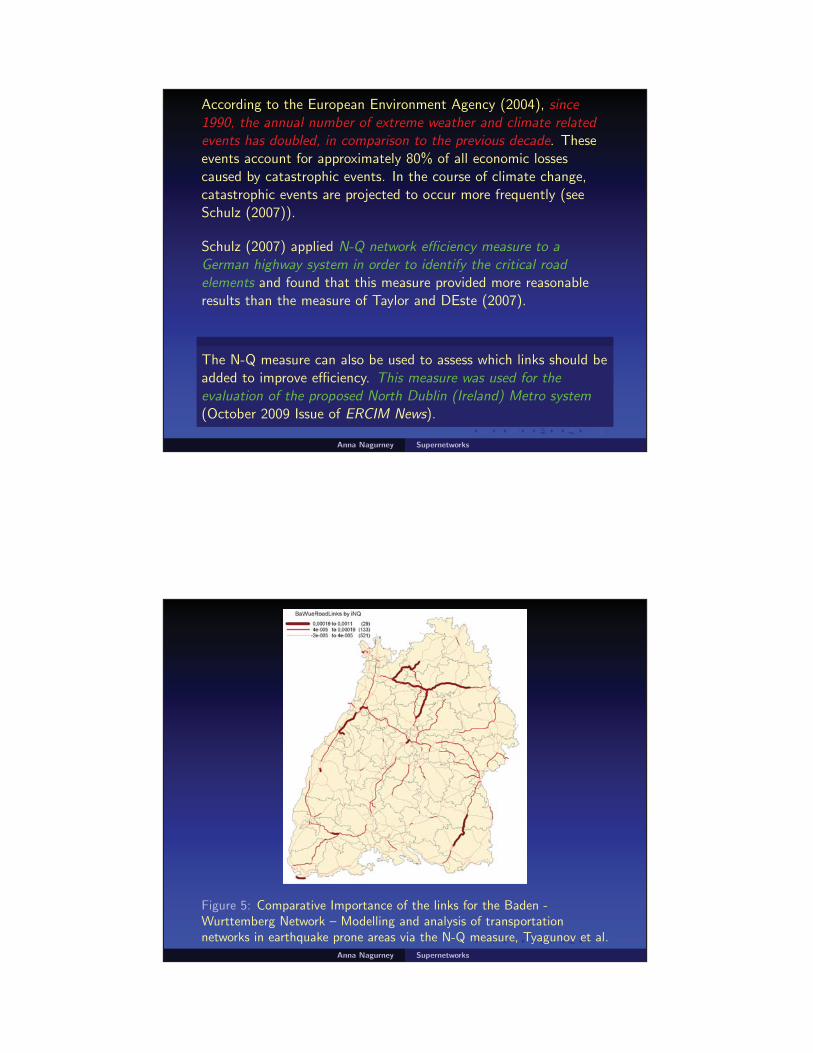
According to the European Environment Agency (2004), since1990, the annual number of extreme weather and climate relatedevents has doubled, in comparison to the previous decade. Theseevents account for approximately 80% of all economic lossescaused by catastrophic events. In the course of climate change,catastrophic events are projected to occur more frequently (seeSchulz (2007)).
Schulz (2007) applied N-Q network efficiency measure to aGerman highway system in order to identify the critical roadelements and found that this measure provided more reasonableresults than the measure of Taylor and DEste (2007).
The N-Q measure can also be used to assess which links should beadded to improve efficiency. This measure was used for theevaluation of the proposed North Dublin (Ireland) Metro system(October 2009 Issue of ERCIM News).
Anna Nagurney Supernetworks
Figure 5: Comparative Importance of the links for the Baden -Wurttemberg Network – Modelling and analysis of transportationnetworks in earthquake prone areas via the N-Q measure, Tyagunov et al.
Anna Nagurney Supernetworks
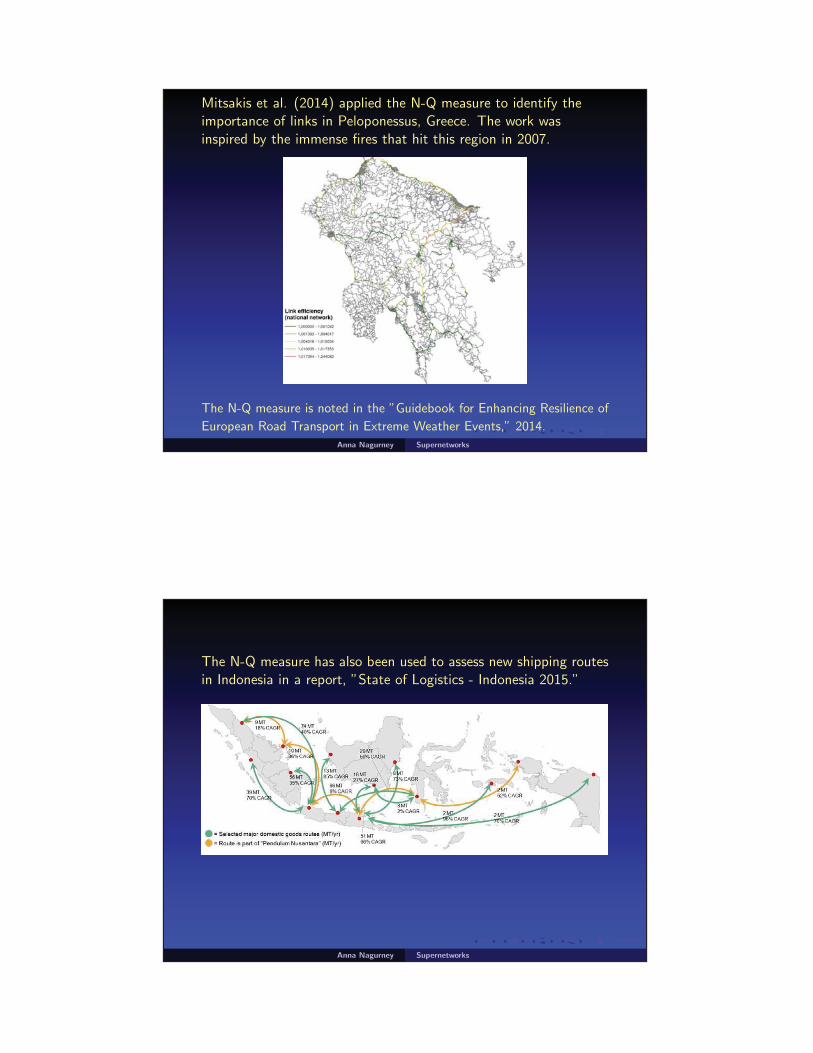
Mitsakis et al. (2014) applied the N-Q measure to identify theimportance of links in Peloponessus, Greece. The work wasinspired by the immense fires that hit this region in 2007.
The N-Q measure is noted in the ”Guidebook for Enhancing Resilience of
European Road Transport in Extreme Weather Events,” 2014.
Anna Nagurney Supernetworks
The N-Q measure has also been used to assess new shipping routesin Indonesia in a report, ”State of Logistics - Indonesia 2015.”
Anna Nagurney Supernetworks

From Transportation Networks to the Internet
Anna Nagurney Supernetworks
Network Efficiency Measure for Dynamic Networks -Continuous Time
The network efficiency for the network G with time-varying demandd for t ∈ [0,T ], denoted by E(G, d , T ), is defined as follows:
E(G, d , T ) =
∫ T0 [
∑w∈W
dw (t)λw (t) ]/nW dt
T.
Note that the above measure is the average network performanceover time of the dynamic network.
Anna Nagurney Supernetworks

Network Efficiency Measure for Dynamic Networks -Discrete Time
Let d1w , d2
w , ..., dHw denote demands for O/D pair w in H discrete time
intervals, given, respectively, by: [t0, t1], (t1, t2], ..., (tH−1, tH ], wheretH ≡ T . We assume that the demand is constant in each such timeinterval for each O/D pair. Moreover, we denote the correspondingminimal costs for each O/D pair w at the H different time intervals by:λ1
w , λ2w , ..., λH
w . The demand vector d , in this special discrete case, is avector in RnW×H .
Dynamic Network Efficiency: Discrete Time Version
The network efficiency for the network (G, d) over H discrete timeintervals:[t0, t1], (t1, t2], ..., (tH−1, tH ], where tH ≡ T, and with the respectiveconstant demands:d1
w , d2w , ..., dH
w for all w ∈ W is defined as follows:
E(G, d , tH = T ) =
∑Hi=1[(
∑w∈W
diw
λiw)(ti − ti−1)/nW ]
tH.
Anna Nagurney Supernetworks
Special Case
Assume that dw (t) = dw , for all O/D pairs w ∈ W and fort ∈ [0,T ]. Then, the dynamic network efficiency measure collapsesto the Nagurney and Qiang measure:
E =1
nW
∑w∈W
dw
λw.
Anna Nagurney Supernetworks

Importance of a Network Component
The importance of network component g of network G withdemand d over time horizon T is defined as follows:
I (g , d ,T ) =E(G, d ,T ) − E(G − g , d , T )
E(G, d , T )
where E(G − g , d , T ) is the dynamic network efficiency aftercomponent g is removed.
Anna Nagurney Supernetworks
The U-O Solution of the Braess Network with Added Link (Path)and Time-Varying Demands Solved as an Evolutionary VariationalInequality In a Model of the Internet (Nagurney, Daniele, andParkes (2007)).
Anna Nagurney Supernetworks
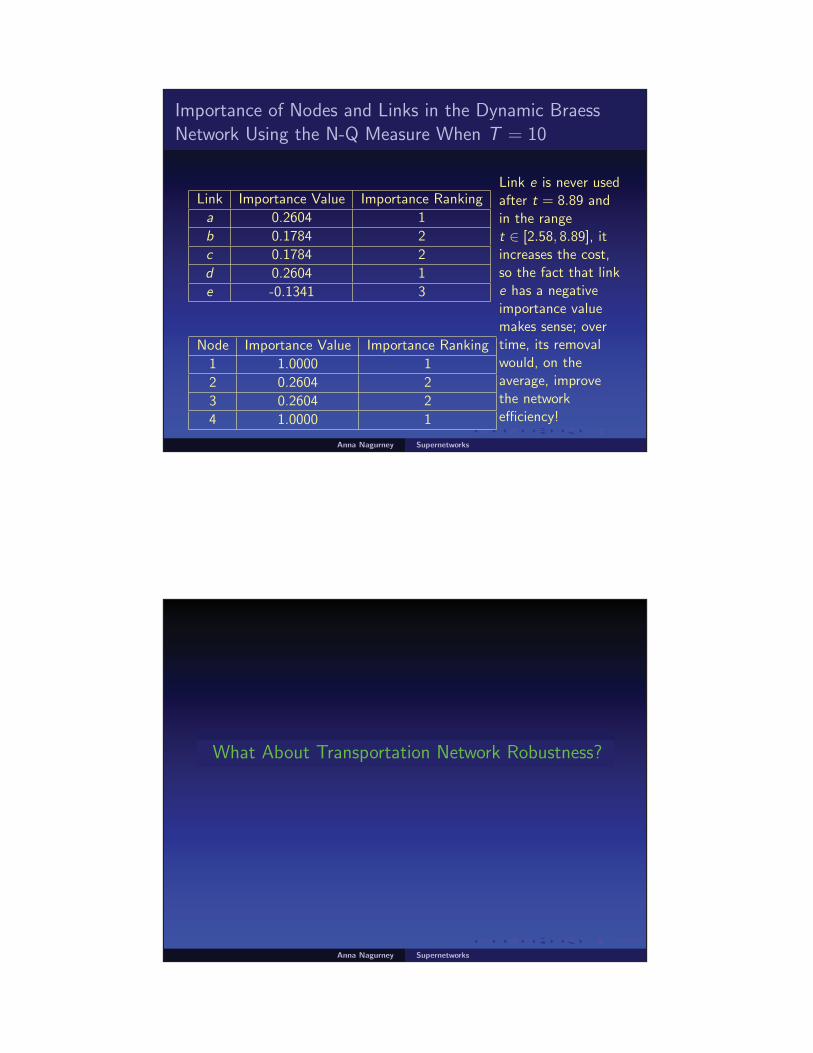
Importance of Nodes and Links in the Dynamic BraessNetwork Using the N-Q Measure When T = 10
Link Importance Value Importance Ranking
a 0.2604 1
b 0.1784 2
c 0.1784 2
d 0.2604 1
e -0.1341 3
Node Importance Value Importance Ranking
1 1.0000 1
2 0.2604 2
3 0.2604 2
4 1.0000 1
Link e is never usedafter t = 8.89 andin the ranget ∈ [2.58, 8.89], itincreases the cost,so the fact that linke has a negativeimportance valuemakes sense; overtime, its removalwould, on theaverage, improvethe networkefficiency!
Anna Nagurney Supernetworks
What About Transportation Network Robustness?
Anna Nagurney Supernetworks

The concept of system robustness has been studied in engineeringand computer science. IEEE (1990) defined robustness as “thedegree to which a system or component can function correctly inthe presence of invalid inputs or stressful environmentalconditions.”
Gribble (2001) defined system robustness as “the ability of asystem to continue to operate correctly across a wide range ofoperational conditions, and to fail gracefully outside of thatrange.”
Ali et al. (2003) considered an allocation mapping to be robust ifit “guarantees the maintenance of certain desired systemcharacteristics despite fluctuations in the behavior of itscomponent parts or its environment.”
Schillo et al. (2001) argued that robustness has to be studied “inrelation to some definition of performance measure.”
Holmgren (2007) stated: “Robustness signifies that the system willretain its system structure (function) intact (remain unchanged ornearly unchanged) when exposed to perturbations.”
Anna Nagurney Supernetworks
Definition: Network Robustness Measure UnderUser-Optimizing Decision-Making BehaviorThe robustness measure Rγ for a network G with the vector ofuser link cost functions c, the vector of link capacities u, thevector of demands d (either fixed or elastic) is defined as therelative performance retained under a given uniform capacityretention ratio γ with γ ∈ (0, 1] so that the new capacities aregiven by γu. Its mathematical definition is
Rγ = R(G, c , γ, u) =Eγ
E × 100%
where E and Eγ are the network performance measures with theoriginal capacities and the remaining capacities, respectively.
For example, if γ = .8, this means that the user link cost functionsnow have the link capacities given by .8ua for all links a ∈ L; ifγ = .4, then the link capacities become .4ua for all links a ∈ L,and so on.
Anna Nagurney Supernetworks

According to this Definition, a network under a given level ofcapacity retention or deterioration is considered to be robust if thenetwork performance stays close to the original level.
We can also study network robustness from the perspective ofnetwork capacity enhancement.
Such an analysis provides insights into link investments. In thiscase γ ≥ 1 and, for definiteness (and as suggested in Nagurney andQiang (2009)), we refer to the network robustness measure in thiscontext as the “capacity increment ration.”
Anna Nagurney Supernetworks
An Application to the Anaheim Network
Each link of the Anaheim network has a link travel cost functionalform of the BPR form. There are 461 nodes, 914 links, and 1, 406O/D pairs in the Anaheim network.
Figure 6: The Anaheim network
Anna Nagurney Supernetworks

Figure 7: Robustness vs. Capacity Retention Ratio for the AnaheimNetwork
Anna Nagurney Supernetworks
Figure 8: Robustness vs. Capacity Increment Ratio for the AnaheimNetwork
Anna Nagurney Supernetworks
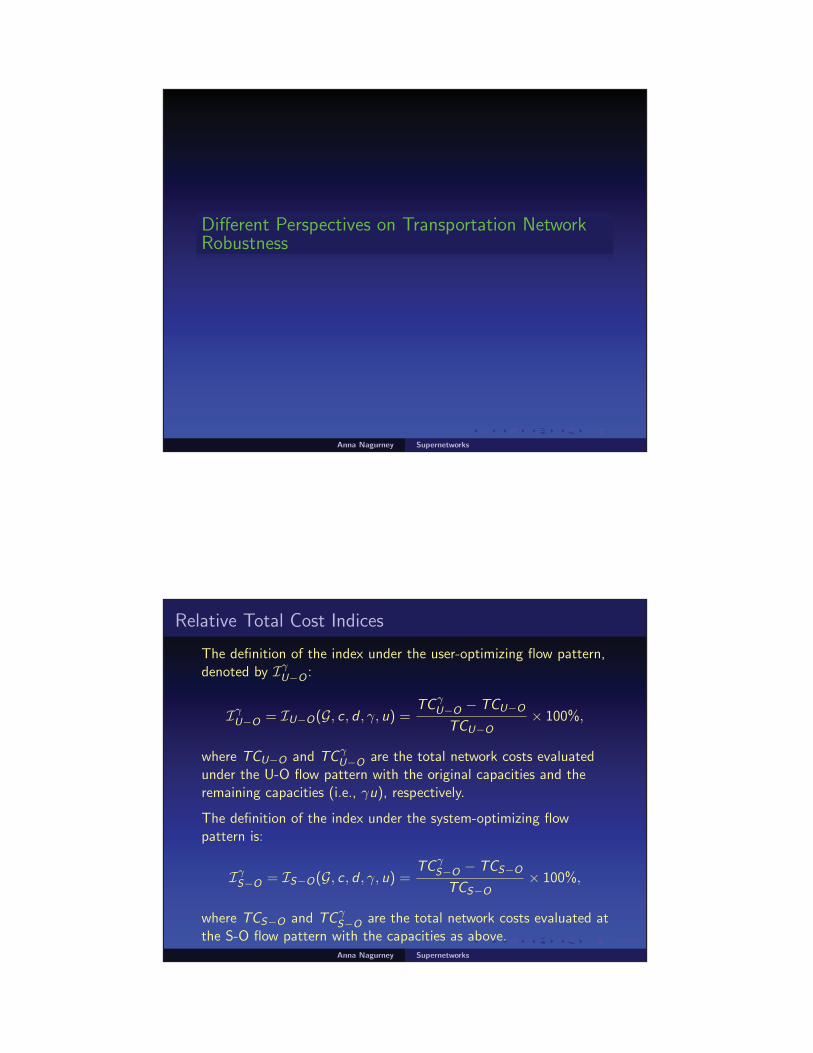
Different Perspectives on Transportation NetworkRobustness
Anna Nagurney Supernetworks
Relative Total Cost Indices
The definition of the index under the user-optimizing flow pattern,denoted by Iγ
U−O :
IγU−O = IU−O(G, c , d , γ, u) =
TCγU−O − TCU−O
TCU−O× 100%,
where TCU−O and TCγU−O are the total network costs evaluated
under the U-O flow pattern with the original capacities and theremaining capacities (i.e., γu), respectively.
The definition of the index under the system-optimizing flowpattern is:
IγS−O = IS−O(G, c , d , γ, u) =
TCγS−O − TCS−O
TCS−O× 100%,
where TCS−O and TCγS−O are the total network costs evaluated at
the S-O flow pattern with the capacities as above.Anna Nagurney Supernetworks

From these definitions, a network, under a given capacityretention/deterioration ratio γ (and either S-O or U-O behavior) isconsidered to be robust if the index Iγ is low.
This means that the relative total cost does not change much;hence the network may be viewed as being more robust than if therelative total cost were large.
Anna Nagurney Supernetworks
We can also study the relative total cost improvement aftercapacity enhancement. In that case, because the relative total costsavings need to be computed, we reverse the order of subtractionin the previous expressions with γ ≥ 1. Furthermore, γ is definedas the “capacity increment ratio.”
Therefore, the larger the relative total cost index is, the greater theexpected total cost savings for a capacity enhancement plan for aspecific γ.
Anna Nagurney Supernetworks
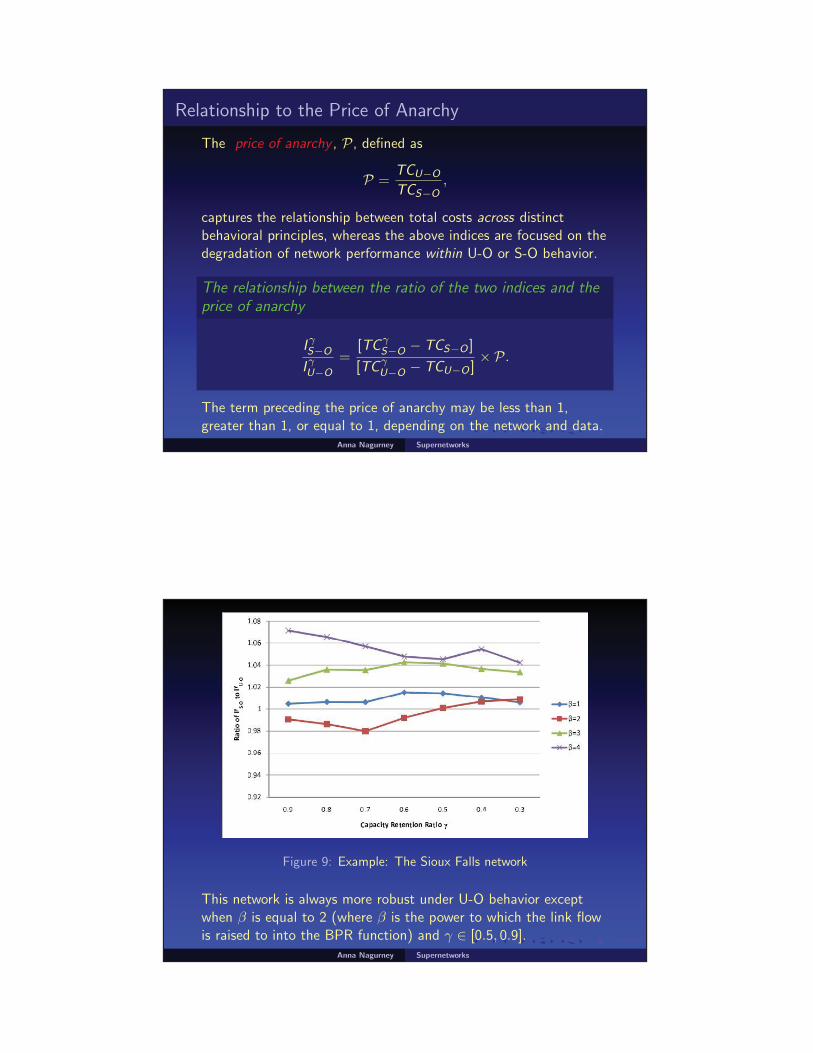
Relationship to the Price of Anarchy
The price of anarchy , P, defined as
P =TCU−O
TCS−O,
captures the relationship between total costs across distinctbehavioral principles, whereas the above indices are focused on thedegradation of network performance within U-O or S-O behavior.
The relationship between the ratio of the two indices and theprice of anarchy
I γS−O
I γU−O
=[TCγ
S−O − TCS−O ]
[TCγU−O − TCU−O ]
× P.
The term preceding the price of anarchy may be less than 1,greater than 1, or equal to 1, depending on the network and data.
Anna Nagurney Supernetworks
Figure 9: Example: The Sioux Falls network
This network is always more robust under U-O behavior exceptwhen β is equal to 2 (where β is the power to which the link flowis raised to into the BPR function) and γ ∈ [0.5, 0.9].
Anna Nagurney Supernetworks

Figure 10: Example: The Anaheim network
This network is more robust under the S-O solution when thecapacity retention ratio γ is above .3.
Anna Nagurney Supernetworks
Which Nodes and Links Matter Environmentally?
Anna Nagurney Supernetworks
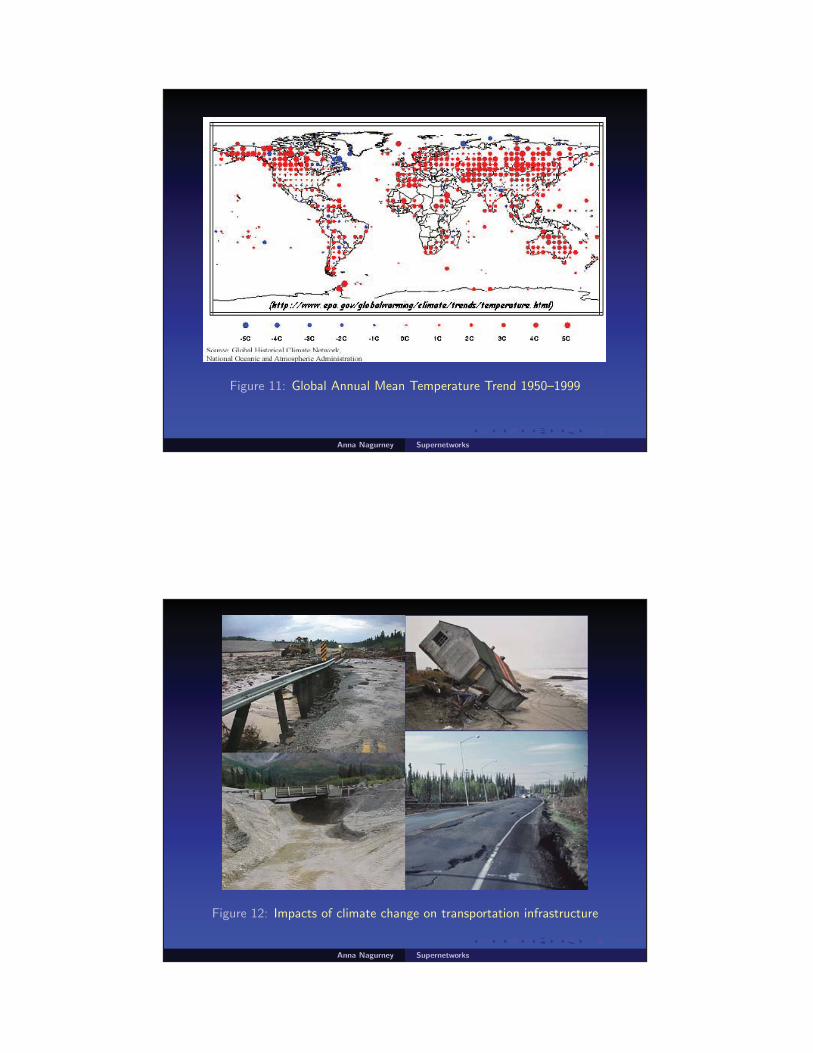
Figure 11: Global Annual Mean Temperature Trend 1950–1999
Anna Nagurney Supernetworks
Figure 12: Impacts of climate change on transportation infrastructure
Anna Nagurney Supernetworks

We have also extended our measures to constructenvironmental impact assessment indices andenvironmental link importance identifiers undereither U-O or S-O behaviors.
Anna Nagurney Supernetworks
What About Disaster Relief?
Anna Nagurney Supernetworks
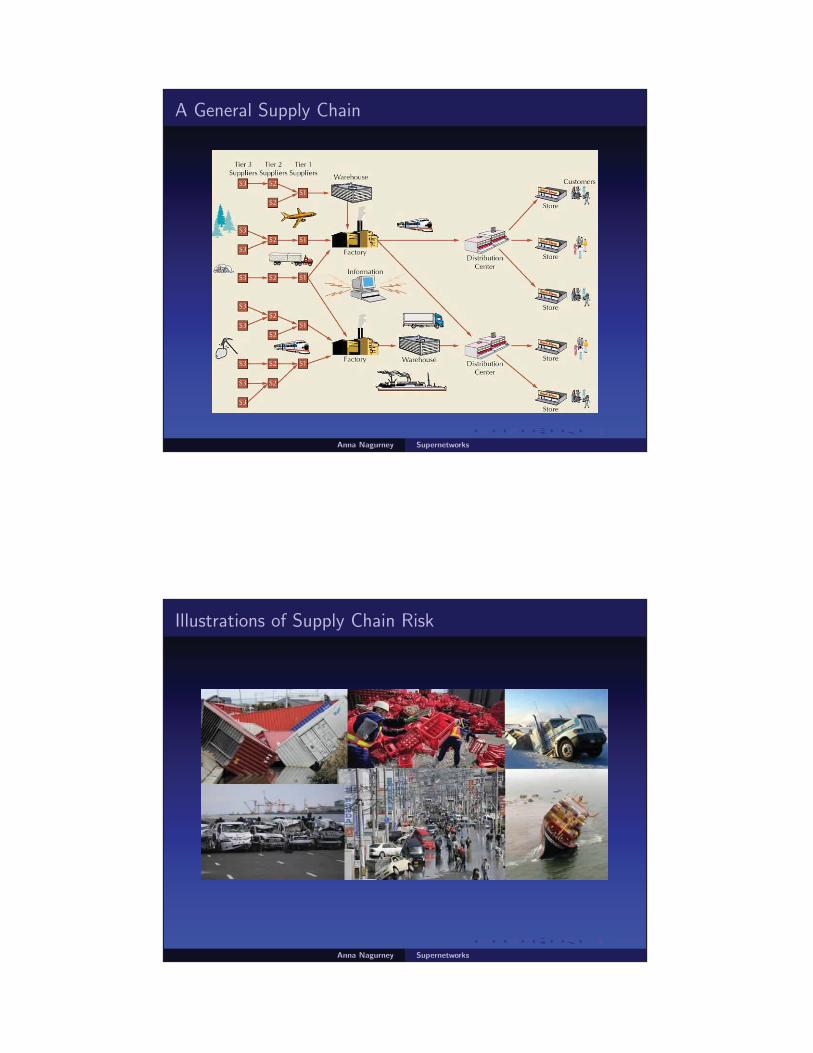
A General Supply Chain
Anna Nagurney Supernetworks
Illustrations of Supply Chain Risk
Anna Nagurney Supernetworks

Disaster Relief
In the US alone, the average number of disasters per year thatexceeded a cost of 1 billion dollars in damages increased from 3.6in the 2001-2005 period to 5.8 in 2006-2010 (NOAA).
Anna Nagurney Supernetworks
Disaster Relief
Anna Nagurney Supernetworks

Humanitarian Supply Chains
The supply chain is a critical component not only of corporationsbut also of humanitarian organizations and their logisticaloperations.
At least 50 cents of each dollar’s worth of food aid is spent ontransport, storage and administrative costs.
Anna Nagurney Supernetworks
Vulnerability of Humanitarian Supply Chains
Extremely poor logistical infrastructures: Modes of transportationinclude trucks, barges, donkeys in Afghanistan, and elephants inCambodia.
To ship the humanitarian goods to the affected area in the first 72hours after disasters is crucial. The successful execution is not justa question of money but a difference between life and death.
Corporations expertise with logistics could help public responseefforts for nonprofit organizations.
In the humanitarian sector, organizations are 15 to 20 yearsbehind, as compared to the commercial arena, regarding supplychain network development.
Anna Nagurney Supernetworks
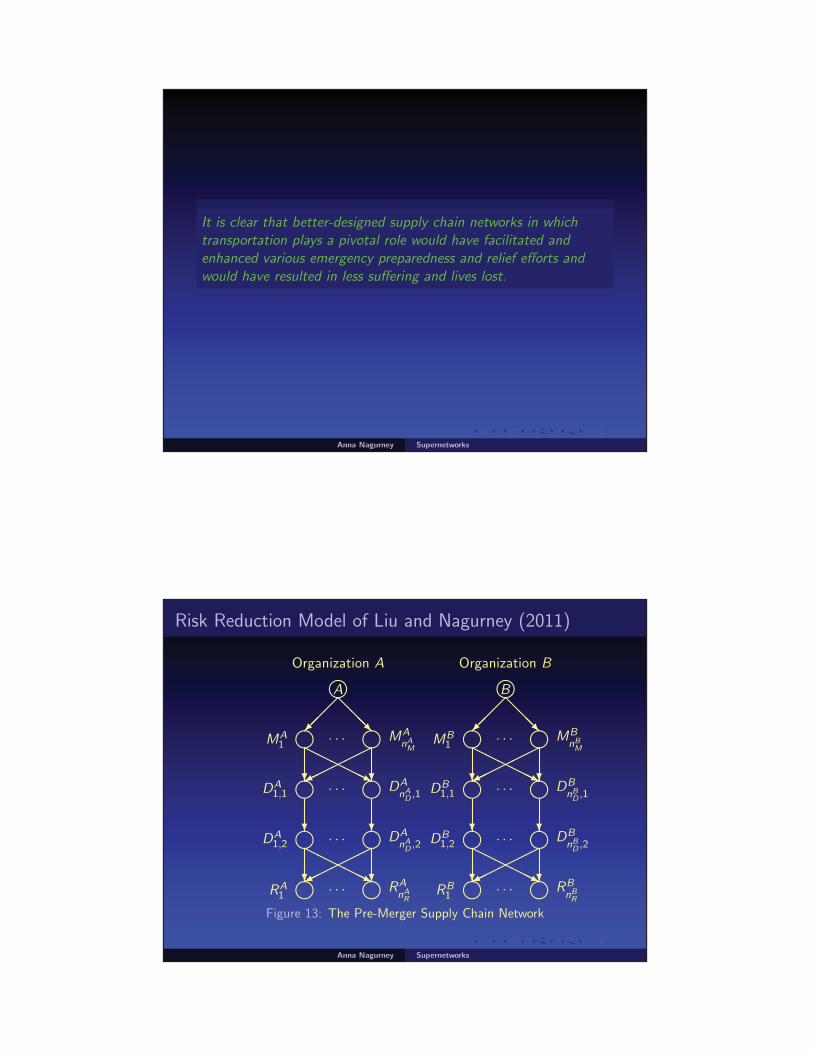
It is clear that better-designed supply chain networks in whichtransportation plays a pivotal role would have facilitated andenhanced various emergency preparedness and relief efforts andwould have resulted in less suffering and lives lost.
Anna Nagurney Supernetworks
Risk Reduction Model of Liu and Nagurney (2011)
RA1
� · · · �RAnA
RRB
1� · · · �RB
nBR
�
��������
������� �
��������
�������
DA1,2
� · · · �DAnA
D ,2 DB1,2
� · · · �DBnB
D ,2
� � � �
DA1,1
� · · · �DAnA
D ,1 DB1,1
� · · · �DBnB
D ,1
�
��������
������� �
��������
�������
MA1
� · · · �MAnA
MMB
1� · · · �MB
nBM
����
����
����
����
�A �BOrganization A Organization B
Figure 13: The Pre-Merger Supply Chain Network
Anna Nagurney Supernetworks

RA1
� · · · �RAnA
RRB
1� · · · �RB
nBR
�
�������
������
����������
������
��������� �
������
DA1,2
� · · · �DAnA
D ,2 DB1,2
� · · · �DBnB
D ,2
� � � �
DA1,1
� · · · �DAnA
D ,1 DB1,1
� · · · �DBnB
D ,1
�
�������
������
����������
������
��������� �
������
MA1
� · · · �MAnA
MMB
1� · · · �MB
nBM
����
����
����
����
�A �B�������
�������
�0Organization A Organization B
Figure 14: Organizations A and B Merge or “Team Up”
Anna Nagurney Supernetworks
Integrated Disaster Relief Model of Nagurney, Masoumi,and Yu (2015)
�1Organization
��
��...�
���
ProcurementLinks
�
�
�C1
...
�CnC
��������
...
��������
TransportationLinks
�S1,1
...
�SnS ,1
�
...
�
StorageLinks
�S1,2
...
�SnS ,2
���
��
��
��
...
����
��
���
TransportationLinks
�
A1
...
�
AnA
�
...
�
ProcessingLinks
�
B1
...
�
BnB
���������
...
�
�������
DistributionLinks
�
R1
...
�
RnR
DemandPoints
Figure 15: Network Topology of the Integrated Disaster Relief SupplyChain
Anna Nagurney Supernetworks

Summary, Conclusions, and Suggestions for Future Research
Anna Nagurney Supernetworks
� We discussed the new era of supernetworks.
� We emphasized the importance of capturing behavior innetwork modeling, analysis, and design and various paradoxes.
� We presented the Nagurney-Qiang network performance /efficiency measure and how it has been applied to identify theimportance and rankings of nodes and links along with variousapplications.
� We discussed definitions of network robustness and measuresfor the evaluation from both S-O and U-O perspectives.
� We detailed network models for disaster relief andhumanitarian operations.
Anna Nagurney Supernetworks

� We have done extensive research on supply chains anddisruption management and have also conducted research onFuture Internet Architectures as part of a large NSF project.
� We expect that future research will include supernetworkdesign for robustness and resiliency.
Anna Nagurney Supernetworks
THANK YOU!
For reference materials, see: http://supernet.som.umass.edu
Anna Nagurney Supernetworks