comparison of worldwide first-ever-in-a-lifetime (fes) stroke incidence risk: implications for...
TRANSCRIPT

Comparison of worldwide First-ever-in-a-lifetime (FES) stroke incidence risk: implications for
current and future stroke incidence
Syme, P.D., Byrne, A., Chen, R., Finlayson, A.

Aims To determine the contribution of stroke incidence risk to crude incidence
Methods 18 worldwide incidence studies were compared with the Scottish Borders stroke study (SBSS) Studies were selected if they fulfilled “ideal” incidence criteria and data was available on first-ever stroke (FES) numbers, the population denominator for each age group and the study duration

Methods cont. Logistic regression was used along with age standardisation to estimate risk
An SBSS crude incidence prediction model was developed
The SBSS model was tested on the Scottish National dataset (110,000,000 person years of risk) for FES and admissions. The model was then tested on Australian National dataset for stroke admissions

Comparison of age standardisation and odds ratio estimation of age-adjusted risk
Res
idu a
ls (
Age
-adj
u ste
d in
c ide
nce
risk)

Worldwide risk of stroke (all ages)
Stu
dyNW England
Dijon London
ESPRO
All UKFredericksberg
Arcadia
Tees Aukland
SEPIVAC NEMESIS
OCSPPerth
RochesterBelluno
Inherred Valle D'Aosta
SoderhamnNovosibirsk
Age and sex-adjusted Odds Ratio (95% CI)
1.81.61.41.21.0.8.6.4
UK studies
SBSS
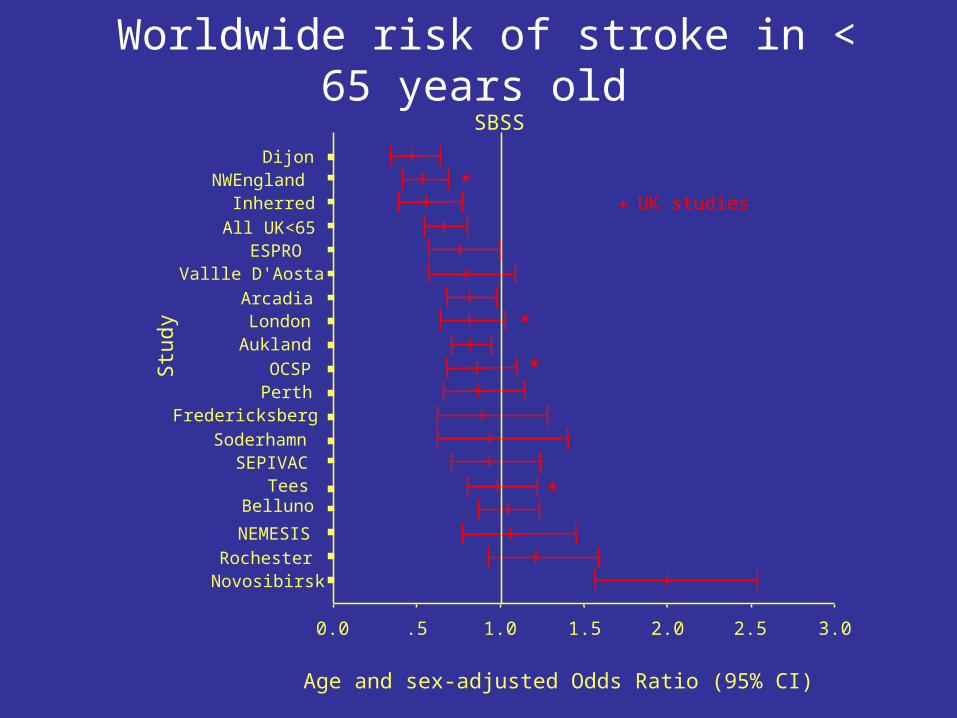
Worldwide risk of stroke in < 65 years old
Stu
dyDijon
NWEngland Inherred
All UK<65ESPRO
Vallle D'Aosta
Arcadia LondonAukland
OCSPPerth
Fredericksberg
Soderhamn SEPIVAC
Tees Belluno
NEMESIS
Rochester Novosibirsk
Age and sex-adjusted Odds Ratio (95% CI)
3.02.52.01.51.0.50.0
UK studies
SBSS

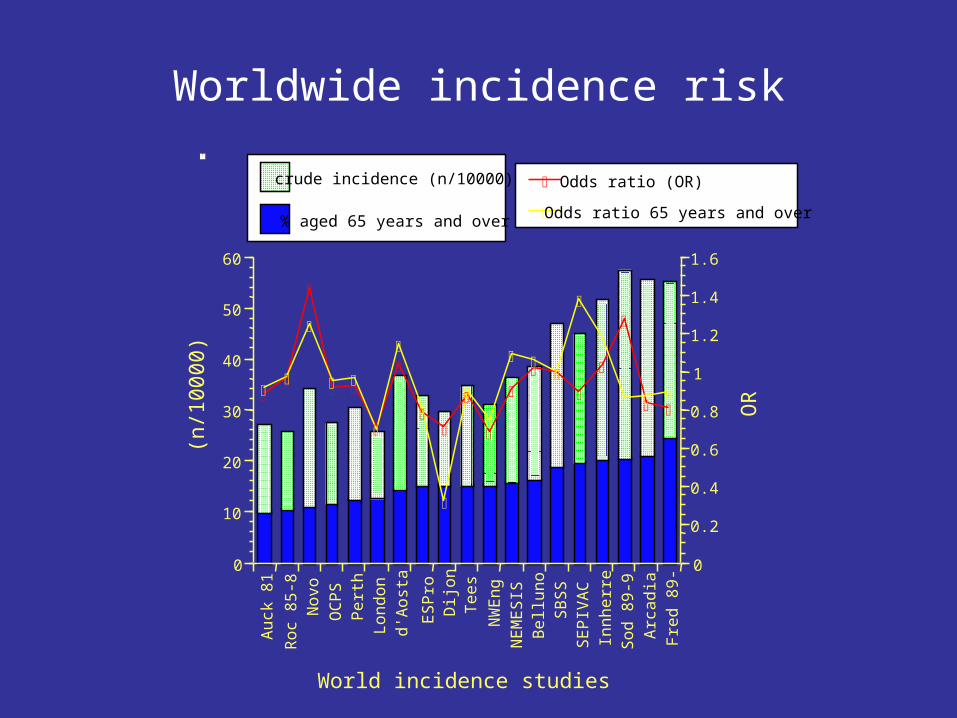
Worldwide incidence risk
Auc
k 81
Roc
85-
8N
ovo
OC
SP
Per
thLo
ndon
d'A
osta
ES
Pro
Dijo
nT
ees
NW
Eng
NE
ME
SIS
Bel
luno
SB
SS
SE
PIV
AC
Innh
erre
Sod
89-
9A
rcad
iaF
red
89-0
10
20
30
40
50
60
0
0.2
0.4
0.6
0.8
1
1.2
1.4
1.6
1.8
2
(n/1
0000
)
OR
World incidence studies
% aged 65 years and over
crude incidence (n/10000) Odds ratio (OR) Odds ratio <65
Worldwide incidence risk
Au
ck 8
1
Ro
c 8
5-8
No
vo
OC
PS
Pe
rth
Lo
nd
on
d'A
ost
a
ES
Pro
Dijo
nT
ee
s
NW
En
gN
EM
ES
ISB
ellu
no
SB
SS
SE
PIV
AC
Inn
he
rre
So
d 8
9-9
Arc
ad
ia
Fre
d 8
9-
0
10
20
30
40
50
60
0
0.2
0.4
0.6
0.8
1
1.2
1.4
1.6
(n/1
0000
)
OR
World incidence studies
% aged 65 years and over
crude incidence (n/10000) Odds ratio (OR)
Odds ratio 65 years and over

Change in incidence risk

Odds ratios
Res
idua
ls (
Age
-adj
uste
d in
cide
nce
risk)
Odds ratio estimation of age-adjusted risk

Scottish First-ever strokes
(SMR1) from 1981- 2000
Scottish First-ever stroke 1981-2000
percentage of the population >= 65 years old
18161412108
Sco
ttish
Firs
t-ev
er s
trok
e (n
)3000
2000
1000
0
-1000
Western Is
Tayside
Lothian
Lanark
Glas
Gramp
Forth V
Fife
D & G
Bord
A & A
A & C

SBSS estimation of first-ever stroke(SMR1 returns 1981-2000)
SBSS predicted first-ever stroke male or female
120010008006004002000
1600
1400
1200
1000
800
600
400
200
0
-200
Western Is
Tayside
Shetland
Orkney
Lothian
Lanark
Highland
Glas
Gramp
Forth V
Fife
D & G
Bord
A &A
A &C
TotalPopulationRsq = 0.9701
Firs
t-ev
er
stro
ke n
um
bers
(n)
Western Is
Tayside
Lothian
Lanark
Glas
Gramp
Forth V
Fife
D & G
Bord
A & A
A & C
Rsq=0.97

Scottish stroke admissions
(SMR1) from 1981- 2000 Scottish Stroke Admissions 1981-2000
percentage of the population >= 65 years old
18161412108
Sco
ttish
Str
oke
Adm
issi
ons
(n)
5000
4000
3000
2000
1000
0
-1000
Western Is
Tayside
Lothian
Lanark
Glas
Gramp
Forth V
Fife
D & G
Bord
A & A
A & C

SBSS estimation of admissions (SMR1 returns 1981-2000)
SBSS estimated First-ever stroke
3000200010000
Sco
ttish
Str
oke
Adm
issi
ons
(n)
4000
3000
2000
1000
0
Western Is
Tayside
Lothian
Lanark
Glas
Gramp
Forth V
Fife
D & G
Bord
A & A
A & C
Rsq= 0.97
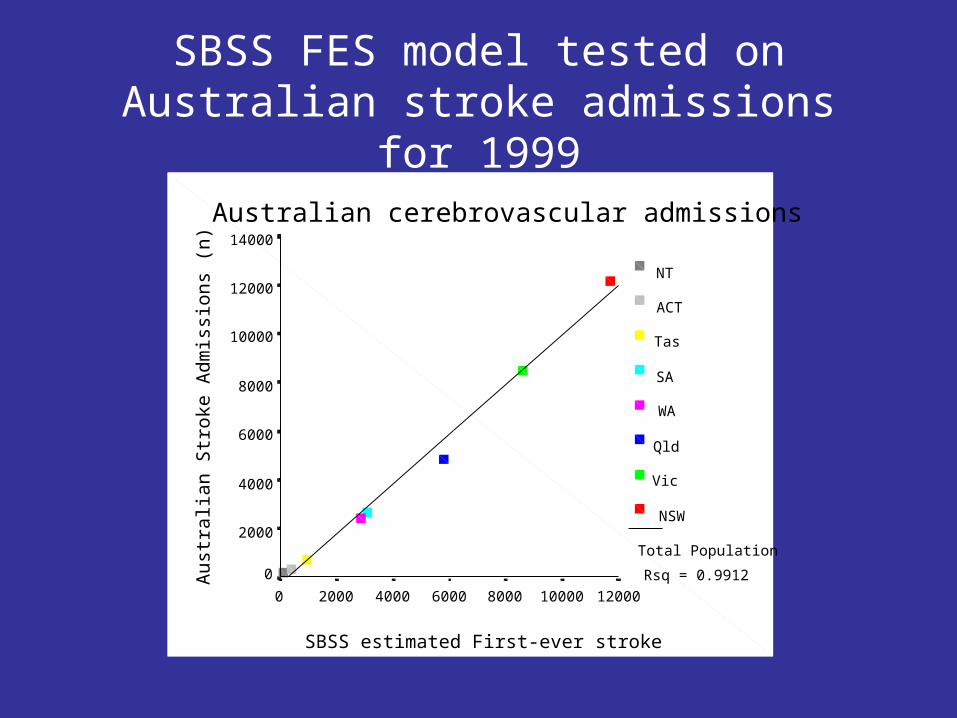
SBSS FES model tested on Australian stroke admissions for 1999
Australian cerebrovascular admissions
SBSS estimated First-ever stroke
120001000080006000400020000
Aus
tral
ian
Str
oke
Adm
issi
ons
(n)
14000
12000
10000
8000
6000
4000
2000
0
NT
ACT
Tas
SA
WA
Qld
Vic
NSW
Total Population
Rsq = 0.9912
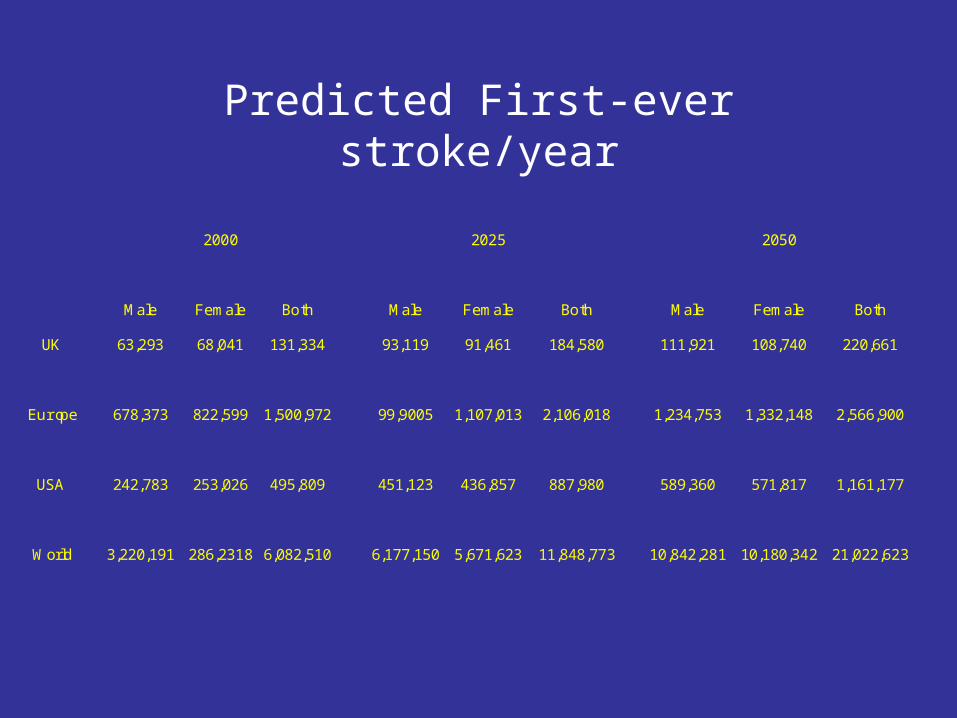
Predicted First-ever stroke/year
2000 2025 2050
Male Female Both Male Female Both Male Female Both
UK 63,293 68,041 131,334 93,119 91,461 184,580 111,921 108,740 220,661
Europe 678,373 822,599 1,500,972 99,9005 1,107,013 2,106,018 1,234,753 1,332,148 2,566,900
USA 242,783 253,026 495,809 451,123 436,857 887,980 589,360 571,817 1,161,177
World 3,220,191 286,2318 6,082,510 6,177,150 5,671,623 11,848,773 10,842,281 10,180,342 21,022,623

Conclusions
• We have demonstrated significant differences in age-adjusted stroke incidence risk worldwide
• Incidence risk has not declined over the last 20 years of incidence studies
• For most populations, crude incidence can be accurately estimated by age-dependent incidence
• We predict a massive increase in stroke incidence over the next 50 years due to population ageing