comparison of two tillage practices on a semi-arid
TRANSCRIPT

COMPARISON OF TWO TILLAGE PRACTICES ON A SEMI-ARID ROTATIONAL
CROPPING SYSTEM
A Thesis
by
MATTHEW ETHAN BEAN
Submitted to the Office of Graduate and Professional Studies
of Texas A&M University
in partial fulfillment of the requirements for the degree of
MASTER OF SCIENCE
Chair of Committee, Jamie L. Foster
Co-Chair of Committee, Cristine L.S. Morgan Committee Members, Gaylon D. Morgan Head of Department, Rabi H. Mohtar David
D. Baltensperger
August 2016
Major Subject: Agronomy
Copyright 2016 Matthew Ethan Bean
ii
ABSTRACT
Conventional tillage (CT) increases the exposure of soil to erosion and is
associated with lower soil moisture and organic matter than conservation tillage.
Conservation tillage may benefit farmers in semi-arid regions of south Texas due to
limited rainfall and lower input costs of no-till (NT) systems. The objective of this long-
term study was to evaluate the effects of NT in a dryland cotton-sorghum cropping
rotation system on soil moisture, bulk density, penetration resistance, C:N, N, P, K, and
crop yields. This randomized block design experiment was established on a Victoria soil
in Corpus Christi, TX, and has four replicates of cotton (Gossypium hirsutum ‘DPL
1044’) and sorghum (Sorghum bicolor ‘DKS 53-67’) rotated under NT or CT. Soil
samples were taken with a 30-cm push probe with depth increments of 0 to15 cm and 15
to 30 cm. Soil moisture, pH, ECw, NO3-N, P, K, Ca, Mg, S, Na, total N, SOC, and
penetration resistance were measured before planting and after crop harvest beginning in
2014 after four years of tillage treatment. Cotton yield was not different between
treatments, except for the drought year of 2013 when 88% greater cotton yield occurred
with NT than CT. Sorghum did not produce grain in 2013 regardless of treatment, and
yields were only effected by treatment in 2012 when yield was 33% greater in NT than
CT. Sorghum had 69% residue coverage, which was 12% greater than the cotton residue
coverage. The average crop residue coverage for both crops was 58% greater with NT
than CT. Soil moisture and bulk density was not impacted by treatment; however, bulk
density was 6% greater at 15-30 cm than 0-15 cm for CT. Soil pH, ECw, NO3-N, P, K,

iii
Ca, Mg, S, Na was not effected by NT; however, NT had greater total soil N content
than CT in the 0 to 15 cm depth and lower in the 15 to 30 cm depth and SOC was greater
in the 0 to 15 cm depth in 2014 with NT than CT, but lower in the 15 to 30 cm depth.
No-till had a lower surface penetrometer resistance than CT in year five. No-till is an
economically viable alternative to CT in this region because of risk mitigation in drought
years.

iv
DEDICATION
For Casey Scarborough.
v
ACKNOWLEDGEMENTS
I would like to express my utmost gratitude to my advisor, Dr. Jamie Foster, for
the opportunity to be a member of her research program and to participate in this project.
Her mentorship, support, and patience has attributed to my success as a graduate student.
Her passion for research has strengthened my desire to improve agricultural systems and
to secure food for families across the globe.
I would also like to thank my committee co-chair, Dr. Cristine Morgan, and my
committee members, Drs. Gaylon Morgan and Rabi Mohtar. Their guidance and
knowledge that they have given has been essential for the completion of my work and I
am indebted to them.
In addition, I would like to thank the Research Associates and students who
dedicated their time and energy to ensure that this project was a success. To my fellow
graduate students and friends, I owe you for all the assistance that you have given me the
past two years and making my time here at Texas A&M University a very enjoyable
experience.
I would also like to recognize my mentor from my high school and
undergraduate years, Casey Scarborough, for broadening my interests in agriculture and
inspiring me to pursue a life in agriculture.
Finally, I am especially thankful for my entire family, for their love and support
as I have worked through my graduate degree. You have been there to remind me that
there is light at the end of the tunnel.

vi
NOMENCLATURE
a.i. Active ingredient
a.e. Acid equivalent
CT Conventional tillage
EC Electrical conductivity
GSM Gravimetric soil moisture
GWC Gravimetric water content
HSD Honest significant difference
mph Mile per hour
NASS National Agriculture Statistics Service
NOAA National Oceanic and Atmosphere Administration
NRCS Natural Resource Conservation Service
NT No-till
SAS Statistical Analysis Software
SEM Standard error mean
SOC Soil organic carbon
SOM Soil organic matter
USDA United States Department of Agriculture

vii
TABLE OF CONTENTS
ABSTRACT ....................................................................................................................... ii
DEDICATION .................................................................................................................. iv
ACKNOWLEDGEMENTS ............................................................................................... v
NOMENCLATURE .......................................................................................................... vi
TABLE OF CONTENTS ................................................................................................. vii
LIST OF FIGURES ........................................................................................................... ix
LIST OF TABLES ............................................................................................................. x
CHAPTER I INTRODUCTION ....................................................................................... 1
CHAPTER II LITERATURE REVIEW ............................................................................ 4
2.1 Concerns of Conventional Tillage and Soil Security ............................................... 4 2.2 Tillage Systems and the Conservation of Water in Heavy Clay Soils ..................... 6 2.3 Tillage Systems and Soil Nutrients .......................................................................... 7 2.4 The Feasibility of Integrating No-till ....................................................................... 7
CHAPTER III MATERIALS AND METHODS ............................................................... 9
3.1 Experimental Site ..................................................................................................... 9 3.2 Crop and Tillage Treatments .................................................................................. 10
3.2.1 Crop Management ........................................................................................... 12 3.2.2 Crop Sampling and Processing ........................................................................ 14
3.3 Soil Physical Analysis ............................................................................................ 14 3.4 Soil Chemical Analysis .......................................................................................... 15 3.5 Statistical Analysis ................................................................................................. 16
CHAPTER IV RESULTS ................................................................................................ 17
4.1 Climatic Conditions of Experimental Site ............................................................. 17
4.2 Crops ...................................................................................................................... 19 4.3 Soil ......................................................................................................................... 20
CHAPTER V DISCUSSION ........................................................................................... 24
5.1 Crops ...................................................................................................................... 24 5.2 Soil ......................................................................................................................... 25
Page

viii
CHAPTER VI CONCLUSIONS ..................................................................................... 28
REFERENCES ................................................................................................................. 32
APPENDIX A TREATMENTS ....................................................................................... 39
APPENDIX B STATISTICAL ANALYSIS ................................................................... 41
ix
LIST OF FIGURES
FIGURE Page
3.1 Location of the experiment at the Texas A&M AgriLife Research and
Extension Center in Corpus Christi, Texas………………………………….... 10
3.2 Experimental design of a conventional tillage (CT) and no-tillage (NT)
experiment in Corpus Christi, Texas, with four replicate plots (16 rows
on 91 cm centers × 100 m) of each treatment.……………………………....... 11
4.1 Monthly average precipitation (mm) during the five-yr experiment
(2011-2015) and 30-yr average for Corpus Christi, Texas………………….... 18
4.2 Monthly average temperature (°C) during the five-yr experiment
(2011-2015) and 30-yr average for Corpus Christi, Texas…………………… 18
4.3 Soil surface penetrometer resistance for no-till (NT) and conventional
tillage (CT) production systems after five years of the experiment
(2011-2015) in Corpus Christi, Texas, on Vertisol. Different letters are
significant at the 0.10 probability level.............................................................23

x
LIST OF TABLES
TABLE Page
3.1 Example of an analysis of variance table that is used to determine
significant difference………………………………………………………….16
4.1 Cotton yield, lint percentage, and boll count for no-till (NT) and
conventional tillage (CT) systems by year (2011-2015) in Corpus Christi,
Texas, on Vertisol………………………………………….........…………….19
4.2 Sorghum yield and panicle count for no-till (NT) and conventional tillage
(CT) systems by year (2011-2015) in Corpus Christi, Texas, on Vertisol…… 20
4.3 Comparison soil GSM and VWC, porosity, and bulk density at two depths
in no-till (NT) and conventional tillage (CT) systems during the fourth and
fifth cropping years (2014 and 2015) in Corpus Christi,
Texas.……………………………………………………………………......... 21
4.4 Comparison of soil pH, ECw, NO3-N, P, K, Ca, Mg, S, Na, total N, and
SOC % at two depths in no-till (NT) and conventional tillage (CT)
systems during the fourth and fifth cropping years (2014 and 2015) in
Corpus Christi, Texas………………………………….……………………... 22
6.1 Estimated costs and returns per acre ($ acre) (2015-2016 prices) based on
means across five years and predicted costs and returns for 500 acres of
cotton and sorghum under conventional tillage (CT) and no-till (NT)
management in Corpus Christi, Texas.….……………………………………. 29

1
CHAPTER I
INTRODUCTION
Conventional tillage (CT) is the predominant tillage practice across Texas
(USDA-ERS, 2012); however, the long-term sustainability of this practice in arid to
semi-arid environments with Vertisol soils had not been adequately researched. The
number one limiting factor in crop production in semi-arid regions is water, and the
ability of soil to maximize capture and efficiently utilize the water is critical. It has been
documented from previous studies that depending on the soil type, cultivation may
increase water infiltration in the short-term, but it is rarely sustainable for a long period
of time (Azooz et al., 1996). In land areas where soil has a high clay percentage (38.5%),
water infiltration is often decreased due to the surface of the soil crusting upon water
contact (Brady and Weil, 1996). This crusting effect occurs because water carries loose
soil particulates from cultivation into soil pores which block the soil pore. This blockage
creates surface crust and increases water run-off from the field. Due to this process, soil
erosion occurs and the nutrient rich top soil is lost with water (Pimentel et al., 1995). The
inability of a cropping system to utilize precipitation sufficiently often proves
detrimental to crop yields and subsequently the farmer’s income (Nielsen et al., 2005).
Along with the potential environmental impacts, farmers also have to consider
input costs which are associated with full tillage practices. Research has indicated that an
average CT farm may require six or more tillage passes each year (West and Marland et
al., 2002). The increase in fuel and energy costs can be detrimental to a farmer in years

2
of drought when low yield returns may exceed the profit (Varner et al., 2011; Klose et
al., 2013).
Conservation tillage practices have been integrated into farming operations
across the United States because of their benefits (USDA-ERS, 2012). These benefits
include an increase in infiltration rates, soil water holding capacity, residue coverage,
soil nutrients, and a decrease in soil erosion and input costs (Unger, 1990; Triplett et al.,
2008). Conservation tillage is defined as a reduced tillage system which leaves at least
30 percent of the crop residue on the soil surface post crop harvest (USDA-NRCS,
1996). No-till (NT) farming is included in this definition, and NT crops are grown and
harvested without prior tillage of the soil. No-till has been implemented in
approximately 35 percent of row crop farming operations in the United States, but only 9
percent in Texas, with an even lesser percentage in the semi-arid climates of Texas
(USDA-NASS, 2012). Implementation of this practice is slow in Texas partly because
farmers believe that annual precipitation amounts are unpredictable and cannot support a
tillage system other than CT; however, research has shown that NT conserves moisture
and can economically benefit farmers (Morrison et al., 1990; Varner et al., 2011).
Rotating crops on an annual basis has been a production practice used by farmers
for decades and has been studied extensively. Crop rotations provide several benefits to
the soil and the grower. Introducing different plant root systems annually has shown to
decrease soil compaction and increase soil porosity (Lal, et al., 1994). It has also been
successful as a weed and pest reduction practice (Reeves, et al., 1994).
3
There is limited published research on the feasibility of integrating NT into
dryland cropping rotation systems in the semi-arid region of south Texas. A transition
into this crop production practice from CT has the potential to secure natural resources
for future generations and increase financial profitability to the farmer.
The objective of this experiment was to compare NT and CT in a cotton-sorghum
rotational cropping system in the semi-arid region of south Texas and determine if
integrating NT would benefit soil conditions and crop yields.
The hypotheses of this experiment were:
Hypothesis 1. Minimum soil disturbance in combination with increased
crop residue coverage on soil surface would aid in capturing and retaining
precipitation while improving the composition of the soil.
Hypothesis 2. No-till would produce greater crop yields compared to CT
during drought conditions due to the increased soil water and improved
soil conditions.

4
CHAPTER II
LITERATURE REVIEW
2.1 Concerns of Conventional Tillage and Soil Security
With the growing demand for crop production, in combination with intensive
tillage practices, concerns for soil security are rising in the agriculture community.
McBratney et al. (2013) defined soil security as the preservation and improvement of
soil resources that will enable the food and fiber industry to continue providing food,
water, and energy to the world. Conventional tillage has been the dominant tillage
practice in the United States and much of the world, but concerns have arisen on the
long-term sustainability of this farming practice. Research has shown that continuous
cultivation of soils has a detrimental effect on soil structure and has resulted in soil
degradation (Dam et al., 2004). Soil degradation is of particular concern to farmers in
south Texas, where the environment is often quite extreme with limited precipitation
(average annual precipitation of 737 mm), high temperatures (22°C average), and winds
consistently greater than 13 mph (NOAA, 2014).
A key component to soil security is strengthening the soil physical structure
through stabilization of soil aggregates. Soil aggregates are formed when particulates of
soil adhere more strongly to some soil particles than others (USDA-NRCS, 1996).
Formation of aggregates leaves pore spaces between the aggregates and allows for water
infiltration and permeability and movement of oxygen within the soil. Aggregate
stability can be defined as the ability of aggregates to remain whole and resist to
disruption from environmental conditions such as water and wind or from human

5
mechanical traffic (USDA-NRCS, 1996). Conventional tillage systems weaken soil
physical structure through continuous cultivation, compaction of the soil by mechanical
equipment, and leaving the soil bare and fallow-between growing seasons. Sainju et al.
(2009) found that tilled and fallow fields reduce soil aggregation by exposing the soil to
water and wind erosion. This erosion resulted in reduced quantities of soil organic matter
(SOM; Sainju et al., 2009).
Soil organic matter has many effects on soil security and one of these is
contribution to maintaining soil stability against erosive forces. Soil organic matter acts
as a binding agent for soil particles and assists in creating and maintaining soil
aggregates (Oades et al., 1984). Research has proven that CT depletes soil of organic
matter and therefore, destroys aggregate stability. No-till is an alternative farming
practice which facilitates accumulation of organic matter and stable aggregate formation.
There have been several long-term studies conducted in the past century on the
differences between NT and CT and their effects on soil structure. In the majority of
these studies, NT resulted in increased soil organic matter, aggregate stability, porosity,
and soil water content (Derpsch et al., 2010). These positive attributes are the result of
reduced cultivation, less mechanical traffic, and the presence of crop residues left on the
soil surface after crop harvest. After 13 years in a sandy clay loam soil in Athens,
Georgia, soil organic matter increased 18 percent in the top 15 cm of soil under NT
management in a grain sorghum and winter rye double crop system (Beare et al., 1994).
Aggregate stability has a direct relationship with soil compaction. Soil
compaction is prevalent in high intensity tillage systems because of heavy machinery

6
traffic (Hamza et al., 2005). As a result of this compaction, the pore spaces within the
soil collapse, resulting in decreased infiltration and air movement. Soil compaction can
be determined by measuring the bulk density or penetration resistance of the soil. The
relationship between aggregate stability and bulk density is that as bulk density
increases, aggregate stability decreases (Blanco-Canqui and Lal, 2009).
2.2 Tillage Systems and the Conservation of Water in Heavy Clay Soils
One of the greatest challenges faced in dryland crop production is availability
and utilization of precipitation. Aside from limited precipitation, Vertisols (soils with
greater than 30% clay in the solum) present a challenge in water availability. Vertisols
are characterized by smectite clay minerals that expand and shrink upon wetting and
drying (Wilding and Puentes, 1988). When the soils are dry, large cracks form. Upon
rainfall, water rapidly enters the soil through the cracks, but after the soil is wet, the
cracks close and water infiltration decreases rapidly, resulting in increased surface
runoff, erosion, and evaporation (Potter and Chishester, 1993). No-till cropping reduces
the consequences of the shrink and swell characteristics of Vertisols by leaving crop
residue on the soil surface to increase water infiltration and retention and protect the soil
from erosion (Unger, 1990). Multiple research studies on crop residue and water
infiltration relationships have been conducted throughout the past several decades. It is
documented in the majority of the studies that infiltration is decreased under CT when
compared to NT, due to the residue removal under conventional practices (Blanco-
Canqui and Lal, 2009). A study by Morrison et al. (1990) found that crop-residue with
NT management increased water infiltration in a Vertisol soil by reducing runoff and
7
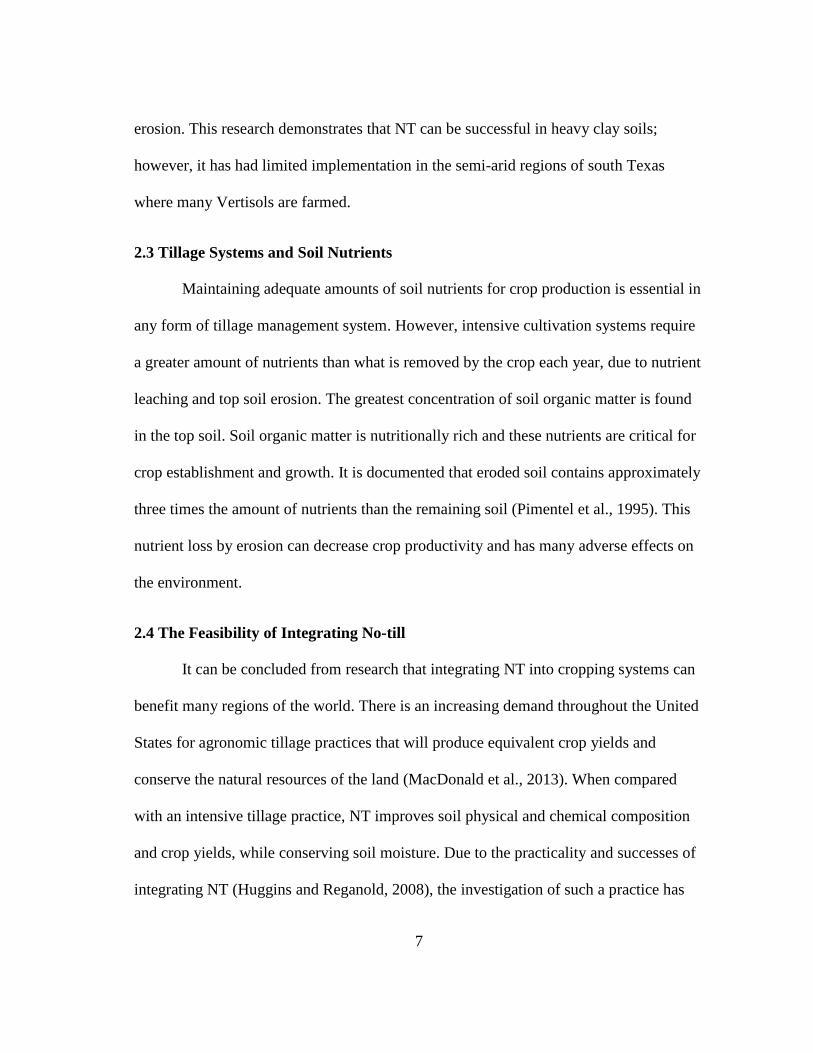
erosion. This research demonstrates that NT can be successful in heavy clay soils;
however, it has had limited implementation in the semi-arid regions of south Texas
where many Vertisols are farmed.
2.3 Tillage Systems and Soil Nutrients
Maintaining adequate amounts of soil nutrients for crop production is essential in
any form of tillage management system. However, intensive cultivation systems require
a greater amount of nutrients than what is removed by the crop each year, due to nutrient
leaching and top soil erosion. The greatest concentration of soil organic matter is found
in the top soil. Soil organic matter is nutritionally rich and these nutrients are critical for
crop establishment and growth. It is documented that eroded soil contains approximately
three times the amount of nutrients than the remaining soil (Pimentel et al., 1995). This
nutrient loss by erosion can decrease crop productivity and has many adverse effects on
the environment.
2.4 The Feasibility of Integrating No-till
It can be concluded from research that integrating NT into cropping systems can
benefit many regions of the world. There is an increasing demand throughout the United
States for agronomic tillage practices that will produce equivalent crop yields and
conserve the natural resources of the land (MacDonald et al., 2013). When compared
with an intensive tillage practice, NT improves soil physical and chemical composition
and crop yields, while conserving soil moisture. Due to the practicality and successes of
integrating NT (Huggins and Reganold, 2008), the investigation of such a practice has

8
been prompted in the semi-arid environments of Texas to determine if the results are
comparable to other findings and if this conservation practice is attainable for farmers in
these regions.

9
CHAPTER III
MATERIALS AND METHODS
3.1 Experimental Site
This tillage experiment was initiated in 2010 at the Texas A&M AgriLife
Research and Extension Center in Corpus Christi in the Gulf Coast Prairie of Texas
(27°46’ N, 97°34’ W; Figure 3.1). The Gulf Coast Prairie of south Texas represents a
semi-arid region with a mean annual precipitation of 737 mm and an annual mean air
temperature of 22 °C. Precipitation and temperature data was collected from National
Oceanic and Atmosphere Administration (NOAA).
The soil of this site was classified as a Victoria series (fine smectitic
hyperthermic Sodic Haplusterts), using Web Soil Survey of the USDA-NRCS. The
surface soil characteristics were 45% sand, 17% silt, and 38% clay with 38.5 mg kg-1
NO3-N, 33 mg kg-1 P, 380 mg kg-1 K, and pH of 8.0 at the initiation of the experiment.
This soil was developed from a clayey deltaic and marine sediment and is characterized
as being well drained with a very slow permeability. The fine smectitic prefix describes
clay minerals that have the ability to expand and contract as it adsorbs water or dries out.
This soil has a mean annual soil temperature of 22°C or greater than other soil series and
exchangeable sodium percentage of 15 or more within 100 cm of the mineral surface
(USDA-NRCS, 2010).
10
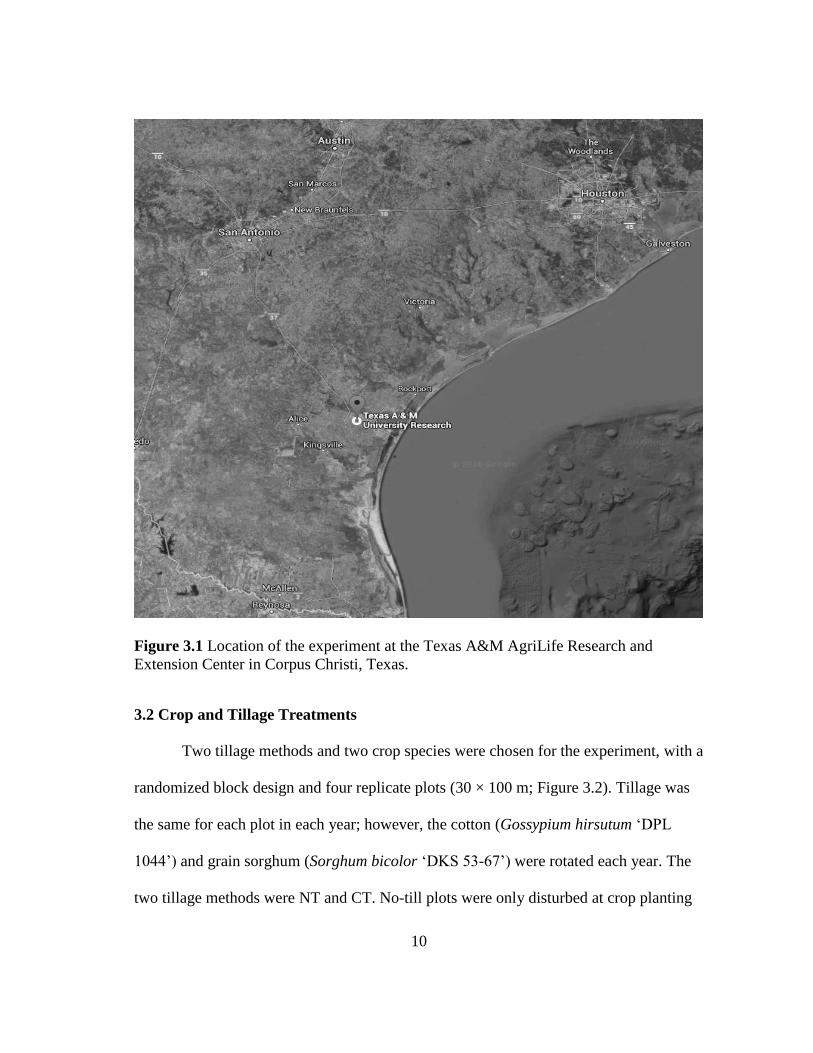
Figure 3.1 Location of the experiment at the Texas A&M AgriLife Research and
Extension Center in Corpus Christi, Texas.
3.2 Crop and Tillage Treatments
Two tillage methods and two crop species were chosen for the experiment, with a
randomized block design and four replicate plots (30 × 100 m; Figure 3.2). Tillage was
the same for each plot in each year; however, the cotton (Gossypium hirsutum ‘DPL
1044’) and grain sorghum (Sorghum bicolor ‘DKS 53-67’) were rotated each year. The
two tillage methods were NT and CT. No-till plots were only disturbed at crop planting

11
and harvesting or when chemical application was necessary for weed or insect control.
Conventional tillage plots were cultivated before planting, after planting between crop
rows, after harvest in late fall, and rows bedded during winter. Soil cultivation depth was
7 cm, plowing was 22 cm, and bedding height was 15 cm. Cotton and grain sorghum
were planted on 91 cm centers (16 rows per plot) and were rotated on a yearly basis.
Planting dates were highly dependent on precipitation for the year, but cotton and
sorghum were generally seeded in April and March, respectively. Seeding rates for both
the crops followed the recommended rates for the area, at 22,200 seeds ha-1.The crop
harvest was based on the maturity of cotton and sorghum; however, the harvest period
for both crops ranged from July to August, respectively.
NT CT NT CT NT CT NT CT
NT CT NT CT NT CT NT CT
Figure 3.2 Experimental design of a conventional tillage (CT) and no-tillage (NT)
experiment in Corpus Christi, Texas, with four replicate plots (16 rows on 91 cm centers
× 100 m) of each treatment.

12
3.2.1 Crop Management
Land preparation began following the prior year harvest. Conventional grain
sorghum was disked (John Deere 210, Moline, IL) in the fall after harvest and then
sweep-plowed (John Deere custom model, 20 in. sweeps, Moline, IL) in early winter.
The NT grain sorghum was sprayed with glyphosate (Roundup WeatherMax, Monsanto)
at 2.2 kg a.e. ha-1 up to two times during the fall. Cotton CT plots were plowed and then
sweep plowed similarly to sorghum CT plots. To kill remaining cotton stalks and
seedlings, application of 2,4-dichlorophenoxy butyric acid (Butyrac 200, Albaugh LLC)
was made in 2013 and 2014 at 2.2 kg a.i ha-1 or 2,4-dichlorophenoxyacetic (2-4, D
Amine, Albaugh LLC) was applied in 2015 at 2.2 kg a.i. ha-1. In December of each year,
CT plots were bedded (John Deere, 986, Moline, IL), to a height of 15 cm. In January,
CT plot rows were run with a row sweep and bed topper (John Deere, 986, Moline, IL)
to reshape the bedded rows. To prepare the NT plots for planting, glyphosate at 2.2 kg
a.e. ha-1 was applied in January of each year. In February of 2014, all plots were
fertilized by broadcast with 43 kg ha-1 N and 59 kg ha-1 of P2O5 according to soil report
recommendations. In April of 2015, cotton plots were fertilized by broadcast with 56 kg
ha-1 N and 34 kg ha-1 P2O5, and sorghum plots were fertilized with 45 kg ha-1 N and 38
kg ha-1 P2O5 according to the most recent soil report recommendations.
Cotton was planted April 1, 2014, and April 9, 2015, with a 7300 Max Emerge 2
planter (John Deere, Moline, IL). Weeds were controlled in NT cotton plots with
glyphosate at 2.2 kg a.e. ha-1 and additionally with a sweep cultivator Lilliston Rolling
Cultivator, Bigham, Lubbock, TX) in the CT plots. Cotton fleahoppers

13
(Pseudatomoscelis seriatus) were problematic in 2015 and thiamethoxam (Centric
40WG, Syngenta Crop Protection LLC) at 0.08 kg a.i. ha-1 was applied in early-June and
imidacloprid (Quali-Pro) at 0.14 kg a.i. ha-1 in mid-June. On July 29, 2014, cotton plots
were defoliated with thidiazuran (Ginstar, Bayer Crop Science) at 0.21 kg a.i. ha-1 +
ethephon phosphonic acid (Ethephon 6, RealEagle International) at 0.56 kg a.i ha-1. On
June 27, 2015, mepiquat chloride (Mepiquat Chloride 4.2%, Makhteshim Agan of North
America Inc.) at 0.14 kg a.i. ha-1 was applied on NT and CT cotton plots. Thidiazuron
defoliant (Ginstar, Bayer Crop Science) at 0.04 kg a.i. ha-1 was sprayed on cotton plots
on August 13, 2015.
Grain sorghum was planted on March 19, 2014, and April 9, 2015, with the
same planter. In 2015, preemergent herbicide S-metolachlor (Dual II Magnum, Syngenta
Crop Protection) at 1.5 kg a.i. ha-1 was applied after planting to both CT and NT
sorghum. Weeds present at planting of NT sorghum in 2015 were treated with
glyphosate at 2.2 kg a.e. ha-1.
In April and May of 2014, the cultivator was used to control weeds in the CT
Sorghum plots. Weeds between rows in NT sorghum were sprayed with glyphosate at
2.2 kg a.e. ha-1 in May 7, 2014, with a hooded sprayer (Red Ball, Conservation Hooded
Sprayer, Willmar, MN) between rows. All sorghum plots were treated with glyphosate at
1.5 kg a.e. ha-1 using the hooded sprayer on May 28, 2014. In June 2014, sugarcane
aphid (Melanaphis sacchari) was controlled with application of sulfoxaflor (Transform
WG, Dow AgroSciences) at 0.09 kg a.i. ha-1 and was applied with a spray coupe (Melroe
230 Spray Coupe, Bismark, ND).

14
3.2.2 Crop Sampling and Processing
Cotton boll samples were collected by hand at maturity on August 11, 2014, and
August 18, 2015, at row length of 4.2 m from four center rows and the samples were
weighed. The number of bolls per plant were a representation of three random plants
with the given area. These samples were processed with an Eagle Cotton Gin
(Continental Gin Co., Birmingham AL) to determine the cotton lint yield.
Sorghum grain samples were collected by hand at row length of 4.2 m from four
center rows on July 14, 2014, and July 30, 2015, and threshed (Almaco Plant and Head
Thresher, Allan Machine Company, Ames, IA). The numbers of panicles were counted.
Samples were dried at 135°C for 2 hr before grain yield calculated on a dry matter basis.
Crop residue percentage was measured by line transect method with a 30-m tape
placed across the middle rows at a 45° angle (Laflen et al., 1981). Presence or absence of
residue at each 0.3 m mark was determined and crop residue coverage calculated.
3.3 Soil Physical Analysis
Soil moisture content was evaluated by using gravimetric and volumetric water
analysis methods. Gravimetric water content was determined from a composite sample
of six soil cores that were collected with a 30 cm push probe (2.2-cm diameter). Each
soil core was divided into two depths with increments of 0 to 15 and 16 to 30 cm.
Composite samples were collected prior to crop planting on Feb. 14, 2014, and shortly
after on May 1, 2015. Sample collection after crop harvest occurred on Oct. 28, 2014,
and Oct. 16, 2015. Soil volumetric water content and soil porosity was calculated from
soil bulk density samples that were collected from each individual plot. Bulk density

15
samples were taken with a 30-cm split core sampler (5 cm diameter; AMS Inc. American
Falls, ID). Surface penetrometer resistance was measured with a 6.8 kg dynamic cone
penetrometer (Humboldt, Elgin, IL) on the same dates as the gravimetric water samples
were collected. The instrument was tipped with a 45° vertex angle cone with a base
diameter of 3.8 cm and the resistance was determined at three random locations within
each plot.
3.4 Soil Chemical Analysis
Nutrient concentration, pH and electrical conductivity of soil solution (ECw)
were measured from soil samples taken prior to planting and after crop harvest. Macro-
and micronutrients, pH, and ECw were analyzed at the Soil, Water and Forage Testing
Laboratory in College Station, TX. Nitrate-nitrogen (NO3-N) was analyzed using the
cadmium reduction (Cd) method (Keeney and Nelson, 1982; Kachurina et al, 2000).
Phosphorus, K, Ca, Mg, Na, and S were evaluated using the Mehlich III extraction
method and determined by inductively coupled plasma (ICP) (Mehlich, 1978; Mehlich,
1984). Soil water pH was determined by using a 1:2 soil:water extraction with deionized
water (DI, H2O) and evaluated by a hydrogen selective electrode (Schofield and Taylor,
1955). Electrical conductivity was determined by using a 1:2 soil:water extraction with
DI H2O and assessed with a conductivity (Rhoades, 1982). Total C and N content were
determined by dry combustion with a carbon analyzer (McGeehan and Naylor, 1988;
Elementar, Mt Laurel, NJ, USA). Inorganic carbon was determined by using the
modified pressure-calcimeter method (Sherrod et al., 2002). Soil organic carbon was
calculated from the difference between total and inorganic carbon.

16
3.5 Statistical Analysis
Statistical analyses were conducted with JMP® Pro 12 statistical software (SAS
Institute Inc., 2012). Significance between treatments, depths, and years, was determined
at the 0.05 (Table 3.1), except for volumetric water content, bulk density, and surface
penetration resistance for which significance was determined at the 0.10 probability
level. Student’s t-test was used to compare means and determine the least squares means.
Table 3.1 Example of an analysis of variance table that is used to determine significant
difference.
Source DF
Sum of
Squares Mean Square F Ratio
Model 9 20237344 2248.594 51.8835
Error 30 1300179 43.339 Prob > F
Corrected total 39 21537523 < 0.0001*
*Significant difference at the 0.05 probability level.

17
CHAPTER IV
RESULTS
4.1 Climatic Conditions of Experimental Site
This tillage experiment began in 2011, but soil moisture and quality
measurements, except for yield, did not begin until 2014. Precipitation through the
experiment period was variable, though the most severe drought in Texas history
occurred during 2012-13 (Figure 4.1). The site only received 360 mm of precipitation
the first year of crop harvest (2011). The drought continued the following three years
(2012-2014), but precipitation amounts increased with each consecutive year (480, 580,
and 690 mm, respectively). In 2015, precipitation increased to 1150 mm, which was
greatly above the 30-yr average. The monthly average temperature did not differ from
the 30-yr average during the experiment (Figure 4.2).

18
Figure 4.1 Monthly average precipitation (mm) during the five-yr experiment (2011-
2015) and 30-yr average for Corpus Christi, Texas.
Figure 4.2 Monthly average temperature (°C) during the five-yr experiment (2011-2015)
and 30-yr average for Corpus Christi, Texas.
0
50
100
150
200
250
300
350
400
Pre
cipit
atio
n, m
m
Month
2011 2012
2013 2014
2015 30-yr avg
0
5
10
15
20
25
30
35
Tem
per
ature
, °C
Month
2011 2012 20132014 2015 30-yr avg

19
4.2 Crops
No-till treatment affected (P ≤ 0.05) cotton yields in some years (Table 4.1).
Cotton yields for 2011 and 2012 were not different (P = 0.60; 1.10 Mg ha-1 and 1.72 Mg
ha-1 average yields, respectively) between treatments, but yield was greater in 2012 than
2011. The NT cotton yield (0.76 Mg ha-1 average) for 2013 was greater (P < 0.01) than
CT (0.09 Mg ha-1 average). Cotton yields were not different between treatments (P >
0.05) in either 2014 (0.99 Mg ha-1 average) or 2015 (2.4 Mg ha-1 average), and were
greatest in 2015. Cotton lint percentage progressively increased from 2011 to 2015 with
a nadir in 2013. The average lint yield was (32.2%), but no difference (P > 0.05)
occurred between treatments or years. The number of bolls increased from 2014
(average of 10 bolls plant-1) to 2015 (average of 29 bolls plant-1), and 2015 was greater
for NT cotton than CT cotton.
Table 4.1. Cotton yield, lint percentage, and boll count for no-till (NT) and conventional
tillage (CT) systems by year (2011-2015) in Corpus Christi, Texas, on Vertisol.
Tillage systems 2011 2012 2013 2014 2015 SEM†
Yield (Mg ha-1)
NT 1.13 1.69 0.76* 0.92 2.63 0.09
CT 1.08 1.76 0.09* 1.07 2.26
Lint (%)
NT 28 28 27 38 40 0.0003
CT 28 29 26 39 40
Bolls (3 plant average)
NT - - - 9 58* 0.002
CT - - - 12 30*
* Significantly different within column at the 0.05 probability level.
† Standard error of mean (SEM).

20
Sorghum yields also varied by year (Table 4.2), and there was no difference (P =
0.7) between treatments in 2011 (4.06 Mg ha-1 average). Sorghum grown under NT had
33% greater (P = 0.04) grain yield than CT in 2012. There was no grain produced in
2013 due to severe drought conditions. There was no difference (P ≥ 0.24) between
treatments in 2014 (1.12 Mg ha-1average) or 2015 (4.19 Mg ha-1average), and yields
were greater in 2015. The panicle count for 2014 was not affected (P = 0.96) by
treatment; whereas, in 2015 CT sorghum had 10% more (P = 0.02) panicles than NT
sorghum. In 2015, crop residue was 58% greater (P < 0.01) with NT than CT and
sorghum (69% coverage) residue was greater (P < 0.01) than cotton residue (52%).
Table 4.2. Sorghum yield and panicle count for no-till (NT) and conventional tillage
(CT) systems by year (2011-2015) in Corpus Christi, Texas, on Vertisol.
Tillage systems 2011 2012 2013 2014 2015 SEM†
Yield (Mg ha-1,
DM basis)
NT 4.12 4.42* - 1.06 3.53 0.40
CT 3.99 2.96* - 1.17 4.85
Panicle (4.2 m-1)
NT - - - 51 55* 0.002
CT - - - 50 61*
* Significantly different within column at the 0.05 probability level.
† Standard error of mean (SEM).
4.3 Soil
Gravimetric soil moisture (GSM, %) was not affected by treatment (P = 0.33) nor
was it significantly different between depths (P = 0.26), but there was a yearly effect
(Table 4.3). Volumetric water content (VWC) was also not affected by treatment or

21
depth (P = 0.38). Soil porosity remained constant between treatments (P = 0.68) for total
depth and discrete depths (P = 0.07). There was no difference (P = 0.59) between NT
and CT for bulk density (g cm-3) from 0 to 15 cm depth, but were different at the 15 to
30 cm depth. Bulk density was not different (P = 0.30) between sampling depths for NT.
Conventional tillage had 6% greater (P < 0.04) bulk density in the lower depth than the
upper CT and the lower NT depths.
Table 4.3 Comparison soil GSM and VWC, porosity, and bulk density at two depths in
no-till (NT) and conventional tillage (CT) systems during the fourth and fifth cropping
years (2014 and 2015) in Corpus Christi, Texas.
2014 2015
Tillage NT CT NT CT
Depth Properties
0-15 cm Moisture, GSM,
% 10.33* 11.63* 14.13* 15.40*
Moisture, VWC,
g cm-3 - - 26.23 26.01
Porosity, % - - 0.54 0.55
Bulk Density, g
cm-3 - - 1.23 1.20**
15-30 cm Moisture GSM,
% 9.53*
9.53*
17.72*
18.36*
Moisture VWC,
g cm-3 -
-
32.71
29.98
Porosity, % - - 55 52
Bulk Density, g
cm-3 -
-
1.21‡
1.27**‡
* Significant within column at the 0.05 probability level.
** Significant within column at the 0.10 probability level.
‡ Significant within row at the 0.10 probability level.

22
Soil chemical properties, including pH, ECw, NO3-N, P, K, Ca, S, and Na, were
not different between years (2014 and 2015) or treatments (Table 4.4). In 2014, NT had
a greater total N (mg ha-1; P = 0.02) content in the upper depth than the lower depth and
between treatments in the upper depth, but no significant difference occurred in 2015.
Soil organic carbon was greater (P < 0.02) in the 0 to 15 cm depth in 2014, with NT than
CT, but lower in the 15 to 30 cm depth. No significant difference (P > 0.83) was found
between treatments in 2015. Surface penetrometer resistance (J cm-1) was greater (P <
0.10; Figure 4.3) in CT than NT after five years of treatment, but no significant
difference was found between crops (P = 0.20).
Table 4.4 Comparison of soil pH, ECw, NO3-N, P, K, Ca, Mg, S, Na, total N, and SOC
% at two depths in no-till (NT) and conventional tillage (CT) systems during the fourth
and fifth cropping years (2014 and 2015) in Corpus Christi, Texas.
2014 2015
Tillage NT CT NT CT
Depth Properties
0-15 cm pH 8.12 8.14 8.30 8.35
ECw, umhos-cm-1 354 370 295 297
NO3-N, ppm 7.38 11.31 6.50 6.00
P, ppm 28.81 27.69 20.56 23.50
K, ppm 320.44 321.69 327.94 310.63
Ca, ppm 7430.13 7635.19 7318.19 7679.44
Mg, ppm 404.63 418.44 410.38 420.38
Na, ppm 146.56 150.00 152.00 161.19
Total N, mg ha-1 9.50*‡ 8.92*‡ 6.49 6.06
SOC, % 66‡ 48*‡ 55 49
15-30 cm pH 8.22 8.23 8.44 8.49
ECw, umhos-cm-1 463 451 326 340
N03-N, ppm 15.19 15.69 5.81 5.19
P, ppm 8.88 10.69 11.75 11.94
K, ppm 282.13 276.00 274.69 268.75

23
Table 4.4 Continued
2014 2015
Tillage NT CT NT CT
Depth Properties
15-30 cm Ca, ppm 9470.50 9243.19 8288.13 8553.56
Mg, ppm 540.75 525.38 463.06 483.44
S, ppm 20.50 18.63 13.00 14.00
Na, ppm 422.81 389.57 258.06 297.44
Total N, mg ha-1 8.29* 8.69* 5.75 5.57
SOC, % 63‡ 80*‡ 46 42
* Significant within column at the 0.05 probability level.
‡ Significant within row at the 0.05 probability level.
Figure 4.3 Soil surface penetrometer resistance for no-till (NT) and conventional tillage
(CT) production systems after five years of the experiment (2011-2015) in Corpus
Christi, Texas, on Vertisol. Different letters are significant at the 0.10 probability level.
0
2
4
6
8
10
12
14
NT CT Cotton Sorghum
Soil
surf
ace
pen
etro
met
er
resi
stan
ce,
J cm
-1
Tillage treatment and crop
a
b
c
c

24
CHAPTER V
DISCUSSION
5.1 Crops
Yield of cotton and sorghum were greater than county yields reported by the
National Agriculture Statistic Service, but the trend of precipitation dependent yield
fluctuations is the same. (USDA-NASS, 2016). Yields in this experiment are likely
greater than the Nueces county average due to hand harvests of crops, which reduced
losses inherent to mechanized harvesting. Also, cotton yields are likely greater than
county averages due to the samples being processed with a small gin, which more
efficiently recovers lint than commercial gins. In 2013, sorghum was not produced due
to drought, and CT cotton yield was below the economic threshold for harvest (Ribera,
personal communication, 2013). It can be surmised that during severe drought years, NT
has the ability to retain more soil moisture than CT; unfortunately, soil moisture
measurements for this study were not taken prior to 2014. In 2015, average crop residue
coverage was 58% greater with NT than CT. Two dryland cropping experiments located
in Colorado and Texas, indicate that crop residue increased soil water capture and
moisture under NT management compared to other management practices (Baumhardt et
al., 2002; Shaver et al., 2002). Similarly, in a long-term dryland maize (Zea mays) study
in Mexico, soil under NT with crop residue had more moisture than CT and produced
greater crop yields in erratic drought years likely due to the increased soil moisture
(Verhulst et al., 2011).

25
During above 30-yr average precipitation years of 2014 and 2015, crop yields
were not significantly different between treatments. There are reduced expenses
associated with NT systems versus CT (Varner et al., 2011), so a lack of yield difference
between the management practices indicates that NT is a viable management practice in
south Texas.
5.2 Soil
Soil moisture was likely greater in 2015 due to 660 mm greater rainfall in 2015
than 2014. The lack of statistical difference between the NT and CT treatments on soil
water content for the fourth and fifth year of this experiment are comparable with a
similar study that was conducted on Vertisol in Temple, TX (Potter and Chishester,
1993). The study measured soil moisture content at three separate times in a ten year
period and found no statistical differences between NT and CT. It is possible that soil
moisture will not be influenced by NT until at least ten years of treatment.
Soil porosity is directly influenced by volume change (USDA-NRCS, 1996) and
considering that the volumetric water content did not differ between treatments, porosity
was not expected to change. The average soil bulk density was not influenced by NT at
year five from 0-15 cm depth, but research has indicated that NT does not alter soil bulk
density in a Vertisol until after year six of NT treatment (Potter and Chishester, 1993).
The greater bulk density in the lower depth of CT may be the result of the soil hardpan,
which is a problematic issue with CT practices (Raper et al., 2005). A study conducted
in Australia on Vertisol soil demonstrated that penetrometer resistance began to decrease
in year five after transitioning from CT to a NT system. The decrease in year five could

26
also be attributed to increased soil moisture content in that year (Hamza and Anderson,
2005).
Soil fertility did not differ between tillage practices, but this was expected due to
the fact that NT has only been established for five years. An eight year study in Alabama
concluded that soil nutrient accumulation will depend upon the SOM content in the soil
and that a significant increase in SOM with NT does not occur until after the eighth year
of establishment (Rhoton, 2000). The increased total N and SOC in the NT practice for
2014, may be associated with the increased crop residue of the NT. Dalal et al. (1989)
observed that total N and SOC content increased with crop residue coverage under NT
management when compared to CT in a Vertisol. Dalal et al. (1989) also found that
biological mineralization increased with residue coverage due to NT. It can be surmised
from this study that NT with an increase in crop residue has a direct effect on total N and
SOC quantities in the soil. The decrease of total N and SOC in 2015 may be attributed to
the increase in precipitation amount (Aanderud et al. 2010).
The preliminary cotton and sorghum yield data indicate that yield results have
been influenced by yearly precipitation and not by the NT treatment. Considering that
soil moisture has not decreased under NT management and soil physical and chemical
properties have stayed relatively the same, it can be deduced that an integration of NT
into the current environment would not be detrimental to the farmer. Varner et al. (2011)
demonstrated that NT is economically beneficial to dryland farmers in Oklahoma due
decreased input costs and yield returns, but an investigation of the costs and returns are
recommended for farmers in south Texas. It is also encouraged that future research focus

27
on monitoring soil moisture content during the wet and dry periods of the year to
compare the effects of NT on soil properties and crop yields.

28
CHAPTER VI
CONCLUSIONS
The results of this study indicate that integrating NT into the semi-arid region of
south Texas is a feasible farming practice that should be considered by farmers. One of
the original hypotheses of the experiment was that soil moisture content would be
increased under NT management, but in this experiment, the average soil water content
was not different between CT and NT practices after 5 years of NT management.
Despite not seeing an increase in water content, NT has produced equivalent or greater
crops yields. Cotton and sorghum yield was more dependent upon precipitation than
tillage management. No-till can produce a greater cotton and sorghum crop yield than
CT in years of drought (2012 and 2013). Despite risk mitigation in drought years, a yield
increase is not the determining consideration to drive the adoption of NT in south Texas.
While economics were not a component of this experiment, it is a critical factor that
must be evaluated thoroughly before integrating an alternative farming method into an
existing cropping system. Following the experiment, an economic table was developed
for the study that compared the input costs and returns for both cotton and sorghum
under CT or NT management (Table 6.1). It can be concluded from the economic
comparison that NT is economically superior to CT for this specific study. This
demonstrates that NT can be an economically successful cropping system if adopted by
farmers, and the economic savings of NT will be the primary consideration of farmers
whom adopt NT management. The implementation of NT into the semi-arid

29
environment of south Texas on a large scale basis will need to be integrated gradually
and modified to accommodate each individual farm.
Table 6.1 Estimated costs and returns per acre ($ acre) (2015-2016 prices) based on
means across five years and predicted costs and returns for 500 acres of cotton and
sorghum under conventional tillage (CT) and no-till (NT) management in Corpus
Christi, Texas.
Conventional system No-till system
Item Cotton Sorghum Cotton Sorghum
Revenue based on mean
yields across five years:
Cotton
Lint ($0.58 lb.)† 287.06 - 325.98 -
Seed ($0.14 lb.)† 127.77 - 147.00 -
Grain sorghum ($7.35
CWT)†
- 237.77 - 237.85
Total revenue 414.83 237.77 472.98 237.85
Production costs:
Custom†
Fertilizer Application 0.10 0.10 0.10 0.10
Pick and Module 69.30 - 78.68 -
Ginning-Picker 64.35 - 73.06 -
Custom Haul - 11.32 - 11.32
Drying - 3.24 - 3.24
Fertilizer†
24-8-0 54.11 54.11 54.11 54.11
Herbicide
Glyphosate 3.08 7.71 7.00
2-4, D Amine 8.38 - 8.38 -
Dual II Magnum - 17.64 - 17.64
Insecticide
Boll Weevil Program† 7.00 - 7.00 -
Fleahopper Control† 1.05 - 1.05 -
Transform WG - 10.78 - 10.78
Headwork Control† - 3.07 - 3.07
Stinkbug Control† - 0.86 - 0.86
Defoliant
Ginstar 6.45 - 6.45 -
Adjuvants

30
Table 6.1 Continued
Conventional system No-till system
Item Cotton Sorghum Cotton Sorghum
Revenue based on mean
yields across five years:
Crop Oil Concentrate 1.82 1.82
Seed 81.95 14.30 81.95 14.30
Planting‡ 16.57 16.57 20.29 20.29
Tillage Management‡ 48.30§ 64.71§ - -
Fertilizer Management‡ 6.34 6.34 6.34 6.34
Chemical Management‡ 18.28 9.14 18.28 18.28
Miscellaneous† 4.87 2.71 84.88 47.64
Crop Insurance 19.00 19.00 19.00 19.00
Pickup Mileage Charge 3.88 3.88 3.88 3.88
Total costs 409.96 235.06 388.10 190.21
Net returns 4.87 2.71 84.88 47.64
Total revenue for farm 103,707.50 59,4442.5 118,245.00 59,462.50
Total costs for farm 102,490.00 58,765.00 97,025.00 47,552.50
Net returns for farm 1,217.50 677.50 21,220.00 11,910.00
† Adapted from Levi Russell, 2016 District 11 Texas Crop and Livestock Budgets,
Texas A&M AgriLife Extension Service. http://www.agecoext.tamu.edu.
‡ Adapted from 2016 Texas Agricultural Custom Rates, Texas A&M AgriLife
Extension Service. http://www.agecoext.tamu.edu.
§ Calculated based on custom price rate: cultivator, disc, moldboard, and shaping beds.
Future research may incorporate other soil measurements into the existing
measurements to better quantify changes in soil structure and chemical composition over
time of NT management. For example, measuring soil erosion, water infiltration and
runoff rate, and soil compaction to a minimum depth of 30 cm. Also, evaluating seed
germination and plant density would aid in determining if NT management may hinder
plant growth and influencing the lack of increase in overall crop yield.

31
The results of this experiment should reassure farmers and researchers that an
alternative method to CT is feasible in semi-arid regions. This study in combination with
other semi-arid research supports the philosophy that conservation farming practices on
row crops can contend with conventional methods and produce optimum crop yields
with less expensive inputs, which provides economic gain for farmer. Semi-arid
cropping studies across the globe have displayed encouraging results not only in crop
yield and economic return, but also in areas of land and natural resource conservation.
The positive attributes of NT make it a viable farming practice for farmers in semi-arid
environments. It is recommend that farmers begin adopting this form of conservation
tillage on their farms; however, it is advised that the integration process be gradual to
insure farmer profitability and environmental sustainability. Through integrating
conservation tillage practices, farmers have the opportunity secure resources that may
enable the agriculture community to sustain the food and fiber industry for future
generations.

32
REFERENCES
Aanderud, Z.T., J.H. Richards, T. Svejcar, and J.J. James. 2010. A shift in seasonal
rainfall reduces soil organic carbon storage in a cold desert. Ecosystems. 13:673-
682.
Azooz, R. H., and M. A. Arshad. 1996. Soil infiltration and hydraulic conductivity under
long-term no-tillage and conventional tillage systems. Canadian J. Soil Sci.
76:143-152.
Baumhardt, R. L., G.L. Johnson, and R.C. Schwartz. 2012. Residue and long-term tillage
and crop rotation effects on simulated rain infiltration and sediment transport.
Soil Sci. Soc. Am. J. 76:1370-1378.
Beare, M.H., P.F. Hendrix, and D.C Coleman. 1994. Water-stable aggregates and
organic matter fractions in conventional and no-tillage soils. Soil Sci. Soc. Am. J.
58:777-786.
Blanco-Canqui, H., and R. Lal. 2009. Crop residue removal impacts on soil productivity
and environmental quality. Crit. Rev. Plant Sci. 28:139-163.
Brady, N.C., and R. R. Weil. 1996. The Nature and Properties of Soils. Ed. 11. Prentice-
Hall Inc.
Dalal, R.C.1989. Long-term effects of no-tillage, crop residue, and nitrogen application
on properties of a Vertisol. Soil Sci. Soc. Am. J. 53:1511-1515.
Dam, R.F., B.B. Mehdi, M.S. Burgess, C.A. Madramootoo, G.R. Mehuys, and I.R.
Callum. 2004. Soil bulk density and yield under eleven consecutive years of corn

33
and different tillage and residue practices in a sandy loam in central Canada. Soil
Tillage Res. 84:41-53.
Derpsch, R., T. Friedrich, A. Kassam, and L. Hongwen. 2010. Current status of adoption
of no-till farming in the world and some of its main benefits. Int. J. Agric. Biol.
Eng. 3:1-25.
Hamza, M.A., and W.K. Anderson. 2005. Soil compaction in cropping systems: a review
of the nature, causes and possible solutions. Soil Tillage Res. 82:121-145.
Huggins, D.R. and J.P. Reganold. 2008. No-till: the quiet revolution. Scientific
American. 299:70-77.
Kachurina, O.M., H. Zhang, W.R. Raun, and E.G. Krenzer. 2000. Simultaneous
determination of soil aluminum, ammonium- and nitrate-nitrogen using 1 M
potassium chloride extraction. Comm. Soil Sci. Plant Anal. 31:893-903
Keeney, D.R., and D.W. Nelson. 1982. Nitrogen - inorganic forms. In: A.L. Page et al.,
editors, Methods of Soil Analysis: Part 2. Agronomy Monography. 2nd ed. ASA
and SSSA, Madison, WI. p. 643-687.
Klose, S., S. Amosson, J. Smith, S. Bevers, M. Waller, B. Thompson, and M. Young.
2016. Texas Agricultural Custom Rates. Texas A&M AgriLife Ext. Serv.
http://www.agecoext.tamu.edu (accessed 15 June 2016).
Kramer, C.Y. 1956. Extension of multiple range tests to group means with unequal
numbers of replications. Biometrics, 12:309–310.
Laflen, J.M., M. Amemiya, and E.A. Hintz. 1981. Measuring crop residue cover. J. Soil
Water Cons. 36:341-343

34
Lal, R., A.A. Mahboubi, and N.R. Fausey. 1994. Long-term tillage and rotation effects
on properties of a central Ohio soil. Soil Sci. Soc. Am. J. 58:517-522.
McBratney, A., D. J. Field, and A. Koch. 2013. The dimensions of soil security.
Geoderma. 213:203-213.
MacDonald, J.M., P. Korb, and R.A. Hoppe. 2013. Farm size and the organization of US
crop farming. US Department of Agriculture, Economic Research Service.
McGeehan, S.L., and D.V. Naylor. 1988. Automated instrumental analysis of carbon and
nitrogen in plant and soil samples. Comm. Soil Sci. Plant Anal. 19:493-505.
Mehlich, A. 1978. New extractant for soil test evaluation of phosphorus, potassium,
magnesium, calcium, sodium, manganese, and zinc. Common. Soil Sci. Plant
Anal. 9:477-492.
Mehlich, A. 1984. Mehlich-3 soil test extractant: a modification of Mehlich-2 extractant.
Commun. Soil Sci. Plant Anal. 15:1409-1416.
Morrison, J.E., Jr., T.J. Gerik, F.W. Chichester, J.R. Martin, and J.M Chandler. 1990. A
no-tillage arming system for clay soils. J. Prod. Agric. 3:219-227.
Nielsen, D.C., Unger, P.W. and Miller, P.R. 2005. Efficient water use in dryland
cropping systems in the Great Plains. Agron. J. 97:364-372.
NOAA National Climatic Data Center. 2014. Daily Summaries for Corpus Christi, TX.
http://www.ncdc.noaa.gov/cdo-web/results (accessed 10 Dec. 2014).
Oades, J.M. 1984. Soil organic matter and structural stability: mechanisms and
implications for management. Plant Soil. 76:319-337.

35
Pimentel, D., C. Harvey, P. Resosudarmo, K. Sinclair, D. Kurz, M. McNair, S. Crist, L.
Shpritz, L. Fitton, R. Saffouri, and R. Blair. 1995. Environmental and economic
costs of soil erosion and conservation benefits. Science. 267:1117-1123.
Potter, K.N., and F.W. Chishester. 1993. Physical and chemical properties of a vertisol
with continuous controlled-traffic, no-till management. Tran. ASAE. 36:95-99.
Radford, B.J., D.F. Yule, D. McGarry, and C. Playford. 2007. Amelioration of soil
compaction can take 5 years on a Vertisol under no till in the semi-arid
subtropics. Soil and Tillage Res. 97: 249-255.
Raper, R.L. 2005. Agricultural traffic impacts on soil. J. of Terramechanics, 42: 259-
280.
Reeves, D.W. 1994. Cover crops and rotations. Adv. Soil Sci.: Crops Residue
Management. pp. 125-172.
Rhoades, J.D. 1982. Soluble salts. In: A.L. Page et al., editors Methods of Soil Analysis:
Part 2. Agronomy Monography. 2nd ed. ASA and SSSA, Madison, WI. p. 167-
178.
Rhoton, F.E. 2000. Influence of time on soil response to no-till practices. Soil Sci. Soc.
Am. J. 64:700-709.
Ribera, L.A. 2013. Associate Professor and Extension Economist, Texas A&M
University. Personal communication.
Russell, L.A. 2016. District 11 Texas Crop and Livestock Budgets. Texas A&M
AgriLife Ext. Serv. http://www.agecoext.tamu.edu (accessed 15 June 2016).
36
Sainju, U.M., T.C. Caesar-TonThat, and J.D. Jabro. 2009. Carbon and nitrogen fractions
in dryland soil aggregates affected by long-term tillage and cropping sequence.
Soil Sci. Soc. Am J. 73:1488-1495.
SAS Institute. 2012. JMP Basic Analysis and Graphing. Version 12. SAS Inst., Cary.
NC, USA.
Schofield, R.K., and A.W. Taylor. 1955. The measurement of soil pH. Soil Sci. Soc.
Am. J. 19:164-167.
Sharma, K. L., J. K. Grace, P.K. Mishra, B. Venkateswarlu, M.B. Nagdeve, V.V.
Gabhane, G M. Sankar, G.R. Korwar, G.R. Chary, C.S. Rao, C. P.N. Gajbhiye,
M. Madhavi, U.K. Mandal, Sprinivas, and K. Ramachandran. 2011. Effect of soil
and nutrient-management treatments on soil quality indices under cotton-based
production system in rainfed semi-arid tropical vertisol. Common. Soil Sci. Plant
Anal. 42:1298-1315.
Sherrod, L.A., G. Dunn, G.A. Peterson, and R.L. Kolberg. 2002. Inorganic carbon
analysis by modified pressure-calcimeter method. Soil Sci. Soc. Am. J. 66:299-
305.
Shaver, T.M., G.A. Peterson, L.R. Ahuja, D.G. Westfall, L.A. Sherrod, and G. Dunn.
2002. Surface soil physical properties after twelve years of dryland no-till
management. Soil Sci. Soc. Am. J. 66:1296-1303.
Triplett, G.B. and W.A. Dick, 2008. No-tillage crop production: a revolution in
agriculture! Agron. J. 100:S-153.

37
Unger, P.W. 1990. Conservation tillage systems. In dryland strategies for sustainability.
Adv. Agron. 13:27-67.
USDA National Agriculture Statistic Service. 2012. Census of Agriculture U.S.
Summary and State Report. http://www.agcensus.usda.gov (accessed 16 Feb.
2015).
USDA National Agriculture Statistic Service. 2016. Quick stats.
https://www.quickstats.nass.usda.gov (accessed 11 May 2016).
USDA-Natural Resource Conservation Service. 1996. Soil quality indicators: aggregate
stability. http://www.nrcs.usda.gov (accessed 22 June 2015).
USDA-Natural Resource Conservation Service. 2010. Keys to Soil Taxonomy. 11 ed. p.
287-298.
Varner, B. T., F. M. Epplin, and G. L. Strickland. 2011. Economics of no-till versus
tilled dryland cotton, grain sorghum, and wheat. Agron. J. 103(5), pp. 1329-1338.
Verhulst, N., V. Nelissen, N. Jespers, H. Haven, K.D. Sayre, D. Raes, J. Deckers, and B.
Govaerts. 2011. Soil water content, maize yield and its stability as affected by
tillage and crop residue management in rainfed semi-arid highlands. Plant and
Soil. 344:73-85.
Voorhees, W.B., and M.J. Lindstrom. 1984. Long-term effects of tillage method on soil
tilth independent of wheel traffic compaction. Soil Sci. Soc. Am. J. 48:152-156.
West, T.O., and G. Marland. 2002. A synthesis of carbon sequestration, carbon
emissions, and net carbon flux in agriculture: comparing tillage practices in the
United States. Agric. Ecosyst. Environ. 91:217-232.

38
Wilding, L.P. and R. Puentes. 1988. Vertisols: their distribution, properties,
classification and management. Publ. Soil Management Support Services,
Technical Mono. 18:193. USDA-NRCS, Washington DC.

39
APPENDIX A
TREATMENTS

40
Conventional Tilled Plot Management
Tillage
Sweep cultivated cotton and sorghum (one pass)
Disked sorghum (one pass)
Sweep plowed cotton and sorghum (one pass)
Bedded cotton and sorghum rows (one pass)
Average Chemical Application
Dual II Magnum-sorghum (weeds)
Glyphosate-cotton (weeds)
Centric-cotton and sorghum (fleahopper)
Imidacloprid with Non-Ionic Surfactant (fleahopper)
Transform WG with Crop Oil Concentrate-sorghum (sugar cane aphid)
Ginstar defoliant-cotton
2-4, D Amine with Crop Oil Concentrate-cotton (seedlings)
No-Till Plot Management
Average Chemical Application
Dual II Magnum-sorghum (weeds)
Glyphosate-cotton and sorghum (weeds)
Centric-cotton and sorghum (fleahopper)
Imidacloprid with Non-Ionic Surfactant (fleahopper)
Transform WG with Crop Oil Concentrate-sorghum (sugar cane aphid)
Ginstar defoliant-cotton
2-4, D Amine with Crop Oil Concentrate-cotton (seedlings)
Glyphosate-sorghum (stalks and weeds)

41
APPENDIX B
STATISTICAL ANALYSIS

42
Crop Analysis of Variance and Least Square Means
Dependent Variable: Cotton Yield
Source DF
Sum of
Squares Mean Square F Ratio
Model 9 20237344 2248.594 51.8835
Error 30 1300179 43.339 Prob > F
Corrected total 39 21537523 < 0.0001*
RSquare RSquare Adj Root MSE Yield Mean
0.939632 0.921522 208.1809 1339.596
Source Nparm DF
Sum of
Squares F Ratio Prob > F
Trt 1 1 298135 6.8791 0.0136*
Year 4 4 18999261 109.5961 < 0.0001*
Trt*Year 4 4 939947 5.4220 0.0021*
Level LSMean Standard Error
CT, 2011 1084.2475 96.143637
CT, 2012 1762.5650 87.510164
CT, 2013 87.0625 45.733641
CT, 2014 1074.2425 57.527484
CT, 2015 2258.1950 178.52563
NT, 2011 1128.2000 96.143637
NT, 2012 1693.9775 87.510164
NT, 2013 761.1850 45.733641
NT, 2014 921.2600 57.527484
NT, 2015 2625.0200 178.52563

43
Dependent Variable: Cotton Lint %
Source DF
Sum of
Squares Mean Square F Ratio
Model 9 1343.5954 149.288 273.7897
Error 30 16.3580 0.545 Prob > F
Corrected total 39 1359.9534 < 0.0001*
RSquare RSquare Adj Root MSE Lint % Mean
0.987972 0.984363 0.738422 32.297
Source Nparm DF
Sum of
Squares F Ratio Prob > F
Trt 1 1 0.3842 0.7045 0.4079*
Year 4 4 1340.9816 614.8283 < 0.0001*
Trt*Year 4 4 2.2297 1.0223 0.4117*
Level LSMean Standard Error
CT, 2011 28.012500 0.23614845
CT, 2012 28.540000 0.17226793
CT, 2013 26.087500 0.37875155
CT, 2014 38.782500 0.41807489
CT, 2015 39.572500 0.52822324
NT, 2011 27.935000 0.23614845
NT, 2012 28.040000 0.17226793
NT, 2013 26.985000 0.37875155
NT, 2014 38.995000 0.41807489
NT, 2015 40.020000 0.52822324

44
Dependent Variable: Cotton Bolls
Source DF
Sum of
Squares Mean Square F Ratio
Model 3 1371.0469 457.016 25.7247
Error 12 213.1875 17.766 Prob > F
Corrected total 15 1584.2344 < 0.0001*
RSquare RSquare Adj Root MSE Boll Mean
0.865432 0.83179 4.214929 19.96875
Source Nparm DF
Sum of
Squares F Ratio Prob > F
Trt 1 1 28.8906 1.6262 0.2264
Year 1 1 1341.3906 75.5048 < 0.0001*
Trt*Year 1 1 0.7656 0.0431 0.8390
Level LSMean Standard Error
CT, 2014 12.375000 1.4781393
CT, 2015 30.250000 2.5880334
NT, 2014 9.250000 1.4781393
NT, 2015 28.000000 2.5880334

45
Dependent Variable: Sorghum Yield
Source DF
Sum of
Squares Mean Square F Ratio
Model 7 57668773 8238396 10.9722
Error 24 18020168 750840 Prob > F
Corrected total 31 75688942 < 0.0001*
RSquare RSquare Adj Root MSE Yield Mean
0.761918 0.692478 866.5104 3266.418
Source Nparm DF
Sum of
Squares F Ratio Prob > F
Trt 1 1 11931 0.0159 0.9007
Year 3 3 47939259 21.2825 < 0.0001*
Trt*Year 3 3 7838475 3.4799 0.0315*
Level LSMean Standard Error
CT, 2011 3992.0870 198.33778
CT, 2012 2959.0715 397.75853
CT, 2013 0 0
CT, 2014 1169.4444 181.63604
CT, 2015 4853.6033 715.57743
NT, 2011 4120.0242 198.33778
NT, 2012 4421.8103 397.75853
NT, 2013 0 0
NT, 2014 1060.7626 234.49112
NT, 2015 3527.3673 715.57743
46
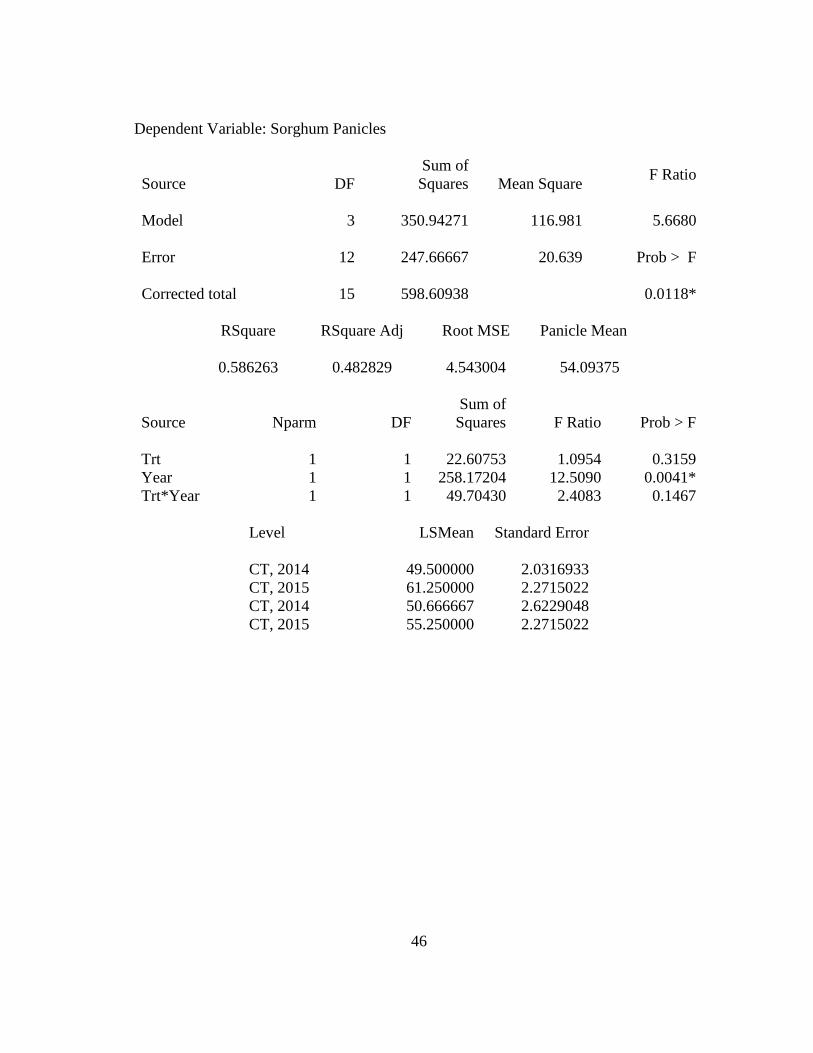
Dependent Variable: Sorghum Panicles
Source DF
Sum of
Squares Mean Square F Ratio
Model 3 350.94271 116.981 5.6680
Error 12 247.66667 20.639 Prob > F
Corrected total 15 598.60938 0.0118*
RSquare RSquare Adj Root MSE Panicle Mean
0.586263 0.482829 4.543004 54.09375
Source Nparm DF
Sum of
Squares F Ratio Prob > F
Trt 1 1 22.60753 1.0954 0.3159
Year 1 1 258.17204 12.5090 0.0041*
Trt*Year 1 1 49.70430 2.4083 0.1467
Level LSMean Standard Error
CT, 2014 49.500000 2.0316933
CT, 2015 61.250000 2.2715022
CT, 2014 50.666667 2.6229048
CT, 2015 55.250000 2.2715022

47
Soil Analysis of Variance and Least Square Means
Dependent Variable: Gravimetric Soil Moisture
Source DF
Sum of
Squares Mean Square F Ratio
Model 7 1402.9885 200.427 10.1789
Error 113 2225.0265 19.691 Prob > F
< 0.0001*
Corrected total 120 3628.0151
RSquare RSquare Adj Root MSE GSM Mean
0.38671 0.348718 4.437398 13.46269
Source Nparm DF
Sum of
Squares F Ratio Prob > F
Trt 1 1 19.1120 0.9706 0.3266
Year 1 1 1129.7702 57.3764 < 0.0001*
Depth 1 1 24.7927 1.2591 0.2642
Trt*Year*Depth 1 1 0.7641 0.0388 0.8442
Level LSMean Standard Error
CT, 0-15, 2014 11.625583 1.2809664
CT, 0-15, 2015 15.408313 1.2809664
CT, 15-30, 2014 9.536063 1.2809664
CT, 15-30, 2015 18.357563 1.2809664
NT, 0-15, 2014 10.339615 1.2809664
NT, 0-15, 2015 14.133375 1.2809664
NT, 15-30, 2014 9.531563 1.2809664
NT, 15-30, 2015 17.724563 1.2809664

48
Dependent Variable: Volumetric Water Content
Source DF
Sum of
Squares Mean Square F Ratio
Model 3 247.93801 82.6460 5.1904
Error 28 445.83804 15.9228 Prob > F
Corrected total 31 693.77605 0.0056*
RSquare RSquare Adj Root MSE GWC Mean
0.357375 0.288522 3.990337 28.73281
Source Nparm DF
Sum of
Squares F Ratio Prob > F
Trt 1 1 17.39025 1.0922 0.3049
Depth 1 1 217.93500 13.6870 0.0009*
Trt*Depth 1 1 12.61275 0.7921 0.3810
Level LSMean Standard Error
CT, 0-15, 2015 26.013750 1.4107971
CT, 0-15, 2015 29.977500 1.4107971
NT, 15-30, 2015 26.232500 1.4107971
NT, 15-30, 2015 32.707500 1.4107971

49
Dependent Variable: Porosity
Source DF
Sum of
Squares Mean Square F Ratio
Model 3 0.00292500 0.000975 1.7036
Error 28 0.01602500 0.000572 Prob > F
Corrected total 31 0.01895000 0.1890
RSquare RSquare Adj Root MSE Porosity Mean
0.154354 0.063749 0.023923 0.53875
Source Nparm DF
Sum of
Squares F Ratio Prob > F
Trt 1 1 0.00020000 0.3495 0.5592
Depth 1 1 0.00061250 1.0702 0.3098
Trt*Depth 1 1 0.00211250 3.6911 0.0649
Level LSMean Standard Error
CT, 0-15, 2015 0.54875000 0.00845814
CT, 0-15, 2015 0.52375000 0.00845814
NT, 15-30, 2015 0.53750000 0.00845814
NT, 15-30, 2015 0.54500000 0.00845814

50
Dependent Variable: Bulk Density
Source DF
Sum of
Squares Mean Square F Ratio
Model 3 0.02380938 0.007936 2.1086
Error 28 0.10538750 0.003764 Prob > F
Corrected total 31 0..12919688 0.1216
RSquare RSquare Adj Root MSE
Bulk Density
Mean
0.184288 0.09689 0.06135 1.224688
Source Nparm DF
Sum of
Squares F Ratio Prob > F
Trt 1 1 0.00195313 0.5189 0.4773
Depth 1 1 0.00427813 1.1366 0.2955
Trt*Depth 1 1 0.01757813 4.6703 0.0394*
Level LSMean Standard Error
CT, 0-15, 2015 1.1975000 0.02169055
CT, 0-15, 2015 1.2675000 0.02169055
NT, 15-30, 2015 1.2287500 0.02169055
NT, 15-30, 2015 1.2050000 0.02169055

51
Dependent Variables: pH
Source DF
Sum of
Squares Mean Square F Ratio
Model 5 1.9868977 0.397380 25.7343
Error 122 1.8838766 0.015442 Prob > F
Corrected total 127 3.8707742 < 0.0001*
RSquare RSquare Adj Root MSE pH Mean
0.513308 0.493361 0.124264 8.283672
Source Nparm DF
Sum of
Squares F Ratio Prob > F
Trt 1 1 0.0315633 2.0440 0.1554
Depth 1 1 0.4197570 27.1835 < 0.0001*
Year 1 1 1.5334383 99.3056 < 0.0001*
Trt*Depth*Year 1 1 0.0010695 0.0693 0.7929
Level LSMean Standard Error
CT, 0-15, 2014 8.1384375 0.02690401
CT, 0-15, 2015 8.3515625 0.02690401
CT, 15-30, 2014 8.2414063 0.02690401
CT, 15-30, 2015 8.4660938 0.02690401
NT, 0-15, 2014 8.0954688 0.02690401
NT, 0-15, 2015 8.3201563 0.02690401
NT, 15-30, 2014 8.2215625 0.02690401
NT, 15-30, 2015 8.4346875 0.02690401

52
Dependent Variable: ECw
Source DF
Sum of
Squares Mean Square F Ratio
Model 5 433520.19 86704.0 26.7634
Error 122 395237.78 3239.7 Prob > F
Corrected total 127 828757.97 < 0.0001*
RSquare RSquare Adj Root MSE ECw Mean
0.523096 0.503551 56.91796 362.5156
Source Nparm DF
Sum of
Squares F Ratio Prob > F
Trt 1 1 840.50 0.2594 0.6114
Depth 1 1 140317.53 43.3125 < 0.0001*
Year 1 1 288610.03 89.0867 < 0.0001*
Trt*Depth*Year 1 1 3240.13 1.0001 0.3193
Level LSMean Standard Error
CT, 0-15, 2014 386.48438 12.323099
CT, 0-15, 2015 281.45313 12.323099
CT, 15-30, 2014 438.64063 12.323099
CT, 15-30, 2015 353.73438 12.323099
NT, 0-15, 2014 367.29688 12.323099
NT, 0-15, 2015 282.39063 12.323099
NT, 15-30, 2014 447.57813 12.323099
NT, 15-30, 2015 342.54688 12.323099

53
Dependent Variable NO3-N
Source DF
Sum of
Squares Mean Square F Ratio
Model 5 1663.1756 219.498 7.6788
Error 122 5284.8703 40.382 Prob > F
Corrected total 127 6948.0459 < 0.0001*
RSquare RSquare Adj Root MSE NO3-N Mean
0.239373 0.2082 6.581687 9.132969
Source Nparm DF
Sum of
Squares F Ratio Prob > F
Trt 1 1 20.8981 0.4824 0.4886
Depth 1 1 29.5153 5.2983 0.0230*
Year 1 1 1365.8151 31.5295 < 0.0001*
Trt*Depth*Year 1 1 20.3203 0.4691 0.4947
Level LSMean Standard Error
CT, 0-15, 2014 12.319062 1.4249771
CT, 0-15, 2015 4.989063 1.4249771
CT, 15-30, 2014 13.288125 1.4249771
CT, 15-30, 2015 7.551875 1.4249771
NT, 0-15, 2014 9.801875 1.4249771
NT, 0-15, 2015 4.065625 1.4249771
NT, 15-30, 2014 14.189062 1.4249771
NT, 15-30, 2015 6.859063 1.4249771

54
Dependent Variable: P
Source DF
Sum of
Squares Mean Square F Ratio
Model 5 6865.373 1373.07 26.0656
Error 122 6426.668 52.68 Prob > F
Corrected total 127 13292.041 < 0.0001*
RSquare RSquare Adj Root MSE P Mean
0.516503 0.496687 7.257934 17.95687
Source Nparm DF
Sum of
Squares F Ratio Prob > F
Trt 1 1 31.2159 0.5926 0.4429
Depth 1 1 6632.5395 125.9081 < 0.0001*
Year 1 1 135.4637 2.5716 0.1114*
Trt*Depth*Year 1 1 65.8479 1.2500 0.2657
Level LSMean Standard Error
CT, 0-15, 2014 25.911656 1.5713888
CT, 0-15, 2015 25.288656 1.5713888
CT, 15-30, 2014 13.047234 1.5713888
CT, 15-30, 2015 9.555266 1.5713888
NT, 0-15, 2014 26.456328 1.5713888
NT, 0-15, 2015 22.964359 1.5713888
NT, 15-30, 2014 10.527219 1.5713888
NT, 15-30, 2015 9.904219 1.5713888

55
Dependent Variable: K
Source DF
Sum of
Squares Mean Square F Ratio
Model 5 67306.54 13461.3 3.4863
Error 122 471072.54 3861.3 Prob > F
Corrected total 127 538379.08 < 0.0056*
RSquare RSquare Adj Root MSE K Mean
0.125017 0.089157 62.13896 297.7723
Source Nparm DF
Sum of
Squares F Ratio Prob > F
Trt 1 1 1615.606 0.4184 0.5189
Depth 1 1 64290.974 16.6503 < 0.0001*
Year 1 1 655.881 0.1699 0.6810
Trt*Depth*Year 1 1 716.775 0.1856 0.6673
Level LSMean Standard Error
CT, 0-15, 2014 320.79916 13.453479
CT, 0-15, 2015 311.53909 13.453479
CT, 15-30, 2014 272.16716 13.453479
CT, 15-30, 2015 272.37266 13.453479
NT, 0-15, 2014 324.09553 13.453479
NT, 0-15, 2015 324.30103 13.453479
NT, 15-30, 2014 283.08172 13.453479
NT, 15-30, 2015 273.82166 13.453479

56
Dependent Variable: Ca
Source DF
Sum of
Squares Mean Square F Ratio
Model 5 69374185 13874837 16.5311
Error 122 102396756 839317.67 Prob > F
Corrected total 127 171770941 < 0.0001*
RSquare RSquare Adj Root MSE Ca Mean
0.403876 0.379445 916.1428 8202.314
Source Nparm DF
Sum of
Squares F Ratio Prob > F
Trt 1 1 731249 0.8712 0.3525
Depth 1 1 60332311 71.8826 < 0.0001*
Year 1 1 7525406 8.9661 < 0.0001*
Trt*Depth*Year 1 1 226640 0.2700 0.6043
Level LSMean Standard Error
CT, 0-15, 2014 7941.9608 198.35074
CT, 0-15, 2015 7372.8611 198.35074
CT, 15-30, 2014 9098.7767 198.35074
CT, 15-30, 2015 8697.9920 198.35074
NT, 0-15, 2014 7574.5164 198.35074
NT, 0-15, 2015 7173.7317 198.35074
NT, 15-30, 2014 9163.8867 198.35074
NT, 15-30, 2015 8594.7870 198.35074

57
Dependent Variable: Mg
Source DF
Sum of
Squares Mean Square F Ratio
Model 5 288064.08 57612.8 21.2759
Error 122 330362.17 2707.9 Prob > F
Corrected total 127 618426.25 < 0.0001*
RSquare RSquare Adj Root MSE Mg Mean
0.465802 0.443908 52.03736 458.2849
Source Nparm DF
Sum of
Squares F Ratio Prob > F
Trt 1 1 1688.74 0.6236 0.4312
Depth 1 1 257379.00 95.0479 < 0.0001*
Year 1 1 25158.41 9.2908 < 0.0001*
Trt*Depth*Year 1 1 3129.64 1.1558 0.2845
Level LSMean Standard Error
CT, 0-15, 2014 438.39220 11.266419
CT, 0-15, 2015 400.46348 11.266419
CT, 15-30, 2014 513.48138 11.266419
CT, 15-30, 2015 495.33156 11.266419
NT, 0-15, 2014 416.53356 11.266419
NT, 0-15, 2015 398.38375 11.266419
NT, 15-30, 2014 520.81098 11.266419
NT, 15-30, 2015 482.88227 11.266419

58
Dependent Variable: S
Source DF
Sum of
Squares Mean Square F Ratio
Model 5 924.9910 184.998 9.9923
Error 122 2258.7264 15.514 Prob > F
Corrected total 127 3183.7174 < 0.0001*
RSquare RSquare Adj Root MSE S Mean
0.290538 0.261462 4.302807 14.56943
Source Nparm DF
Sum of
Squares F Ratio Prob > F
Trt 1 1 11.86149 0.6407 0.4250
Depth 1 1 479.71370 925.9107 < 0.0001*
Year 1 1 414.65160 22.3965 < 0.0001*
Trt*Depth*Year 1 1 18.32319 0.9897 0.3218
Level LSMean Standard Error
CT, 0-15, 2014 14.448609 0.93158511
CT, 0-15, 2015 10.092203 0.93158511
CT, 15-30, 2014 17.681125 0.93158511
CT, 15-30, 2015 14.838125 0.93158511
NT, 0-15, 2014 14.418125 0.93158511
NT, 0-15, 2015 11.575125 0.93158511
NT, 15-30, 2014 18.929266 0.93158511
NT, 15-30, 2015 14.572859 0.93158511

59
Dependent Variable: Na
Source DF
Sum of
Squares Mean Square F Ratio
Model 5 1274429.9 254886 26.5016
Error 122 1173364.7 9618 Prob > F
Corrected total 127 2447794.6 < 0.0001*
RSquare RSquare Adj Root MSE Na Mean
0.520644 0.500998 98.07009 247.2106
Source Nparm DF
Sum of
Squares F Ratio Prob > F
Trt 1 1 718.9 0.0748 0.7850
Depth 1 1 1149241.9 119.4918 < 0.0001*
Year 1 1 115358.0 11.9943 < 0.0001*
Trt*Depth*Year 1 1 9025.5 0.9384 0.3346
Level LSMean Standard Error
CT, 0-15, 2014 194.06089 21.232798
CT, 0-15, 2015 117.22548 21.232798
CT, 15-30, 2014 365.14147 21.232798
CT, 15-30, 2015 321.89459 21.232798
NT, 0-15, 2014 170.89216 21.232798
NT, 0-15, 2015 127.64528 21.232798
NT, 15-30, 2014 378.83036 21.232798
NT, 15-30, 2015 301.99495 21.232798
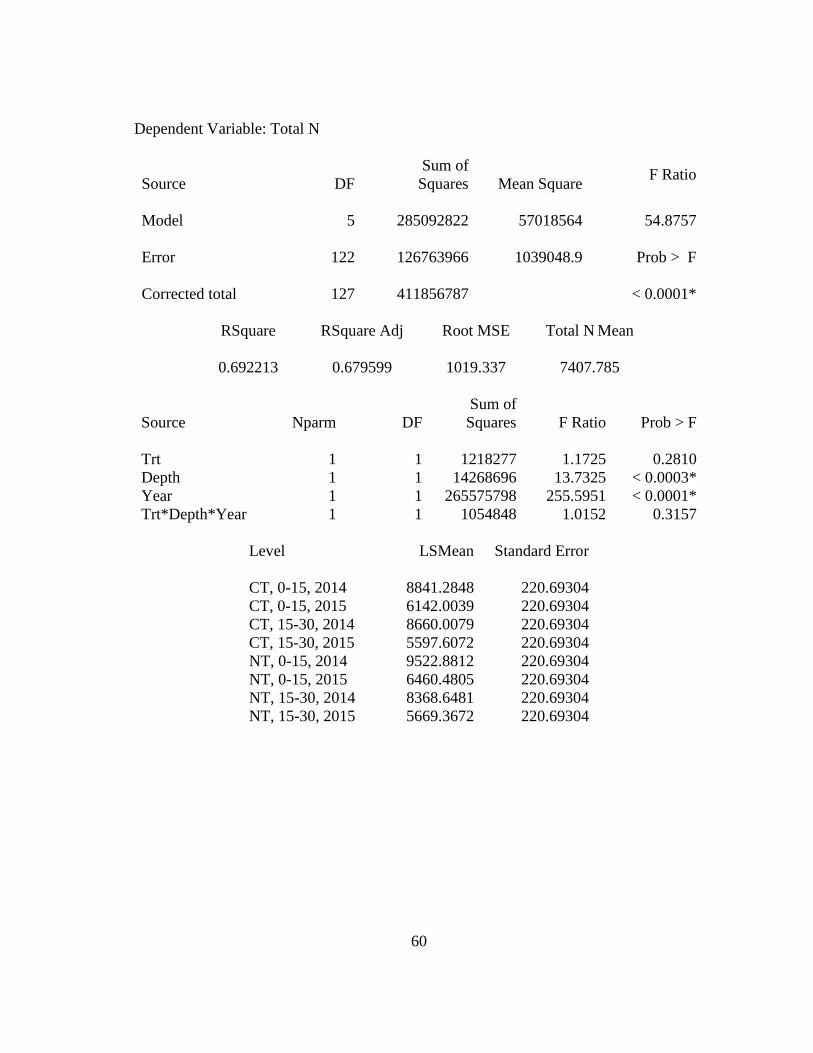
60
Dependent Variable: Total N
Source DF
Sum of
Squares Mean Square F Ratio
Model 5 285092822 57018564 54.8757
Error 122 126763966 1039048.9 Prob > F
Corrected total 127 411856787 < 0.0001*
RSquare RSquare Adj Root MSE Total N Mean
0.692213 0.679599 1019.337 7407.785
Source Nparm DF
Sum of
Squares F Ratio Prob > F
Trt 1 1 1218277 1.1725 0.2810
Depth 1 1 14268696 13.7325 < 0.0003*
Year 1 1 265575798 255.5951 < 0.0001*
Trt*Depth*Year 1 1 1054848 1.0152 0.3157
Level LSMean Standard Error
CT, 0-15, 2014 8841.2848 220.69304
CT, 0-15, 2015 6142.0039 220.69304
CT, 15-30, 2014 8660.0079 220.69304
CT, 15-30, 2015 5597.6072 220.69304
NT, 0-15, 2014 9522.8812 220.69304
NT, 0-15, 2015 6460.4805 220.69304
NT, 15-30, 2014 8368.6481 220.69304
NT, 15-30, 2015 5669.3672 220.69304
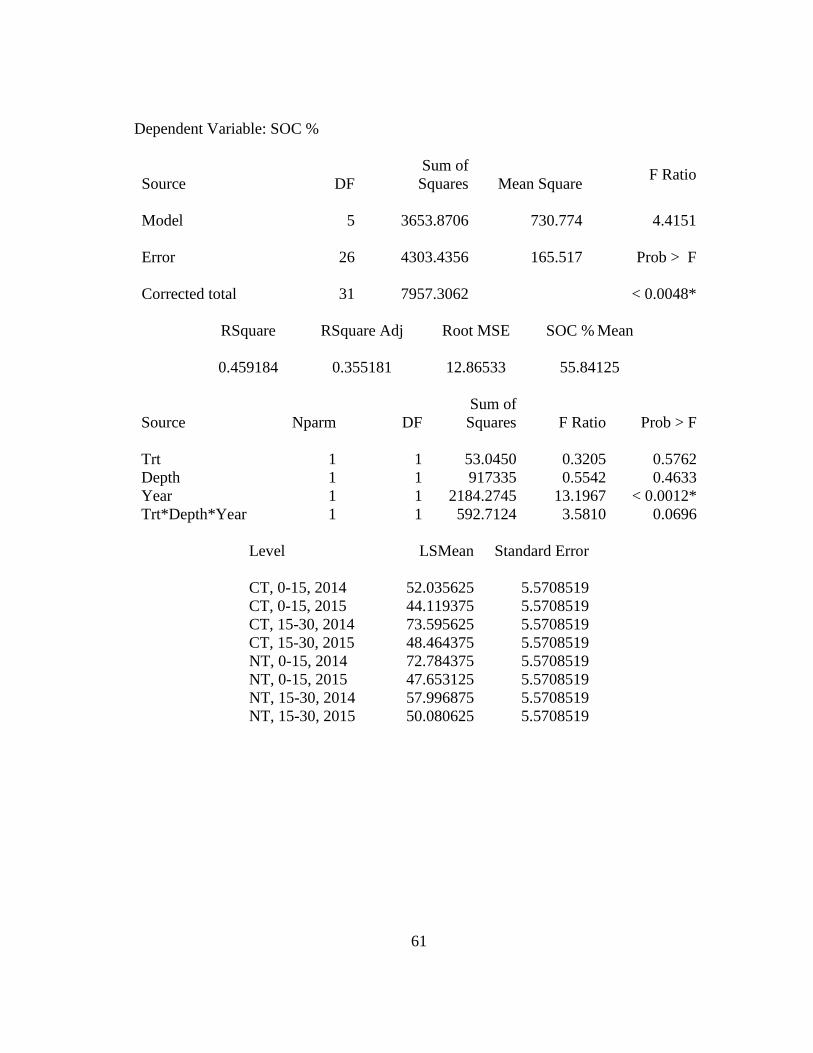
61
Dependent Variable: SOC %
Source DF
Sum of
Squares Mean Square F Ratio
Model 5 3653.8706 730.774 4.4151
Error 26 4303.4356 165.517 Prob > F
Corrected total 31 7957.3062 < 0.0048*
RSquare RSquare Adj Root MSE SOC % Mean
0.459184 0.355181 12.86533 55.84125
Source Nparm DF
Sum of
Squares F Ratio Prob > F
Trt 1 1 53.0450 0.3205 0.5762
Depth 1 1 917335 0.5542 0.4633
Year 1 1 2184.2745 13.1967 < 0.0012*
Trt*Depth*Year 1 1 592.7124 3.5810 0.0696
Level LSMean Standard Error
CT, 0-15, 2014 52.035625 5.5708519
CT, 0-15, 2015 44.119375 5.5708519
CT, 15-30, 2014 73.595625 5.5708519
CT, 15-30, 2015 48.464375 5.5708519
NT, 0-15, 2014 72.784375 5.5708519
NT, 0-15, 2015 47.653125 5.5708519
NT, 15-30, 2014 57.996875 5.5708519
NT, 15-30, 2015 50.080625 5.5708519

62
Dependent Variable: Surface Penetrometer Resistance
Source DF
Sum of
Squares Mean Square F Ratio
Model 3 348.78053 116.260 17.1938
Error 28 189.32902 6.762 Prob > F
Corrected total 31 538.10955 < 0.0001*
RSquare RSquare Adj Root MSE SPR Mean
0.648159 0.610462 2.600337 11.797929
Source Nparm DF
Sum of
Squares F Ratio Prob > F
Trt 1 1 45.28800 6.6977 0.0151*
Year 1 1 90.89051 13.4419 0.0010*
Trt*Year 1 1 212.60202 31.4419 < 0.0001*
Level LSMean Standard Error
CT, 2014 9.715417 0.91935783
CT, 2015 11.499881 0.91935783
CT, 2014 17.249821 0.91935783
CT, 2015 8.724048 0.91935783