ministry of devolution and the arid and semi arid lands
TRANSCRIPT

MINISTRY OF DEVOLUTION AND THE ARID AND SEMI ARID LANDS
State Department for Development of Arid and Semi-Arid Lands
ENDING DROUGHT EMERGENCIES
IN KENYA Progress Report
2018-2019

ENDING DROUGHT EMERGENCIES IN KENYA
E n d i n g D r o u g h t E m e r g e n c i e s
Printed with financial support of the European Union through the Ending Drought Emergencies: Support to Drought Risk Management and
Coordination (EDE:DRMC) project. However, the content does not in any way reflect the opinion of the European Union.

Progress Report for the 2018-2019
E n d i n g D r o u g h t E m e r g e n c i e s
Progress Report
2018-2019
ENDING DROUGHT EMERGENCIES IN KENYA
ii | E n d i n g D r o u g h t E m e r g e n c i e s
ENDING DROUGHT EMERGENCIES IN KENYA
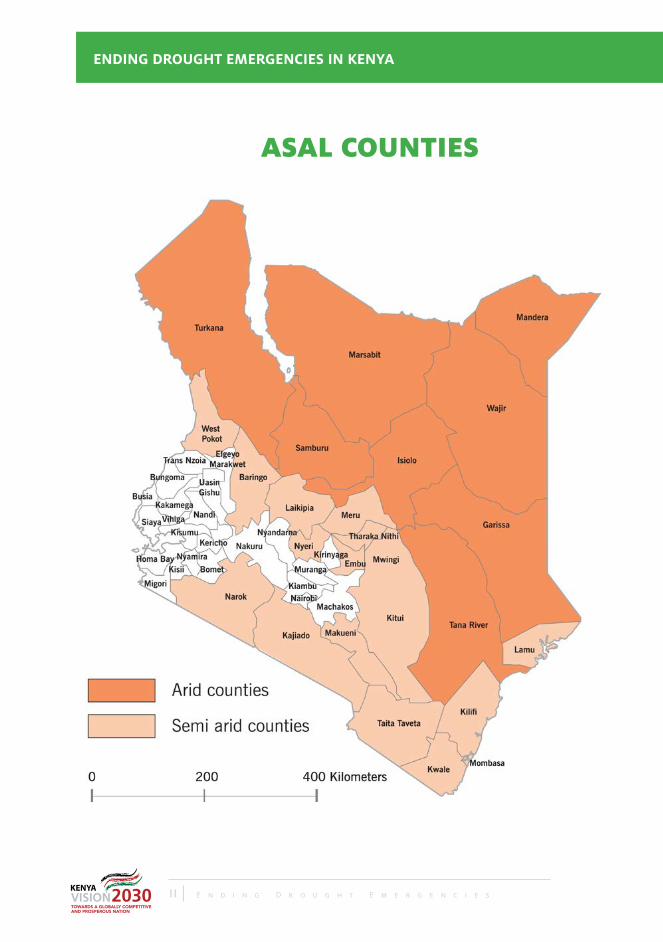
ASAL COUNTIES

E n d i n g D r o u g t E m e r g e n c i e s | iiiii | E n d i n g D r o u g h t E m e r g e n c i e s
Progress Report for the 2018-2019
TABLE OF CONTENTS TABLE OF CONTENTS ...................................................................................................................................................... i ACRONYMS AND ABBREVIATIONS .................................................................................................................................ii LIST OF TABLES ................................................................................................................................................................iii LIST OF FIGURES ..............................................................................................................................................................iv ACKNOWLEDGEMENT .....................................................................................................................................................v ABSTRACT ........................................................................................................................................................................vi
1.0 BACKGROUND ................................................................................................................................................................. 71.1. International Strategies of Managing Disaster Risks .................................................................................................. 7
1.2. Ending Drought Emergencies Initiative in Kenya ....................................................................................................... 8
1.3. Organization of this Report ........................................................................................................................................ 9
2.0 METHODOLOGY ............................................................................................................................................................ 102.1 Data collection ......................................................................................................................................................... 10
2.2 Important Periods .................................................................................................................................................... 10
2.3 Limitation ................................................................................................................................................................. 10
3. PROGRESS TOWARDS ENDING DROUGHT EMERGENCIES ...................................................................................... 113.1 Effective Response to Peace and Security Threats .................................................................................................. 11
3.1.1 Strengthening peace infrastructure ........................................................................................................................ 11
3.1.2 Reducing inter-community conflicts ....................................................................................................................... 12
3.1.3 Mainstreaming peacebuilding in planning ............................................................................................................. 13
3.2 Climate Proofed Infrastructure ................................................................................................................................. 13
3.2.1 Access to electricity ................................................................................................................................................ 13
3.2.2 Access to clean and safe water and sanitation services ......................................................................................... 14
3.2.3 Climate proofed road and water infrastructure ...................................................................................................... 15
3.3 Access to Improved Health and Education Services ................................................................................................ 15
3.3.1 Access to education ............................................................................................................................................... 15
3.3.2 Quality of education ............................................................................................................................................... 16
3.3.3 Access to health services ........................................................................................................................................ 18
3.4 Sustaining Livelihoods .............................................................................................................................................. 19
3.4.1 Production of milk, hides and skins ........................................................................................................................ 20
3.4.2 Fish, chicken, apiculture and crop production ........................................................................................................ 20
3.4.3 Livestock marketing ................................................................................................................................................ 21
3.4.4 Improved animal health .......................................................................................................................................... 21
3.4.5 Governance of land tenure and management of natural resources ....................................................................... 22
3.5 Building Resilience to Drought and Climate Change .............................................................................................. 22
3.5.1 Integration of drought risk reduction, climate change adaptation and social protection in planning ................... 22
3.5.2 Enhancing early warning ........................................................................................................................................ 24

iv | E n d i n g D r o u g h t E m e r g e n c i e s
ENDING DROUGHT EMERGENCIES IN KENYA
3.5.3 Adoption of innovations ......................................................................................................................................... 24
3.5.4 Enhanced efficiency of drought response mechanisms ......................................................................................... 25
3.5.5 Scalability mechanisms ........................................................................................................................................... 25
3.5.6 Policy and legal frameworks ................................................................................................................................... 26
3.6 Institutional Development and Knowledge Management ....................................................................................... 28
3.6.1 Knowledge generation and utilization .................................................................................................................... 28
3.6.2 Knowledge sharing ................................................................................................................................................. 28
3.6.3 Management and accountability structures............................................................................................................ 28
4.0 OPPORTUNITIES, CHALLENGES AND RECOMMENDATIONS .................................................................................... 304.1 Opportunities ........................................................................................................................................................... 30
4.2 Challenges ............................................................................................................................................................... 31
4.3 Recommendations ................................................................................................................................................... 32

E n d i n g D r o u g t E m e r g e n c i e s | viv | E n d i n g D r o u g h t E m e r g e n c i e s
Progress Report for the 2018-2019
ACRONYMS AND ABBREVIATIONS ADR Alternative Dispute Resolution
ASAL Arid and Semi-Arid Land
ASF ASAL Stakeholder Forum
CCA Climate Change Adaptation
CCCF County Climate Change Fund
CIDP County Integrated Development Plan
CPF Common Programme Framework
CPP Country Program Paper
CSGs County Steering Groups
DCF Drought Contingency Fund
DRM Drought Risk Management
DRR Drought Risk Reduction
ECDE Early Childhood Development Education
EDE Ending Drought Emergencies
EMIS Education Management Information System
EU European Union
HFA Hyogo Framework for Action
HSNP Hunger Safety Net Programme
ICT Information and Communications Technology
IDDRSI Intergovernmental Authority on Development Drought Disaster Resil-ience and Sustainability Initiative
IGAD Intergovernmental Authority on Development
IMAM Integrated Management of Acute Malnutrition
IPC Integrated phase classification maps
KCPE Kenya Certificate of Primary Education
KCSE Kenya Certificate of Secondary Education

vi | E n d i n g D r o u g h t E m e r g e n c i e s
ENDING DROUGHT EMERGENCIES IN KENYA
KFSSG Kenya Food Security Steering Group
KMD Kenya Meteorological Department
KM&IS knowledge Management and Information Sharing
M & E Monitoring and Evaluation
MTP Medium Term Plan
NDEF National Drought Emergency Fund
NDMA National Drought Management Authority
NPR National Police Reserve
NSC National Steering Committee
PDRR Platform for Disaster Risk Reduction
PLS Pastoralists Leadership Summit
PPG Pastoralists Parliamentary Group
SAIDI System Average Interruption Duration Index
SAIFI System Average Interruption Frequency Index
SP Social Protection
TVET Technical and Vocational Education and Training
TWG Technical Working Group
UN United Nations
WASH Water, Sanitation and Hygiene

E n d i n g D r o u g t E m e r g e n c i e s | viivi | E n d i n g D r o u g h t E m e r g e n c i e s
Progress Report for the 2018-2019
LIST OF TABLES Table 1: Climate proofed infrastructure ........................................................................................................15
Table 2: Access to education ........................................................................................................................16
Table 3: Mortality rates in Kenya ..................................................................................................................19
Table 4: Production of milk, hides and skins ................................................................................................20
Table 5: Livestock and crop production .......................................................................................................20
Table 6: Number of livestock sold in millions ...............................................................................................21
Table 8: Investment in response in Arid Counties for the 2018/2019 financial year (Ksh) ............................25
Table 9: Advances for strengthening coordination at county level ..............................................................29
LIST OF FIGURESFigure 1: Ending Drought Emergencies (EDE) framework ............................................................................8
Figure 2: Coordination Structure of Ending Drought Emergencies in Kenya .................................................9
Figure 3: Police to population ratio and number of national police reserve units established ....................11
Figure 4: Early warning reports acted upon .................................................................................................12
Figure 5: Number of reviewed and signed community peace accords ........................................................12
Figure 6: Connectivity to and reliability of electricity in Kenya ....................................................................13
Figure 7: Connectivity to and reliability of electricity in Kenya ....................................................................14
Figure 8: Access to clean, safe water and sanitation services ......................................................................14
Figure 9: Teacher and textbook to pupil ratio in ASALs ...............................................................................16
Figure 10: Performance in the Kenya Certificate of Primary Education Examination...................................17
Figure 11: Mean grades in Kenyan Certificate of Secondary Education ......................................................17
Figure 12: Proportion of childbirths attended by skilled personnel .............................................................18
Figure 13: Percent of children with severe acute malnutrition accessing treatment ....................................19
Figure 14: Number of households receiving regular cash transfers per month ...........................................23
Figure 15: Integration of DRM/CCA/SP on planning ...................................................................................24
Figure 16: Number of innovations adopted .................................................................................................25
Figure 17: Average number of households receiving emergency cash transfers .........................................26
1 | E n d i n g D r o u g h t E m e r g e n c i e s
ENDING DROUGHT EMERGENCIES IN KENYA
ACKNOWLEDGEMENT Special gratitude goes to the technical working group of the Ending Drought Emergencies for providing the data that formed the basis of this report as well as validation of the final draft and the European Union for providing financial support. The National Drought Management Authority coordinated the compiling of this report.
ABSTRACTDrought incidences are increasing owing to climate change. Arid and Semi-Arid Lands (ASALs) are the most affected. The Kenya Vision 2030, the ASAL Policy, the National Adaptation Plan, the Climate Change Act, 2016 are some of the guiding policies for ASALs transformation. The Ending Drought Emergencies (EDE) initiative is meant to actualize the potential of the ASALs through peace and security; climate proofed infrastructure; human capital; sustainable livelihoods; drought risk management; and institutional development & knowledge management pillars.
The Peace and Security Pillar earmarked strengthening the peace infrastructure. Notably, the ratio of police officers to civilians was 1:350, surpassing the UN recommended ratio of 1:450. Coupled with reliable early warning information, response time reduced by 67% in 2018 compared to 2014. In addition, 12 Counties included peace and security in their development plans. On climate-proofed infrastructure, reliability of access to electricity improved exponentially. System Average Interruption Duration Index decreased by 92% while the System Average Interruption Frequency Index reduced by 85% in 2018 compared 2014. On human capital pillar, net enrollment in Early Childhood Development Education, primary and secondary schools increased by 8%, 5% and 12%. Kenya achieved the global recommended nurse ratio of 1:10,000 people.
On resilience livelihoods, milk production increased by 63% in the reporting period. Production of hides and skins increased by 86% and 135% respectively
during the reporting period while fish production was 23% higher in 2018 compared to 2014. Production of indigenous chicken increased by 16% compared to baseline. To strengthen the integration of drought risk reduction in planning, National Drought Emergency Fund (NDEF) was established while County Climate Change Fund was implemented. In social protection, the implementation of the Hunger Safety Net Programme (HSNP) continued.
In drought risk management, use of technology reduced drought response time by 82% to eight days in 2018. The National Drought Management Authority and the State Department of Health have scalability mechanisms that they activate depending on the intensity of risk. Several opportunities exist in the ASALs including the county structure that links local communities with national government, abundance of sources of renewable energy (solar and wind), supporting policies (the ASAL policy) and tested technologies and systems.
Going forward, the country should prioritize strengthening early warning systems for early response; fast track the operationalization of pending policies and invest more in generating renewable energy. To ensure availability of reliable data, sectors need to centralize data/information storage and build capacity of personnel in the ASALs. Moreover, surveillance for and control of livestock and crop pests and diseases need strengthening. To strengthen implementation of Ending Drought Emergencies (EDE) initiative, NDMA should reconstitute the EDE TWG as per the Common Programming Framework.

2 | E n d i n g D r o u g h t E m e r g e n c i e s
ENDING DROUGHT EMERGENCIES IN KENYA
1.0 BACKGROUND1.1. International Strategies of Managing Disaster Risks
1 United Nations Disaster Risk Reduction, 2015. Sendai Framework for Disaster Risk Reduction 2015 – 2030. Accessed at https://www.unisdr.org/files/43291_sendaiframeworkfordrren.pdf on 16 December 2019.
2 Djibouti, Ethiopia, Eritrea, Kenya, Somalia, the Sudan, South Sudan and Uganda.
Droughts lead to disasters because they destroy lives and livelihoods. The frequency of droughts and their associated impact are increasing globally, owing to climate change. Consequently, governments and development partners have put in place strategies to address climate change related risks including drought at global, regional and national levels. At global level, the Hyogo Framework for Action (HFA) 2005 – 2015 in building resilience of nations and communities to disasters aimed at monitoring and reporting risks for timely response. The framework also focused on reducing risks by addressing the causing factors. The HFA paved way for the Sendai Framework (2015 – 2030)1 that advocates for managing of disaster risks as opposed to managing disasters themselves. The United Nations Framework Convention on Climate Change (UNFCCC, 1994) main aim is the stabilization of greenhouse gas concentrations in the atmosphere at a level that would prevent dangerous anthropogenic interferences with the climate system. The UNFCCC paved way to the Paris Agreement on Climate Change 2015 which aims at limiting global warming to less than two degrees Celsius, and pursue efforts to limit the rise to 1.5 degrees Celsius.
Regionally, Member States of the Intergovernmental Authority on Development (IGAD) region2 experienced repeated drought incidences in the past two decades (2000 – 2020) with the 2010/2011 drought being the most severe. In September 2011, the IGAD Heads of State and Government, in a Summit held in Nairobi, made a commitment to end drought emergencies in the greater Horn of Africa. The summit mandated IGAD to coordinate the implementation of the initiative at the regional level. In response, IGAD developed the IGAD Drought Disaster Resilience and Sustainability Initiative (IDDRSI) strategy to guide coordination work on Ending Drought Emergencies (EDE). The strategy advocates for resilience as the cornerstone of drought risk management. Consequently, each IGAD Member State developed a Country Program Paper (CPP) that entails strategies of building resilience among vulnerable communities in order to end drought emergencies. The National Drought Management Authority (NDMA) Act, 2016 institutionalized NDMA to facilitate and coordinate drought risk management and climate change adaptation in Kenya making NDMA the IDDRSI focal point for Kenya.

E n d i n g D r o u g t E m e r g e n c i e s | 32 | E n d i n g D r o u g h t E m e r g e n c i e s
Progress Report for the 2018-2019
1.2. Ending Drought Emergencies Initiative in Kenya The Kenya Vision 2030, the ASAL policy, the Climate Change Act 2016, National Adaptation Plan and the National Climate Change Action Plan 2018-2030 (NCCAP) II guide actions related to climate change in Kenya. The EDE Common Program Framework (CPF) is the guiding blue print for the multi-sectoral implementation of interventions that contribute to ending drought emergencies. The EDE has six pillars namely peace and security; climate proofed
infrastructure; human capital; sustainable livelihoods; drought risk management; and institutional development and knowledge management (Figure 1). A Government agency is the chair of each pillar with a development partner as co-chair. EDE pillars draw their members from state and relevant non-state actors.
Figure 1: Ending Drought Emergencies (EDE) framework
The national government in collaboration with county governments and development partners implement EDE projects with two objectives: 1) to reduce vulnerability to drought and climate change; and 2) to take timely and well-coordinated action. Figure 2 presents the coordination structure of EDE. To track progress, the EDE initiative has a monitoring and evaluation (M & E) framework. A Technical Working
Group (TWG) made up of M & E officers from sector ministries monitors the progress of EDE programs and projects and reports achievements. This report is a culmination of continuous consultation among members of the TWG for the financial year 2018/2019. The report also highlights key plans for the 2019/2020 financial year.

4 | E n d i n g D r o u g h t E m e r g e n c i e s
ENDING DROUGHT EMERGENCIES IN KENYA
1.3. Organization of this Report Chapter 2 presents the report’s methodology while chapter three reports progress towards EDE for each pillar. Thus, Chapter three has six sub-sections congruent with the pillars namely; 1) effective response to peace and security threats; 2) filling gaps in climate proofed infrastructure; 3) ensuring a healthy and skilled human capital; 4) sustaining
livelihoods; 5) building resilience to drought and climate change; and 6) institutional development & knowledge management. Chapter 4 highlights key challenges, opportunities and provides recommendations.
Figure 2: Coordination Structure of Ending Drought Emergencies in Kenya
E n d i n g D r o u g t E m e r g e n c i e s | 54 | E n d i n g D r o u g h t E m e r g e n c i e s
Progress Report for the 2018-2019
2.0 METHODOLOGY
2.1 Data collectionThis report uses secondary data collected by TWG members from numerous sector reports and databases. Synthesis of the data was conducted by comparing achievements during the reporting period (2018/2019) with the baseline (2014) and targets. The report explains discrepancies between achievements and targets. In addition, the TWG members consulted widely within their sectors to ensure accuracy of the data provided. The consultations also led to sharing of important lessons. Members of the various sectors validated the contents of this report.
2.2 Important PeriodsThree periods are important in interpreting the findings of this report: the baseline period which is 2014/2015 (hereinafter 2014), the reporting period which is 2018/2019 (hereinafter 2018) and the ultimate target year for EDE which is 2022/2023 (hereinafter 2022).
2.3 LimitationThe only limitation of this report is that some data were only available at national level and not at county level. This made it difficult to report progress of the ASAL Counties with respect to those indicators. The report explains such cases
6 | E n d i n g D r o u g h t E m e r g e n c i e s
ENDING DROUGHT EMERGENCIES IN KENYA
3.0 PROGRESS TOWARDS ENDING DROUGHT EMERGENCIES
3.1 Effective Response to Peace and Security Threats Effective response to peace and security threats is important in reducing conflicts among communities in the ASAL Counties. Effective response means evidence-backed action to peace and security threats. During the reporting period, 75% of government firearms had been marked in order to improve accountability. By 2022, 95% of all government firearms should have been marked. Marking of government firearms coupled with an increase in the recovery of illicit small arms reduced reported violent incidences involving firearms by 71% and further led to a 56% reduction in deaths emanating from violent incidences. Pillar one (peace and security) of the EDE framework tracks three results areas namely strengthening peace infrastructure, reducing inter-community conflicts, and mainstreaming peace building in planning.
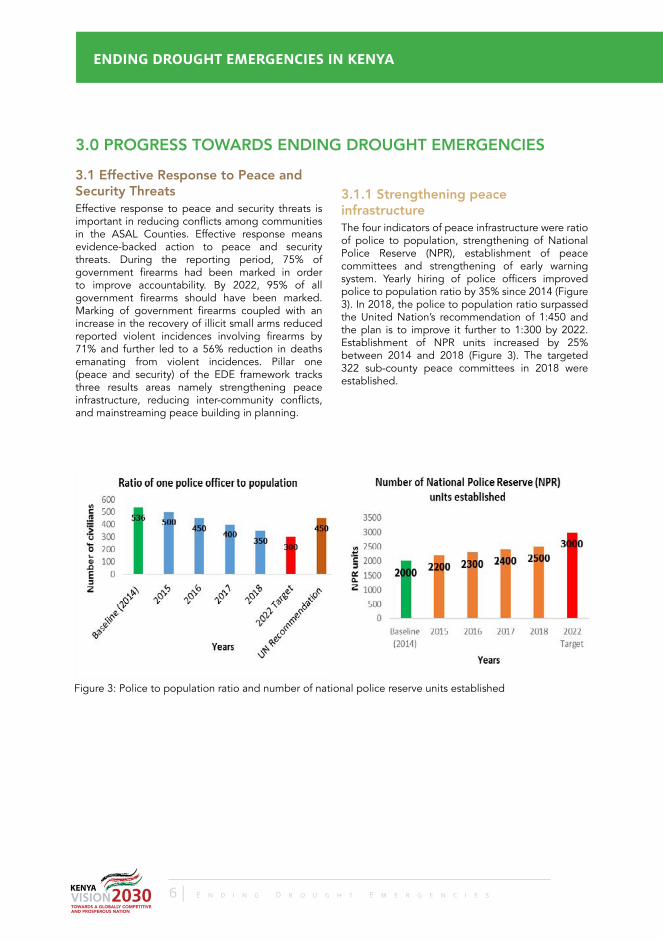
3.1.1 Strengthening peace infrastructure The four indicators of peace infrastructure were ratio of police to population, strengthening of National Police Reserve (NPR), establishment of peace committees and strengthening of early warning system. Yearly hiring of police officers improved police to population ratio by 35% since 2014 (Figure 3). In 2018, the police to population ratio surpassed the United Nation’s recommendation of 1:450 and the plan is to improve it further to 1:300 by 2022. Establishment of NPR units increased by 25% between 2014 and 2018 (Figure 3). The targeted 322 sub-county peace committees in 2018 were established.
Figure 3: Police to population ratio and number of national police reserve units established
E n d i n g D r o u g t E m e r g e n c i e s | 76 | E n d i n g D r o u g h t E m e r g e n c i e s
Progress Report for the 2018-2019
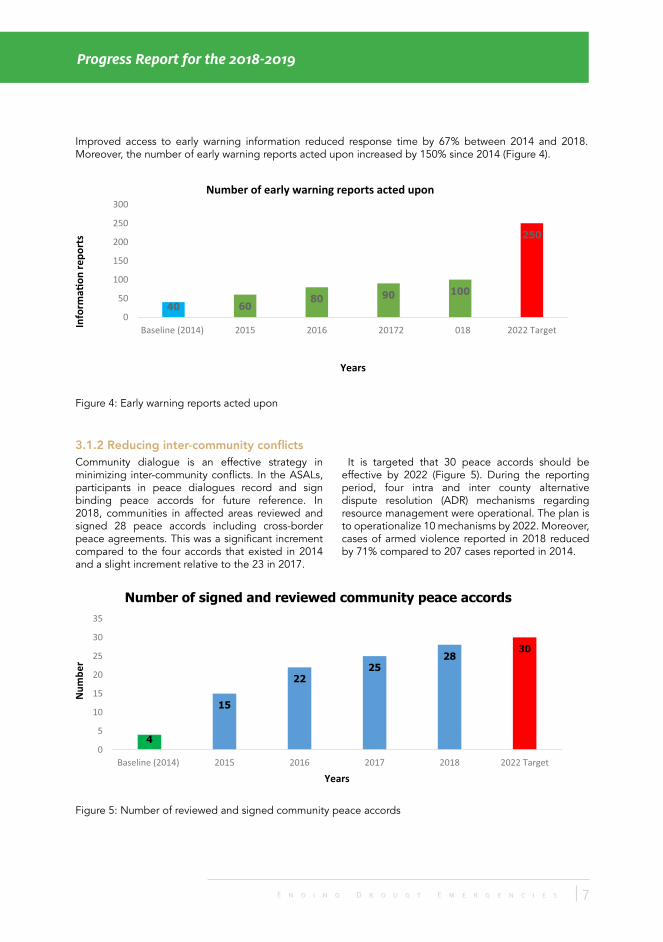
Improved access to early warning information reduced response time by 67% between 2014 and 2018. Moreover, the number of early warning reports acted upon increased by 150% since 2014 (Figure 4).
40 6080 90 100
250
0
50
100
150
200
250
300
Baseline (2014) 2015 2016 20172 018 2022 Target
Years
Number of early warning reports acted upon
Figure 4: Early warning reports acted upon
3.1.2 Reducing inter-community conflicts Community dialogue is an effective strategy in minimizing inter-community conflicts. In the ASALs, participants in peace dialogues record and sign binding peace accords for future reference. In 2018, communities in affected areas reviewed and signed 28 peace accords including cross-border peace agreements. This was a significant increment compared to the four accords that existed in 2014 and a slight increment relative to the 23 in 2017.
It is targeted that 30 peace accords should be effective by 2022 (Figure 5). During the reporting period, four intra and inter county alternative dispute resolution (ADR) mechanisms regarding resource management were operational. The plan is to operationalize 10 mechanisms by 2022. Moreover, cases of armed violence reported in 2018 reduced by 71% compared to 207 cases reported in 2014.
Figure 5: Number of reviewed and signed community peace accords

8 | E n d i n g D r o u g h t E m e r g e n c i e s
ENDING DROUGHT EMERGENCIES IN KENYA
3.1.3 Mainstreaming peacebuilding in planningMainstreaming peace building in national and county governments plans is essential in enhancing resource mobilization and sustainability. In 2018, 12 counties had incorporated peace building in their County Integrated Development Plans (CIDPs) as planned. In this regards, the target is to ensure that all the ASAL Counties mainstream peace building in their third generation CIDPs. To support evidence-based decisions, stakeholders in the peace and security space conducted nine studies related to peace and security in the reporting period as planned.
3.2 Climate Proofed Infrastructure Sectors contributing to this result area are roads, water, irrigation, energy, and ICT. This pillar has five results areas namely: 1) Prioritization of national infrastructure in ASALs; 2) Production of standard guidelines for climate-proofed design of ASAL infrastructure; 3) Improvement of county capacity
to plan, contract and supervise implementation of climate-proofed infrastructure; 4) Building of county capacity for infrastructure operation and maintenance; 5) Filling gaps on deficit of county climate-proofed productive infrastructure.
3.2.1 Access to electricity
Data on access to electricity was available at national level. Available electricity is an aggregation from various sources including hydro, wind, solar and geo-thermal. The number of households connected to electricity increased by 172% in 2018 compared to the 539,211 households connected in 2014 (Figure 6). Additionally, the number of primary schools, markets, and health centers connected increased by 266% from a baseline of 3,148 institutions in 2014 (Figure 6). The only limitation of the institution data is that it did not categorize according to the different institutions.
Figure 6: Connectivity to and reliability of electricity in Kenya

E n d i n g D r o u g t E m e r g e n c i e s | 98 | E n d i n g D r o u g h t E m e r g e n c i e s
Progress Report for the 2018-2019
Connection to electricity is a necessary indicator but not a sufficient requisite of measuring access to electricity. System Average Interruption Duration Index (SAIDI) and System Average Interruption Frequency Index (SAIFI) are the proxies for measuring reliability of access to electricity. SAIDI is average outage duration per customer served
per year in minutes. SAIFI is the average number of interruptions that a customer experiences in a year. SAIDI decreased by 92% to 60 minutes in 2018 compared to 2014 and the plan is to reduce it by 100% by 2022. SAIFI reduced by 85% in 2018 from 89 in 2014 (Figure 7). The plan is to reduce it by 96% in 2022 (Figure 7).
Figure 7: Connectivity to and reliability of electricity in Kenya
3.2.2 Access to clean and safe water and sanitation services In 2018, 62% of ASAL population had access to clean and safe water compared to 60% in 2017. Target for 2022 is to have 80% of population accessing safe and clean water and sanitary services (Figure 8). Cases of water borne diseases reported reduced by 6% to 47,000 cases in 2018 compared to 2017 and 27% compared to cases reported in 2014 (Figure 8).
Figure 8: Access to clean, safe water and sanitation services

10 | E n d i n g D r o u g h t E m e r g e n c i e s
ENDING DROUGHT EMERGENCIES IN KENYA
Table 1: Climate proofed infrastructure
Indicator Baseline
2014
2015 2016 2017 2018 Target 2022
Number of climate proofed water infrastructure projects completed in counties
115 300 500 733 283 500
Number of kilometers of climate proofed roads completed
40 305 253 287 285 750
Number of hectares of irrigated 142,000 170,400 209,601 193,600 198,600 425,800
Number of hectares of land reclaimed 5,200 104 2,862 4,800 167 60,000
3.3 Access to Improved Health and Education Services
Data on human capital (health and education) was available at national level. Collaborative plans are underway to collect data for ASALs henceforth. The result areas under this pillar are: 1) Increase capacity and number of professionals working in the ASAL Counties; 2) Integrate technology, in the provision of health and education services in current systems; and 3) Increase demand for equitable and quality health and education services.
3.3.1 Access to education In this sector, available data for 2017 and 2018 was not specific for the ASALs. However, it is noteworthy that the overall national enrollment to Early Childhood Development Education (ECDE) has increased steadily since 2014 (Table 2). Targets for gross and
net ECDE enrollment rate for 2018 were achieved. Compared to 2014, gross and net enrollment in ECDE increased by 7% and 8% respectively in 2018. Net enrollment rate for primary schools increased by 5%, whereas gross and net enrollment rates for secondary schools increased by 20% and 12% respectively in the reporting period. This shows that, access to basic education was improving in line with the free primary education and 100% transition policies of the Government of Kenya. Increased enrollment rates led to an improvement in transition rate of 7.2% in 2018 compared to 2014 although the target for the same year was 100%. Enrollment in Technical and Vocational Education and Training (TVET) increased steadily by 169% between 2014 and 2018 (Table 2). This is following the efforts of the national government to strengthen middle level training.
3.2.3 Climate proofed road and water infrastructure
3 http://www.oecd.org/environment/cc/policy-perspectives-climate-resilient-infrastructure.pdf
Climate proofing involves management measures such as increasing frequency of maintenance schedules, structural measures, improvement of physical designs, and use of natural phenomena like swamps as flood sinks and source of water for livestock during dry spells (OECD, 20183). In 2018, 283 climate proofed water infrastructure projects were completed in the 23 ASAL Counties, compared
to 733 completed in the previous year (Table 1). Similarly, the number of kilometers of roads constructed reduced between 2017 and 2018. To boost food security through production, land under irrigation increased by 40% in 2018 from 142,000 hectares irrigated in 2014. Nevertheless, the amount of land reclaimed reached an all-time low of 167 hectares in 2018 (Table 1).
E n d i n g D r o u g t E m e r g e n c i e s | 1110 | E n d i n g D r o u g h t E m e r g e n c i e s
Progress Report for the 2018-2019
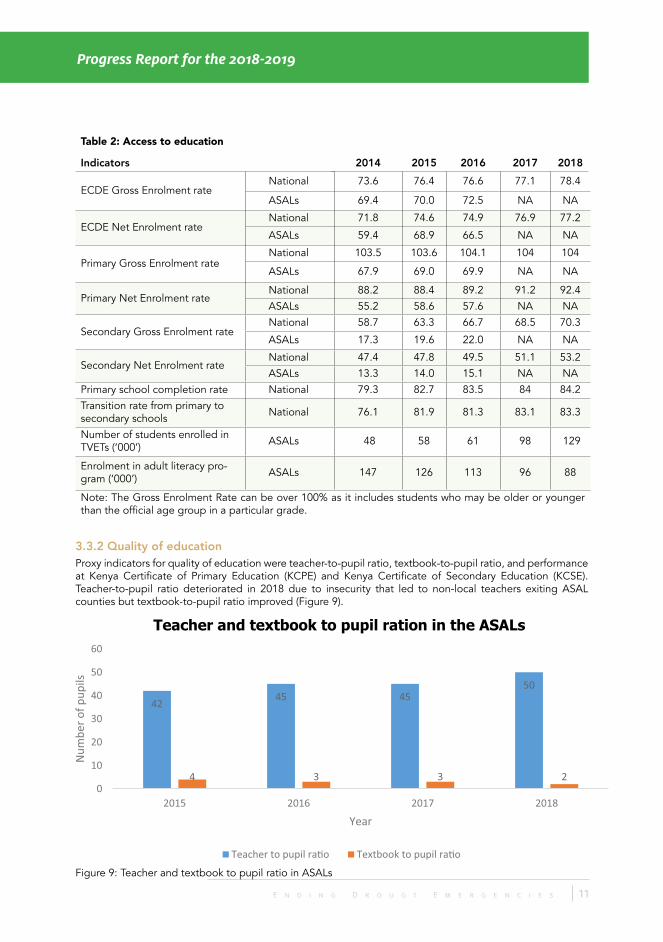
Table 2: Access to education
Indicators 2014 2015 2016 2017 2018
ECDE Gross Enrolment rate National 73.6 76.4 76.6 77.1 78.4
ASALs 69.4 70.0 72.5 NA NA
ECDE Net Enrolment rateNational 71.8 74.6 74.9 76.9 77.2
ASALs 59.4 68.9 66.5 NA NA
Primary Gross Enrolment rateNational 103.5 103.6 104.1 104 104
ASALs 67.9 69.0 69.9 NA NA
Primary Net Enrolment rateNational 88.2 88.4 89.2 91.2 92.4ASALs 55.2 58.6 57.6 NA NA
Secondary Gross Enrolment rateNational 58.7 63.3 66.7 68.5 70.3
ASALs 17.3 19.6 22.0 NA NA
Secondary Net Enrolment rateNational 47.4 47.8 49.5 51.1 53.2ASALs 13.3 14.0 15.1 NA NA
Primary school completion rate National 79.3 82.7 83.5 84 84.2Transition rate from primary to secondary schools National 76.1 81.9 81.3 83.1 83.3
Number of students enrolled in TVETs (‘000’) ASALs 48 58 61 98 129
Enrolment in adult literacy pro-gram (‘000’) ASALs 147 126 113 96 88
Note: The Gross Enrolment Rate can be over 100% as it includes students who may be older or younger than the official age group in a particular grade.
3.3.2 Quality of education Proxy indicators for quality of education were teacher-to-pupil ratio, textbook-to-pupil ratio, and performance at Kenya Certificate of Primary Education (KCPE) and Kenya Certificate of Secondary Education (KCSE). Teacher-to-pupil ratio deteriorated in 2018 due to insecurity that led to non-local teachers exiting ASAL counties but textbook-to-pupil ratio improved (Figure 9).
Figure 9: Teacher and textbook to pupil ratio in ASALs

12 | E n d i n g D r o u g h t E m e r g e n c i e s
ENDING DROUGHT EMERGENCIES IN KENYA
Figure 10: Performance in the Kenya Certificate of Primary Education Examination
Performance in the KCSE remained relatively lower for University qualifying grades (A – C+) compared to the national performance although the differences were not major (Figure 11).
Figure 11: Mean grades in Kenyan Certificate of Secondary Education
Performance of ASALs in the KCPE remained below the national average in 2014 – 2018 (Figure 10). This was due to various challenges including inadequate infrastructure, understaffing, insecurity and nomadic lifestyle where pupils do not attend school
consistently. However, performance improved by 6% in 2018 compared to 2017 signaling success of various government policies to improve quality of education in Kenya and specifically in ASALs.

E n d i n g D r o u g t E m e r g e n c i e s | 1312 | E n d i n g D r o u g h t E m e r g e n c i e s
Progress Report for the 2018-2019
Figure 12: Proportion of childbirths attended by skilled personnel
3.3.3 Access to health services Health is a devolved function thus counties are responsible for health investments. To measure progress made towards improving access to health services, three indicators were used namely nurse-to-population ratio, percent of deliveries attended by skilled personnel, and percent of children with acute malnutrition that had access to treatment.
Nurse-to-population ratioThe World Health Organization (WHO) recommends 45 health workers (nurses/midwives, clinical officers and doctors) for every 10,000 people in a population. The ratio in Kenya was eight health workers per 10,000 people, far below the WHO recommendation. The ASAL Counties were even worse with a ratio
of only two health workers per 10,000 population. There were inter-county disparities with Tharaka Nithi having the highest ratio of eight nurses per 10,000 people whereas Mandera had the lowest ratio of only one nurse for every 10,000 people.
Deliveries attended by skilled personnelThere was a steady increase in access to skilled personnel during childbirth as counties recruited health professionals. Construction of health facilities with maternity services also improved. Moreover, improvement in health seeking behavior among pregnant women contributed to the positive trend. Skilled personnel, as shown in Figure 12, attended to 54% of all births in the ASALs.
Treatment of acute malnutrition Acute malnutrition remains one of the biggest threats in ASAL Counties with some counties experiencing malnutrition levels above emergency threshold in any given year. To halt and prevent excess mortalities, treatment for acute malnutrition is therefore paramount. To ensure malnourished children have access to treatment, counties invested in capacities of health workers, provision of safe
storage of nutrition commodities and conducting regular integrated outreaches in the hard-to-reach areas in addition to equipping health facilities and recruitment of additional personnel. Severely malnourished children accessing treatment increased to 84% in 2018 compared to less than 505 in 2014. The 2018 proportion surpassed the 2022-planned target (Figure 13).

14 | E n d i n g D r o u g h t E m e r g e n c i e s
ENDING DROUGHT EMERGENCIES IN KENYA
Figure 13: Percent of children with severe acute malnutrition accessing treatment
Data on mortality rates are available once every five years and therefore Table 3 presents projected values. Mortality rates are declining nationally.
Table 3: Mortality rates in KenyaIndicators Baseline 2014 2015 2016 2017 2018
Neonatal mortality rate per 1000 live births 22 20.8 20.4 20 19.6
Infant mortality rate per 1000 live births 39 33.3 32.4 31.8 30.6
Under 5 mortality rate per 1000 live births 53 51.1 49.4 47.9 46.4
Maternal mortality rate per 100,000 women who gave birth
362 353 346 342 340
Source of data: https://knoema.com/atlas/Kenya/topics/Demographics/Mortality/Adult-mortality-rate
3.4 Sustaining LivelihoodsInequalities in resource distribution limits sustainability of livelihoods in the ASALs because they lead to vulnerabilities, increased unpredictability of dryland environments and economies, and institutional weaknesses. To address the limitations, the Government made significant investments to ensure sustainable livelihoods. The reported results areas herein are:
1) Increased income by:i) Increasing production of milk, hides and
skins.ii) Improving livestock marketing.iii) Increasing production of non-
conventional livestock (fish, poultry and apiculture) and drought resistant crops (sorghum and millet).
2) Improved management of water, crops and rangeland resources by:i) Improving crop production.ii) Improving governance of land tenure.iii) Improving natural resource management.
3) Operationalization of quarantine systems.
3.4.1 Production of milk, hides and skinsThe average milk produced in ASAL Counties in 2018 was 365.7 million liters (Table 4). This was a 63% increase compared to 2017 and 13% more compared to 2014. Low milk production in 2017 was due to the severe drought experienced in all the ASAL Counties. Milk prices varied depending on
E n d i n g D r o u g t E m e r g e n c i e s | 1514 | E n d i n g D r o u g h t E m e r g e n c i e s
Progress Report for the 2018-2019
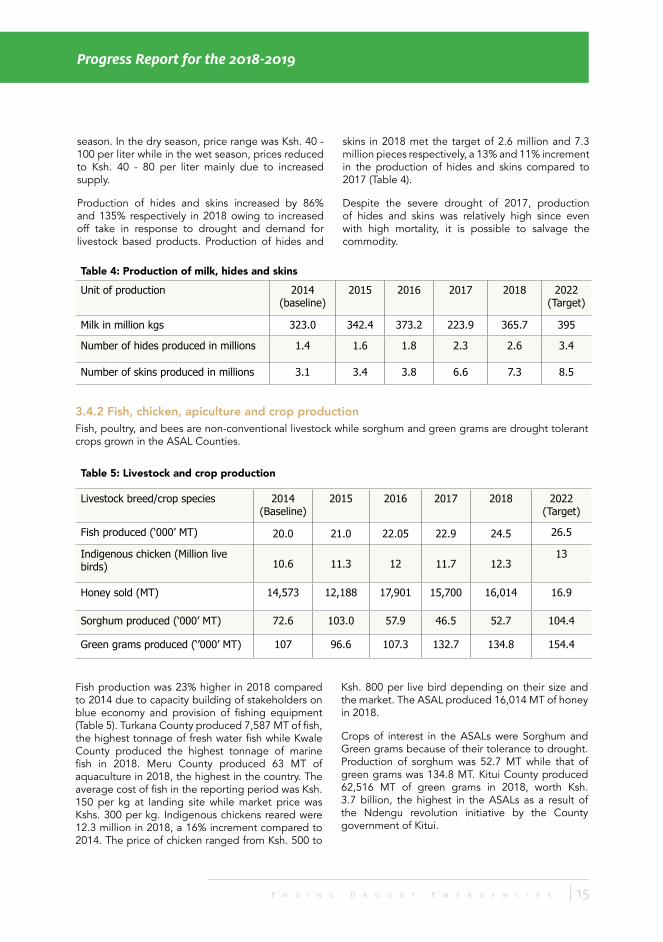
Table 4: Production of milk, hides and skins
Unit of production 2014 (baseline)
2015 2016 2017 2018 2022(Target)
Milk in million kgs 323.0 342.4 373.2 223.9 365.7 395
Number of hides produced in millions 1.4 1.6 1.8 2.3 2.6 3.4
Number of skins produced in millions 3.1 3.4 3.8 6.6 7.3 8.5
3.4.2 Fish, chicken, apiculture and crop productionFish, poultry, and bees are non-conventional livestock while sorghum and green grams are drought tolerant crops grown in the ASAL Counties.
Table 5: Livestock and crop production
Livestock breed/crop species 2014(Baseline)
2015 2016 2017 2018 2022(Target)
Fish produced (‘000’ MT) 20.0 21.0 22.05 22.9 24.5 26.5
Indigenous chicken (Million live birds) 10.6 11.3 12 11.7 12.3
13
Honey sold (MT) 14,573 12,188 17,901 15,700 16,014 16.9
Sorghum produced (‘000’ MT) 72.6 103.0 57.9 46.5 52.7 104.4
Green grams produced (‘’000’ MT) 107 96.6 107.3 132.7 134.8 154.4
season. In the dry season, price range was Ksh. 40 - 100 per liter while in the wet season, prices reduced to Ksh. 40 - 80 per liter mainly due to increased supply.
Production of hides and skins increased by 86% and 135% respectively in 2018 owing to increased off take in response to drought and demand for livestock based products. Production of hides and
skins in 2018 met the target of 2.6 million and 7.3 million pieces respectively, a 13% and 11% increment in the production of hides and skins compared to 2017 (Table 4).
Despite the severe drought of 2017, production of hides and skins was relatively high since even with high mortality, it is possible to salvage the commodity.
Fish production was 23% higher in 2018 compared to 2014 due to capacity building of stakeholders on blue economy and provision of fishing equipment (Table 5). Turkana County produced 7,587 MT of fish, the highest tonnage of fresh water fish while Kwale County produced the highest tonnage of marine fish in 2018. Meru County produced 63 MT of aquaculture in 2018, the highest in the country. The average cost of fish in the reporting period was Ksh. 150 per kg at landing site while market price was Kshs. 300 per kg. Indigenous chickens reared were 12.3 million in 2018, a 16% increment compared to 2014. The price of chicken ranged from Ksh. 500 to
Ksh. 800 per live bird depending on their size and the market. The ASAL produced 16,014 MT of honey in 2018.
Crops of interest in the ASALs were Sorghum and Green grams because of their tolerance to drought. Production of sorghum was 52.7 MT while that of green grams was 134.8 MT. Kitui County produced 62,516 MT of green grams in 2018, worth Ksh. 3.7 billion, the highest in the ASALs as a result of the Ndengu revolution initiative by the County government of Kitui.
16 | E n d i n g D r o u g h t E m e r g e n c i e s
ENDING DROUGHT EMERGENCIES IN KENYA
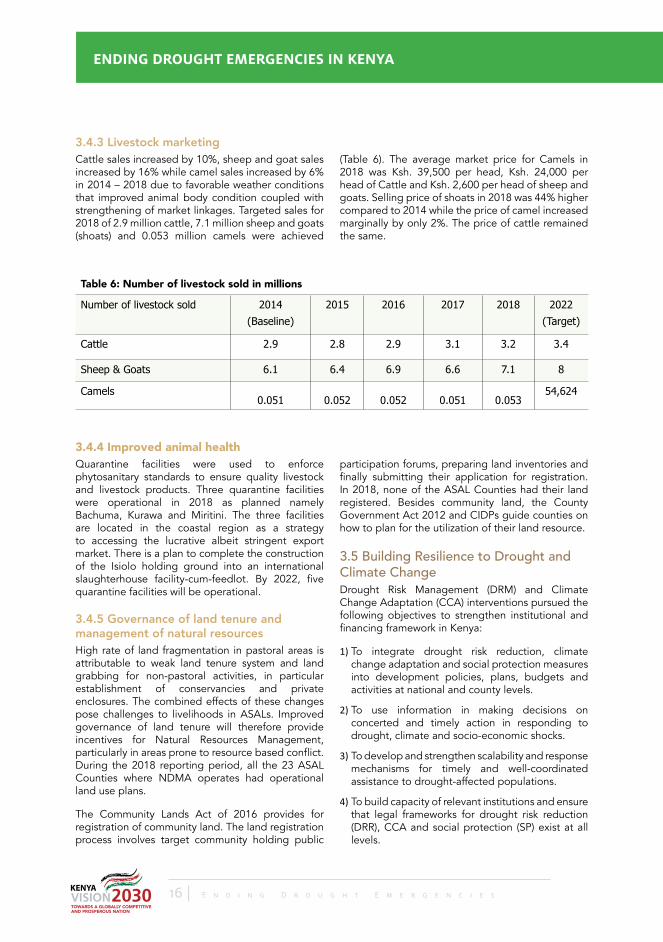
Table 6: Number of livestock sold in millions
Number of livestock sold 2014(Baseline)
2015 2016 2017 2018 2022(Target)
Cattle 2.9 2.8 2.9 3.1 3.2 3.4
Sheep & Goats 6.1 6.4 6.9 6.6 7.1 8
Camels 0.051 0.052 0.052 0.051 0.053
54,624
3.4.4 Improved animal health Quarantine facilities were used to enforce phytosanitary standards to ensure quality livestock and livestock products. Three quarantine facilities were operational in 2018 as planned namely Bachuma, Kurawa and Miritini. The three facilities are located in the coastal region as a strategy to accessing the lucrative albeit stringent export market. There is a plan to complete the construction of the Isiolo holding ground into an international slaughterhouse facility-cum-feedlot. By 2022, five quarantine facilities will be operational.
3.4.5 Governance of land tenure and management of natural resources High rate of land fragmentation in pastoral areas is attributable to weak land tenure system and land grabbing for non-pastoral activities, in particular establishment of conservancies and private enclosures. The combined effects of these changes pose challenges to livelihoods in ASALs. Improved governance of land tenure will therefore provide incentives for Natural Resources Management, particularly in areas prone to resource based conflict. During the 2018 reporting period, all the 23 ASAL Counties where NDMA operates had operational land use plans.
The Community Lands Act of 2016 provides for registration of community land. The land registration process involves target community holding public
participation forums, preparing land inventories and finally submitting their application for registration. In 2018, none of the ASAL Counties had their land registered. Besides community land, the County Government Act 2012 and CIDPs guide counties on how to plan for the utilization of their land resource.
3.5 Building Resilience to Drought and Climate Change Drought Risk Management (DRM) and Climate Change Adaptation (CCA) interventions pursued the following objectives to strengthen institutional and financing framework in Kenya:
1) To integrate drought risk reduction, climate change adaptation and social protection measures into development policies, plans, budgets and activities at national and county levels.
2) To use information in making decisions on concerted and timely action in responding to drought, climate and socio-economic shocks.
3) To develop and strengthen scalability and response mechanisms for timely and well-coordinated assistance to drought-affected populations.
4) To build capacity of relevant institutions and ensure that legal frameworks for drought risk reduction (DRR), CCA and social protection (SP) exist at all levels.
3.4.3 Livestock marketing Cattle sales increased by 10%, sheep and goat sales increased by 16% while camel sales increased by 6% in 2014 – 2018 due to favorable weather conditions that improved animal body condition coupled with strengthening of market linkages. Targeted sales for 2018 of 2.9 million cattle, 7.1 million sheep and goats (shoats) and 0.053 million camels were achieved
(Table 6). The average market price for Camels in 2018 was Ksh. 39,500 per head, Ksh. 24,000 per head of Cattle and Ksh. 2,600 per head of sheep and goats. Selling price of shoats in 2018 was 44% higher compared to 2014 while the price of camel increased marginally by only 2%. The price of cattle remained the same.

E n d i n g D r o u g t E m e r g e n c i e s | 1716 | E n d i n g D r o u g h t E m e r g e n c i e s
Progress Report for the 2018-2019
Figure 14: Number of households receiving regular cash transfers per month
3.5.1 Integration of drought risk reduction, climate change adaptation and social protection in planningTo integrate DRR, CCA and SP in planning, the key interventions reported for the year 2018 were the National Drought Emergency Fund (NDEF), Hunger Safety Net Programme (HSNP) and the County Climate Change Fund (CCCF) mechanism. The NDEF will ensure that money for drought response, preparedness and resilience activities is readily available when needed. NDMA piloted the NDEF concept using funds provided by the European Union. The key lesson from the pilot was that, dedicating funds for drought preparedness and response is effective in reducing the effects of drought. Lessons from the pilot guided the design of NDEF.
The HSNP is an unconditional cash transfer program implemented in Turkana, Wajir, Mandera and Marsabit, the four poorest and most drought vulnerable Counties in Kenya. The core objectives of HSNP are to provide regular cash transfers to selected vulnerable households and as part of a national integrated social protection mechanism. HSNP regular beneficiaries receive Kshs 5,400 every two months. Figure 14 shows the number of households that were receiving regular bi-monthly cash transfers during the reporting period.
18 | E n d i n g D r o u g h t E m e r g e n c i e s
ENDING DROUGHT EMERGENCIES IN KENYA
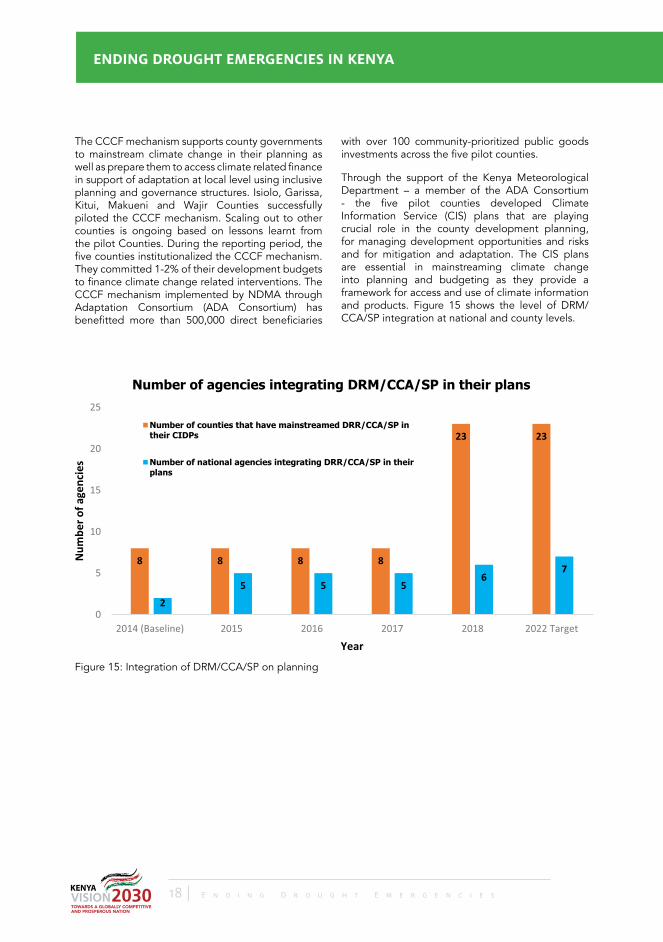
Figure 15: Integration of DRM/CCA/SP on planning
The CCCF mechanism supports county governments to mainstream climate change in their planning as well as prepare them to access climate related finance in support of adaptation at local level using inclusive planning and governance structures. Isiolo, Garissa, Kitui, Makueni and Wajir Counties successfully piloted the CCCF mechanism. Scaling out to other counties is ongoing based on lessons learnt from the pilot Counties. During the reporting period, the five counties institutionalized the CCCF mechanism. They committed 1-2% of their development budgets to finance climate change related interventions. The CCCF mechanism implemented by NDMA through Adaptation Consortium (ADA Consortium) has benefitted more than 500,000 direct beneficiaries
with over 100 community-prioritized public goods investments across the five pilot counties.
Through the support of the Kenya Meteorological Department – a member of the ADA Consortium - the five pilot counties developed Climate Information Service (CIS) plans that are playing crucial role in the county development planning, for managing development opportunities and risks and for mitigation and adaptation. The CIS plans are essential in mainstreaming climate change into planning and budgeting as they provide a framework for access and use of climate information and products. Figure 15 shows the level of DRM/CCA/SP integration at national and county levels.
E n d i n g D r o u g t E m e r g e n c i e s | 1918 | E n d i n g D r o u g h t E m e r g e n c i e s
Progress Report for the 2018-2019
3.5.2 Enhancing early warning The result areas for enhancing early warning were: 1) counties have new livelihood zone maps; 2) counties have hazard maps; and 3) produce integrated phase classification maps (IPC).
Livelihood zoning involves defining economic activities that can thrive in a particular geographic area thus improving relevance and accuracy of data. NDMA and partners have been reviewing existing livelihood zones in all the 23 ASAL Counties. As at 2018, the review of the livelihood zones was incomplete with a plan to complete the exercise during the 2019/2020 financial year. Eight Counties (Baringo, Turkana, Laikipia, Marsabit, Garissa, Kwale, Tana River and Kilifi) had hazard maps as at the time of reporting. This achievement surpassed the target of six hazard maps.
NDMA coordinates biannual multi-stakeholder food security assessments through the leadership of the
Kenya Food Security Steering Group (KFSSG) to contribute to early warning information. Partners in the assessments are county Governments through the County Steering Group (CSGs). The purpose of the assessment is to determine the impact of rainfall on food security. The assessments use Integrated Food Security Phase Classification (IPC) method that compares situation in a given time with the same time of previous years. The KFSSG conducts two assessments yearly, one for the short rain and another for the long rain, and this was the case for 2018.
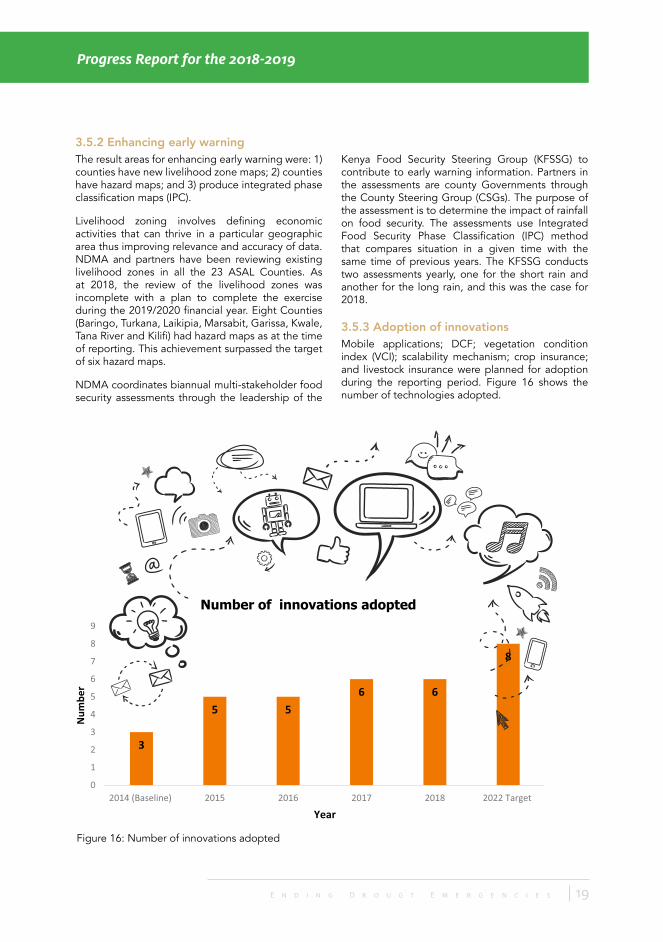
3.5.3 Adoption of innovations Mobile applications; DCF; vegetation condition index (VCI); scalability mechanism; crop insurance; and livestock insurance were planned for adoption during the reporting period. Figure 16 shows the number of technologies adopted.
Figure 16: Number of innovations adopted
20 | E n d i n g D r o u g h t E m e r g e n c i e s
ENDING DROUGHT EMERGENCIES IN KENYA
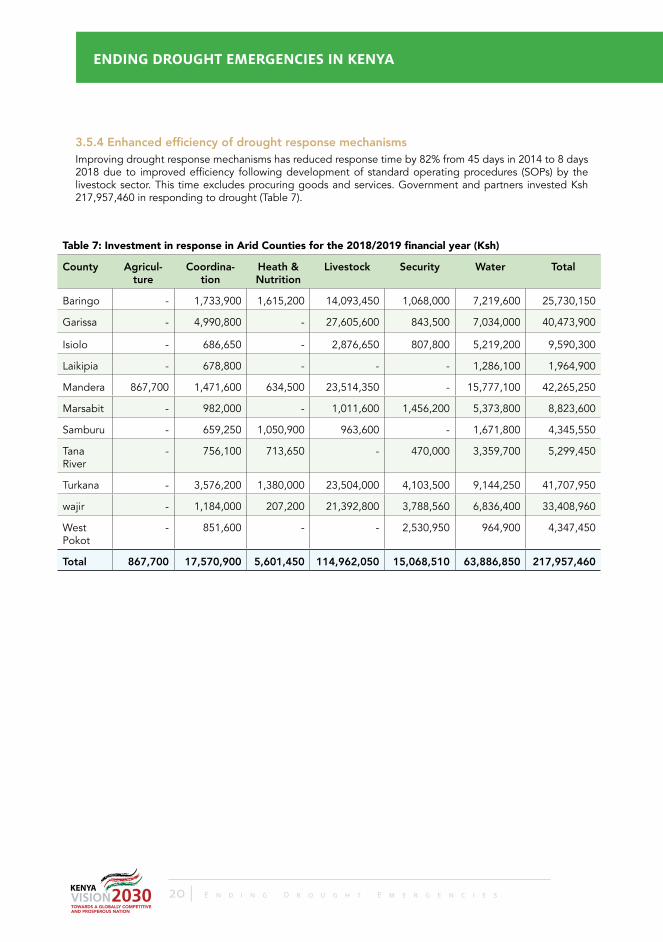
Table 7: Investment in response in Arid Counties for the 2018/2019 financial year (Ksh)
County Agricul-ture
Coordina-tion
Heath & Nutrition
Livestock Security Water Total
Baringo - 1,733,900 1,615,200 14,093,450 1,068,000 7,219,600 25,730,150
Garissa - 4,990,800 - 27,605,600 843,500 7,034,000 40,473,900
Isiolo - 686,650 - 2,876,650 807,800 5,219,200 9,590,300
Laikipia - 678,800 - - - 1,286,100 1,964,900
Mandera 867,700 1,471,600 634,500 23,514,350 - 15,777,100 42,265,250
Marsabit - 982,000 - 1,011,600 1,456,200 5,373,800 8,823,600
Samburu - 659,250 1,050,900 963,600 - 1,671,800 4,345,550
Tana River
- 756,100 713,650 - 470,000 3,359,700 5,299,450
Turkana - 3,576,200 1,380,000 23,504,000 4,103,500 9,144,250 41,707,950
wajir - 1,184,000 207,200 21,392,800 3,788,560 6,836,400 33,408,960
West Pokot
- 851,600 - - 2,530,950 964,900 4,347,450
Total 867,700 17,570,900 5,601,450 114,962,050 15,068,510 63,886,850 217,957,460
3.5.4 Enhanced efficiency of drought response mechanisms Improving drought response mechanisms has reduced response time by 82% from 45 days in 2014 to 8 days 2018 due to improved efficiency following development of standard operating procedures (SOPs) by the livestock sector. This time excludes procuring goods and services. Government and partners invested Ksh 217,957,460 in responding to drought (Table 7).

E n d i n g D r o u g t E m e r g e n c i e s | 2120 | E n d i n g D r o u g h t E m e r g e n c i e s
Progress Report for the 2018-2019
Figure 17: Average number of households receiving emergency cash transfers
3.5.5 Scalability mechanisms Scalability mechanisms provide fast and effective response to reach more people that are vulnerable during emergencies than the number initially targeted. In 2018, NDMA and the Ministry of Health had operational scalability mechanisms. NDMA manages a shock responsive scalable unconditional cash transfer mechanism. The mechanism is triggered by a VCI criteria with four categories namely extreme drought (less than 10), severe drought
(10-20), moderate drought (20-30) and no drought (35 and above). Normally, 26% of the registered households are on regular cash transfer. Depending on the intensity of a drought episode, the scalable mechanism is able to include extra households through an emergency fund. Severe drought result in 50% of households in the HSNP MIS benefiting, and covers 75% of the registered households during extreme drought as summarized on Figure 17.
The State Department of Health manages an Integrated Management of Acute Malnutrition (IMAM) surge model. The model enables the department to predict and cope with surges in cases of acute malnutrition. In the model, caseload thresholds are set. Meeting a threshold triggers actions in a phased way for flexibility. This increases resilience of the health system against shocks and stresses experienced in the ASAL areas. During the reporting period, Turkana, Marsabit, Samburu, West Pokot, Baringo, Tana River, and Isiolo Counties had the IMAM surge model operational.
3.5.6 Policy and legal frameworks Mainstreaming DRR, CCA and SP into government plans requires relevant policies and legal environment. The policy and legislative framework
for climate change in Kenya aligns CCCF the Climate Change Act (2016), the National Adaptation Plan (2015) and the National Climate Change Action Plan (NCCAP). The regulatory framework guides enhancement of Kenya’s response to climate change and achieve its goal of low-carbon climate-resilient development.
The Counties that piloted CCCF adopted two approaches in institutionalizing CCCF. Kitui and Makueni Counties enacted regulations under the Public Finance Management Act 2012. Isiolo, Wajir and Garissa Counties enacted a County Climate Change Fund Act. The CCCF pilot Counties passed five DRM/CCCF laws in 2018 compared to none in 2014.

22 | E n d i n g D r o u g h t E m e r g e n c i e s
ENDING DROUGHT EMERGENCIES IN KENYA
3.5.7 Coordination of drought risk management
4 The Principal Secretary responsible for drought matters chairs the intergovernmental Technical Committee. It draws membership from other relevant ministries including water and agriculture. The role of the committee is to advice sectors on appropriate drought measures and resource mobilization for drought response interventions.
5 The Kenya Food Security Steering Group is the technical arm of the Kenya Food Security Meeting. The group undertakes drought and food security assessments. It draws membership from relevant ministries including devolution & ASALs, agriculture, livestock and fisheries and devel-opment partners such as UN agencies.
NDMA continued to strengthen drought coordination structures at national and county levels. It supported three intergovernmental technical committee4 meetings that galvanized county governments to take their statutory responsibility for emergency response and financing. The Kenya Food Security Meeting convened twice during the reporting period to validate the findings of the drought and food security assessments for the year. The Kenya Food Security Steering Group5 conducted food security assessments for short and long rains as well as a mid-season assessment in May 2019. County Steering Group spearheaded coordination structures at the county level. CSGs held 267 meetings in the 23 ASAL Counties. Moreover, NDMA supported 49 ad hoc CSG meetings.
3.6 Institutional Development and Knowledge Management
3.6.1 Knowledge generation and utilization NDMA published four EDE related policy briefs against a target of two. The good performance was associated with the transitioning of HSNP-II to HSNP-III and therefore the need to report on various achievements and lessons learnt. Moreover, the need to scale out the CCCF mechanism required rigorous documentation of evidence. The Authority also produced five research papers in 2018. This was 50% of the target for 2018 and 63% of the target publications in 2014. The explanation for the poor performance is that in 2018, only the ADA consortium was actively involved in research.
NDMA produced 10 drought related studies in collaboration with partners to enhance evidence-based decisions towards building resilience of
vulnerable communities. This surpassed target by 80%. To enhance knowledge sharing, the process of developing a centralized knowledge management and information sharing (KM & IS) platform began in the 2018/2019 financial year. NDMA profiled knowledge users and specified the requirements of the platform. Failure to operationalize the KM & IS platform in 2018 was due to lack of a guiding strategy which was still under development.
3.6.2 Knowledge sharing Five knowledge-sharing forums were held: ASAL Stakeholder Forum (ASF), Pastoralists Parliamentary Group (PPG), Platform for Disaster Risk Reduction (PDRR), ASAL conference, Pastoralists Leadership Summit (PLS), and the Devolved Climate Finance (DCF) Alliance. This was an increment by two forums compared to three in 2014 - ASF, PPG and PDRR.
3.6.3 Management and accountability structuresThe National EDE coordination structures are the National Steering Committee, the Pillar Groups and the Technical Working Group (TWG). NDMA and development partners provided the coordination structure to plan and implement various activities. Sector plan for DRM and EDE MTP-III was developed. In 2018, pillars conducted 15 quarterly meetings as opposed to the 24 planned due to a shift in priority towards response as the drought situation worsened.
Some of the outcomes of the pillar meetings included development of a concept note for conflict management in Turkana, West Pokot, Baringo and Elgeyo Marakwet Counties; dissemination of the consolidated drought response report which

E n d i n g D r o u g t E m e r g e n c i e s | 2322 | E n d i n g D r o u g h t E m e r g e n c i e s
Progress Report for the 2018-2019
Table 8: Advances for strengthening coordination at county level
County Amount advanced in Ksh.(2018/2019 FY)
1 Embu 795,470
2 Garissa 769,700
3 Kilifi 800,000
4 Kitui 800,000
5 Kwale 799,990
6 Laikipia 800,000
7 Lamu 768,850
8 Mandera 780,500
9 Meru 793,000
10 Narok 800,000
11 Nyeri 800,000
12 Samburu 790,160
13 Taita Taveta 687,900
14 Tharaka 780,320
15 Wajir 800,000
16 West Pokot 795,000
TOTAL ADVANCE 12,560,890
highlighted priority interventions for preparedness and response; and reviewing and refining the EDE M & E framework. The EDE National Steering Committee (NSC) met twice in 2018 as planned to analyze performance of the pillars during MTP-II and deliberate on ways of enhancing performance during MTP-III. The team also deliberated on differences noted in drought response since the inception of EDE leading to the review of IDDRSI Kenya Country Program Paper. The EDE TWG convened three meetings to review key performance indicators of the EDE M & E framework against a target of four meetings.
NDMA county offices spearheaded county coordination structures. Embu, Garissa, Kilifi, Kitui, Kwale, Laikipia, Lamu, Mandera, Meru, Narok, Samburu, Taita Taveta, Tharaka, Wajir and West Pokot Counties received coordination funds. Each county received up to Ksh 800,000, though actual amounts disbursed varied among counties depending on the activities and budgets they proposed (Table 8). Activities included convening CSG meetings, mapping of key EDE partners, reviewing NDMA’s coordination role at county level and monitoring progress of EDE projects.
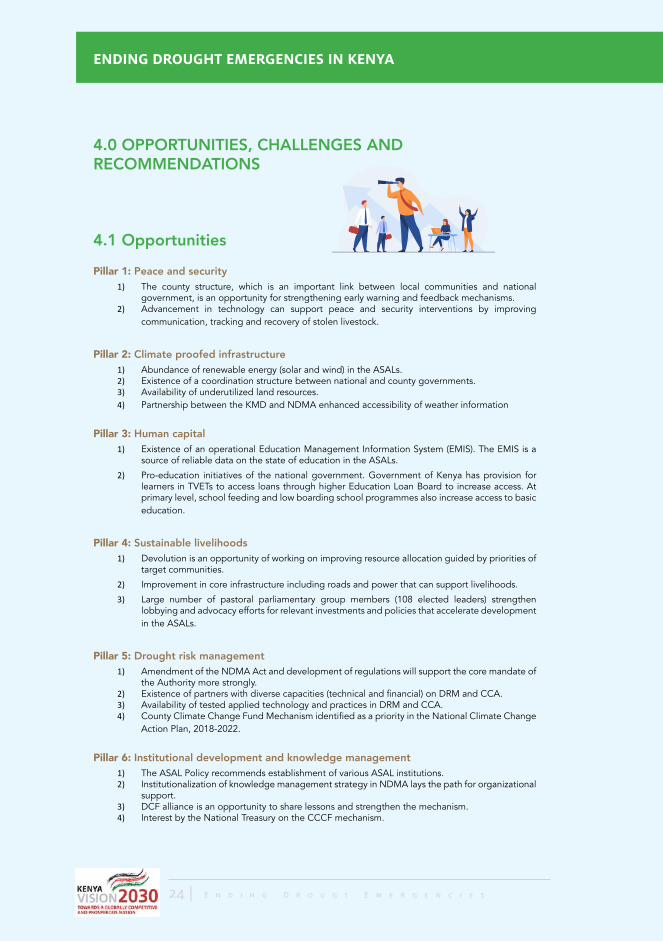
4.0 OPPORTUNITIES, CHALLENGES AND RECOMMENDATIONS
4.1 Opportunities
Pillar 1: Peace and security 1) The county structure, which is an important link between local communities and national
government, is an opportunity for strengthening early warning and feedback mechanisms. 2) Advancement in technology can support peace and security interventions by improving
communication, tracking and recovery of stolen livestock.
Pillar 2: Climate proofed infrastructure 1) Abundance of renewable energy (solar and wind) in the ASALs. 2) Existence of a coordination structure between national and county governments.3) Availability of underutilized land resources. 4) Partnership between the KMD and NDMA enhanced accessibility of weather information
Pillar 3: Human capital 1) Existence of an operational Education Management Information System (EMIS). The EMIS is a
source of reliable data on the state of education in the ASALs.
2) Pro-education initiatives of the national government. Government of Kenya has provision for learners in TVETs to access loans through higher Education Loan Board to increase access. At primary level, school feeding and low boarding school programmes also increase access to basic education.
Pillar 4: Sustainable livelihoods 1) Devolution is an opportunity of working on improving resource allocation guided by priorities of
target communities.
2) Improvement in core infrastructure including roads and power that can support livelihoods.
3) Large number of pastoral parliamentary group members (108 elected leaders) strengthen lobbying and advocacy efforts for relevant investments and policies that accelerate development in the ASALs.
Pillar 5: Drought risk management 1) Amendment of the NDMA Act and development of regulations will support the core mandate of
the Authority more strongly.2) Existence of partners with diverse capacities (technical and financial) on DRM and CCA.3) Availability of tested applied technology and practices in DRM and CCA. 4) County Climate Change Fund Mechanism identified as a priority in the National Climate Change
Action Plan, 2018-2022.
Pillar 6: Institutional development and knowledge management 1) The ASAL Policy recommends establishment of various ASAL institutions.2) Institutionalization of knowledge management strategy in NDMA lays the path for organizational
support.3) DCF alliance is an opportunity to share lessons and strengthen the mechanism.4) Interest by the National Treasury on the CCCF mechanism.
ENDING DROUGHT EMERGENCIES IN KENYA
24 | E n d i n g D r o u g t E m e r g e n c i e s

4.2 Challenges Pillar 1: Peace and security
1) Insecurity episodes are highly unpredictable requiring strong early warning and coordination mechanisms. This in turn can facilitate timely response.
2) Gap in policy inhibits implementation of interventions targeting to ensure peace and security. There is also no policy to enable government to fund peace committees limiting their operations.
3) Poor infrastructure hampering timely response even when early warning information is readily available.
4) Dynamism in conflict and emerging trends, including expansionist tendencies and border conflicts, radicalization and violent extremism extractives and cyber-crimes.
Pillar 2: Climate proofed infrastructure 1) Inadequate understanding and awareness of climate proofed infrastructure. 2) Inadequate funding to implement costly climate proofed infrastructure interventions. 3) Weak coordination in some sectors e.g. accessing county on some investments is difficult since
there is no liaison person to link the counties with national government. 4) Slow change of attitudes and practices due to other factors such as culture. 5) Effects of climate change at times jeopardizes gains of climate proofed infrastructure e.g. if a
climate proofed dam is not recharged for more than 90 days, it can as well dry. 6) Communal land tenure system is unfavorable for long-term investment. For example, relocating
and compensating communities to pave way for development projects is complicated, expensive and often politicized.
Pillar 3: Human capital 1) Inadequate foodstuffs and late delivery constraints the school feeding program. 2) Madrassa/Duksi education system of education is popular among Muslim communities. This
leads to low rate of enrollment and retention of pupils in formal education system despite the Madrassa not being a recognized education system in Kenya.
3) Inadequate number of skilled and motivated teachers translates to unfavorable teacher learner ratio in the ASALs. Ultimately, this reduces quality of education.
4) Nomadism forces learners to follow their families in search of water and pasture leading to inconsistency in school attendance.
5) Insecurity has led to mass exodus of teachers from ASALs over time denying learners in the ASALs ample time for education.
6) Lack/inaccurate data regarding enrollment in TVETs given the significant number of training centres that are not registered and accredited by relevant authorities.
Pillar 4: Sustainable livelihoods 1) Invasive plant species especially Prosopis spp resulting in decrease in quantity and quality of
pasture. 2) Limited investments by the private sector due to risks involved resulting in underdeveloped
livestock value chains especially weak market linkages.3) Semi-skilled and insufficient workforce. 4) Resource based community conflicts in ASALs.5) High incidences of drought, pests and diseases leading to low livestock and crop productivity. 6) Lack of a central repository of DRM/CCA information. This makes access to such information
time consuming.
Pillar 5: Drought risk management 1) Some counties are yet to operationalize DRM/CCA thus limiting coordination of DRM/CCA
interventions.2) Policy is unclear on some shared functions between county and national governments.
Pillar 6: Institutional development and knowledge management 1) Lack of a centralized knowledge management system.2) TWG and CSG not constituted according to the guidelines provided in the CPF affecting
delivery of their terms of references.
24 | E n d i n g D r o u g t E m e r g e n c i e s
Progress Report for the 2018-2019

4.3 Recommendations
Pillar 1: Peace and security 1) Strengthen early warning and early response mechanism by enhancing coordination between
national and county governments as well as adopting technology for peace and security. 2) Fast track the operationalization of the National Policy on Peacebuilding and Conflict
Management to boost peace and security efforts.3) Strengthen community participation in matters of peace building and conflict management.4) Enhance funding, coordination and leadership by National and County Governments to ensure
sustainability of peace building and conflict management processes.
Pillar 2: Climate proofed infrastructure 1) Invest more in generating energy from renewable sources.
2) Strengthen coordination structure between national and county governments.
3) Capitalize on underutilized land resources.
7) Increase understanding of climate proofed infrastructure among stakeholders.
8) Strengthen fund raising strategies in addition to government funding especially by developing proposals that identify funding gaps clearly.
9) Align EDE interventions with local context including culture and religion to improve ownership among target communities.
10) Register communal land for ease of management.
Pillar 3: Human capital 1) Build capacity of head teachers to update the EMIS with accurate data.
2) Create awareness and facilitate learners to access government loans meant for education.
3) Ensure adequate and timely delivery of foodstuffs to achieve the aim of the school feeding program of keeping learners in school consistently.
4) Enforce access to formal education by Muslim communities in addition to the Madrassa/Duksi education system.
5) Train locals to fill gaps of teachers and health personnel who leave the ASALs due to insecurity.
6) Build more boarding schools to minimize movement of learners during school time.
Pillar 4: Sustainable livelihoods 1) Strengthen surveillance for and control of livestock and crop pests and diseases.
2) Centralize storage of DRM/CCA information for ease of retrieval and minimize chances of loss.
3) Fast-track enactment and implementation of the National Livestock Policy to boost livestock economy.
Pillar 5: Drought risk management 1) Integrate DRM and CCA in all ASAL counties.
2) Harmonize policies and legal frameworks on DRM, CCA and SP.
3) Strengthen the CSGs.
Pillar 6: Institutional development and knowledge management 1) Reconstitute EDE TWG as per the the CPF.
2) Operationalize a KM platform.
26 | E n d i n g D r o u g t E m e r g e n c i e s
ENDING DROUGHT EMERGENCIES IN KENYA
26 | E n d i n g D r o u g t E m e r g e n c i e s
National Drought Management Authority
P.O. Box 53547-00200: Lornho House, Standard Street, Nairobi Tel: +2540202227496/2227168/2224324/2216962/2227223
Mobile: +254 0722200656; Email: [email protected]
www.ndma.go.ke