comparison of ssh anomalies derived from open-ocean bottom
TRANSCRIPT

1 Virtual OSTST meeting (19-23 October 2020) https://meetings.aviso.altimetry.fr/
Comparison of SSH anomalies derived from open-ocean bottom pressure
measurements (from NOAA DART® systems) with multi-satellite
merged altimeter missions and coastal tide gauge records
George Mungov1 and Yongsheng Zhang2
1CU/CIRES and NOAA/NCEI, Boulder, Colorado, USA
2CICS-MD and NOAA/NCEI, Silver Springs, Maryland, USA
Introduction
The purpose of this study is to investigate the possible application of NOAA DART® (Deep-ocean Assessment
and Reporting of Tsunamis) data beyond tsunami research. We compare DART® data with coastal tide gauge
observations and satellite altimeter records. NOAA DART® systems have been in operational use since 2005,
following about 20 years of development and testing – Gonzalez et al, (2005), Mofjeld (2009), Bernard and
Meinig (http://paroscientific.com/pdf/140%20DART_History%20with%20notes.pdf). The full 39-station
network was completed in 2008 and now it is functioning under the US National Tsunami Hazards Mitigation
Program (Folger, 2015). DART® systems are designed to measure the changes in the water column pressure at
the ocean floor caused by passing tsunamis and send the data to tsunami warning centers. Currently in use are
DART® systems second generation (DART® II) - https://www.ndbc.noaa.gov/dart/dart.shtml. Their
significant feature is two-directional communication via Iridium satellite system between the moored surface
buoys and NOAA land-based operational centers: the National Data Buoy Center (NDBC) and two Tsunami
Warning Centers (TWCs) in Hawaii and Alaska. The communication between the bottom pressure recorders
(BPR) on the sea floor and the surface buoys is through acoustic channel. DART® II systems can be put in
different recording and transmitting modes in two ways: autonomously by changes in water pressure exceeding
a threshold value; and remotely by the operators in the warning centers – Meinig et.al (2005). In general,
tsunamis are generated by earthquakes, volcanoes, landslides, or sudden significant changes in atmospheric
pressure (meteotsunamis). Most tsunamis are triggered by earthquakes. Earthquakes are effectively monitored
worldwide. Information about the location and the magnitude of recent earthquakes is distributed within a
minute of their occurrence. This information, however, is not sufficient for tsunami forecasting as it does not
include any information about the tsunami source area, which is what determines the magnitude of the
generated tsunami. Depending on several factors, an earthquake may or may not generate a tsunami. DART®
in-situ measurements are the only reliable indicator for generated tsunamis and their magnitude. For this reason,
the DART® system is considered one of the most important components of the tsunami warning system in the
Pacific and Atlantic oceans and in the Caribbean Basin. Along with the confirmation for generated tsunamis,

2 Virtual OSTST meeting (19-23 October 2020) https://meetings.aviso.altimetry.fr/
recorded tsunami wave forms are used to estimate the tsunami source parameters via inversion techniques
proposed by Prof. Kenji Satake (Satake, 1987, 1989). After receiving reliable estimation of the tsunami source
parameters—the uplift area and uplift heights and timing—these parameters are used in tsunami numerical
models for precision forecasting of tsunami wave propagation, arrival times, and heights of tsunami waves
along affected coasts. DART® data are also applied for tsunami model calibration and coastal zone risk
assessments. During recent years, the inversion techniques were upgraded with the application of data
assimilation methods (Maeda et al., 2015). A significant advance has been the joint assimilation of DART®,
coastal tide gauge, GPS and remote sensing data. This is described in Blewitt et. al. (2009) for the use of GPS
data for real-time earthquake source determination, Wang et. al. (2018) for assimilation of DART® and coastal
tide gauge data, Wang et. al. (2019) for assimilation of dense observational network data, Mulia et. al. (2020)
for assimilation of DART® and remote sensing data, Jakir et. al. (2020) for assimilation of shipborne GNSS
data, etc. All of these studies and the corresponding developed methods use open-ocean DART® observations
as a key element.
Detailed descriptions of the DART® system can be found on the web pages of the National Center for Tsunami
Research (https://nctr.pmel.noaa.gov/Dart/dart_overview.html), National Data Buoy Center
(https://www.ndbc.noaa.gov/dart/dart.shtml), and Gonzalez et. al. (2005). DART® systems use the
Paroscientific submersible depth sensor (http://www.paroscientific.com/pdf/D50_Series_8000.pdf). The sensor
is placed in an alloy container fixed on the ocean floor at depths between 4000 and 6000 meters
(https://www.ndbc.noaa.gov/dart/dart.shtml). Due to the high water pressure, the alloy containers start
experiencing plastic deformations, and long-term water pressure variations are not recorded.
As we stated earlier, DART® data are now used in tsunami research and forecasting, employing relatively
short time segments lasting from several hours to several days. To investigate the time scales where DART®
observations reliably represent open-ocean water level variations in our study, we compare 17 DART® records
against satellite altimeter and coastal tide gauge observations.
DART®, satellite altimeter and coastal tide gauge data
The NOAA National Centers for Environmental Information in Boulder, Colorado (NCEI-CO), is the archive
for high-resolution water-level data as part of the US National Tsunami Hazards Mitigation Program. NCEI
Hazards Group manages an archive of almost 300 DART® records covering a period of 20+ years, including
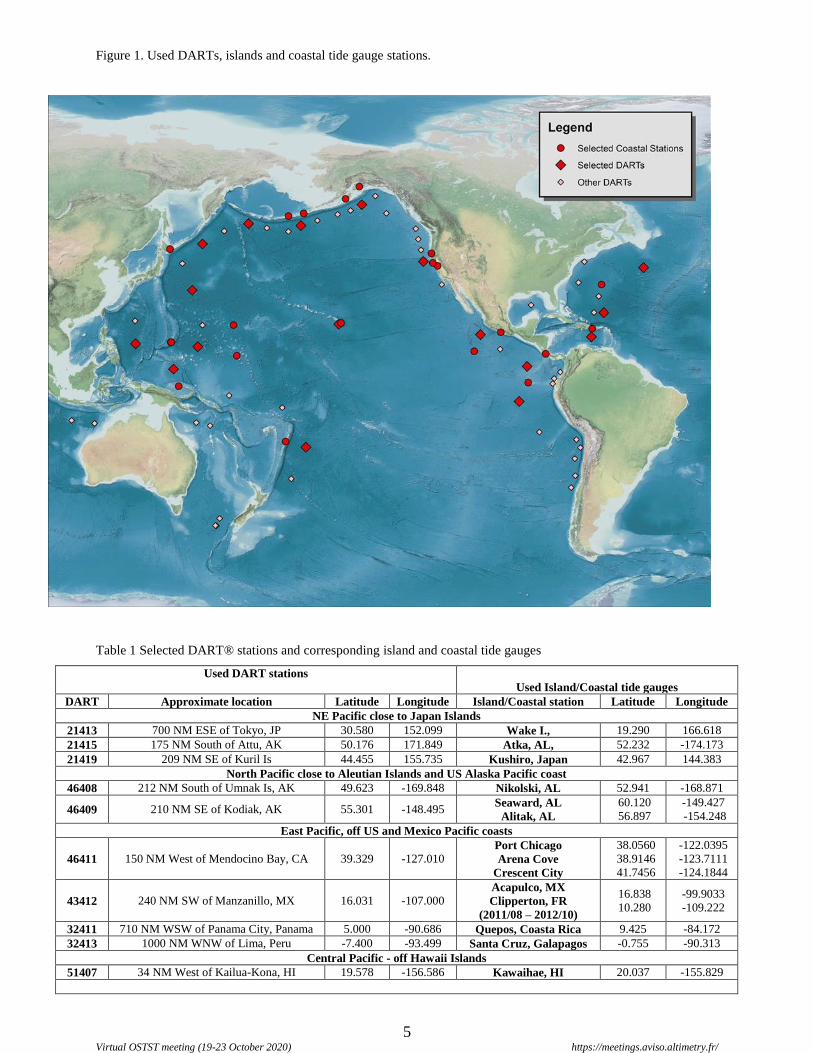
the pre-DART® era deployments - https://www.ngdc.noaa.gov/hazard/DARTData.shtml. We selected 17

3 Virtual OSTST meeting (19-23 October 2020) https://meetings.aviso.altimetry.fr/
DART® stations from the NCEI archive with long and quality records from all geographic areas in the Pacific
and Atlantic oceans, Gulf of Mexico and the Caribbean Basin (Figure 1 and Table 1).
NCEI Hazards group also manages the long-term archive for all NOAA coastal tide gauge data: 1-minute water
level data from the NOAA/NOS Center for Operational Oceanographic Products and Services (CO-OPS), and
high-resolution water level data from the Pacific Tsunami Warning Center (PTWC) and the National Tsunami
Warning Center (NTWC) - https://www.ngdc.noaa.gov/hazard/tide.shtml. From this archive and from
international sources, we selected several island and coastal stations – Figure 1. The selection criteria for these
stations were as follows: they had to be close to the selected DART® stations, located on isolated islands or,
when not available, on open continental coasts, and with high data quality. Data providers include:
- NOAA/NOS/CO-OPS records: 13 from Pacific islands, Alaska, Bermuda Islands, and Caribbean Basin
- UNAM (Mexico) provided data for the Acapulco coastal tide gauge
- SHOM (France) provided data for Clipperton Island (France)
- Data for Quepos (Costa Rica), St. Cruz (Galapagos Island, Ecuador), Kushiro (Japan), and Nuku’lofa
(Tonga) were extracted from the IOC Sea Level Monitoring Facility (http://www.ioc-sealevelmonitoring.org).
DART® records represent the sum of the weight of the water column above the BPR and the atmospheric
pressure at the ocean surface. Atmospheric pressure as gridded field data over the Pacific and Western Atlantic
was provided by NOAA/OAR/Physical Science Laboratory NOAA-CIRES-DOE 20th Century Reanalysis
(https://www.psl.noaa.gov/data/gridded/data.20thC_ReanV3.html), where the time step is 3 hours. Currently
this reanalysis goes up to 2015 only. Here it should be mentioned that when investigating tsunamis it is not
necessary to apply atmospheric pressure correction, because for such short periods (less than 24 hours) the
effect of atmospheric pressure variations is negligible.
In the present study we are using daily time series multi-satellite merged sea surface height anomalies (SSHA)
picked from the 1/4 degree gridded optimal interpolated daily sea level anomaly
(https://coastwatch.noaa.gov/cw/satellite-data-products/sea-surface-height/sea-level-anomaly-and-geostrophic-
currents-multi-mission-global-optimal-interpolation-gridded.html) – Leuliette and Scharroo (2010). In previous
versions, satellite altimeter data were extracted from NASA/JPL PO.DAAC merged SSHA with a time step of 5
days, with no interpolation for intermediate days that provided an approximate comparison with DART® data.
Data processing

4 Virtual OSTST meeting (19-23 October 2020) https://meetings.aviso.altimetry.fr/
DART® and island and coastal tide gauge records are processed (which involves quality control, de-spiking,
and de-tiding) as described in Mungov et al (2012). Special attention was paid to fix the drifts in the records
composed by initial exponential segment, with length between two days and two weeks, followed by a linear or
close to linear trend along the rest of the record. This phenomena is described by Paros and Kobayashi
(http://paroscientific.com/pdf/G8101_Root_Causes_of_Quartz_Sensors_Drift.pdf). posted on the Paroscientific
web site. Initial exponential segments are approximated with higher-order polynomial functions, and trends in
the following segments are approximated with linear relationships.
All DART® records were decimated to one hour time series, and the residuals from the individual deployments
were centered to one common level. These new long records are considered homogeneous as all deployments
are very close to each other because we are looking at larger-scale processes. Daily mean values were taken as
an arithmetic mean for consistency with satellite altimeter sea level anomalies (SLA) and coastal tide gauge
records.
Atmosphere pressure time series are extracted for the centers of the 1/4 degree grids where the 17 selected
DART® stations are located. Atmosphere pressure time series are interpolated to reach a 1-hour time step.
Residuals corrected for the variations of the atmospheric pressure at the ocean surface are known as “adjusted
residuals,” and we get them using standard inverse barometric correction - Pugh (1987). The relationship we use
is the same used in the Jason-3 Products Handbook (CNES, EUMETSAT, JPL, NESDIS. 2018), page 56:
inv_bar_corr = -9.948 (Patm -1013.3)
Tide gauge data had different time steps of 1 minute, 6 minutes and 1 hour. All records were decimated to 1
hour time step and they were quality controlled and cleaned from instrumental issues. The residuals were
obtained after applying tidal analysis, and daily mean values were estimated for all records.
Verification of DART® data against multi-satellite merged sea surface height anomalies
As noted earlier, this study uses daily time series data multi-satellite merged sea surface height anomalies
(SSHA) picked from the 1/4 degree gridded optimal interpolated daily sea level anomaly
(https://coastwatch.noaa.gov/cw/satellite-data-products/sea-surface-height/sea-level-anomaly-and-geostrophic-
currents-multi-mission-global-optimal-interpolation-gridded.html). The daily mean time series are obtained
from all available satellite missions. The repeat period for the crossover points for Jason satellites is 5 days.
5 Virtual OSTST meeting (19-23 October 2020) https://meetings.aviso.altimetry.fr/
Figure 1. Used DARTs, islands and coastal tide gauge stations.
Table 1 Selected DART® stations and corresponding island and coastal tide gauges
Used DART stations
Used Island/Coastal tide gauges
DART Approximate location Latitude Longitude Island/Coastal station Latitude Longitude
NE Pacific close to Japan Islands
21413 700 NM ESE of Tokyo, JP 30.580 152.099 Wake I., 19.290 166.618
21415 175 NM South of Attu, AK 50.176 171.849 Atka, AL, 52.232 -174.173
21419 209 NM SE of Kuril Is 44.455 155.735 Kushiro, Japan 42.967 144.383
North Pacific close to Aleutian Islands and US Alaska Pacific coast
46408 212 NM South of Umnak Is, AK 49.623 -169.848 Nikolski, AL 52.941 -168.871
46409 210 NM SE of Kodiak, AK 55.301 -148.495 Seaward, AL
Alitak, AL
60.120
56.897
-149.427
-154.248
East Pacific, off US and Mexico Pacific coasts
46411 150 NM West of Mendocino Bay, CA 39.329 -127.010 Port Chicago
Arena Cove
Crescent City
38.0560
38.9146
41.7456
-122.0395
-123.7111
-124.1844
43412 240 NM SW of Manzanillo, MX 16.031 -107.000 Acapulco, MX
Clipperton, FR
(2011/08 – 2012/10)
16.838
10.280
-99.9033
-109.222
32411 710 NM WSW of Panama City, Panama 5.000 -90.686 Quepos, Coasta Rica 9.425 -84.172
32413 1000 NM WNW of Lima, Peru -7.400 -93.499 Santa Cruz, Galapagos -0.755 -90.313
Central Pacific - off Hawaii Islands
51407 34 NM West of Kailua-Kona, HI 19.578 -156.586 Kawaihae, HI 20.037 -155.829

6 Virtual OSTST meeting (19-23 October 2020) https://meetings.aviso.altimetry.fr/
West Central Pacific
51426 400 NM SE of Tonga -23.007 -168.111 Nuku’alofa, Tonga -21.133 -175.167
52402 540 NM ESE of Saipan 11.882 154.104 Kwajalein. HI 8.732 167.736
52403 345 NM North of Manus Is, New Guinea 4.052 145.608 Lombrum, PNG -2.042 147.374
52405 725 NM West of Agana, Guam 12.884 132.317 Apra Harbor, Guam
Pago Bay, Guam
13.439
13.428
144.654
144.797
Caribbean basin and West Atlantic (Bermuda)
41421 300 NM North of St Thomas, Virgin Is 23.398 -63.904 Mona Island -67.939 -67.939
42407 230 NM SW of San Juan, PR 15.256 -68.236 Caja de Muertos, PR
Lime Tree, PR
17.887
17.695
-66.528
-64.754
44401 790 NM NNE of Bermuda 37.551 -49.986 St. Georges I., Bermuda 32.373 -64.703
For the days between, all available observations from other satellite missions are used or the intermediate points
are obtained on a time segment of -10 days to +10 days using a temporal correlation length scale as described in
Jacobs et al. (2001). Time series plots of DART® adjusted residuals and merged altimeter SSH anomalies are
represented in Figure 2. The strong high-frequency oscillations in the adjusted DART® residuals are due to
similar high-frequency oscillations in the atmospheric pressure data. For this reason, it was necessary to smooth
adjusted DART® residuals with a 5-day running average.
Figure 2. DART® adjusted daily mean residuals and merged altimeter SSHA. DART® adjusted SSHA – blue lines, 5 days smoothed
DARTs adjusted SSHA - read lines, altimeter SSHA - black lines. For consistency we keep same vertical and horizontal scales
everywhere.
Aleutian Islands, North Pacific
DART® 46408 DART® 46409
North West Pacific, off the coasts of Japan US West Coast
DART® 21415 DART® 46419

7 Virtual OSTST meeting (19-23 October 2020) https://meetings.aviso.altimetry.fr/
Central Pacific – off Hawaii Islands
DART® 51407
Central West Pacific Central East Pacific
DART® 52405 DART® 43412
DART® 52403 DART® 32411
South Pacific
DART® 51426

8 Virtual OSTST meeting (19-23 October 2020) https://meetings.aviso.altimetry.fr/
Atlantic Ocean
Off US East Coast DART® 44401 North of US Virgin Islands DART® 41421
Caribbean basin
DART® 42407
The analysis of the plots reveals that adjusted DART® SSHA and altimeter SSHA are in very good agreement
for the West Atlantic (off East US coast) DART® 44401 (44403) and the North West Pacific off the Japan
Islands. The very intensive atmospheric processes into the synoptic time scale are a common feature of these
regions. For all other regions, altimeter SSHA represent the seasonal dynamics in the ocean topography, while
DART® SSHA could be used for representing sub-scale variations not existing in altimeter data. Energy spectra
of DART® adjusted daily SSHA, 5 days smoothed DART® adjusted SSHA and merged altimeter SSHA are
presented in Figure 3 along with the frequency coherence function between DART® 44401 and altimeter SSHA.
Figure 3. Spectra of DART® adjusted daily SSHA – blue lines, 5 days smoothed DART® adjusted SSHA – red lines, altimeter SSHA
- black lines.
Aleutian Islands, North Pacific
DART® 46408 DART® 46409

9 Virtual OSTST meeting (19-23 October 2020) https://meetings.aviso.altimetry.fr/
North West Pacific, off the coasts of Japan US West Coast
DART® 21419 DART® 46411
Central West Pacific Central Pacific Central East Pacific
DART® 52405 DART® 51407 DART® 32413
South Pacific
DART® 51426
Atlantic Ocean
North West Atlantic North of US Virgin Islands
DART® 44401 (44403) DART® 41421

10 Virtual OSTST meeting (19-23 October 2020) https://meetings.aviso.altimetry.fr/
Coherence Caribbean basin
DART® 44401 – altimeter SSHA DART® 42407
Investigating the power spectra, we see one general feature – the energy of the altimeter spectra is higher at
lower frequencies, and after the peak the energy decreases almost linearly towards higher frequencies. We
explain this behavior by noting the fact that although the time step of altimeter SSHA is one day, the repeating
cycle of Jason’s satellites at crossover points is 5 days and the contribution of other satellite data is not
sufficient to reveal the short period variations that are available in DART® records or the averaging between
several altimeter data that is smoothing/smashing these variations. As a result altimeter SSHA on time series
plots look “smoothed” with no short-period oscillations as seen in DART® records. The benefit of this analysis
is that DART® and altimeter records could be used in parallel as DART® data discover the “fine” or high-
frequency components while altimeter data reveal low-frequency components - mostly the seasonal variations.
Of course this is only possible in the vicinity of DART® deployments.
Verification of DART® data against island/coastal tide gauge data
When comparing DART® adjusted SSHA with coastal or island tide gauge record, it is necessary to consider
several facts.
- These tide gauges are not located close to DART® deployments. For this reason, if the distance between
the DART® deployment site and the tide gauge is very big, the two types of records could have different
features (i.e., different behavior).
- Coastal tide gauges are significantly influenced by local topographic features, such as the dimensions of
the continental/island shelf. Also, as a general practice, tide gauges are installed in ports or inside bays,
which contributes to additional amplification of the recorded water levels during storms, local seiches,
etc.
- As we are looking for tide gauge records worldwide, from any available international sources, the
quality of the data differs significantly. This is true of records from different sources, as well as of
records from a single tide gauge, which can experience significant changes in data quality over time.

11 Virtual OSTST meeting (19-23 October 2020) https://meetings.aviso.altimetry.fr/
- As a result of all of these circumstances, for every one DART® record we tried to select the “best
match” from several alternatives (Table 1).
Without going into details, as this part of the study is not directly relevant to the scope of the OSTST meeting,
next we briefly outline our main conclusions.
- Some of the coastal records experience strong influence from local topographic conditions, sometimes
resulting in very strong high-frequency oscillations. These oscillations need smoothing.
- We found that there is a good match between DART® adjusted SSHA and coastal or island tide gauge
record in regions with high atmospheric dynamic. These regions are the same revealed in the previous
section: the North Pacific Ocean and, surprisingly, the Caribbean Basin and around the Hawaii Islands.
We believe that this is due to the fact that in the last cases, matching tide gauges are located on islands
located away from continents with good data, and the distance to the relevant DART® deployment sites
is not too big.
- For all these cases, the maximum coherence was in the range of 0.30 – 0.35 (0.52 for Caribbean DART
42407 and Lime Tree Bay at US Virgin Islands) for frequency band one cycle per 7 to 12 days. For
frequencies lower than one cycle per 12-14 days and for frequencies higher than one cycle per 5-7 days,
the coherence very quickly tends to 0.
- The frequency band one cycle per 7 to 12 (14) days could be considered as a representative for DART®
adjusted SSHA. For lower frequencies, DART® systems do not record the long-period pressure
variations due to BPR container plastic deformations. For frequencies higher than 1 cycle per 5-7 days,
local conditions at DART® deployment sites and at the coastal stations are dominating, along with the
effect of smoothing the high-frequency oscillations in the coastal and DART® adjusted SSHA.
Next, in Figure 4, we present plots of time series, spectra and coherence functions for selected DARTs® and
corresponding tide gauges.
Figure 4. Time series, spectra and coherence plots for selected DART® adjusted SSHA – blue lines, smoothed DARTs adjusted
SSHA – red lines, and island/coastal tide gage residuals – black lines.

12 Virtual OSTST meeting (19-23 October 2020) https://meetings.aviso.altimetry.fr/
North Pacific: Time series plots for DART 21415 and 9461710 Atka, Alaska for 2012 - 2015
Spectra and coherence for DART 21415 and 9461710 Atka, Alaska
Central Pacific, Hawaii: Time series plots for DART 51407 and tide gauge Kawaihae, HI, USA for 2012 - 2015
Spectra and coherence for DART 51407 and tide gauge Kawaihae, HI, USA

13 Virtual OSTST meeting (19-23 October 2020) https://meetings.aviso.altimetry.fr/
Caribbean basin: Time series plots for DART 42407 and tide gauge Lime Tree Bay at US Virgin Islands for 2012 - 2015
Spectra and coherence for DART 42407 and tide gauge Lime Tree Bay at US Virgin Islands
Conclusions
We found that there is a good match between DART® adjusted SSHA with altimeter SSHA and coastal or
island tide gauge records in regions with high atmospheric dynamics. These regions are: the North Pacific
Ocean along Japan and the Aleutian Islands and Alaska; around the Hawaii Islands; the West Atlantic off the
US East Coast, and the Caribbean Basin. Our findings indicate that in these regions DART® adjusted SSHA
characterize the open-ocean water level variations in the frequency band one cycle per 7 to 12 (14) days. For
lower frequencies (periods longer than 1 cycle per 12-14 days), DART® systems do not record the long-period
pressure variations due to BPR container plastic deformations. For frequencies higher than 1 cycle per 5-7 days,
local conditions at DART® deployment sites and at the coastal stations are dominating along with the effect of
the smoothing the high-frequency oscillations in the coastal and DART® adjusted SSHA.
The smoothed pattern of altimeter SSHA indicates that this behavior is determined by the 5-day repeating cycle
of Jason’s satellites at crossover points, as the involvement of other satellite data does not contribute to the
revealing of the short period variations that are available in DART®. But at the same time, DART® and
altimeter records could be used in parallel as DART® data discover the “fine” or high-frequency components
while altimeter data represent low-frequency components, such as seasonal variations.

14 Virtual OSTST meeting (19-23 October 2020) https://meetings.aviso.altimetry.fr/
Acknowledgments:
We acknowledge the following institutions and persons:
- NOAA/PMEL for developing and continually improving the DART® system,
- NOAA/NDBC for maintaining DART® network for the last 15+ years,
- NOAA/NOS/CO-OPS for establishing and maintaining a network of tsunami-ready tide gauges,
- UNESCO IOC Sea Level Station Monitoring Facility http://www.ioc-sealevelmonitoring.org/
- UHSLC – University of Hawaii Sea Level Center (https://uhslc.soest.hawaii.edu) where we got several
international records,
- Chesley McColl from NOAA/ESRL/PSD for assisting with the 20th Century Reanalysis atmosphere pressure
gridded data,
- Jessica Hausman from NASA/JPL for assisting with PO.DAAC merged altimeter data,
- Jorge Zavala Hidalgo from UNAM, Mexico, for providing Acapulco tide gauge data,
- Vincent Donato from SHOM, Brest, France, for providing Clipperton Island tide gauge data,
- Jesse Warner from NOAA/CIRES for preparing the map.
References
Blewitt, G., Hammond, W.C., Kreemer, C. et al. (2009) GPS for real-time earthquake source determination and
tsunami warning systems. J Geod 83, 335–343 (2009). https://doi.org/10.1007/s00190-008-0262-5
Bernard, E., and C. Meining. History and future of deep-ocean tsunami measurements.
http://paroscientific.com/pdf/140%20DART_History%20with%20notes.pdf. Accessed on August 2020.
CNES, EUMETSAT, JPL, NESDIS. 2018. Jason-3 Products Handbook, Sept 2018, 71 p.
https://www.ospo.noaa.gov/Products/documents/hdbk_j3.pdf
Folger, P. 2015. The U.S. Tsunami Program: A Brief Overview. Congressional Research Service 7-5700.
www.crs.gov, R41686
González F. I., E. Bernard, C. Meinig , M. Eble, H. Mofjeld, S. Stalin. (2005) The NTHMP Tsunameter
Network, Natural Hazards, Springer, vol. 35(1), pages 25-39, May.
González, F.I., V.V. Titov, H.O. Mofjeld, A. Venturato, S. Simmons, R. Hansen, R. Combellick, R. Eisner, D.
Hoirup, B. Yanagi, S. Yong, M. Darienzo, G. Priest, G. Crawford, and T. Walsh (2005): Progress in NTHMP

15 Virtual OSTST meeting (19-23 October 2020) https://meetings.aviso.altimetry.fr/
hazard assessment. Nat. Hazards, 35(1), Special Issue, U.S. National Tsunami Hazard Mitigation Program, 89–
110.
Gusman, A., Sheehan, A., and Satake, K. (2020) Improving tsunami forecast with data assimilation on dense
pressure gauge arrays: the 2009 Dusky Sound, New Zealand, tsunami, EGU General Assembly 2020, Online,
4–8 May 2020, EGU2020-11411, https://doi.org/10.5194/egusphere-egu2020-11411, 2020
Jacobs, G., Barron, C., Rhodes, R. (2001). Mesoscale characteristics Journal of Geophysical Research: Oceans
106(C9), 19581-19595. https://dx.doi.org/10.1029/2000jc000669
Jakir M. H., I. E. Mulia , D. , A. F. Sheehan (2020) Data Assimilation for Tsunami Forecast with Shipborne
GNSS Data in the Cascadia Subduction Zone. CU CIREZ Rendezvous 2020.
https://insidecires.colorado.edu/rendezvous/uploads/Rendezvous_2020_7748_1597254956.pdf
Leuliette, E. W., and R. Scharroo (2010). Integrating Jason-2 into a Multiple-Altimeter Climate Data Record.
Marine Geodesy, 33(1), 504–517. doi:10.1080/01490419.2010.487795
Mofjeld, H.O. (2009), Tsunami measurements. In The Sea, Volume 15: Tsunamis (eds. A. Robinson and E.
Bernard), (Harvard University Press, Cambridge, MA, 2009) pp. 201–235.
Maeda, T., Obara, K., Shinohara, M., Kanazawa, T., & Uehira, K. (2015). Successive estimation of a tsunami
wavefield without earthquake source data: A data assimilation approach toward real‐time tsunami forecating.
Geophysical Research Letters, 42, 7923–7932. https://doi.org/10.1002/2015GL065588
Meinig, C., S.E. Stalin, A.I. Nakamura, H.B. Milburn (2005), Real-Time Deep-Ocean Tsunami Measuring,
Monitoring, and Reporting System: The NOAA DART® II Description and Disclosure. NCTR,
https://nctr.pmel.noaa.gov/Dart/Pdf/DART_II_Description_6_4_05.pd
Mulia, I.E., Hirobe, T., Inazu, D. et al. Advanced tsunami detection and forecasting by radar on unconventional
airborne observing platforms. Sci Rep 10, 2412 (2020). https://doi.org/10.1038/s41598-020-59239-1
Mungov, G., Eble´, M., & Bouchard, R. (2013). DART® tsunameter retrospective and real-time data: A
reflection on 10 years of processing in support of tsunami research and operations. Pure and Applied
Geophysics, 170, 1369–1384. doi:10.1007/s00024-012-0477-5.
16 Virtual OSTST meeting (19-23 October 2020) https://meetings.aviso.altimetry.fr/
NOAA-CIRES-DOE 20th Century Reanalysis Version 3 completed 1836-2015: early evaluation initiation.
NOAA, ESRL, Boulder, Colorado.
Paros, J. M., and T. Kobayashi. Root causes of Quartz Sensor Drift. Paroscientific, Technical Note, Doc. No.
G8101 Rev. A. http://paroscientific.com/pdf/G8101_Root_Causes_of_Quartz_Sensors_Drift.pdf
Pugh, D. T. 1987. Tides, surges and mean sea-level. Natural Environmental Research Council, Swindon, UK.
Satake, K. 1987. Inversion of tsunami waveforms for the estimation of a fault heterogeneity: Method and
numerical experiments. Journal of Physics of the Earth, 35, 241–254
Satake, K. 1989. Inversion of tsunami waveforms for the estimation of heterogeneous fault motion of large
submarine earthquakes: The 1968 Tokachi‐oki and 1983 Japan Sea earthquakes. JGR, Solid Earth, vol. 94, issue
b5, 5627-5636. https://doi.org/10.1029/JB094iB05p05627
Wang, Y., Satake, K., Maeda, T. et al. (2018) Data assimilation with dispersive tsunami model: a test for the
Nankai Trough. Earth Planets Space 70, 131. https://doi.org/10.1186/s40623-018-0905-6
Wang, Y., Maeda, T., Satake, K., Heidarzadeh, M., Su, H., Sheehan, A. F., & Gusman, A. R. (2019). Tsunami
data assimilation without a dense observation network. Geophysical Research Letters, 46.
https://doi.org/10.1029/2018GL080930