comparison of simulated runoff in the yakima river basin ... · about 45% of water diverted for...
TRANSCRIPT
•Watershed and River Management Program (WaRSMP)
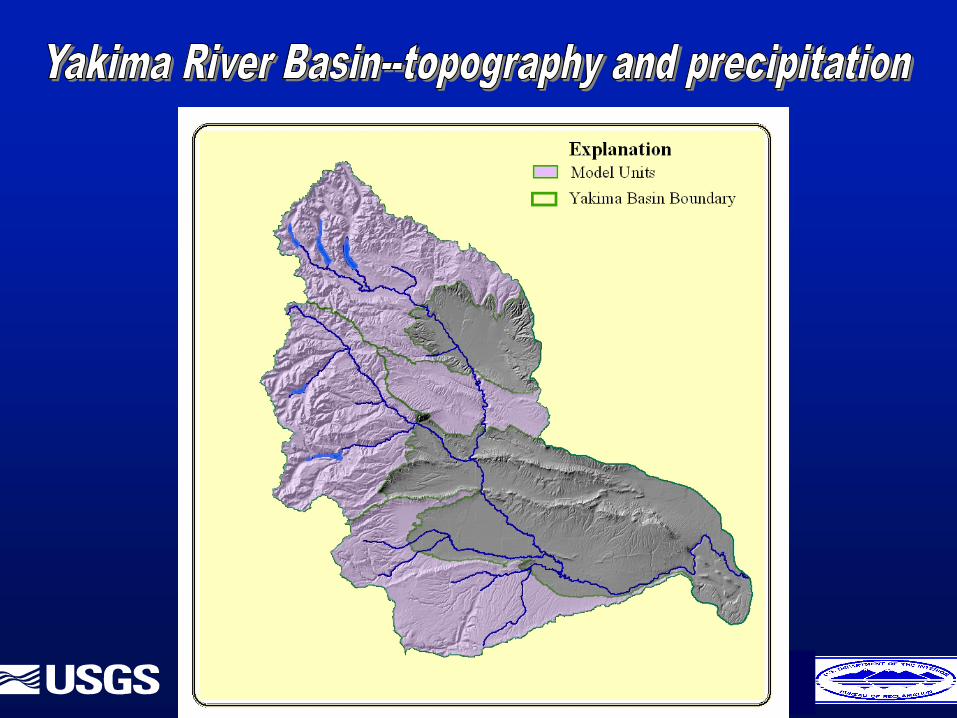
•Description of Yakima River Basin and Yakima Storage Project
•MMS and Yakima River Basin models
•Global Climate-Change assumptions
•Comparison of Watershed simulations—present versus GCC scenarios
Mark Mastin Warren Sharp
••
Cooperative USGS / Bureau of Cooperative USGS / Bureau of Reclamation program Reclamation program
••
Purpose is research, development, and Purpose is research, development, and implementation of a Decision Support implementation of a Decision Support System to achieve equitable balance System to achieve equitable balance among water resource issues.among water resource issues.
RiverWare
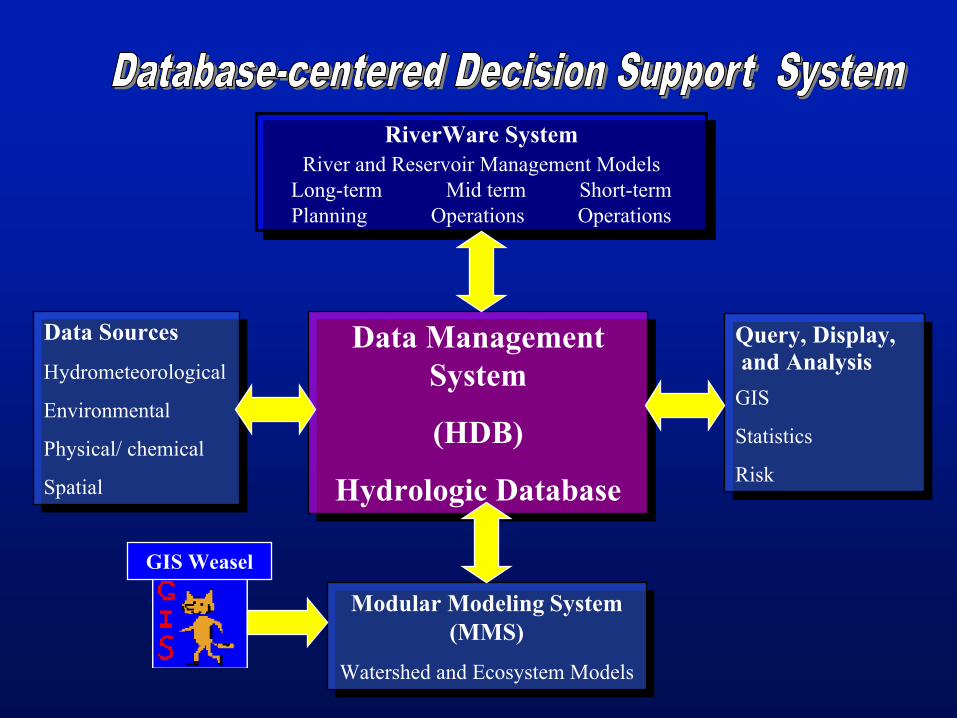
SystemRiver and Reservoir Management Models
Long-term Mid term Short-termPlanning Operations Operations
RiverWare
SystemRiver and Reservoir Management Models
Long-term Mid term Short-termPlanning Operations Operations
Data Management System
(HDB)
Hydrologic Database
Data Management System
(HDB)
Hydrologic Database
Modular Modeling
System (MMS)
Watershed and Ecosystem Models
Modular Modeling
System (MMS)
Watershed and Ecosystem Models
Query, Display,and Analysis
GIS
Statistics
Risk
Query, Display,and Analysis
GIS
Statistics
Risk
Data SourcesHydrometeorological
Environmental
Physical/ chemical
Spatial
Data SourcesHydrometeorological
Environmental
Physical/ chemical
Spatial
GIS Weasel


0
5
10
15
20
25
30
35
40
45
50
OCT NOV DEC JAN FEB MAR APR MAY JUN JUL AUG SEP0
2000
4000
6000
8000
10000
12000
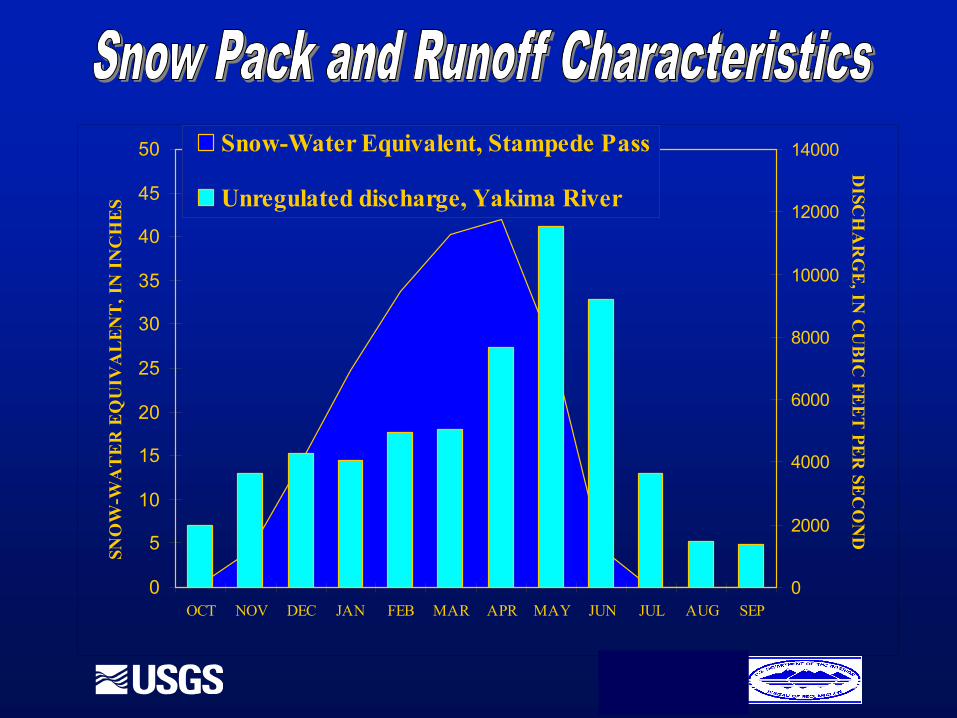
14000Snow-Water Equivalent, Stampede Pass
Unregulated discharge, Yakima River
SNO
W-W
AT
ER
EQ
UIV
AL
EN
T, I
N I
NC
HE
SD
ISCH
AR
GE
, IN C
UB
IC FE
ET
PER
SEC
ON
D
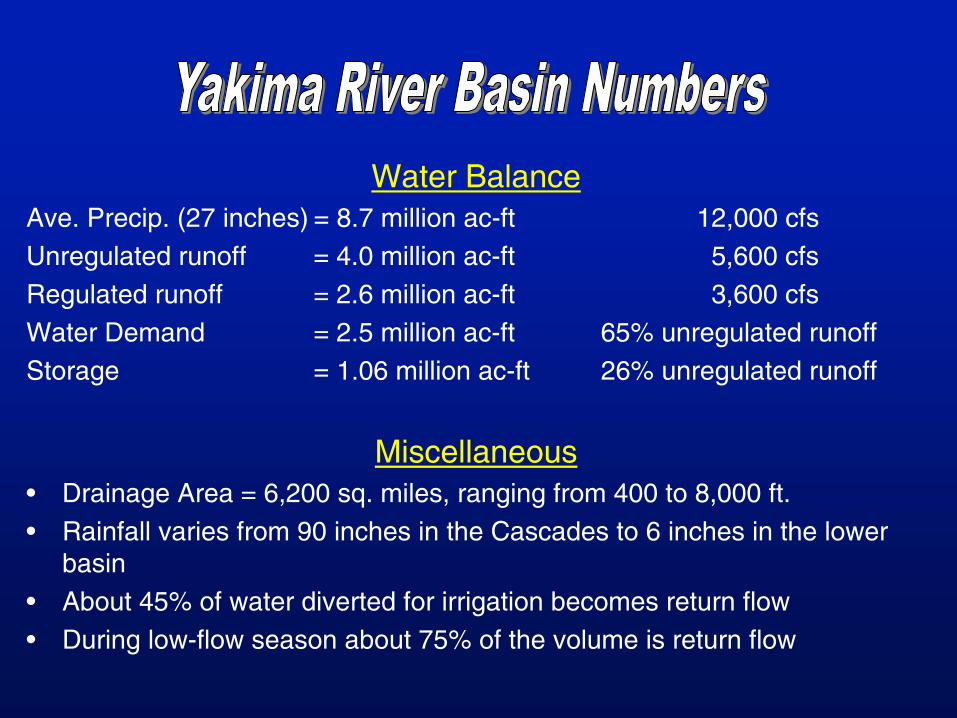
Water BalanceAve. Precip. (27 inches)
= 8.7 million ac-ft
12,000 cfsUnregulated runoff
= 4.0 million ac-ft
5,600 cfsRegulated runoff
= 2.6 million ac-ft
3,600 cfsWater Demand
= 2.5 million ac-ft
65% unregulated runoffStorage
= 1.06 million ac-ft
26% unregulated runoff
Miscellaneous•
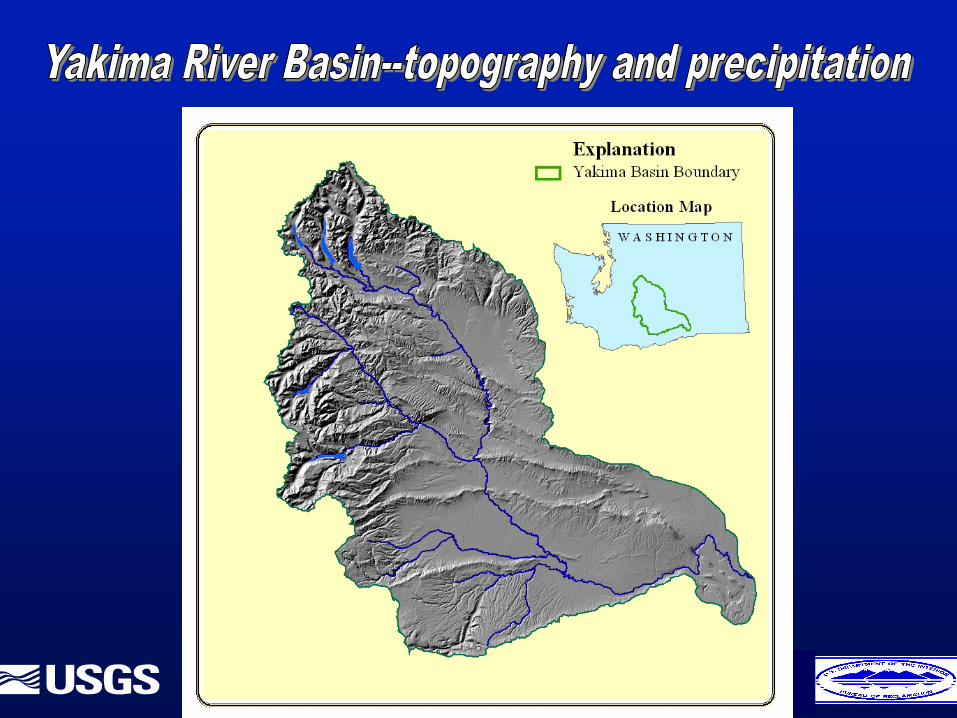
Drainage Area = 6,200 sq. miles, ranging from 400 to 8,000 ft.•
Rainfall varies from 90 inches in the Cascades to 6 inches in the lower basin
•
About 45% of water diverted for irrigation becomes return flow•
During low-flow season about 75% of the volume is return flow
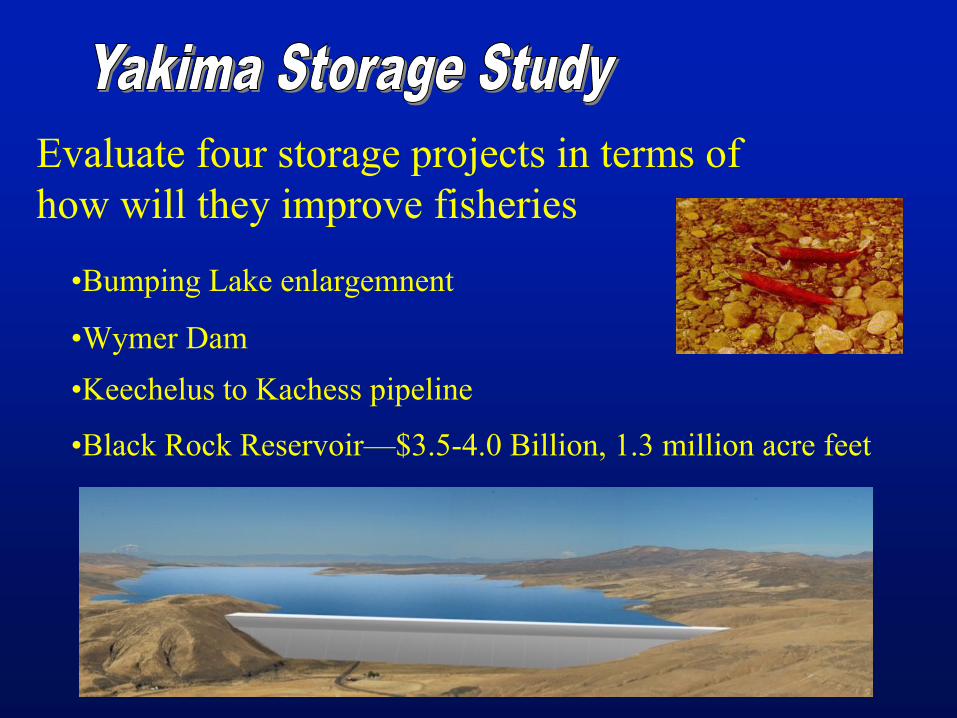
Evaluate four storage projects in terms of how will they improve fisheries
•Bumping Lake enlargemnent
•Wymer
Dam•Keechelus
to Kachess
pipeline
•Black Rock Reservoir—$3.5-4.0 Billion, 1.3 million acre feet
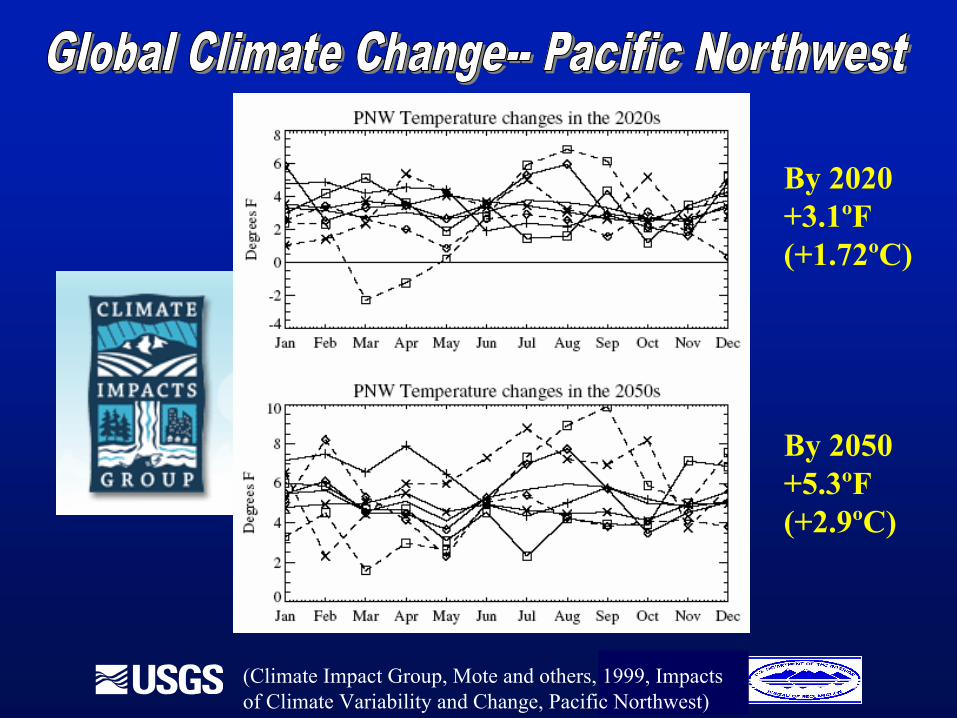
By 2020 +3.1ºF (+1.72ºC)
By 2050 +5.3ºF (+2.9ºC)
(Climate Impact Group, Mote and others, 1999, Impacts of Climate Variability and Change, Pacific Northwest)

(Climate Impact Group, Mote and others, 1999, Impacts of ClimateVariability and Change, Pacific Northwest)
“Projections of temperature changes, both globally and regionally, are made with higher confidence than precipitation changes.”
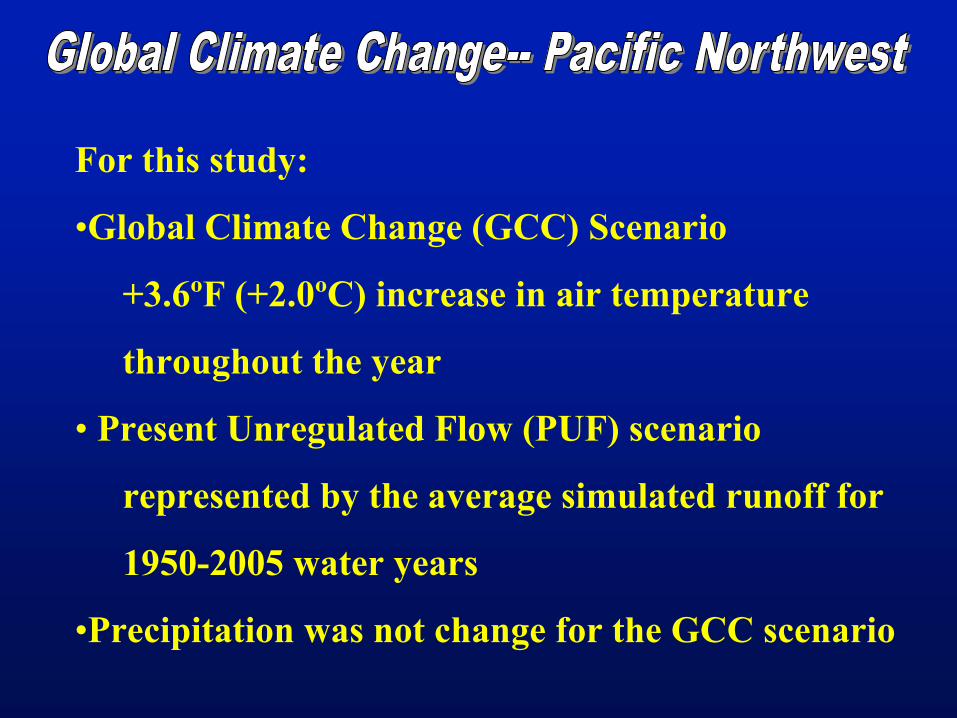
For this study:
•Global Climate Change (GCC) Scenario
+3.6ºF (+2.0ºC) increase in air temperature
throughout the year
• Present Unregulated Flow (PUF) scenario
represented by the average simulated runoff for
1950-2005 water years
•Precipitation was not change for the GCC scenario

About 95 percent of the runoff at Yakima River near Parker is generated from the four modeling units:
•Upper Yakima
•Naches
•Toppenish/Satus
•Yakima Canyon

Upper Yakima Modeling Unit
•404 MRUs
•17 subbasins
•21 nodes
•14 precipitation inputs
•13 temperature inputs
•over 54,000 parameters
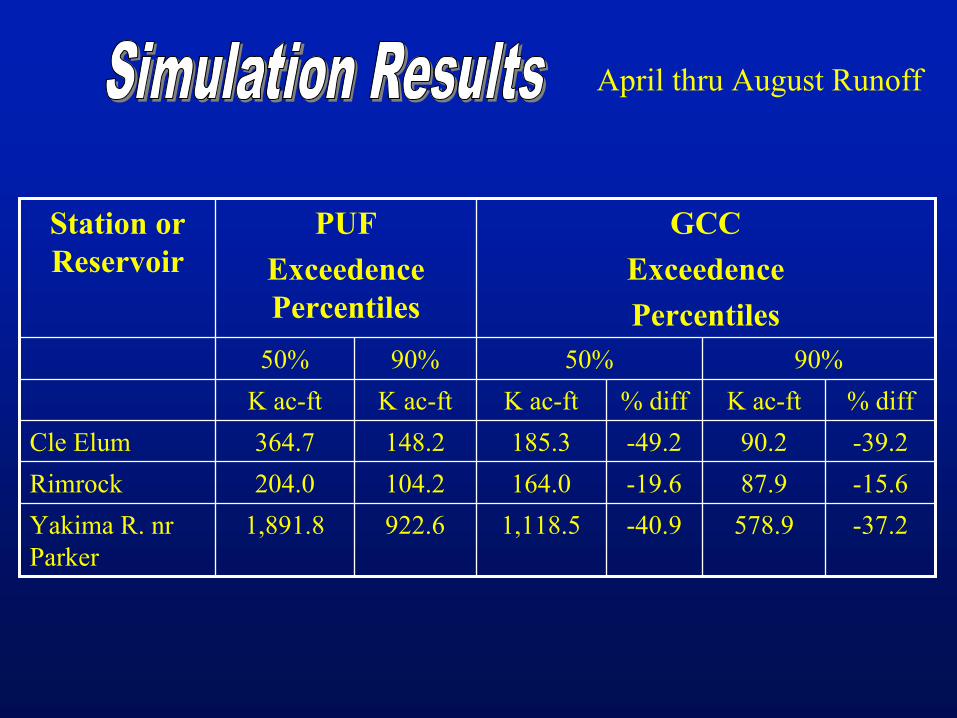
Station or Reservoir
PUFExceedence Percentiles
GCCExceedence Percentiles
50% 90% 50% 90%K ac-ft K ac-ft K ac-ft % diff K ac-ft % diff
Cle Elum 364.7 148.2 185.3 -49.2 90.2 -39.2Rimrock 204.0 104.2 164.0 -19.6 87.9 -15.6Yakima R. nr Parker
1,891.8 922.6 1,118.5 -40.9 578.9 -37.2
April thru August Runoff

0
5,000
10,000
15,000
20,000
25,000
10/1 10/31 11/30 12/31 1/30 3/2 4/1 5/1 6/1 7/1 8/1 8/31 9/30
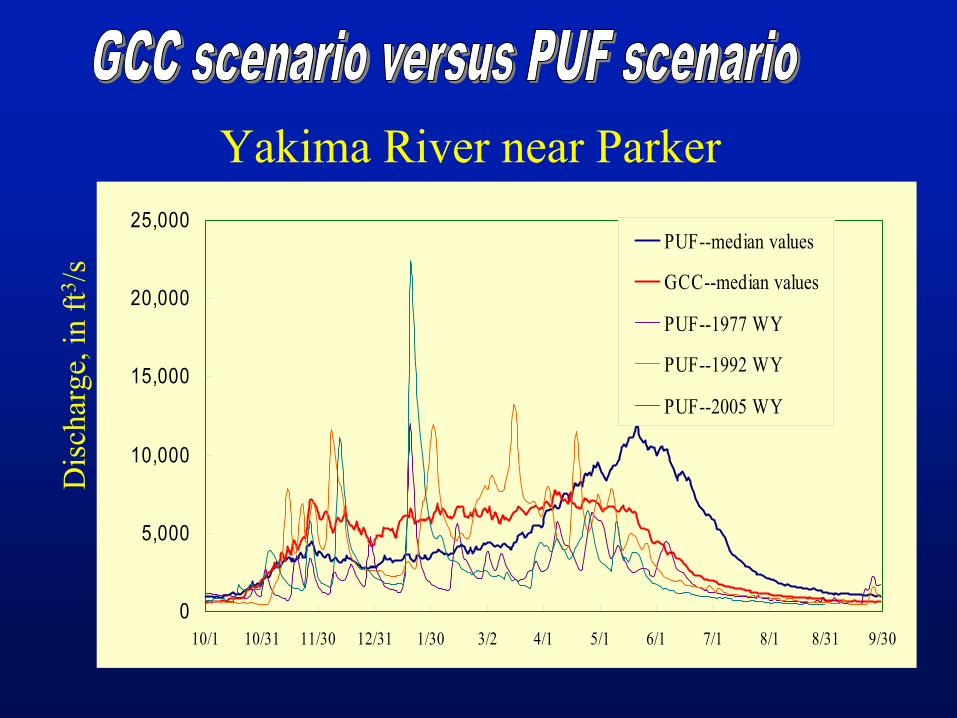
PUF--median values
GCC--median values
PUF--1977 WY
PUF--1992 WY
PUF--2005 WY
Dis
char
ge, i
n ft3 /s
Yakima River near Parker
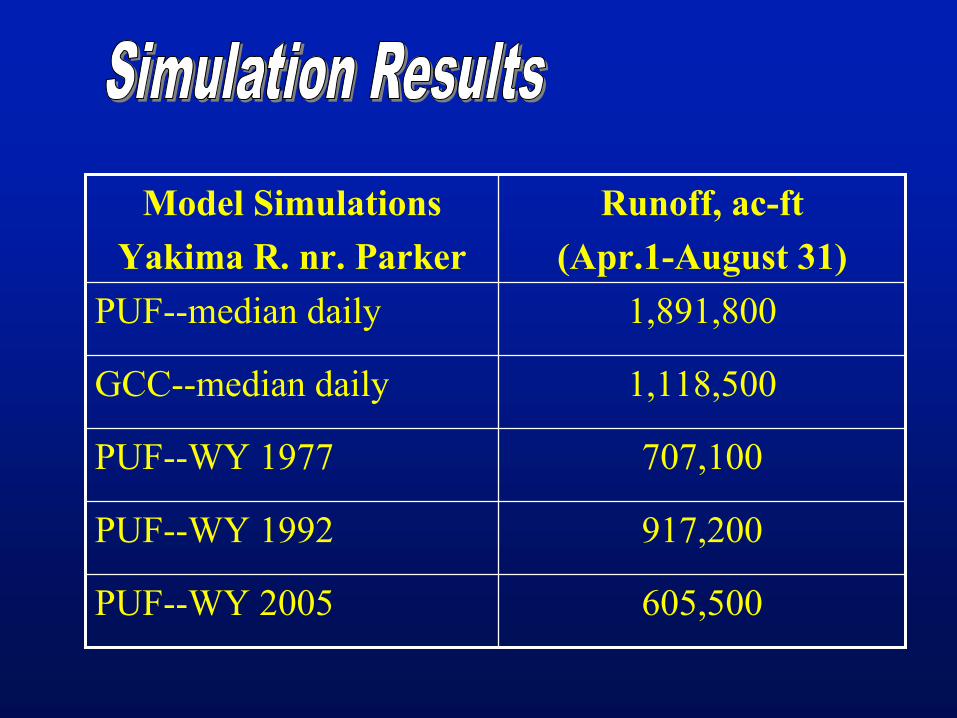
Model SimulationsYakima R. nr. Parker
Runoff, ac-ft (Apr.1-August 31)
PUF--median daily 1,891,800
GCC--median daily 1,118,500
PUF--WY 1977 707,100
PUF--WY 1992 917,200
PUF--WY 2005 605,500

Model SimulationsYakima R. nr. Parker
Runoff, ac-ft (Apr.1-August 31)
PUF--90% exceedence 922,600
GCC--90% exceedence 579,000
PUF--WY 1977 707,100
PUF--WY 1992 917,200
PUF--WY 2005 605,500
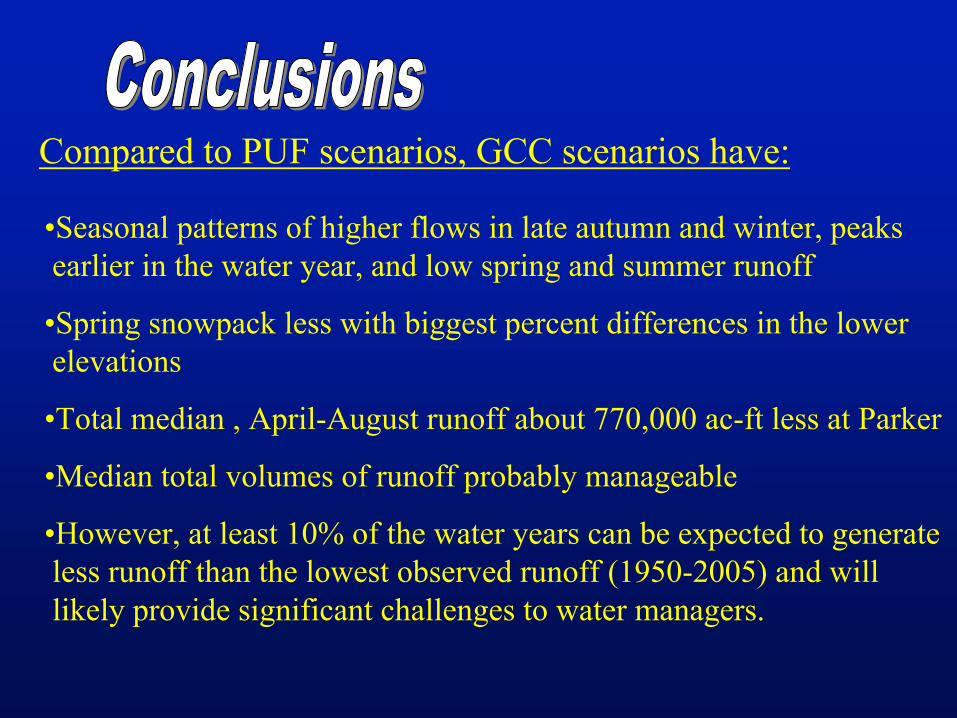
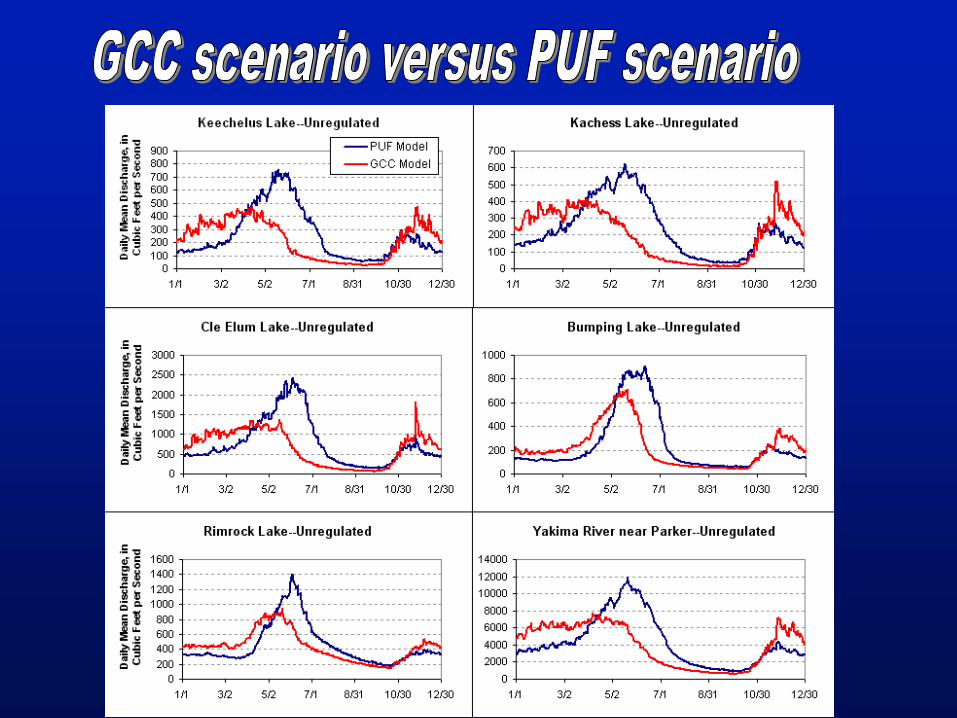
Compared to PUF scenarios, GCC scenarios have:
•Seasonal patterns of higher flows in late autumn and winter, peaks earlier in the water year, and low spring and summer runoff
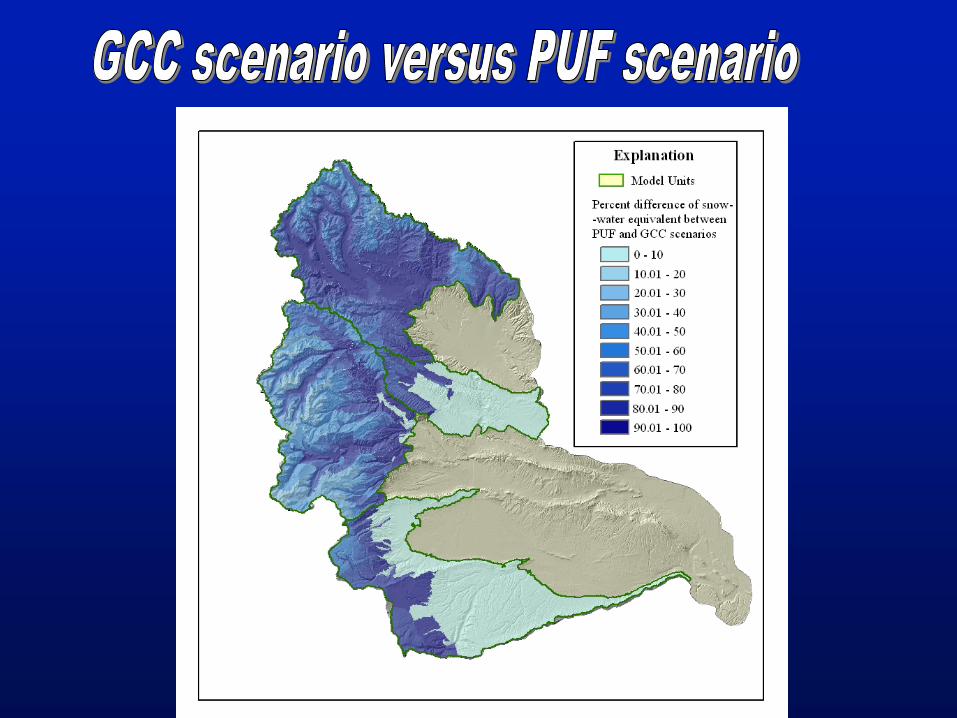
•Spring snowpack
less with biggest percent differences in the lower elevations
•Total median , April-August runoff about 770,000 ac-ft less at Parker
•Median total volumes of runoff probably manageable
•However, at least 10% of the water years can be expected to generate less runoff than the lowest observed runoff (1950-2005) and will
likely provide significant challenges to water managers.
http://http://wwwbrr.cr.usgs.gov/warsmpwwwbrr.cr.usgs.gov/warsmp
http://http://wwwbrr.cr.usgs.govwwwbrr.cr.usgs.gov/mms/mms
http://http://wwwbrr.cr.usgs.govwwwbrr.cr.usgs.gov/weasel/weasel