comparison of propensity score methods and covariate ...stuart j. pocock, phda abstract propensity...
TRANSCRIPT

Listen to this manuscript’s
audio summary by
JACC Editor-in-Chief
Dr. Valentin Fuster.
J O U R N A L O F T H E AM E R I C A N C O L L E G E O F C A R D I O L O G Y V O L . 6 9 , N O . 3 , 2 0 1 7
ª 2 0 1 7 B Y T H E AM E R I C A N C O L L E G E O F C A R D I O L O G Y F O U N D A T I O N
P U B L I S H E D B Y E L S E V I E R
I S S N 0 7 3 5 - 1 0 9 7 / $ 3 6 . 0 0
h t t p : / / d x . d o i . o r g / 1 0 . 1 0 1 6 / j . j a c c . 2 0 1 6 . 1 0 . 0 6 0
REVIEW TOPIC OF THE WEEK
Comparison of Propensity Score Methodsand Covariate AdjustmentEvaluation in 4 Cardiovascular Studies
Markus C. Elze, PHD,a,b John Gregson, PHD,a Usman Baber, MD, PHD,c Elizabeth Williamson, PHD,a
Samantha Sartori, PHD,c Roxana Mehran, MD, PHD,c Melissa Nichols, PHD,d,e Gregg W. Stone, MD, PHD,d,e
Stuart J. Pocock, PHDa
ABSTRACT
Fro
Pe
Me
Pre
em
Inc
Re
Me
rel
Co
Me
va
Eli
Ma
Propensity scores (PS) are an increasingly popular method to adjust for confounding in observational studies. Propensity
score methods have theoretical advantages over conventional covariate adjustment, but their relative performance in
real-word scenarios is poorly characterized. We used datasets from 4 large-scale cardiovascular observational studies
(PROMETHEUS, ADAPT-DES [the Assessment of Dual AntiPlatelet Therapy with Drug-Eluting Stents], THIN [The Health
Improvement Network], and CHARM [Candesartan in Heart Failure-Assessment of Reduction in Mortality and Morbidity])
to compare the performance of conventional covariate adjustment with 4 common PS methods: matching, stratification,
inverse probability weighting, and use of PS as a covariate. We found that stratification performed poorly with few
outcome events, and inverse probability weighting gave imprecise estimates of treatment effect and undue influence to a
small number of observations when substantial confounding was present. Covariate adjustment and matching performed
well in all of our examples, although matching tended to give less precise estimates in some cases. PS methods are not
necessarily superior to conventional covariate adjustment, and care should be taken to select the most suitable method.
(J Am Coll Cardiol 2017;69:345–57) © 2017 by the American College of Cardiology Foundation.
E valuations of therapeutic interventionsgenerally fall into 2 categories, observationalstudies and randomized controlled trials
(RCTs). The choice of treatment in observationalstudies may be influenced by patient characteristics,for example, higher-risk patients may be more or lesslikely to receive the intervention. Some of these
m the aDepartment of Biostatistics, London School of Hygiene and Tropi
diatric Oncology Drug Development, F. Hoffmann-La Roche AG, Basel, Sw
dicine at Mount Sinai, New York, New York; dDivision of Cardiology
sbyterian Hospital, New York, New York; and the eCardiovascular Resea
ployee of and owns stock in F. Hoffmann-La Roche AG. Dr. Mehran has re
., Bristol-Myers Squibb, AstraZeneca, The Medicines Company, OrbusNeich
search Partners, Novartis Pharmaceuticals, Medtronic, AUM Cardiovascula
dical Center; is a compensated member of the Janssen Pharmaceuticals and
ationships with Watermark Research Partners; is a consultant for Medscape
mpany, Cardiovascular Systems Inc., Sanofi USA, Shanghai BraccoSine Pha
dical and Elixir Medical; is a consultant for Medscape, The Medicines Com
scular Systems Inc., Sanofi USA, Shanghai BraccoSine Pharmaceutical, and
xir Medical. All other authors have reported that they have no relationship
nuscript received September 16, 2016; accepted October 19, 2016.
differences are collected in standard databases,whereas others are not (e.g., frailty). In contrast,when studying the effect of an intervention in RCTs,confounding from both measured and unmeasuredvariables is avoided, and RCTs are thus generallyconsidered the highest form of scientific investi-gation. Nonetheless, accurate treatment effect
cal Medicine, London, United Kingdom; bInnovative
itzerland; cCardiovascular Institute, Icahn School of
, Columbia University Medical Center, New York-
rch Foundation, New York, New York. Dr. Elze is an
ceived research support from Eli Lilly/Daiichi-Sankyo
, Bayer, CSL Behring, Abbott Laboratories, Watermark
r Inc., Cardiovascular Inc., and Beth Israel Deaconess
Osprey Medical Executive Committees; has financial
, The Medicines Company, Boston Scientific, Merck &
rmaceutical, and AstraZeneca; holds equity in Claret
pany, Boston Scientific, Merck & Company, Cardio-
AstraZeneca; and holds equity in Claret Medical and
s relevant to the contents of this paper to disclose.

ABBR EV I A T I ON S
AND ACRONYMS
BMI = body mass index
HPR = high platelet reactivity
IPW = inverse probability
weighting
MACE = major adverse
cardiovascular event(s)
PS = propensity score(s)
RCT = randomized controlled
trial
Elze et al. J A C C V O L . 6 9 , N O . 3 , 2 0 1 7
Propensity Score Methods Versus Covariate Adjustment J A N U A R Y 2 4 , 2 0 1 7 : 3 4 5 – 5 7
346
estimates from observational databases canprovide complementary value to RCTs. Thisis particularly true when RCTs enroll highlyselected patients (yielding results not gener-alizable to all real-world scenarios), are small(because of their greater complexity andcost), or are not feasible to conduct (1).
The conventional method used to adjust forbaseline differences between treatmentgroups in observational databases is covariateadjustment, where all relevant patient char-acteristics are included in a regression model
relating the outcome of interest to the alternativetreatments. A commonly cited concern is that suchmodels might be overfitted when the number of co-variates is large compared with the number of patientsor outcome events. Although a rule of thumb is to haveat least 10 events per covariate included in the model(2), more recent opinions favor relaxing this rule (3).
Propensity score (PS) methods are increasinglybeing used in observational studies of cardiovascularinterventions as an alternative to conventionalcovariate adjustment; many such examples can befound published in the Journal (4–7). A PS is definedas the probability of a patient being assigned to anintervention, given a set of covariates (8). As the PSsummarizes all patient characteristics into a singlecovariate, it reduces (although does not eliminate [9])the potential for overfitting. PS methods aim to ach-ieve some of the characteristics of RCTs by compen-sating for different patients having differentprobabilities of being assigned to the exposures underinvestigation. Thus, the aim of these methods is toattenuate problems of confounding of patient char-acteristics and assignment to an intervention typi-cally found in observational studies.
Popular PS methods include stratification, match-ing, inverse probability weighting (IPW), and use ofthe PS as a covariate in a conventional regressionmodel (10–12). However, there is lack of clear guid-ance as to how to make a sensible choice from amongthese various PS methods or conventional covariateadjustment for any given database. We thereforeapplied several PS methods to 4 large-scale observa-tional cardiovascular datasets to critically examinethe specific advantages and pitfalls of the differentmethods and to compare their results with thoseusing classic covariate adjustment.
METHODS
DATASETS. We analyzed data from the CHARM(Candesartan in Heart Failure-Assessment of Reduc-tion in Mortality and Morbidity) program (13), the
ADAPT-DES study (14), the THIN study (15), and thePROMETHEUS study (16). For each dataset, wefocused on 1 “treatment” comparison and 1 outcomeof prime interest. The overall goal was to producerelevant PS models across a range of different set-tings, so for some cases these choices differed fromthe primary objectives of the original publications.The terms treatment and control are used throughoutto simplify the language, even though 1 study (14)performed comparisons for platelet reactivity. Alloutcomes studied were time-to-event, with censoringoccurring at the end of planned follow-up, or at thetime of patient withdrawal or lost to follow-up.
The CHARM program (13) randomized 7,599 pa-tients with chronic heart failure to candesartan orplacebo therapy, with a median follow-up of 3.1 years.We investigated the association between treatmentwith beta-blockers at baseline (3,396 untreated, 4,203treated) and all-cause death (1,831 events). That is, weused the CHARM program as an observational data-base for making inferences about the association be-tween use of beta-blockers and risk of mortality. OurPS model contains cardiovascular risk factors (age,sex, body mass index [BMI], smoking, diabetes), aswell as prior cardiovascular events and hospitaliza-tions (18 variables in all).
The ADAPT-DES study (14) investigated the rela-tionship between high platelet reactivity (HPR) inpatients taking clopidogrel (HPR: n ¼ 4,930; noHPR: n ¼ 3,650) and stent thrombosis and othercardiovascular events at 12 months’ follow-up ina prospective, multicenter registry of patientsreceiving drug-eluting stents. Herein we focusedon stent thrombosis (56 events). The study authorsreported an adjusted hazard ratio (HR) of 2.49 for HPRcompared to patients without HPR. Our PS modelcontained information about age, sex, medication,diabetes, ethnicity, smoking, renal function, andother cardiovascular risk factors (39 variables in all).
The THIN population-based cohort study (15)compared 30,811 statin users with 60,921 patientsnot using statins, treated by the same general practi-tioners (total: n ¼ 91,732) for several outcome events,including all-causemortality (17,296 events, HR: 0.79).The inclusion criteria required at least 12 months offollow-up; thus, the first year must be excluded due toso-called immortality bias. Herein we investigatedthe effect of statin use on all-cause mortality. Thestudy authors reported an adjusted HR of 0.78,comparing statin users with nonusers. Previously, alarge RCT (16) in a similar patient population found anHR of 0.87. Our PS model contained cardiovascularrisk factors, age, sex, BMI, smoking, drinking, othermedications, and other diseases (48 variables in all).
J A C C V O L . 6 9 , N O . 3 , 2 0 1 7 Elze et al.J A N U A R Y 2 4 , 2 0 1 7 : 3 4 5 – 5 7 Propensity Score Methods Versus Covariate Adjustment
347
The PROMETHEUS cohort study (17) comparedprasugrel (treatment) therapy with clopidogrel (con-trol) therapy for major adverse cardiovascular event(MACE) outcomes (death, myocardial infarction,stroke, or unplanned revascularization) at 90 days(1,580 events) in 19,914 patients (4,017 prasugrel;15,587 clopidogrel) using databases from 8 U.S. hos-pitals. The investigators reported an unadjusted HRof 0.58 and an adjusted HR using a PS model of 0.89.Our PS model contained cardiovascular risk factors,age, sex, BMI, smoking, and prior cardiovascularevents, as well as details about the implanted stentand an indicator for study center (35 variables in all).
PROPENSITY SCORES: A BRIEF OVERVIEW. The PSfor an individual is defined as the probability of beingassigned to “treatment” given all relevant covariates(8). The PS is typically estimated using a logisticregression model that incorporates all variables thatmay be related to the outcome and/or the treatmentdecision. All such variables should be included in thelogistic model, regardless of their statistical signifi-cance or collinearity with other variables in the model.However, variables that are exclusively associatedwith the treatment decision but not the outcomeshould not be incorporated (18). As in any predictiveregression model, any variable collected after thetreatment decision should not be used. As far aspossible, covariates identified as relevant in the 4original studies will be incorporated in the PS modelsused here. Note that all relevant variables remain inthe model regardless of their statistical significance.
For each covariate, individuals with the same PSshould have, on average, the same distribution ofthat covariate irrespective of treatment decision(covariate balance). This can be checked using plots ofthe covariate balance or several diagnostic tests.
After the PS has been calculated, there are severaloptions for how to use them to estimate “treatment”effects. Note throughout that, although PS methodsstrive to estimate the true “treatment effect,” theusual caveats for observational studies apply, such asthe inability to include all relevant confounders(especially those unmeasured). As described later,popular PS methods include matching or stratifyingobservations on the basis of the PS, IPW applied toeach observation, or simply including the PS as anadditional variable in a regression model. The moreconventional covariate adjustment offers an alterna-tive to PS techniques by simply incorporating allrelevant covariates into the final model (19).
FOUR PS METHODS. For each dataset, the goal wasto estimate the “treatment” effect on a time-to-eventoutcome, using Cox proportional hazards models.
After creating the PS for each individual, there areseveral ways to adjust for confounding.PS strat ificat ion . PS stratification splits the datasetinto several strata on the basis of the individual’s PSalone, without reference to treatment (exposure)group. A treatment effect is then estimated withineach stratum, and an overall estimated treatmenteffect is calculated by taking a (weighted) averageacross strata. Here, 5 and 10 strata, with an equalnumber of individuals in each stratum, are used. Analternative is to split the range of possible PS intoequal parts, which usually results in fewer in-dividuals in the more extreme strata. Stratificationhas the additional advantage that effect estimatesare available for each stratum, which may revealpotential heterogeneity of “treatment” effects acrossstrata.
PS match ing . PS matching tries to find 1 (or more)individual(s) with similar PS in the treatment andcontrol groups. There are various methods to matchindividuals, but here we use 1:1 nearest-neighbormatching, with an added constraint that the differ-ence between the PS (caliper width) may be at most0.1 to avoid pairing dissimilar individuals. We chosethis method for its computational simplicity.Following matching, the treatment effect is calcu-lated by applying either a conventional (unmatched)regression model or a matched pair analysis to the setof patients who are successfully matched (20). We optfor an unpaired analysis here due to its greatersimplicity, noting that in our examples, a pairedanalysis gave almost identical results (OnlineTable 1).
The matching process results in an analysis basedupon only those patients who are successfullymatched. Therefore, if the treatment effect variesaccording to patients’ characteristics and their likeli-hood of receiving treatment, the treatment effectestimated from this subset of patients may differ fromthe effect in the original study population. This issueis covered in greater detail in the discussion.
Inverse probabi l i ty we ight ing . Inverse probabilityweighting uses the whole dataset but reweightsindividuals to increase the weights of those whoreceived unexpected exposures. This procedure canbe thought of as producing additional observationsfor those parts of the target population from whichthere were few observations. It effectively gene-rates a pseudopopulation with near-perfect covariatebalance between treatment groups (12). IPW appliesweights corresponding to 1/PS for patients in thetreated cohort and [1/(1 � PS)] for those in the con-trol cohort. Due to the large weight assigned to
Elze et al. J A C C V O L . 6 9 , N O . 3 , 2 0 1 7
Propensity Score Methods Versus Covariate Adjustment J A N U A R Y 2 4 , 2 0 1 7 : 3 4 5 – 5 7
348
these observations, PS close to 0 (for the treated)or 1 (for the control) may be problematic for IPW. Wediscuss methods to resolve this issue, such as trim-ming or truncating large weights, later.
Although these 3 PS methods aim to balance allcovariates between the treatment and control groups,the more conventional covariate adjustment aims tocontrol for covariate effects (confounding) using aprediction model for the outcome event (in our case aproportional hazards model for a time-to-eventoutcome). Care must be taken to specify the correctfunctional form for any covariates that may havenonlinear effects. Covariate adjustment has its critics,but there is little practical evidence that it givesmisleading results. For comparison, we provide thecrude effect estimate, as well as the covariate-adjusted effect estimate using all covariates fromthe PS models.
Including the PS as an additional covariate. Includingthe PS as an additional covariate in the regressionmodel represents the fourth PS method examined.Alternatively, one could have only the PS and treat-ment in a model of the outcome of interest.
VARIATIONS ON PS METHODS. There are severalvariations on the 4 PS methods presented in thepreceding section. Using a doubly robust approachcan compensate for a lack of covariate balance. Thedataset can be pre-processed by “trimming” away(removing) individuals with extreme PS. Alterna-tively, large IPW weights can be avoided by trun-cating the weights.
Doubly robust methods incorporate relevantcovariates in both the PS model and the outcomeregression model for the treatment effect: this cancompensate for insufficient covariate balance (21). Asthe name implies, this approach offers some robust-ness to model misspecification, either in the PS or theoutcome regression model. It is recommended (8,22)when using the PS as a covariate to also include in-dividual covariates in the outcome regression model.When the method is used in this way, as we dothroughout this report, it is doubly robust. Doublyrobust methods are also commonly used with IPW butless frequently with matching or stratification,possibly due to the reduced sample size when usingthese methods. However, the doubly robust approachremoves a key advantage of PS methods: having only1 covariate in the final model.
Trimming can be performed after calculation ofthe PS. This involves dropping the individuals withmost extreme PS values in both the treatment andcontrol groups, as they may lack a match in theother group and can be predisposed to residual
confounding. This can help avoid extreme weights inIPW, improve comparability between the exposures,and remove unusual “outlying” patients for whomthe expected treatment (or control) was not chosen.Typical trimming methods might remove the mostextreme 1% or 5% of all observations.
Weight truncation reduces any “large” weightdown to a maximum weight. There is no standarddefinition of a large weight for IPW. Here, weconsidered any weight above 10 to be large, andreduced any weight >10 down to this threshold.Removal of large weights is sometimes recommendedfor sensitivity analyses. However, complete removalof all individuals with weights larger than 10 mayincrease the imbalance between treatment andcontrol groups.
STANDARD ERRORS AND P VALUES. All SE reportedhere are given on the effect (i.e., log HR) scale, and weused the usual sandwich variance estimator whenusing IPW (23). The calculation of p values can thenbe done in the usual fashion. A special case is strati-fication, where it is necessary to aggregate SEs andp values from multiple models. This is done bycalculating the overall variance for a particularparameter as the weighted average of the variancesfor that parameter from each stratum and dividingby the number of strata (24). Assuming asymptoticnormality on the overall effect, p values can then becalculated.
RESULTS
Propensity scores for the CHARM, ADAPT-DES, THIN,and PROMETHEUS studies showed a range ofdifferent distributions (Figure 1). Full PS models aregiven in Online Tables 2 to 5, and for comparison,covariate-adjusted models are given in OnlineTables 6 to 9. Both CHARM and ADAPT-DES exhibi-ted good overlap between the PS for the treatmentand control groups. A single individual in the controlgroup for ADAPT-DES had a PS close to 0 and could beconsidered an outlier.
In contrast, the THIN and PROMETHEUS studiesshowed markedly different PS distributions for thetreatment and control groups. This indicates that itmay be difficult to provide valid comparisons be-tween the 2 groups. THIN had a substantial numberof PS close to 0 or 1. There were 1,134 treated pa-tients (4% of all treated) and 15,514 control patients(25% of all control) with a PS <0.1. Conversely, therewere 2,235 treated individuals (7% of all treated) and173 control patients (0.3% of all control) above a PSof 0.9. Clearly, there are key variables in the PS thatplayed an important role in who did (and did not)
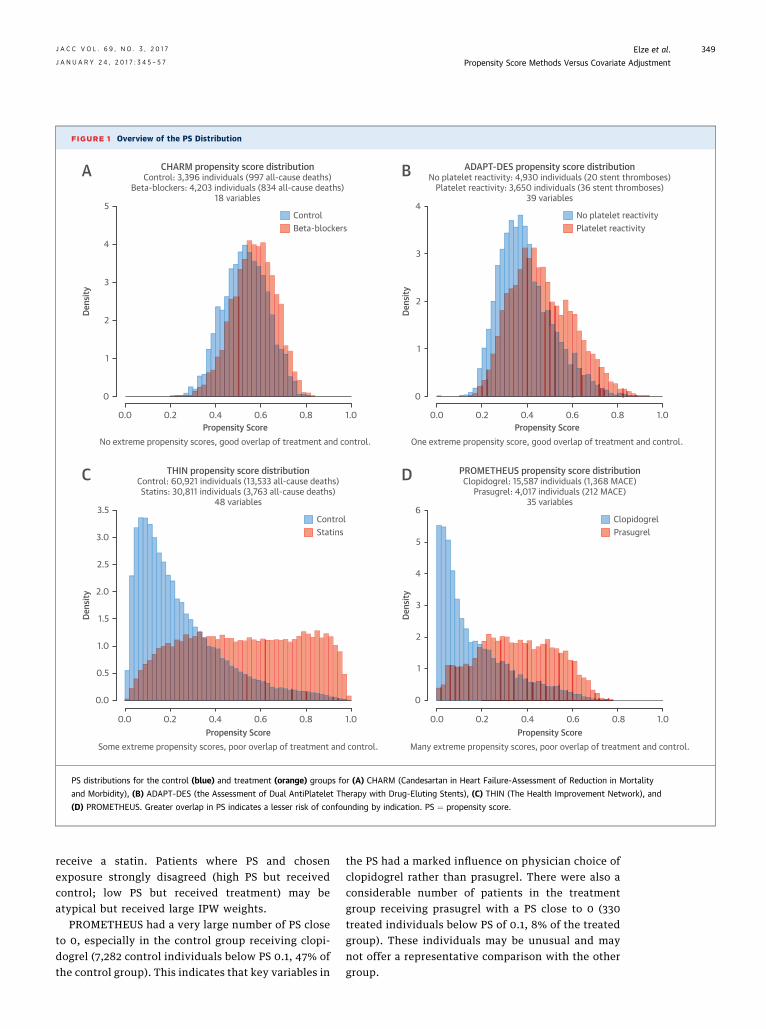
FIGURE 1 Overview of the PS Distribution
CHARM propensity score distributionControl: 3,396 individuals (997 all-cause deaths)
Beta-blockers: 4,203 individuals (834 all-cause deaths)18 variables
THIN propensity score distributionControl: 60,921 individuals (13,533 all-cause deaths)Statins: 30,811 individuals (3,763 all-cause deaths)
48 variables
PROMETHEUS propensity score distributionClopidogrel: 15,587 individuals (1,368 MACE)
Prasugrel: 4,017 individuals (212 MACE)35 variables
ADAPT-DES propensity score distributionNo platelet reactivity: 4,930 individuals (20 stent thromboses)
Platelet reactivity: 3,650 individuals (36 stent thromboses)39 variables
Some extreme propensity scores, poor overlap of treatment and control. Many extreme propensity scores, poor overlap of treatment and control.
One extreme propensity score, good overlap of treatment and control.No extreme propensity scores, good overlap of treatment and control.
0.0
5
4
3
2
1
0
5
6
4
3
2
1
0
3.5
3.0
2.5
2.0
1.5
1.0
0.5
0.0
4
3
2
1
0
0.2 0.4Propensity Score
Dens
ityDe
nsity
Dens
ityDe
nsity
0.6 0.8 1.0 0.0 0.2 0.4Propensity Score
0.6 0.8 1.0
0.0 0.2 0.4Propensity Score
0.6 0.8 1.0 0.0 0.2 0.4Propensity Score
0.6 0.8 1.0
ControlBeta-blockers
No platelet reactivityPlatelet reactivity
ControlStatins
ClopidogrelPrasugrel
A B
C D
PS distributions for the control (blue) and treatment (orange) groups for (A) CHARM (Candesartan in Heart Failure-Assessment of Reduction in Mortality
and Morbidity), (B) ADAPT-DES (the Assessment of Dual AntiPlatelet Therapy with Drug-Eluting Stents), (C) THIN (The Health Improvement Network), and
(D) PROMETHEUS. Greater overlap in PS indicates a lesser risk of confounding by indication. PS ¼ propensity score.
J A C C V O L . 6 9 , N O . 3 , 2 0 1 7 Elze et al.J A N U A R Y 2 4 , 2 0 1 7 : 3 4 5 – 5 7 Propensity Score Methods Versus Covariate Adjustment
349
receive a statin. Patients where PS and chosenexposure strongly disagreed (high PS but receivedcontrol; low PS but received treatment) may beatypical but received large IPW weights.
PROMETHEUS had a very large number of PS closeto 0, especially in the control group receiving clopi-dogrel (7,282 control individuals below PS 0.1, 47% ofthe control group). This indicates that key variables in
the PS had a marked influence on physician choice ofclopidogrel rather than prasugrel. There were also aconsiderable number of patients in the treatmentgroup receiving prasugrel with a PS close to 0 (330treated individuals below PS of 0.1, 8% of the treatedgroup). These individuals may be unusual and maynot offer a representative comparison with the othergroup.

Elze et al. J A C C V O L . 6 9 , N O . 3 , 2 0 1 7
Propensity Score Methods Versus Covariate Adjustment J A N U A R Y 2 4 , 2 0 1 7 : 3 4 5 – 5 7
350
CHARM. Results for CHARM, a nonrandomizedcomparison of the effect of beta-blocker use versuscontrol on all-cause death, showed excellent agree-ment across all PS methods and covariate adjustment(Figure 2A). As expected, the crude estimate(Figure 2A, first row) was different from the covariate-adjusted estimate (Figure 2A, second row) or esti-mates provided by the different PS methods(Figure 2A, other rows). The adjusted HRs were allw0.73, with 95% confidence intervals (CIs) of w0.65to 0.81. SEs were very similar across all methods, andp values were highly significant for all methods.
ADAPT-DES. The ADAPT-DES study, which investi-gated the relationship between HPR and the risk ofstent thrombosis, produced similar HRs for mostmethods (Figure 2B). Covariate adjustment, matching,IPW, and use of the PS as a covariate all arrived at anHR of w2.2, comparing patients with HPR with thosewithout HPR. A notable exception is stratification,which showed a wider CI with 5 strata and an unsta-ble results with 10 strata. Otherwise, SEs and p valueswere comparable for all methods, although matchinghad slightly poorer precision.
An investigation of the strata for ADAPT-DESrevealed that the relatively low number of 56 eventsin the dataset were divided unevenly in the 10 strata(Online Table 10). Two strata received only a singleevent, making precise estimation of the treatmenteffect within those strata impossible. These findingsstrongly suggest that stratification with this manystrata should not be used when the number of eventsis sparse.
THIN. The different PS methods and covariateadjustment mostly produced similar results for theTHIN study, arriving at HR of w0.85 and a highlysignificant mortality reduction for those taking astatin (Figure 2C). The exception was IPW, whichestimated a smaller treatment effect with a wider CI.Trimming individuals with extreme PS from IPW gavesimilar results, whereas truncating large weights inIPW brought the HR in line with the other methods.Similarly, a doubly robust approach of including allcovariates in the final regression model also broughtthe HR into agreement with the other approaches.Additionally, a strong influence of confounders in thisdatabase was noted: the crude HR of 0.55 greatlyexaggerated the treatment effect due to individualson statins tending to be at lower mortality risk. Notethat from RCTs, an HR of approximately 0.87 isexpected.
A plot of the IPW weights revealed very largeweights for some individuals (Figure 3A), whichmay be why IPW produced different results from
other methods. For 1,307 patients, weights exceeded10. This group of patients, 1.4%, had the same totalweight as the 22% of patients with the lowest weights,which may have given undue influence to very fewobservations. This is especially problematic consid-ering that those large weights were given to the mostunusual individuals, as most were patients takingstatin treatment who the PS model strongly predictedwould be controls (i.e., not taking a statin).
PROMETHEUS. Results for the PROMETHEUS study(Figure 2D), comparing prasugrel with clopidogrelfor risk of MACE, showed substantial disagreementbetween the methods, although the results werenonsignificant for almost all methods. Covariateadjustment, stratification, IPW, and use of the PS asa covariate all produced HRs of w0.94. Matchingshowed a lower HR of w0.85. Inverse probabilityweighting without any modification had a muchhigher SE than the other methods. Investigating theIPW weight distribution revealed very large weightsfor 8% (330 individuals) of the treatment group(Figure 3B), which may explain the stark change inHR seen when truncating large weights. The crudeestimate of treatment (HR: 0.59) is attributable to themarked confounding present, whereby patients cho-sen to receive prasugrel tended to be at lower riskof MACE.
Further examination showed that covariatebalance is insufficient for some methods. Figure 4compares the covariate balance values for matching,stratification, and IPW by using the absolute stan-dardized difference between the treatment and con-trol groups. Without use of PS methods, covariatebalance was insufficient for almost all variables.Matching produced excellent balance for all variables.Stratification mostly achieved satisfactory covariatebalance, except for previous percutaneous coronaryintervention, with age, hypertension, and priorcongestive heart failure as borderline cases. Inverseprobability weighting showed very poor covariatebalance for previous percutaneous coronary inter-vention and poor or borderline balance for hyper-tension, previous myocardial infarction, and priorperipheral artery disease. Due to the lack of covariatebalance, the results for stratification and IPW may beconsidered unreliable.
EFFECT OF TRIMMING AND TRUNCATION OF IPW
WEIGHTS. We used PS trimming in the THIN andPROMETHEUS studies to attempt to reduce the impactof large weights in IPW. However, for both studies,even 5% trimmingwas not sufficient to fully remove alllarge IPW weights from the datasets. Consequently,the SEs for the estimated treatment effect remained

FIGURE 2 Comparison of Hazard Ratios From Different PS Methods and Covariate Adjustment
>10% less, >5% less, >5% more, >10% more.
MethodCrudeCovariate adjustmentMatching (nearest neighbor)Stratification 5 strataStratification 10 strataIPWIPW "doubly robust"Propensity as covariate "doubly robust"
MethodCrudeCovariate adjustmentMatching (nearest neighbor)Stratification 5 strataStratification 10 strataIPWIPW "doubly robust"Propensity as covariate "doubly robust"
MethodCrudeCovariate adjustmentMatching (nearest neighbor)Stratification 5 strataStratification 10 strataIPWIPW (5% trimming)IPW (truncating large weights)IPW "doubly robust"Propensity as covariate "doubly robust"
MethodCrudeCovariate adjustmentMatching (nearest neighbor)Stratification 5 strataStratification 10 strataIPWIPW (5% trimming)IPW (truncating large weights)IPW "doubly robust"Propensity as covariate "doubly robust"
THINControl: 60,921 individuals (13,533 all-cause deaths),
Statins: 30,811 individuals (3,763 all-cause deaths). 48 variables.
CHARMControl: 3,396 individuals (997 all-cause deaths),
Beta-blockers: 4,203 individuals (834 all-cause deaths). 18 variables.
ADAPT-DESNo platelet reactivity: 4,930 individuals (20 stent thromboses),
Platelet reactivity: 3,650 individuals (36 stent thromboses). 39 variables.
PROMETHEUSClopidogrel: 15,587 individuals (1,368 MACE events),
Prasugrel: 4,017 individuals (212 MACE events). 35 variables.
Hazard ratio (HR) with 95% CI
Hazard ratio (HR) with 95% CI
Hazard ratio (HR) with 95% CI
Hazard ratio (HR) with 95% CI
0.5
0 1 2 3 4 5
0.6 0.7 0.8 0.9 1
0.5
0.4 0.6 0.8 1 1.2 1.4
0.6 0.7 0.8 0.9 1
Effect(log(HR))
-0.459-0.307-0.338-0.341-0.334-0.307-0.309-0.307
Effect(log(HR))
0.8920.7740.7290.7540.8310.7910.8100.777
SE0.0470.0480.0500.0510.051
0.0480.0490.048
SE0.2780.2950.3140.3673855
0.2910.2960.296
p-value<0.001<0.001<0.001<0.001<0.001<0.001<0.001<0.001
p-value0.0010.0090.0200.0401.0000.0070.0060.009
Effect(log(HR))
-0.618-0.161-0.171
-0.140-0.121
-0.093-0.087-0.159-0.168-0.158
SE0.0180.0210.0250.0220.0220.0260.0240.0220.0270.021
p-value<0.001<0.001<0.001<0.001<0.001<0.001<0.001<0.001<0.001<0.001
Effect(log(HR))
-0.536-0.064-0.165-0.100-0.101
-0.028-0.041-0.248-0.077-0.101
SE0.073
0.0800.0930.0900.0930.1320.105
0.0860.129
0.083
p-value<0.001
0.4350.0800.2760.2850.8320.6960.0040.5530.228
Compared to covariate adjustment using all variables, estimate is
A
B
C
D
HRs and covariate adjustments for (A) CHARM, (B) ADAPT-DES, (C) THIN, and (D) PROMETHEUS. In the plot, covariate adjustment is used as
the basis for the comparison (dashed line). Colors are used if results for the other methods differed by more than 5%. CI ¼ confidence
interval; HR ¼ hazard ratio; IPW ¼ inverse probability weighting; other abbreviations as in Figure 1.
J A C C V O L . 6 9 , N O . 3 , 2 0 1 7 Elze et al.J A N U A R Y 2 4 , 2 0 1 7 : 3 4 5 – 5 7 Propensity Score Methods Versus Covariate Adjustment
351

FIGURE 3 Distribution of the Weights for IPW in the THIN and PROMETHEUS Studies
ControlStatins
1 20 40 60IPW Weights
THIN IPW weight distribution
PROMETHEUS IPW weight distribution
Freq
uenc
y
105
104
103
102
101
10
Freq
uenc
y
105
104
103
102
101
10
IPW Weights1 50 100 150 200 250
80 100
ClopidogrelPrasugrel
A
B
Distributions in (A) THIN and (B) PROMETHEUS. To facilitate display, the vertical axis is
on a logarithmic scale. In (B) PROMETHEUS, there are no patients with extreme weights
in the clopidogrel group; hence, all patients treated with clopidogrel will appear in the bar
with the smallest inverse probability weight. Abbreviations as in Figures 1 and 2.
Elze et al. J A C C V O L . 6 9 , N O . 3 , 2 0 1 7
Propensity Score Methods Versus Covariate Adjustment J A N U A R Y 2 4 , 2 0 1 7 : 3 4 5 – 5 7
352
large relative to other methods after trimming,particularly in PROMETHEUS (Figures 2C and 2D). Weadditionally applied 1% and 5% trimming andcompared findings for each PS method and covariateadjustment on the trimmed data sets. However, trim-ming did little to reconcile differences in the estimatesproduced (Online Figures 1 to 4). Finally, we truncatedlarge weights in the THIN and PROMETHEUS studies
to a maximum of 10. In both examples, this resulted ina large reduction in SE and an estimated HR muchcloser to the crude estimate (Figures 2C and 2D).However, this brought the estimates closer to the othermethods in THIN (Figure 2C), whereas it took estimatesfarther away from other methods in PROMETHEUS(Figure 2D).
DISCUSSION
For observational cohort studies that comparealternative treatments (and other exposures), ithas become standard practice to use PS methods tocorrect for selection biases and potential confoundingwhen examining the relative risks (hazards) of eventoutcomes. Although the principles of PS methodsare clear, there exists a diversity of alternativeapproaches (e.g., propensity matching, stratifi-cation, IPW with or without trimming) alongside themore conventional method of covariate adjustment.Although there is a substantial body of methodologicliterature on PS approaches with some limited guid-ance on which specific methods may be preferable(10,11), there is no general agreement as to the choiceof PS method that is best suited to any particularscenario. Thus, researchers may choose a suboptimalmethod that preserves more bias and/or imprecisionthan necessary.
To provide insight into this common problem, wehave here undertaken an in-depth assessment ofmany of the available PS and covariate-adjustmentapproaches as applied to 4 large-scale cardiovascu-lar studies. The present analysis illustrates thechallenges faced in determining which methodsactually produce the most valid results in differentsettings.
Our first example, the CHARM study examining theimpact of beta-blocker use at baseline on mortalityin heart failure patients, is the most straightforward.The PS distributions for the 17 chosen baselinevariables showed considerable overlap between the2 groups with no extreme values. In addition, thestudy was large, with the 2 groups being of similarsize. The results showed a consistency across all PSmethods and also covariate adjustment. Note, thecrude estimate produced an exaggerated treatmenteffect, indicating the importance of taking con-founding into account by using any of these methods.However, the extent of confounding is less extremethan in several of the other studies.
The next example, ADAPT-DES, comparing the riskof stent thrombosis in acute coronary syndrome pa-tients with and without HPR, has some methodologicsimilarities to CHARM but also the complication of

FIGURE 4 Comparison of the Extent of Covariate Imbalance in PROMETHEUS
Age2
AgeGlomerular filtr. rateImplant. hemoglobin
HypertensionPrior Stroke
Previous CABGPrevious MI
Prior CHFPrior PAD
African AmericanPrevious PCI
BMI decileHypercholesterolemia
Stent diameterSmoker
Family hist. of CAD
0.0 0.1 0.2Absolute Standardized Difference
Whole dataset
0.3 0.4 0.5 0.6
Age2
AgeGlomerular filtr. rateImplant. hemoglobin
HypertensionPrior Stroke
Previous CABGPrevious MI
Prior CHFPrior PAD
African AmericanPrevious PCI
BMI decileHypercholesterolemia
Stent diameterSmoker
Family hist. of CAD
0.0 0.1 0.2Absolute Standardized Difference
Matching
0.3 0.4 0.5 0.6
Age2
AgeGlomerular filtr. rateImplant. hemoglobin
HypertensionPrior Stroke
Previous CABGPrevious MI
Prior CHFPrior PAD
African AmericanPrevious PCI
BMI decileHypercholesterolemia
Stent diameterSmoker
Family hist. of CAD
0.0 0.1 0.2Absolute Standardized Difference
Stratification with 5 strata
0.3 0.4 0.5 0.6
Age2
AgeGlomerular filtr. rateImplant. hemoglobin
HypertensionPrior Stroke
Previous CABGPrevious MI
Prior CHFPrior PAD
African AmericanPrevious PCI
BMI decileHypercholesterolemia
Stent diameterSmoker
Family hist. of CAD
0.0 0.1 0.2Absolute Standardized Difference
IPW
0.3 0.4 0.5 0.6
A B
C D
Comparisons using (A) crude comparisons, (B) propensity matching, (C) propensity stratification, and (D) IPW. Graphs show the absolute standardized difference
between treatment and control; values <0.1 are conventionally considered acceptable. BMI ¼ body mass index; CABG ¼ coronary artery bypass graft; CAD ¼ coronary
artery disease; CHF ¼ congestive heart failure; MI ¼ myocardial infarction; PAD ¼ peripheral arterial disease; PCI ¼ percutaneous coronary intervention; other ab-
breviations as in Figures 1 to 3.
J A C C V O L . 6 9 , N O . 3 , 2 0 1 7 Elze et al.J A N U A R Y 2 4 , 2 0 1 7 : 3 4 5 – 5 7 Propensity Score Methods Versus Covariate Adjustment
353
having fewer outcome events (only 56 stent throm-boses). Here, PS stratification performed badly, withtoo few events per stratum. PS matching and IPWshowed good agreement, although the former had lessprecise estimates due to not using all patients in thematched analysis. Surprisingly, covariate adjustmentwith 39 covariates and only 56 events held up well,producing very similar estimates to IPW.
In the last 2 examples, both the THIN study,comparing the mortality of individuals on and offstatins, and the PROMETHEUS study, comparing pra-sugrel versus clopidogrel for the risk of MACE in acutecoronary syndrome patients, presented more of achallenge in choosing a robust PS method. The reasonfor this in both cases was the marked separation of PSprobability distributions between the 2 groups: statin

Elze et al. J A C C V O L . 6 9 , N O . 3 , 2 0 1 7
Propensity Score Methods Versus Covariate Adjustment J A N U A R Y 2 4 , 2 0 1 7 : 3 4 5 – 5 7
354
versus no statin and prasugrel versus clopidogrel,respectively. In particular, a substantial number ofPS were close to 0 and 1 in THIN and close to 0 inPROMETHEUS. As a consequence, IPW included morethan a few very influential individuals with verylarge weights in the IPW analysis. This, in turn, led toimprecise estimates of treatment effect and a worri-some lack of covariate balance for some potentiallyimportant confounders. Additionally, in both theseexamples, IPW analyses estimated HRs closer to thenull.
In both of these examples, the use of IPW in a doublyrobust fashion (i.e., also including all covariates in thefinal analysis) induced compatibility with othermethods but did not reduce the SE, thereby leaving the95% CIs unduly wide. The use of trimming (e.g.,removing the 5% of individuals with the most extremePS) was somewhat helpful, but the imprecision of es-timates remained greater than for other methods. Theuse of PS stratification also has its problemswhen thereis marked selection bias, as seen in THIN and PRO-METHEUS. This is because using only 5 (or 10) stratadoes not wholly correct for covariate imbalance.
What can we learn from these experiences in orderto make recommendations for the future use of PSmethods and covariate adjustment? As in all studies,the primary analysis strategy should be prespecified.Post hoc selection of a preferred method after dataexploration introduces bias and should only beconsidered for exploratory or sensitivity analysis.
One useful approach is to examine the baselinecovariates before accessing any outcome data in orderto determine which PS method (or covariate adjust-ment) may be most suitable given the characteristicsof the PS, such as the degree of overlap in PS betweentreatment and control groups. Even so, relying on 1method of analysis (which may have its flaws) may betoo restrictive, and it is wise to predefine a number ofsecondary sensitivity analyses using alternative ap-proaches. This enables one to determine whetherthere is a consistency of the findings regarding theestimated treatment “effect,” which, if present, in-stills confidence in the primary results.
However, for any specific study, what should bechosen as the primary analysis method? We see nosingle “right answer” to meet all circumstances, butthe following insights should help in making thechoice:
1. PS matching appears to be a reliable method, inthat it provides excellent covariate balance in mostcircumstances. It has the advantage of being sim-ple to analyze, present, and interpret. Its maindisadvantage is that some individuals end up not
matched and hence excluded from the analysis,resulting in a loss of both precision and general-izability. In our examples, up to 60% of patientswere excluded by matching, although it should benoted that some of these patients could have beensuccessfully matched by using more sophisticatedmatching algorithms. Finally, whatever the choiceof matching algorithm, it is important to predefinethe precise algorithm to be used.
2. PS stratification tends to work well when covariateimbalance is not very marked. It has the merit ofkeeping all individuals in the analysis and alsoprovides the opportunity to explore potential in-teractions between treatment and the PS onoutcome risk. Stratification tends to perform lesswell in datasets with few outcomes, particularlywhen the number of strata is large. When choosingthe number of strata, one needs to trade off theneed for accurate control of confounding with therequirement of having a sufficient number ofevents in each strata. Previous research shows that5 strata may reduce confounding bias by up to90%, so a modest number of strata should sufficein studies with few outcomes and/or only moder-ate confounding bias (25). However, in studieswith many outcome events, using more strata willfurther reduce confounding bias, which may beimportant if covariate imbalance is marked (26,27).Beyond these recommendations, further researchis needed to determine the best strategy to definethe number and size distribution of strata. Arestrata of equal size preferred, or is it better to havelarger numbers in the middle of the PS distribu-tion, therefore enabling a more detailed explora-tion of the tails?
3. Inverse probability weighting offers a conceptuallysimple method that is easy to implement in prac-tice and retains all study participants. Some haveadvocated it as a preferred method (28,29). How-ever, when there is marked covariate imbalance,PS scores close to the extreme probabilities of0 and 1 occur, with some individuals ending upwith very large weights. This seems intuitivelyinappropriate because these influential data pointsoccur in individuals who represent a small pro-portion in their chosen treatment group. In our 2examples with such extreme weights, THIN andPROMETHEUS, use of IPW produced less preciseestimates than other methods and notable covari-ate imbalance.
4. Trimming has been recommended as an appro-priate way of limiting the influence of heavilyweighted individuals. The difficulty here is todefine in advance what level of trimming is

CENTRAL ILLUSTRATION Comparison of Propensity Score Methods and Covariate Adjustment
• Reliable; provides excellent covariate balance in most circumstances
• Simple to analyze, present and interpret
• Performed well• Provides prognostic model for outcomeof interest
• May not be suitable with many covariatesin smaller studies
• Retains data from all study participants• Opportunity to explore interactions
between treatment and PS on outcome risk• Provides effect estimates for every stratum
• Some patients are unmatched leading to information excluded from the analysis
• Less precise
• Performs less well in datasets with few outcomes, particularly when the numberof strata is large
• May not account for strong confounding
• Retains data from all study participants• Easy to implement• Creates a pseudo population with perfect
covariate balance
• Can be unstable when extreme weights occur
• Performed well • Adding the PS as an additional covariate produced results very similar (and not necessarily superior) to traditionalcovariate adjustment
Primary studyanalysis method
Traditionalcovariate adjustment
Propensity score (PS)stratification
PS matching
PS inverseprobability weighting
PS covariateadjustment (use ofPS as a covariate)
Pros Cons
Elze, M.C. et al. J Am Coll Cardiol. 2017;69(3):345–57.
An overview of the pros and cons of covariate adjustment and various propensity score methods.
J A C C V O L . 6 9 , N O . 3 , 2 0 1 7 Elze et al.J A N U A R Y 2 4 , 2 0 1 7 : 3 4 5 – 5 7 Propensity Score Methods Versus Covariate Adjustment
355
desirable: should we exclude just 1% or up to 5% ofextreme weights? In our examples with majorcovariate imbalance, trimming increased theprecision of our estimates, but did not alter theestimated associations. Truncating large weightsresulted in more precise estimates and had largeeffects on the estimated associations. In both of ourexamples, the estimated associations moved closerto the crude HR following truncation, perhapssuggesting that this methodmay lead to inadequateadjustment for covariate imbalance. Given thedifficulty of limiting the influence of heavilyweighted individuals, IPW may be best confinedto datasets for which extremes of the PS distribu-tion do not occur, such as in the CHARM andADAPT-DES studies, although this will generallynot be known in advance of examining the datadistribution.
5. Use of a doubly robust IPW approach, wherecovariates are also included in the outcome
regression model, appeared to produce resultssimilar to conventional coverage adjustment, butwith notably wider CIs. They also added a level ofcomplexity to the analysis, and the inclusion ofcovariates in the outcome regression modelremoves a key advantage of the PS methods. Theymay therefore be unattractive as a primary methodof analysis, and be best reserved for sensitivityexplorations.
6. Covariate adjustment is the conventional methodfor correcting for covariate imbalance, selectionbias, and potential confounding and existed longbefore PS methods were developed. Recently,some have argued that PS methods may be morerobust or offer more complete adjustment forconfounders (28). However, although there aretheoretical grounds on which to favor PS adjust-ment (30), we see little practical evidence to justifysuch negative claims and, in our examples, covar-iate adjustment provided reliable and statistically
Elze et al. J A C C V O L . 6 9 , N O . 3 , 2 0 1 7
Propensity Score Methods Versus Covariate Adjustment J A N U A R Y 2 4 , 2 0 1 7 : 3 4 5 – 5 7
356
efficient estimates (Central Illustration). One issuefor datasets with few event outcomes is that thenumber of covariates considered for inclusion inthe model may be limited, whereas many morecovariates may be included in a PS model withoutraising concerns of overfitting or lack of modelconvergence. However, in ADAPT-DES, including39 covariates with only 56 events still producedreliable results. This example demonstrates thathaving fewer than 10 events per covariate does notnecessarily preclude using covariate adjustment(3), although it does not allay concerns of over-fitting in all similar scenarios. A further advantageof covariate adjustment is that it provides a pre-dictive model (including treatment) for the risk(hazard) of the event outcome, which gives insightas to which covariates have the strongest influenceon risk. Perhaps it is time that old-fashioned co-variate adjustment deserves a revival in its use.Finally, adding the PS as an additional covariateproduced results very similar to covariate adjust-ment, with similar estimates and SEs across allexamples.
STUDY LIMITATIONS. First, with just 4 datasetsexplored in depth, caution is needed in drawing anygeneralizable conclusions. This is particularly thecase for small studies, which are not examined here,although it should be noted that ADAPT-DES is smallin terms of the number of outcome events included.Despite these limitations, we believe that the di-versity of our examples facilitate a practical debateon the basis of real experiences, which is better thanrelying on purely theoretical arguments. Second, ourstudy assumes throughout that the effect of treat-ment on outcome does not differ by the likelihoodthat a patient is treated. When treatment effects dodiffer, as can be detected by comparing estimatedHRs across strata of the PS, some PS methods willproduce results that are systematically different
from covariate adjustment, even when bothmethods provide adequate adjustment for con-founders (31). This is because certain PS methodsestimate the treatment effects relating to certainsections of the study population, such as only thetreated or only the control patients. In these sce-narios, investigators need to select an appropriatemethod to estimate the treatment effect in the set ofpatients in whom they most want to understand theimpact of treatment: usually this is either thetreated patients, the control patients, or the entirestudy population (11). In addition, a further tech-nical detail is that both IPW and PS matching (usingan unpaired analysis) estimate a marginal treatmenteffect, whereas multivariate regression, stratifica-tion, and doubly robust methods all estimate aconditional HR.
CONCLUSIONS
In the present detailed examination of alternativePS methods and covariate adjustment in severaltopical cardiovascular studies, covariate adjustmentand matching performed well in all of our exam-ples, although matching tended to give less preciseestimates in some cases. Propensity score methodsare not necessarily superior to conventional covar-iate adjustment, and care should be taken to selectthe most suitable method. We hope these insightswill guide others to make wise choices in their useof PS methods, and to rekindle interest in old-fashioned covariate adjustment, which may beviewed as a suitable primary analysis method inmany cases.
REPRINT REQUESTS AND CORRESPONDENCE: Prof.Stuart J. Pocock, London School of Hygiene andTropical Medicine, Department of Medical Statistics,Keppel Street, London WC1E 7HT, United Kingdom.E-mail: [email protected].
RE F E RENCE S
1. Rothwell PM. External validity of randomisedcontrolled trials: “to whom do the results of thistrial apply?” Lancet 2005;365:82–93.
2. Harrell F Jr., Lee KL, Califf RM, et al. Regressionmodelling strategies for improved prognosticprediction. Stat Med 1984;3:143–52.
3. Vittinghoff E, McCulloch CE. Relaxing the ruleof ten events per variable in logistic and Coxregression. Am J Epidemiol 2007;165:710–8.
4. Park DW, Seung KB, Kim YH, et al. Long-termsafety and efficacy of stenting versus coronaryartery bypass grafting for unprotected left maincoronary artery disease: 5-year results from the
MAIN-COMPARE (Revascularization for Unpro-tected Left Main Coronary Artery Stenosis: Com-parison of Percutaneous Coronary AngioplastyVersus Surgical Revascularization) registry. J AmColl Cardiol 2010;56:117–24.
5. Ramos R, Garcá-Gil M, Comas-Cuf M, et al.Statins for prevention of cardiovascular events in alow-risk population with low ankle brachial index.J Am Coll Cardiol 2016;67:630–40.
6. Tamburino C, Barbanti M, D’Errigo P, et al., forthe OBSERVANT Research Group. 1-Year outcomesafter transfemoral transcatheter or surgical aorticvalve replacement: results from the Italian
OBSERVANT Study. J Am Coll Cardiol 2015;66:804–12.
7. Solomon MD, Go AS, Shilane D, et al. Compar-ative effectiveness of clopidogrel in medicallymanaged patients with unstable angina and non-ST-segment elevation myocardial infarction.J Am Coll Cardiol 2014;63:2249–57.
8. Rosenbaum PR, Rubin DB. The central role ofthe propensity score in observational studies forcausal effects. Biometrika 1983;70:41–55.
9. Senn S, Graf E, Caputo A. Stratification for thepropensity score compared with linear regression

J A C C V O L . 6 9 , N O . 3 , 2 0 1 7 Elze et al.J A N U A R Y 2 4 , 2 0 1 7 : 3 4 5 – 5 7 Propensity Score Methods Versus Covariate Adjustment
357
techniques to assess the effect of treatment orexposure. Stat Med 2007;26:5529–44.
10. Austin PC. An introduction to propensity scoremethods for reducing the effects of confoundingin observational studies. Multivariate Behav Res2011;46:399–424.
11. Williamson E, Morley R, Lucas A, et al. Pro-pensity scores: from naive enthusiasm to intuitiveunderstanding. Stat Methods Med Res 2012;21:273–93.
12. Heinze G, Jüni P. An overview of the objectivesof and the approaches to propensity score ana-lyses. Eur Heart J 2011;32:1704–8.
13. Swedberg K, Pfeffer M, Granger C, et al., forthe Charm-Programme Investigators. Candesartanin heart failure–assessment of reduction in mor-tality and morbidity (CHARM): rationale anddesign. J Card Fail 1999;5:276–82.
14. Stone GW, Witzenbichler B, Weisz G, et al., forthe ADAPT-DES Investigators. Platelet reactivityand clinical outcomes after coronary artery im-plantation of drug-eluting stents (ADAPT-DES): aprospective multicentre registry study. Lancet2013;382:614–23.
15. Smeeth L, Douglas I, Hall AJ, et al. Effect ofstatins on awide range of health outcomes: a cohortstudy validated by comparison with randomizedtrials. Br J Clin Pharmacol 2009;67:99–109.
16. Heart Protective Study Collaborative Group.MRC/BHF Heart Protection Study of cholesterollowering with simvastatin in 20,536 high-risk in-dividuals: a randomised placebo-controlled trial.Lancet 2002;360:7–22.
17. Wayangankar SA, Baber U, Poddar K, et al.Predictors of 1 year net adverse cardiovascular
events (NACE) among ACS patients undergoingPCI with clopidogrel or prasugrel: analysis fromthe PROMETHEUS registry. J Am Coll Cardiol2016;67:562.
18. Myers JA, Rassen JA, Gagne JJ, et al. Effects ofadjusting for instrumental variables on bias andprecision of effect estimates. Am J Epidemiol2011;174:1213–22.
19. Fisher R. The Design of Experiments. 9thedition. London, UK: Macmillan, 1971.
20. Stuart EA. Developing practical recommenda-tions for the use of propensity scores: discussionof “A critical appraisal of propensity scorematching in the medical literature between 1996and 2003” by Peter Austin. Stat Med 2008;27:2062–5; discussion 2066–9.
21. Kang JDY, Schafer JL. Demystifying doublerobustness: a comparison of alternative strategiesfor estimating a population mean from incompletedata. Stat Sci 2007;22:523–39.
22. D’Agostino RB Jr. Propensity score methodsfor bias reduction in the comparison of a treat-ment to a non-randomized control group. StatMed 1998;17:2265–81.
23. Joffe MM, Ten Have TR, Feldman HI, et al.Model selection, confounder control, and marginalstructural models. Am Stat 2004;58:272–9.
24. Mosteller F, Tukey JW. Data Analysis andRegression: A Second Course in Statistics. London,UK: Pearson, 1977.
25. Rosenbaum PR, Rubin DB. Reducing bias inobservational studies using subclassification onthe propensity score. J Am Stat Assoc 1984;79:516–24.
26. Cochran WG. The effectiveness of adjust-ment by subclassification in removing bias inobservational studies. Biometrics 1968;24:295–313.
27. Hullsiek KH, Louis TA. Propensity scoremodeling strategies for the causal analysisof observational data. Biostatistics 2002;2:179–93.
28. Austin PC. The relative ability of differentpropensity score methods to balance measuredcovariates between treated and untreated subjectsin observational studies. Med Decis Making 2009;29:661–77.
29. Lunceford JK, Davidian M. Stratification andweighting via the propensity score in estimation ofcausal treatment effects: a comparative study.Stat Med 2004;23:2937–60.
30. Glynn RJ, Schneeweiss S, Stürmer T. In-dications for propensity scores and review of theiruse in pharmacoepidemiology. Basic Clin Pharma-col Toxicol 2006;98:253–9.
31. Stürmer T, Rothman KJ, Glynn RJ. Insightsinto different results from different causal con-trasts in the presence of effect-measure modifi-cation. Pharmacoepidemiol Drug Saf 2006;15:698–709.
KEY WORDS bias, comparison of methods,observational studies, regression
APPENDIX For supplemental tables andfigures, please see the online version of thisarticle.