comparison of precipitation chemistry in the central rocky mountains, colorado, usa
TRANSCRIPT

*Corresponding author. Tel.: #1-303-987-6941; fax: #1-303-969-2822.
E-mail address: kristi}[email protected] (K. Heuer)
Atmospheric Environment 34 (2000) 1713}1722
Comparison of precipitation chemistry in the Central RockyMountains, Colorado, USA
Kristi Heuer!,*, Kathy A. Tonnessen!, George P. Ingersoll"
!National Park Service-Air Resources Division, P.O. Box 25287, Denver, CO 80225-0287, USA"U.S. Geological Survey-Water Resources Division, MS 415, DFC, Denver, CO 80225, USA
Received 1 February 1999; accepted 24 June 1999
Abstract
Volume-weighted mean concentrations of nitrate (NO~3), ammonium (NH`
4), and sulfate (SO2~
4) in precipitation were
compared at high-elevation sites in Colorado from 1992 to 1997 to evaluate emission source areas to the east and west ofthe Rocky Mountains. Precipitation chemistry was measured by two sampling methods, the National AtmosphericDeposition Program/National Trends Network (NADP/NTN) and snowpack surveys at maximum accumulation.Concentrations of NO~
3and SO2~
4in winter precipitation were greater on the western slope of the Rockies, and
concentrations of NO~3
and NH`4
in summer precipitation were greater on the eastern slope. Summer concentrations ingeneral were almost twice as high as winter concentrations. Seasonal weather patterns in combination with emissionsource areas help to explain these di!erences. This comparison shows that high-elevation ecosystems in Colorado arein#uenced by air pollution emission sources located on both sides of the Continental Divide. It also suggests that sourcesof nitrogen and sulfur located east of the Divide have a greater in#uence on precipitation chemistry in the ColoradoRockies. Published by Elsevier Science Ltd.
Keywords: Precipitation chemistry; Snow; High-elevation ecosystems; Nitrate; Ammonium; Sulfate; Air pollution; National Atmo-spheric Deposition Program/National Trends Network
1. Introduction
Federal land managers (FLMs), such as the NationalPark Service and the U.S. Department of Agriculture-Forest Service are concerned with the ecological e!ects ofatmospheric deposition of nitrogen (N) and sulfur (S) toparks and wilderness areas of the United States (Williamsand Tonnessen, In press; Fenn et al., 1998). FLMs arerequired under the Clean Air Act Amendments of 1977 toprotect sensitive resources from damage due to atmo-spheric pollutants (Shaver et al., 1994; Bunyak, 1993). Inthe Colorado Rocky Mountains, research and monitor-
ing programs have established the sensitivity of selectedaquatic and terrestrial resources to N and S deposition(Turk and Spahr, 1991; EPA, 1995; Williams et al.,1996a). Low-acid neutralizing surface waters and poorlybu!ered terrestrial systems are found in the alpine of theColorado Front Range (Williams and Tonnessen, Inpress; Williams et al., 1996a). The episodic acidi"cation ofthese dilute lakes and streams has been documented onthe eastern slope (Williams et al., 1996b; Campbell et al.,1995), where snowmelt runo! is the principal stress.
Deposition of N and S to high-elevation areas in theColorado Rockies is high compared with deposition toother mountain ranges in the western U.S. (Williams etal., 1998; Turk, 1995). Loading rates for wet deposition(2}3 kg N ha~1 yr~1) approximate those in some uplandareas of the eastern U.S. and in alpine areas of Europe(Winiwarter et al., 1998). There have been two methodsused to quantify deposition to these high-elevation
1352-2310/00/$ - see front matter Published by Elsevier Science Ltd.PII: S 1 3 5 2 - 2 3 1 0 ( 9 9 ) 0 0 4 3 0 - 6

ecosystems. The National Atmospheric Deposition Pro-gram/National Trends Network (NADP/NTN) beganmeasuring weekly precipitation chemistry in 1984 andhas grown to include over 200 sites (Lynch et al., 1995).A number of these sites are located above 2000 m inColorado, however, these sites receive considerablesnowfall and the estimation of total precipitation volumeis di$cult, with both undercatch and overcatch reported(Williams et al., 1998). As an alternative to using weeklymeasurements, researchers have measured snow chem-istry at maximum snowpack accumulation to estimateseasonal concentrations of solutes in deposition (Inger-soll, 1995; Williams and Melack, 1991).
To examine the sources of N and S in deposition,emission inventories were developed as part of the GrandCanyon Visibility Transport Commission (Dickson et al.,1994). These inventories show large source areas of nitro-gen oxides (NO
x), ammonia (NH
3), and sulfur dioxide
(SOx) emissions east of the Rocky Mountains, in the
vicinity of the Denver}Boulder}Fort Collins urban corri-dor. There are signi"cant contributions from small pointsources, vehicles, and agricultural operations. To thewest of the Rocky Mountains there are large point sour-ces of NO
xand SO
x, primarily fossil fuel generating
plants (Turk and Campbell, 1997). Fig. 1 shows thedistribution of point sources of NO
xand SO
xwith emis-
sions greater than 100 t yr~1 in the state of Colorado.The National Park Service is especially concerned with
N and S deposition to Rocky Mountain National Park.To evaluate emission source areas that may be a!ectingthese high-elevation ecosystems, we compare precipi-tation chemistry at sites on the western slope of theColorado Rocky Mountains to sites on the eastern slope.Speci"cally, volume-weighted mean concentrations of ni-trate (NO~
3), ammonium (NH`
4), and sulfate (SO2~
4) in
precipitation, as measured by NADP/NTN and bysnowpack surveys, are compared on an annual and sea-sonal basis. This comparison of precipitation chemistryallows for the evaluation of di!erent data sets, and theidenti"cation of possible source areas of air pollution.Data on chemical loading or deposition will not bepresented because of problems associated with snowloading comparisons.
2. Site description
Precipitation monitoring sites in Colorado were se-lected based on proximity to the Continental Divide(within 130 km), elevation (above 2000 m), and yearsof sample collection (1992}1997). The time period of1992}1997 was chosen because both NADP/NTN dataand the USGS snowpack survey data were availablefor those years. Colorado has 17 NADP/NTN sites cur-rently operating. Twelve of these sites met the selectioncriteria, "ve were located on the western slope of the
Rockies and seven were located on the eastern slope.Sixty-two sites are currently part of the synoptic snow-pack survey, which extends along the Continental Dividefrom Montana to New Mexico. Twenty-"ve of these sitesmet the selection criteria, 15 on the western slope and 10on the eastern slope. Selected sites are shown inFig. 2 and are listed in Table 1, along with site elevation.
3. Methods
NADP/NTN: Precipitation sample collection and analy-sis followed standard NADP/NTN protocols at all sitesas presented in Peden et al. (1986). Precipitation samplesare collected weekly at each site by Aerochem-Metricsprecipitation collectors. These collectors automaticallycover samples between precipitation events to limit evap-oration and contamination. The timing and amount ofprecipitation at each site over the seven-day samplingperiod are documented by Belfort recording gages. Pre-cipitation samples are shipped to the program's CentralAnalytical Laboratory (CAL) at the Illinois State WaterSurvey where they are analyzed for acidity, speci"c con-ductance, major cations and anions, including NO~
3,
NH`4
and SO2~4
. The samples are screened by the CALfor data quality criteria. Various quality assurance pro-grams address site operations, laboratory operations,program methodology, and data management.
Snowpack: Snowpack sample collection and ana-lysis followed standard USGS protocols at all sites aspresented in Ingersoll (1995). The timing of peak snowwater equivalence (SWE) was estimated based on a 30-year average at SNOTEL sites (Natural Resource Con-servation Service) at similar elevations near the samplingsites. Snowpacks were sampled 2}3 weeks before thisdate. Snowpits were prepared with a vertical face extend-ing from the ground surface to the top of the snowpack.Temperature was measured every 10 cm and strati-graphic descriptions were recorded. Samples were notcollected when there was evidence that melt had occur-red. The bottom 10 cm and the top 5 cm of the snowpackwere not sampled to avoid contamination from soil,forest litter, or excavation activities. Field technicianswearing Latex gloves used plastic shovels and scoopsrinsed with deionized (DI) water to cut a vertical snowcolumn representative of the entire snowpack. The snowcolumns were placed in prerinsed 8-l Te#on bags and 60-lcarboys. These containers were sealed and transported tothe USGS Regional Research Laboratory in Boulder,Colorado, for analysis.
Snowpack samples were melted at room temperaturein the Te#on collection bags and processed within 12 h.Sulfate concentrations were determined on "ltered(0.45 lm) aliquots by ion chromatography. Nitrate andammonium concentrations were determined on "ltered(0.45 lm) subsamples by air-segmented, continuous-#ow
1714 K. Heuer et al. / Atmospheric Environment 34 (2000) 1713}1722

Fig. 1. Point sources of NOx
(a) and SOx
(b) with emissions greater than 100 t yr~1 in Colorado.
colorimetry. Detection limits were 0.4, 0.2, 0.5 leq l~1 forSO2~
4, NO~
3, and NH`
4, respectively. Quality control
involved systematically analyzing DI-water blanks, aninternal reference sample, and USGS standard reference
water samples. Quality control of "eld methods includedsampling two snowpits located side-by-side.
Data analysis: Arithmetic mean concentrations andstandard deviations were calculated for NO~
3, NH`
4
K. Heuer et al. / Atmospheric Environment 34 (2000) 1713}1722 1715

Fig. 2. NADP/NTN and snowpack survey sites on the westernand eastern slopes of Rocky Mountains, Colorado.
Table 1NADP/NTN and snowpack monitoring sites in the Colorado Rocky Mountains
Western slope Eastern slope
Site Elevation Monitoring Site Elevation Monitoring
Bu!alo Pass 3228 m Both Alamosa 2298 m NADPDry Lake 2527 m Both Beaver Meadows 2490 m NADPDunckley Pass 2987 m Snow Berthoud Pass 3444 m SnowElk River 2621 m Snow Brumley 3231 m SnowFour Mile Park 2502 m NADP Cameron Pass 3110 m SnowGrand Mesa 3103 m Snow Deadman Pass 3109 m SnowLake Irene 3243 m Snow Fremont Pass 3475 m SnowLynx Pass 2731 m Snow Loch Vale 3159 m BothMolas Pass 3249 m Both Loveland Pass 3597 m SnowNed Wilson 3383 m Snow Manitou 2362 m NADPPhantom Valley 2752 m Snow Monarch 3200 m SnowRabbit Ears 1 2938 m Snow Niwot 3520 m BothRabbit Ears 2 2938 m Snow Sugar Loaf 2524 m NADPRed Mountain Pass 3353 m Snow Wolf Creek Pass 3292 m BothSlumgullion Pass 3505 m SnowSunlight Peak 3206 m Both
and SO2~4
from annual volume-weighted mean (VWM)concentrations for NADP/NTN sites on the westernslope (n"5 for all years) of the Rockies and for sites onthe eastern slope (n"7 for all years) for the period of1992}1997. Mean solute concentrations of sites on thewestern slope were compared to mean concentrations ofsites on the eastern slope for each solute for all years.
Solute concentrations in snowpack samples were ana-lyzed the same as described above for NADP/NTN datato assess winter precipitation chemistry. Arithmetic meanconcentrations and standard deviations were calculated
for NO~3, NH`
4and SO2~
4from VWM snowpack con-
centrations for survey sites on the western slope (1992;n"15, 1993}1995; n"14, 1996}1997; n"13) and forsites on the eastern slope (1992}1993 and 1995}1997;n"10, 1994; n"9) for years 1992}1997. Di!erencesbetween NADP/NTN and snowpack sampling protocolswere evaluated by comparing mean concentrations ofsolutes at sites where both NADP/NTN and snowpacksamples were collected (n"7) (Table 1). For this com-parison, arithmetic mean NADP/NTN concentrationsand standard deviations were calculated from VWMmonthly concentrations from November through Marchto correlate with the approximate time period of snow-pack accumulation.
NADP/NTN solute concentrations were also analyzedto assess summer precipitation chemistry. Arithmeticmean concentrations and standard deviations were cal-culated for NO~
3, NH`
4and SO2~
4from VWM monthly
concentrations from May through September forNADP/NTN sites on the western slope (n"5 for allyears) and for sites on the eastern slope (n"7 for allyears) for 1992}1997. This "ve-month period was chosenfor comparison with the "ve-month snow accumulationperiod. Di!erences between western and eastern slopeprecipitation concentrations for each solute for all yearsand di!erences between NADP/NTN and snowpacksampling data were determined using one-tailed t-tests.
4. Results
Annual NADP mean concentrations of NO~3
in pre-cipitation for years 1992}1997 ranged from 10.5 to
1716 K. Heuer et al. / Atmospheric Environment 34 (2000) 1713}1722
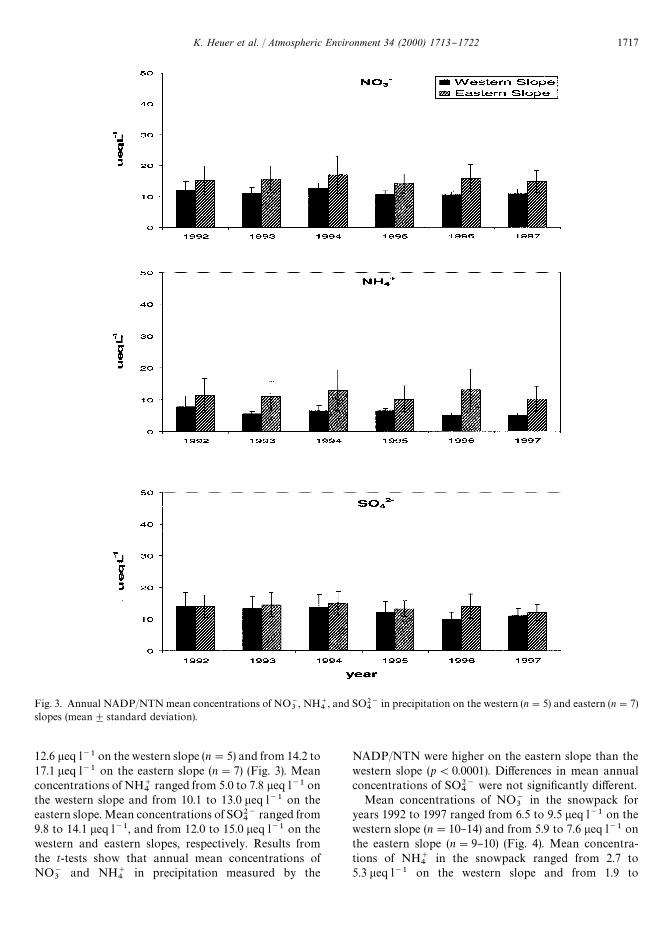
Fig. 3. Annual NADP/NTN mean concentrations of NO~3, NH`
4, and SO2~
4in precipitation on the western (n"5) and eastern (n"7)
slopes (mean$standard deviation).
12.6 leq l~1 on the western slope (n"5) and from 14.2 to17.1 leq l~1 on the eastern slope (n"7) (Fig. 3). Meanconcentrations of NH`
4ranged from 5.0 to 7.8 leq l~1 on
the western slope and from 10.1 to 13.0 leq l~1 on theeastern slope. Mean concentrations of SO2~
4ranged from
9.8 to 14.1 leq l~1, and from 12.0 to 15.0 leq l~1 on thewestern and eastern slopes, respectively. Results fromthe t-tests show that annual mean concentrations ofNO~
3and NH`
4in precipitation measured by the
NADP/NTN were higher on the eastern slope than thewestern slope (p(0.0001). Di!erences in mean annualconcentrations of SO2~
4were not signi"cantly di!erent.
Mean concentrations of NO~3
in the snowpack foryears 1992 to 1997 ranged from 6.5 to 9.5 leq l~1 on thewestern slope (n"10}14) and from 5.9 to 7.6 leq l~1 onthe eastern slope (n"9}10) (Fig. 4). Mean concentra-tions of NH`
4in the snowpack ranged from 2.7 to
5.3 leq l~1 on the western slope and from 1.9 to
K. Heuer et al. / Atmospheric Environment 34 (2000) 1713}1722 1717
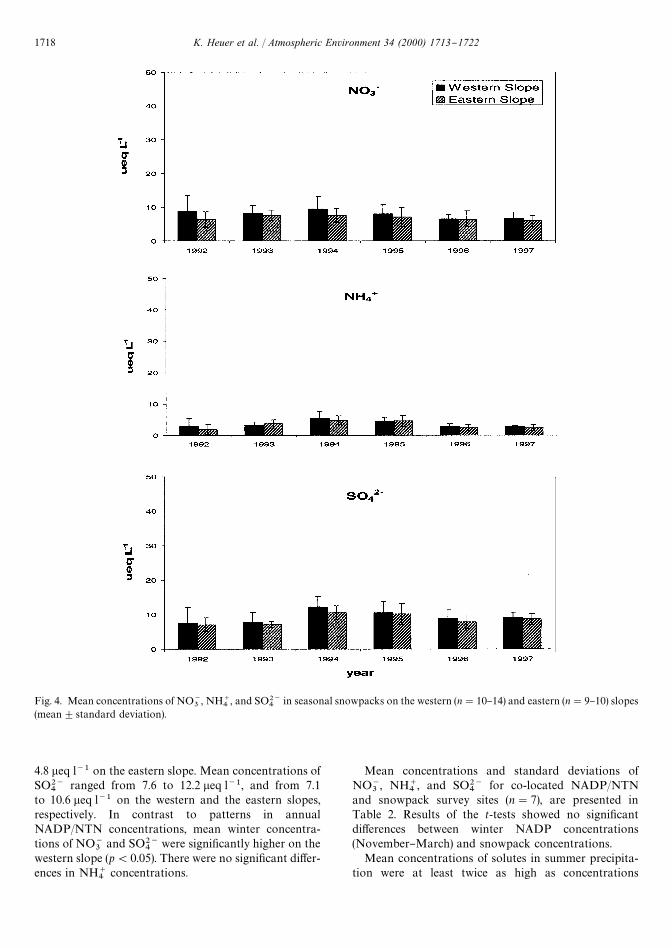
Fig. 4. Mean concentrations of NO~3
, NH`4
, and SO2~4
in seasonal snowpacks on the western (n"10}14) and eastern (n"9}10) slopes(mean$standard deviation).
4.8 leq l~1 on the eastern slope. Mean concentrations ofSO2~
4ranged from 7.6 to 12.2 leq l~1, and from 7.1
to 10.6 leq l~1 on the western and the eastern slopes,respectively. In contrast to patterns in annualNADP/NTN concentrations, mean winter concentra-tions of NO~
3and SO2~
4were signi"cantly higher on the
western slope (p(0.05). There were no signi"cant di!er-ences in NH`
4concentrations.
Mean concentrations and standard deviations ofNO~
3, NH`
4, and SO2~
4for co-located NADP/NTN
and snowpack survey sites (n"7), are presented inTable 2. Results of the t-tests showed no signi"cantdi!erences between winter NADP concentrations(November}March) and snowpack concentrations.
Mean concentrations of solutes in summer precipita-tion were at least twice as high as concentrations
1718 K. Heuer et al. / Atmospheric Environment 34 (2000) 1713}1722

Table 2Volume-weighted mean concentrations of NO~
3, NH`
4, and SO2~
4for NADP/NTN sites (November through March) and snowpack
survey sites. Mean (1SD)
West East
NADP Snow NADP Snow
NO~3
Winter 1992 9.7 (4.7) 11.3 (6.3) 10.5 (5.7) 8.6 (1.5)1993 8.9 (3.9) 10.6 (2.6) 12.6 (10.1) 9.1 (1.2)1994 13.8 (10.6) 13.1 (6.6) 12.9 (5.5) 10.2 (0.6)1995 9.4 (4.2) 10.9 (3.7) 11.1 (6.1) 9.5 (0.3)1996 9.2 (4.1) 7.3 (1.5) 10.1 (4.5) 8.6 (3.3)1997 12.3 (6.1) 6.0 (2.6) 12.9 (7.2) 7.4 (0.6)
NH`4
Winter 1992 3.2 (2.7) 4.0 (3.4) 3.5 (2.3) 2.6 (3.0)1993 2.8 (1.8) 4.7 (2.0) 3.6 (2.2) 4.1 (1.3)1994 4.5 (2.5) 7.0 (3.9) 7.7 (6.0) 6.8 (0.0)1995 3.8 (2.1) 5.7 (1.8) 4.6 (3.3) 6.2 (1.4)1996 4.3 (2.7) 3.6 (0.5) 5.4 (3.9) 3.2 (0.9)1997 4.0 (2.5) 2.7 (0.4) 4.5 (3.9) 3.1 (1.1)
SO2~4
Winter 1992 11.8 (7.5) 9.8 (4.1) 8.2 (4.0) 8.8 (2.7)1993 9.6 (4.4) 10.4 (4.1) 9.7 (5.1) 7.3 (0.9)1994 10.6 (6.3) 14.3 (5.8) 9.6 (3.7) 12.9 (2.8)1995 9.1 (4.7) 12.5 (4.7) 8.9 (4.6) 11.4 (1.7)1996 8.2 (5.3) 10.2 (2.1) 9.5 (4.6) 9.4 (2.8)1997 9.6 (4.7) 9.5 (2.5) 10.7 (8.0) 9.3 (0.7)
in winter precipitation. Mean concentrations of NO~3
insummer precipitation for years 1992}1997 ranged from11.2 to 25.7 leq l~1 on the western slope (n"5) and from18.9 to 24.5 leq l~1 on the eastern slope (n"7) (Fig. 5).Mean concentrations of NH`
4ranged from 5.4 to
16.4 leq l~1 on the western slope and from 13.3 to19.7 leq l~1 on the eastern slope. Mean concentrationsof SO2~
4ranged from 11.9 to 25.1 leq l~1, and from 17.1
to 23.5 leq l~1 on the western and the eastern slopes,respectively. Patterns in summer precipitation chemistryre#ect annual patterns, in that concentrations of NO~
3(p(0.05) and NH`
4(p(0.0001) were signi"cantly higher
on the eastern slope.
5. Discussion
Annual NADP/NTN data show that higher concen-trations of NO~
3and NH`
4were found in precipitation
on the eastern slope of the Rockies when compared to thewestern slope (Fig. 3). The comparison of annual SO2~
4concentrations shows that there were no signi"cant dif-ferences between slopes. A comparison of NADP/NTNdata to snowpack chemistry for November through
March, representing the time period of snowpack accu-mulation, showed no signi"cant di!erences between thetwo sampling methods. This suggests that snowpacksurveys can supplement the sampling density of theNADP/NTN, and provide comparable precipitationchemistry estimates at largely inaccessible high-elevationsites throughout the Colorado Rocky Mountains.
The comparison of winter and summer concentrationsof NO~
3, NH`
4and SO2~
4show seasonal di!erences in
the quality of precipitation in Colorado. Snowpackchemistry shows that concentrations of NO~
3and SO2~
4were higher on the western slope during the winter sea-son, with no signi"cant di!erences in NH`
4(Fig. 4), while
NADP/NTN shows that concentrations of NO~3
andNH`
4were higher on the eastern slope during the sum-
mer, with no signi"cant di!erences in SO2~4
(Fig. 5).Summertime concentrations of all three solutes weretwice as high as wintertime concentrations. Because ofthis magnitude, patterns in annual concentrations re#ectsummer concentrations, and mask patterns in winterconcentrations.
Seasonal di!erences in precipitation chemistry are in-#uenced by variable weather patterns and source areas.In Colorado, winter precipitation originates in the
K. Heuer et al. / Atmospheric Environment 34 (2000) 1713}1722 1719

Fig. 5. NADP/NTN mean concentrations of NO~3
, NH`4, and SO2~
4in summer precipitation (May}September) on the western (n"5)
and eastern (n"7) slopes (mean$standard deviation).
northwest and is rapidly transported via the jet stream(Hansen et al., 1978; Parrish et al., 1990). However, duringthe summer months, precipitation often originates in thesoutheast and the southwest (Barry, 1973; Hansen et al.,1978). The eastern slope of the Colorado Front Rangealso commonly experiences upslope events during thespring and summer (Toth and Johnson, 1985; Parrish etal., 1990). Upslope events are the result of a diurnal cycle;solar heating forces air #ow upvalley during the day andnocturnal radiative cooling that occurs rapidly on moun-taintops reverses the air#ow to down valley at night.
These events are capable of transporting anthropogenicpollutants from the Denver}Boulder}Fort Collins urbancorridor to high-elevation ecosystems on the easternslope (Parrish et al., 1990; Sievering et al., 1996).
These weather patterns in combination with emissionsource areas help to explain di!erences in precipitationchemistry on either side of the Rockies and during di!er-ent seasons of the year. Winter storms carry pollutantsfrom sources west of the Divide, and result in higherconcentrations of solutes in precipitation on the westernslope. Spring and summer storms moving from the east,
1720 K. Heuer et al. / Atmospheric Environment 34 (2000) 1713}1722

southeast and southwest carry pollutants from sourceseast of the Divide, and result in higher concentrations onthe eastern slope. The results of this comparison showthat high-elevation ecosystems in Colorado are in-#uenced by air pollution sources on both sides of theRockies. However, sources on the eastern slope appear tohave a greater in#uence on precipitation chemistry.
6. Conclusions
A comparison of NADP/NTN data and snowpackchemistry data shows that these two sampling methodsare comparable and that Colorado snowpack surveysmay be used to complement the NADP network. Precipi-tation chemistry at high-elevation sites in Colorado va-ries seasonally due to weather patterns and emissionsource areas. Concentrations of NO~
3and SO2~
4in win-
ter precipitation were greater on the western slope of theRockies, and concentrations of NO~
3and NH`
4in sum-
mer precipitation were greater on the eastern slope. Sum-mer concentrations in general were almost twice as highas winter concentrations. Because of this magnitude, pat-terns in annual concentrations re#ected patterns in sum-mer concentrations.
This comparison of precipitation chemistry on theeastern and western slopes of the Rocky Mountainsshows that high-elevation ecosystems in Colorado arein#uenced by air pollution emission sources located onboth sides of the Divide. It also suggests that sources ofN and S located east of the Divide have a greater in#u-ence on precipitation chemistry in the Colorado Rockies.However, advanced modeling is needed to determine thespeci"c contributions of pollutants from agricultural, ve-hicular and industrial sources. Recently, bulk snow sam-ples were collected at Rocky Mountain National Parkthat will be analyzed for N isotopes. These results will becombined with information on local meteorology to de-termine speci"c source areas of air pollution that may bea!ecting the park.
Acknowledgements
We would like to acknowledge sta! of the Illinois StateWater Survey and the NADP Program O$ce for theircontributions to NADP/NTN; the USGS-Water Re-sources Division for coordinating the collection of snow-pack samples and lab analysis; and the site operatorsfrom sponsoring agencies for providing "eld assistance.
References
Barry, R.G., 1973. A climatological transect of the east slope ofthe Front Range, Colorado. Arctic and Alpine Research 5,89}110.
Bunyak, J., 1993. Permit application guidance for new air pollu-tion sources. Natural Resources Report 93-09. U.S. Depart-ment of the Interior, National Park Service, Denver, CO,Report NRAQD/NRR-93-09, p. 36.
Campbell, D., Clow, D., Ingersoll, G., Mast, M., Spahr, N., Turk,J., 1995. Nitrogen deposition and release in alpine water-sheds, Loch Vale, Colorado, USGS, In: Tonnessen, K.A.,Williams, M.W., Tranter, M. (Eds.), Biogeochemistryof Seasonally Snow-Covered Catchments, Proceedings ofa Symposium, July 1995. IAHS Publication No. 228, pp.243}253.
Dickson, R.J., Oliver, W.R., Dickson, E.L., Sadeghi V.M., 1994.Development of an emissions inventory for assessing visualair quality in the western United States. Final Report to theElectric Power Research Institute, Project VARED, PaloAlto, CA.
Environmental Protection Agency (EPA), 1995. Acid depositionstandard feasibility study report to Congress. EPA 430-R-95-001a, Environmental Protection Agency, O$ce of Airand Radiation, Washington, DC, 120pp.
Fenn, M., Poth, M., Aber, J., Baron, J., Bormann, B., Johnson, S.,Lamly, A., McNulty, S., Ryan, F., Stottlemyer, R., 1998.Nitrogen excess in North American ecosystems: predispos-ing factors, ecosystem responses, and management strategies.Ecological Applications 8, 706}733.
Hansen, W.R., Chronic, J., Matelock, J., 1978. Climatography ofhe Front Range Urban Corridor and Vicinity, Colorado.Geologocal Survey Professional Paper No. 1019. US Gov-ernment Printing O$ce, Washington, DC.
Ingersoll, G.P., 1995. Maximum-accumulation snowpackchemistry at selected sites in northwestern Colorado duringspring 1994. US Geological Survey, Open File Report 95-139, p. 14.
Lynch, J., Grimm, J., Bowersox, V., 1995. Trends in precipita-tion chemistry in the United States: a national per-spective, 1980}1992. Atmospheric Environment 29,1231}1246.
Parrish, D.D., Hahn, C.H., Fahey, D.W., Williams, E.J., Bollin-ger, M.J., Hubler, G., Buhr, M.P., Murphy, P.C., Trainer, M.,Hsie, E.Y., Liu, S.C., Fehsenfeld, F.C., 1990. Systematicvariations in the concentration of NO
xat Niwot Ridge,
Colorado. Journal of Geophysical Research 95 (D2),1817}1836.
Peden, M., et al., 1986. Development of standard methods forthe collection and analysis of precipitation. Illinois StateWater Survey Contract Report d381/USEPA-EMSLd CR810780-01.
Shaver, C.L., Tonnessen, K.A., Maniero, T.G., 1994. Clearingthe air at Great Smoky Mountains National Park. Ecologi-cal Applications 4, 690}701.
Sievering, H., Rusch, D., Marquez, L., 1996. Nitric acid, partic-ulate nitrate and ammonium in the continental free tropo-sphere: nitrogen deposition to an alpine tundra ecosystem.Atmospheric Environment 30, 2527}2537.
Toth, J.J., Johnson, R.H.I., 1985. Summer surface #ow charac-teristics over northeast Colorado. Monthly Weather Review133, 1458}1468.
Turk, J., 1995. E!ects of energy resource development on lakes}what do we need to know? In: Carter, L.M.H. (Ed.), Energyand the Environment } Application of Geosciences to Deci-sion-Making.
K. Heuer et al. / Atmospheric Environment 34 (2000) 1713}1722 1721

Turk, J., Campbell, D., 1997. Are aquatic resources of the Mt.Zirkel Wilderness Areas in Colorado a!ected by acid depo-sition and what will emissions reductions at the local powerplant do? USGS Fact Sheet FS-043-97.
Turk, J., Spahr, N., 1991. Rocky Mountains. In: Charles,D.F. (Ed.), Acidic Deposition and Aquatic Ecosystems:Regional Case Studies. Springer, New York,pp. 471}502.
Williams, M.W., Tonnessen K.A., In press. Critical loads forinorganic nitrogen deposition in the Colorado Front Range,USA. Ecological Applications, in press.
Williams, M.W., Bardsley, T., Rikkers, M., 1998. Oversamplingof snow and inorganic nitrogen wetfall using NADP dataNiwot Ridge, Colorado. Atmospheric Environment 32,3827}3832.
Williams, M.W., Baron, J., Caine, N., Sommerfeld, R., Sanford,R., 1996a. Nitrogen saturation in the Colorado Front Range.Environmental Science and Technology 30, 640}646.
Williams, M.W., Losleben, M., Caine, N., Greenland, D., 1996b.Changes in climate and hydrochemical responses in a high-elevation catchment. Limnology and Oceanography 41,939}946.
Williams, M.W., Melack, J., 1991. Precipitation chemistry andionic loading to an alpine basin Sierra Nevada. Water Re-sources Research 27, 1563}1574.
Winiwarter, W., Puxbaum, H., Schoner, W., Bohm, R., Werner,R., Vitovec, W., Kasper, A., 1998. Concentration of ioniccompounds in the wintertime deposition: results and trendsfrom the Austrian Alps over 11 years (1983}1993). Atmo-spheric Environment 32, 4031}4040.
1722 K. Heuer et al. / Atmospheric Environment 34 (2000) 1713}1722