comparison of digital treatment setups and final treatment
TRANSCRIPT

UNLV Theses, Dissertations, Professional Papers, and Capstones
5-1-2020
Comparison of Digital Treatment Setups and Final Treatment Comparison of Digital Treatment Setups and Final Treatment
Outcomes of Class II Division 1 Malocclusions Treated with Outcomes of Class II Division 1 Malocclusions Treated with
Premolar Extractions Premolar Extractions
Sogol Shantiyai
Follow this and additional works at: https://digitalscholarship.unlv.edu/thesesdissertations
Part of the Dentistry Commons
Repository Citation Repository Citation Shantiyai, Sogol, "Comparison of Digital Treatment Setups and Final Treatment Outcomes of Class II Division 1 Malocclusions Treated with Premolar Extractions" (2020). UNLV Theses, Dissertations, Professional Papers, and Capstones. 3955. http://dx.doi.org/10.34917/19412168
This Thesis is protected by copyright and/or related rights. It has been brought to you by Digital Scholarship@UNLV with permission from the rights-holder(s). You are free to use this Thesis in any way that is permitted by the copyright and related rights legislation that applies to your use. For other uses you need to obtain permission from the rights-holder(s) directly, unless additional rights are indicated by a Creative Commons license in the record and/or on the work itself. This Thesis has been accepted for inclusion in UNLV Theses, Dissertations, Professional Papers, and Capstones by an authorized administrator of Digital Scholarship@UNLV. For more information, please contact [email protected].

COMPARISON OF DIGITAL TREATMENT SETUPS AND FINAL
TREATMENT OUTCOMES OF CLASS II DIVISION 1
MALOCCLUSIONS TREATED WITH
PREMOLAR EXTRACTIONS
By
Sogol Shantiyai
Bachelor of Science - Biology San Diego State University
2012
Doctor of Dental Medicine Midwestern University College of Dental Medicine
2016
A thesis submitted in partial fulfillment of the requirements for the
Master of Science – Oral Biology
School of Dental Medicine
The Graduate College
University of Nevada, Las Vegas May 2020

Copyright 2020 by Sogol Shantiyai
All Rights Reserved

ii
Thesis Approval
The Graduate College The University of Nevada, Las Vegas
March 10, 2020
This thesis prepared by
Sogol Shantiyai
entitled
Comparison of Digital Treatment Setups and Final Treatment Outcomes of Class II Division 1 Malocclusions Treated with Premolar Extractions
is approved in partial fulfillment of the requirements for the degree of
Master of Science – Oral Biology School of Dental Medicine
Kathryn Hausbeck Korgan, Ph.D. Graduate College Dean
Tanya Al-Talib, D.D.S. Examination Committee Chair
Brian Chrzan, Ph.D. Examination Committee Member
Robert Danforth, D.D.S. Examination Committee Member
Amei Amei, Ph.D. Graduate College Faculty Representative

iii
Abstract
Objective: This study aimed to determine whether there are differences between pre-orthodontic
treatment dimensions when compared to the virtual treatment simulations and actual orthodontic
treatment outcomes in Class II malocclusions treated with two or four premolar extractions.
Introduction: The use of intraoral scanners has become commonplace in orthodontic practices,
giving practitioners the ability to scan and assess maxillary and mandibular dental morphology
and occlusal relationships chairside and in real-time. Practitioners can use virtual treatment
planning to evaluate different extraction patterns, visualize potential non-extraction outcomes
using interproximal reduction, and alter anchorage strategies based on the amount of retraction or
protraction required for desired space closure. Similar to the dental Visualized Treatment
Objective (VTO), digital treatment projections allow the clinician to both visualize and quantify
the degree and direction of tooth movement desired.
Materials and Methods: 46 Class II division 1 patients were selected for this study: 22 subjects
treated with two maxillary premolar extractions, 24 treated with four premolar extractions.
Patients were selected based on presentation of Angle Class II malocclusion, confirmed with
evaluation of digital study models. All digital treatment projections were constructed using uLab
Systems (uLab Systems Inc. Redwood City, CA), and measurements for intermolar width, inter-
canine width, overjet and overbite were recorded.
Results: Two-tailed paired T-tests were performed to determine if there was a significant
difference between variables pre-treatment, post-treatment and from virtual setup with a
significance level of P < 0.05. Group 1 treated with two premolar extractions resulted in a

iv
significant difference between maxillary intercanine width, mandibular intercanine width, and
overbite between uLab virtual setup and treatment groups. Group 2 treated with four premolar
extractions found significant differences between maxillary intermolar width, maxillary and
mandibular intercanine widths, and overjet between treatment and virtual setup groups. There
was a significant difference for all variables measured when comparing pre-treatment
measurements to virtual setups treated with two premolar extractions. When comparing pre-
treatment to virtual setups treated with four premolar extractions, there was a significant
difference in all variables except overbite. Comparison of pre-treatment to post-treatment values
treated with two premolar extractions found significant difference between maxillary and
mandibular intermolar width, maxillary intercanine width, overjet and overbite. There was a
significant difference between pre- and post-treatment in maxillary intermolar width, mandibular
intermolar width, and overjet treated with four extractions.
Conclusions: Despite statistically significant differences between treatment outcomes and virtual
setups in variables including overbite and overjet, the difference between them was not clinically
significant. Statistically significant differences in both the maxillary and mandibular intercanine
widths between digital setups and treatment outcomes suggests that with software simulations,
the clinician tends to over-expand the intercanine width. Similarly, virtual setups showed a
tendency to expand intercanine dimensions more than actual treatment outcomes when
comparing to initial pre-treatment dimensions. This study supports the use of virtual setups for
the purpose of guiding treatment and visualizing potential outcomes.

v
Acknowledgements
I wish to express my gratitude to my committee chair, Dr. Tanya Al-Talib, for her
guidance throughout this project. Above all, I am sincerely thankful for the unwavering love and
support from my family and the love of my life.

vi
Table of Contents
Abstract .................................................................................................................................... iii Acknowledgements ..................................................................................................................... v
Table of Contents ....................................................................................................................... vi List of Tables ............................................................................................................................ vii
List of Figures ..........................................................................................................................viii Chapter 1: Introduction ............................................................................................................... 1
Chapter 2: Materials and Methods ............................................................................................... 3 uLab Virtual Setup Protocol .................................................................................................... 4
Digital Measurement Protocol ................................................................................................. 8 Statistical Analysis ................................................................................................................ 11
Chapter 3: Literature Review .................................................................................................... 12 Chapter 3: Results ..................................................................................................................... 26
Intra-observer Error Rate....................................................................................................... 31 Chapter 4: Discussion ............................................................................................................... 32
Limitations and Future Studies .............................................................................................. 36 Conclusions .......................................................................................................................... 36
Appendix A: Data Results ......................................................................................................... 38 Appendix B: Graphs ................................................................................................................. 42
Appendix C: Statistical Analysis Tables .................................................................................... 43 Appendix D: Reliability Studies ................................................................................................ 49
Appendix E: IRB Exemption .................................................................................................... 54 References ................................................................................................................................ 55
Curriculum Vitae ...................................................................................................................... 62

vii
List of Tables Table 1. Paired sample statistics of treatment and setup groups with two premolar extractions .. 26 Table 2. Paired sample statistics of treatment and setup groups with four premolar extractions . 27 Table 3. Paired sample statistics of pre-treatment and setup groups ........................................... 28 Table 4. Paired sample statistics of pre-treatment and treatment groups..................................... 29 Table 5. Intra-observer reliability with Intraclass Correlation Coefficient (n=40) ...................... 31

viii
List of Figures Figure 1. STL Model................................................................................................................... 4
Figure 2 Tooth segmentation ....................................................................................................... 5
Figure 3. Labeling dentition ........................................................................................................ 5
Figure 4-1 and 4-2. Tooth orientation .......................................................................................... 6
Figure 5-1 and 5-2. Virtual setup alignment ................................................................................ 6
Figure 6. Space Closure .............................................................................................................. 7
Figure 7. Occlusal interferences .................................................................................................. 7
Figure 8. Final Occlusion ............................................................................................................ 8
Figure 9. Intermolar width measurement ..................................................................................... 8
Figure 10. Intercanine width measurement .................................................................................. 9
Figure 11. Overjet and Overbite orientation ................................................................................ 9
Figure 12. Overbite and overjet measurements .......................................................................... 10

1
Chapter 1: Introduction
The use of intraoral scanners has become commonplace in orthodontic practices, often
praised by patients for eliminating the need for conventional diagnostic impressions. Digital
scans have the ability to improve efficiency of patient appointments by removing time-
consuming steps including tray selection, alginate impressions, bite registrations, disinfection, as
well as the accompanying laboratory procedures of pouring, trimming and storage of dental
casts. The potential complication of distortion associated with conventional impressions is also
eliminated. By removing the need for plaster cast production, the orthodontist has the ability to
scan and assess maxillary and mandibular dental morphology and occlusal relationships
chairside and in real-time.
The benefits of both digital or plaster study models in diagnosis and treatment planning
include the ability to collect useful information about general alignment, occlusion, arch width
(Hechler, 2008), arch length discrepancies, dental asymmetries, and mesiodistal dimensions of
the dentition (Camardella, Rothier, Vilella, Ongkosuwito, & Breuning, 2016). Recent
technological advancements allow practitioners to evaluate and manipulate digital models
chairside, setting teeth into their desired position and facilitating in-house aligner fabrication.
While digital projections may encourage patients to start treatment by providing a visualization
of potential treatment outcomes, the main goal should remain to give the orthodontist a realistic
view of how treatment will finish (Barreto, Faber, Vogel, & Araujo, 2016). Practitioners can use
virtual treatment planning to evaluate different extraction patterns, visualize potential non-
extraction outcomes using interproximal reduction, and alter anchorage strategies based on the
amount of retraction or protraction required for desired space closure. Similar to the dental
Visualized Treatment Objective (VTO) developed by McLaughlin and Bennet in 1971, digital

2
treatment projections allow the clinician to both visualize and quantify the degree and direction
of tooth movement desired. While the dental VTO is widely accepted as a helpful diagnostic aid,
it is limited by providing a two-dimensional (2D) analysis of three-dimensional (3D) structures.
For years, 3D virtual surgical planning has been used for orthognathic surgeries; allowing
maxillofacial surgeons to diagnose, plan surgical procedures and predict postoperative outcomes
(Tran et al., 2018). There are few published literatures regarding the accuracy of 3D treatment
planning and outcomes in orthodontic treatment alone. This study aims to investigate the
accuracy and reliability of digital treatment projections when compared to final outcomes for
patients with Class II division 1 malocclusions treated with either two and four premolar
extractions using edgewise orthodontic appliances. Further evaluation comparing pre-treatment
measures to setup and post-treatment outcomes were carried out to determine whether there were
significant changes and whether there are potential implications on long-term stability. The
information and knowledge gained from this retrospective study supports the use of virtual
treatment projections in daily practice to aid in treatment planning and visualizing possible
treatment outcomes.
3
Chapter 2: Materials and Methods
Approval to conduct this study was received by the University of Nevada, Las Vegas
Institutional Review Board (Protocol # 1280536). A retrospective study of Class II division 1
orthodontic patients treated at the UNLV School of Dental Medicine’s Orthodontic Residency
Program were studied.
Sample
Patients were selected based on presentation of Angle Class II malocclusion; defined as
the mesio-buccal cusp of the maxillary first molar occluding anterior to the buccal groove of the
mandibular first molar. Molar classification was confirmed with intraoral photos and evaluation
of digital study models. 46 patients were selected: 22 subjects treated with two maxillary
premolar extractions, 24 treated with four premolar extractions (14 maxillary first, mandibular
second premolars; 10 maxillary first, mandibular first premolars).
Case selection was based on the following criteria: (1) periodontally healthy subjects with
full permanent dentition, (2) patient received orthodontic treatment using edgewise technique (22
slot) with extraction of two or four premolars (maxillary first or second premolars only;
maxillary and mandibular first premolars; or maxillary first and mandibular second premolars),
(3) OrthoCad or 3Shape Trios digital models pre- and post-treatment available for each patient in
STL file format, (4) no supernumerary or impacted teeth (not including third molars), (5) pre-
treatment orthodontic records including intraoral photos, panoramic and cephalometric
radiographs available. The exclusion criteria included patients with congenital anomalies,
patients with missing permanent teeth, and any orthognathic surgical case.
Access was granted to the patient’s pre-treatment photographs, panoramic and
cephalometric radiographs (Dolphin Imaging, Chatsworth, CA). These diagnostic tools provided

4
information regarding whether the patient has a consonant or non-consonant smile arc, amount of
incisal and gingival display, and soft tissue considerations which were incorporated into the
patient’s digital treatment projection. Cephalometric data, including labially inclined maxillary
and mandibular incisors often seen in Class II division 1 cases were incorporated into treatment
projection when deciding the amount of retraction and incisor uprighting desired.
All digital treatment projections were constructed using uLab Systems Software
(Redwood City, CA). Pre-treatment, post-treatment and STL files from virtual setups were de-
identified by an independent researcher and digital measurements completed using uLab
software. The following linear measurements were then recorded: intermolar width, inter-canine
width, overjet and overbite.
uLab Virtual Setup Protocol
Figure 1. STL Model
Open shell STL model of pre-treatment arch-forms were uploaded into uLab Systems Software.

5
Figure 2. Tooth segmentation
Individual teeth, not including third molars, were segmented.
Figure 3. Labeling dentition
Teeth to be extracted were selected to reflect the actual treatment each patient received. Patients
were either treated with extraction of two maxillary first premolars, four first premolars, or
maxillary first and mandibular second premolars.

6
Figure 4-1 and 4-2. Tooth orientation
Mesio-distal and inciso-gingival orientation of each tooth were adjusted as needed.
Figure 5-1 and 5-2. Virtual setup alignment
Desired maxillary and mandibular incisor positions were determined based on pre-treatment
diagnostic records. Projected position of incisors used intraoral photos to determine amount of
incisal display and desired smile arc. Panoramic radiographs influenced inclination of dentition
for improved projected root parallelism. Extraoral and intraoral photographs, and cephalometric
radiographs helped determine the amount of retraction and uprighting of anterior dentition.

7
Figure 6. Space Closure
Reciprocal space closure was used to protract posterior dentition when indicated.
Figure 7. Occlusal interferences
Red markings on teeth indicate areas of heavy occlusion or occlusal interferences. Yellow
indicates moderate contact and green indicates light (ideal) contact.
8
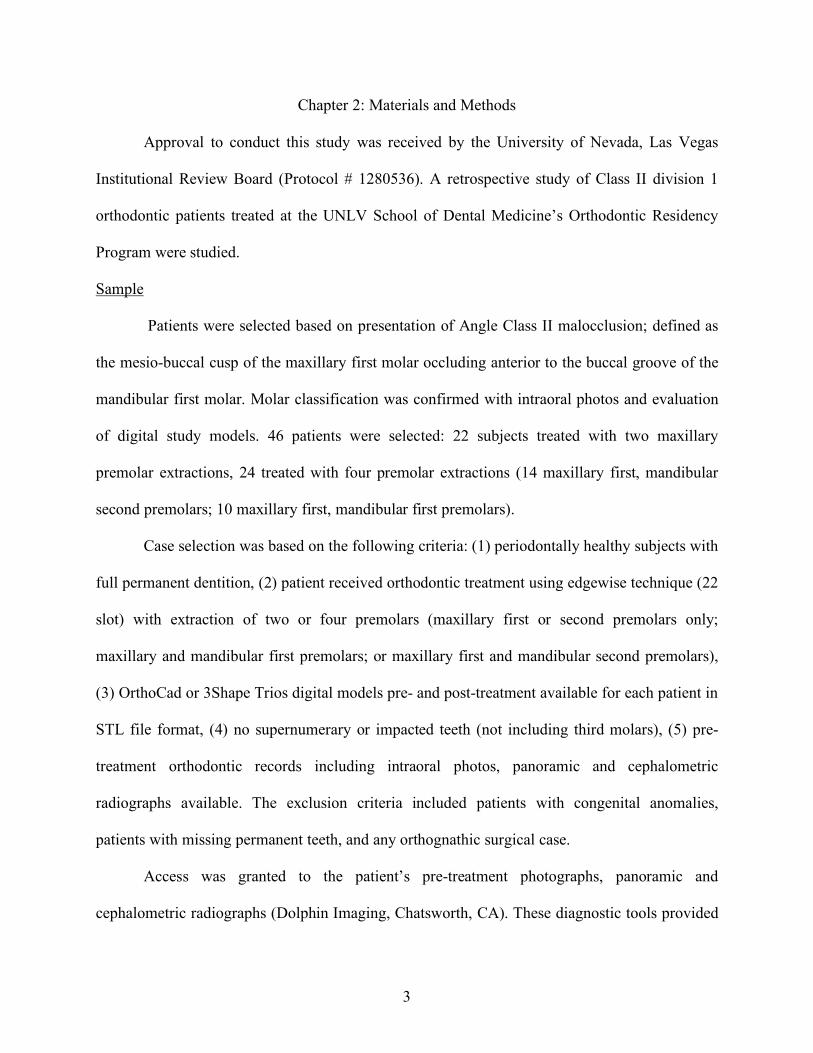
Figure 8. Final Occlusion
Final occlusion in both arches were evaluated and adjusted as needed to confirm Class I molar
and canine relationships were achieved (in four premolar extraction cases), as well as ideal
overjet, overbite and inclination of dentition.
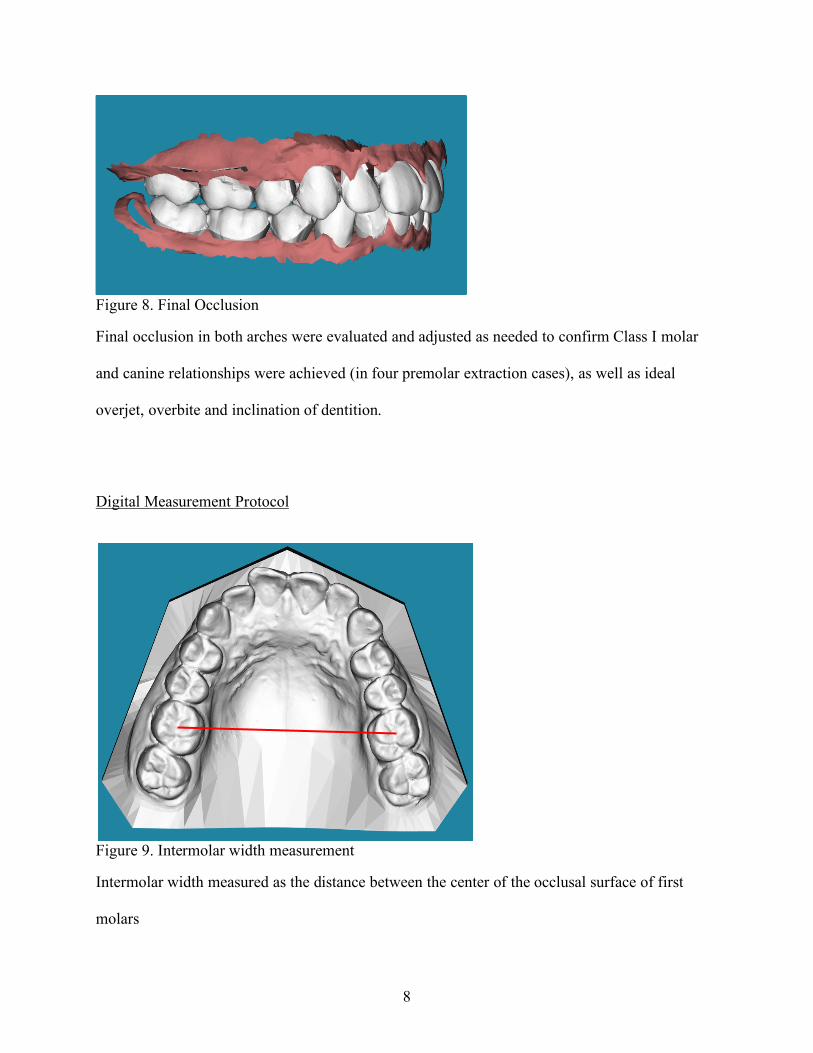
Digital Measurement Protocol
Figure 9. Intermolar width measurement
Intermolar width measured as the distance between the center of the occlusal surface of first
molars

9
Figure 10. Intercanine width measurement
Intercanine width was measured from cusp tip of contralateral canines.
Figure 11. Overjet and Overbite orientation
Final overjet was measured using uLab software from the center of the incisal edge of the
maxillary right central incisor to the center incisal edge of the mandibular right central incisor.

10
Figure 12. Overbite and overjet measurements
Final overbite measured by the uLab software as the vertical overlap from the incisal edge center
of the right maxillary central incisor to incisal edge of the mandibular incisor

11
Statistical Analysis
Statistical analysis was performed using Statistical Package for the Social Sciences 24
(SPSS 24) for Windows. All measurements were completed under the same setting using uLab
Systems Software. Descriptive statistics were used to calculate the mean values for each variable
measured (intermolar width, intercanine width, overjet, overbite). Paired T-tests were performed
with a 95% confidence interval to determine whether there was a statistically significant
difference between pre-treatment, post-treatment and virtual setup for each variable. A P-value
of <0.05 was defined as significant.
Intra-observer error was calculated using an Intraclass Correlation Coefficient (ICC). ICC
was based on repeated measurements on 40 randomly selected patients using the same viewing
conditions, with a three-month interval between scoring sessions (Table 5). A Bland-Altman plot
was used to visualize the difference in agreement between readings (Appendix D).

12
Chapter 3: Literature Review
3-Dimensional Scanners
In the 1990’s, the introduction of three-dimensional (3D) scanning software allowed
conventional study models to be converted to a digital format (Alcan, Ceylanoǧlu, & Baysal,
2009). Companies offering these services, such as OrthoCad (Cadent Inc.), receive polyvinyl
siloxane (PVS) or alginate impressions with bite registrations which are then digitized using a
3D surface model scanner. With an indirect digitization system like OrthoCad, potential for error
or distortions is increased because it is a two-step procedure (Alcan et al., 2009). The first step
involving converting the alginate impression to stone, the second taking multiple scans of the
stone model in thin slices which are stitched together to create a digitized product (Fleming,
Marinho, & Johal, 2011). Distortion of alginates can occur through evaporation, or syneresis of
water, causing contraction of the material or inversely alginates can expand through absorption
of moisture, or imbibition (Alcan et al., 2009). It has been suggested that the best method to
avoid distortion of alginate is to pour in stone within ten minutes of the impression (Skinner &
Pomes, 1946). Industrial grade scanners have become available with the ability used to scan
impressions directly (Kuo & Miller, 2003) and reduce time for distortion to occur.
Over the years, various scanning techniques have become available for digitizing models.
Laser scanners reflect a laser light from the surface of the stone model which is then captured by
an optical sensor (Kuo & Miller, 2003). While this system is comparatively inexpensive, it is
limited by its lower resolution and slow scanning time. White-light scanners use the same
mechanism as a laser scan, however white-light is reflected from the model which improves the
quality of the scan in a shorter amount of time. Destructive scanners encase a model with
urethane resin, thinly slices into layers and then scans. This process is more accurate than a laser

13
scan, however it destroys the model during the scanning process. Lastly, CT scans use digital
radiographs to produce models with great accuracy. These scanners can directly scan
impressions, bite registration material and stone models and are considered to be the most
accurate and least time consuming technology (Kuo & Miller, 2003).
A study by Wesemman et al. (2017) comparing accuracy of desktop surface scanners to
intraoral scanners found the R900 desktop scanner to have superior results to others tested. They
recommend that if the model is intended to be used for full-arch prosthodontic purposes, indirect
digitization using a desktop scanner is superior. However, for orthodontic purposes, they found
that direct digitization using intraoral scanners like the 3Shape Trios system offered an
acceptable alternative with comparable results. The generally accepted accuracy of 0.1mm is
considered adequate enough to not compromise the diagnostic value of the model (Hayashi et al.,
2013).
When measuring Bolton discrepancy, Tomasetti (2001) found no significant difference in
measurements completed digitally or using a caliper and plaster study models. Garino and
Garinocit (Garino & Garino, 2002) found that despite significant differences in linear
measurements when comparing manual and digital study models, the results were clinically
insignificant. In agreement, a systematic review by Fleming et al. (2011) comparing
measurements made on digital and stone models found the mean difference to be minor and
clinically insignificant. It is suggested that digital models are superior to stone when measuring
the Curve of Spee, as an antero-posterior line and vertical line to the deepest point of occlusion
can both be drawn on the software (Garino & Garino, 2002).
Recent technologic advancements have allowed for the production of digital models
using cone beam CT (CBCT) data without the need of impressions or scans. CBCT data can

14
create 3D renderings with or without the presence of anatomic roots (Hechler, 2008). These 3D-
models can then be examined with a conventional or transparent model base which offers
enhanced visualization of the dental crown and associated root morphology (Mah, 2007). With
the inclusion of detailed anatomical structures, the practitioner has more information in planning
treatment. These include the position of lingual cortical plates when determining whether to
retract or torque incisors, root proximity to the maxillary sinus, and amount of bone present
during space closure (Macchi, Carrafiello, Cacciafesta, & Norcini, 2006).
Virtual Treatment Planning in Orthodontics
The traditional approach of using stone models to create a treatment setup can now be
done virtually using 3D software. A study by Barreto et al. (2016) comparing manual and digital
setups for treatment planning found no significant difference between the two modalities when
measuring intercanine and intermolar widths, as well as the length of the individual dental
arches.
Digital setups provide the practitioner an idea of how the treatment will finish (Barreto et
al., 2016), while also providing a visualization for both patients and parents in understanding
treatment goals and potential outcomes. In borderline cases, these setups can help guide
treatment when deciding whether extractions are indicated. Additionally, various treatment
options with regards to anchorage considerations can be explored and compared during the
decision-making process.
Laboratory time required for stone model setup is often lengthy as it involves the
trimming of individual crowns and repositioning with wax to stabilize. As per Camardella et
al.(2016), a major disadvantage of this method was the inability to superimpose structures as

15
well as the inadvertent loss of tooth structure during the trimming and repositioning process.
With 3D software, tooth movements can be superimposed from their initial position to visualize
the direction and degree of desired tooth movement; illustrated by different colors that indicate
the initial and final tooth position. Additionally, digital setups require significantly less doctor
and staff time while also reducing physical storage requirements (Barreto et al., 2016).
Treatment of Class II Malocclusions
A commonly accepted treatment goal in orthodontics is to position the dentition in a way
that provides good facial esthetics while also in functional occlusion (Braun, 1999). Careful
analysis must be made when deciding on an extraction or non-extraction treatment plan in
correction of a Class II malocclusion. Extraction-based treatment plans must take into
consideration many factors including (but not limited to) dental and lip protrusion, the severity of
tooth size-arch length discrepancies (Mendes, Janson, Zingaretti Junqueira-Mendes, & Garib,
2019), resolving anteroposterior discrepancies, and patient growth potential (Samir E. Bishara,
Hoppens, Jakobsen, & Kohout, 1988). Extraction of two maxillary premolars for treatment of
Class II malocclusion is indicated when the mandibular arch has no significant crowding or
cephalometric discrepancy (Mendes et al., 2019). These patients often present with excess
overjet or crowding in the maxillary arch. Four-premolar extraction treatment can be indicated in
cases of dental crowding with or without cephalometric discrepancy. Two-premolar extraction
treatment generally requires less time than both four-premolars and non-extraction cases as the
molar relationship is maintained in a full-cusp Class II molar relationship.
Vaden (Vaden & Kiser, 1996) found that in Class II malocclusion patients treated without
extraction, a downward and backward mandibular rotation can be expected. In cases where

16
extractions are indicated but are not done, resulting clockwise vertical changes can be considered
an undesirable treatment sequela. Maintaining the vertical dimension is an important factor in
long-term stability, as increasing it in the posterior region results in an increased lower anterior
facial height (LAFH). Arquob et al. (2011) found that increased LAFH in both male and female
Class II patients were perceived to be the least attractive when measuring profile attractiveness.
It has been suggested that for every 1 millimeter (mm) of vertical change posteriorly, a 1.3mm
increase in anterior face height can be expected (Merrifield, 1982). Therefore, in deciding
whether to extract premolars in Class II malocclusion cases, vertical relationships should be
carefully considered.
Non-extraction treatment in Class II patients must apply mechanics for Class II
correction, such as Class II elastics or functional appliances. With the use of intermaxillary
elastics, the practitioner must keep in mind potential side effects that include the loss of
mandibular anchorage, mandibular incisor proclination, maxillary incisor extrusion and
associated increased soft tissue exposure upon smiling (Janson, Sathler, Fernandes, Branco, &
De Freitas, 2013). The extrusion of mandibular posterior teeth and maxillary incisors with the
use of intermaxillary elastics contributes to the clockwise rotation of the mandible and occlusal
plane (Nelson, Hansen, & Hagg, 2000) resulting in primarily dentoalveolar correction of the
malocclusion (Janson et al., 2013).
Numerous studies have found significant differences in perception of profile
attractiveness between laypersons and dentists (Abu Arqoub & Al-Khateeb, 2011). Dentists
proved to have a greater ability to distinguish profile changes (Maple, Vig, Beck, Larsen, &
Shanker, 2005), while a layperson’s perception of attractiveness is influenced more by extrinsic
features including hair color, style, shape and size of the nose (Cochrane, Cunningham, & Hunt,

17
1999). Laypersons are generally more critical than dentists while rating attractiveness, likely due
to a focus on extrinsic characteristics; while dentists have more experience with facial analysis
and, therefore, are considered more tolerant in their rating of attractiveness.
Mendes et al.(2019) compared profile attractiveness in Class II division 1 malocclusion
patients treated with either non-extraction, two-premolar or four-premolar extractions.
Laypersons and orthodontists rated the post-treatment and long-term esthetics by evaluating
androgynous facial silhouettes of the treatment groups with other variables affecting perceived
attractiveness eliminated. These included extrinsic factors of make-up and hair styles, and
intrinsic factors of skin complexion, eyes and facial expressions (Wuerpel, 1931). Post-
treatment, they found that the two-premolar extraction group was rated to have a significantly
more attractive profile than the four-premolar extraction group (Mendes et al., 2019). The two-
extraction and non-extraction groups had no statistically significant differences. Profile
attractiveness was found to be significantly greater in the two-premolar extraction group long-
term. A study by Bishara et al. (1997) found that prior to orthodontic treatment, laypersons
perceived profiles with clinically acceptable occlusions without facial disharmony as more
favorable than untreated patients with a Class II malocclusion. Immediately following four-
premolar extraction treatment, laypersons perceived profiles of the extraction group to be more
favorable than non-extraction group; however, long-term, there was no significant difference in
perceived profile attractiveness. In agreement, Janson et al. (2016) found that there was no
significant difference in long-term facial attractiveness between two-extraction, four-extraction
and non-extraction treatment of Class II division 1 malocclusion patients.
Current research suggests that there is no single extraction or non-extraction approach to
treating Class II malocclusion cases that guarantees a better perception of post-treatment facial

18
esthetics. Many factors must be evaluated in guiding treatment decisions including the severity
of the malocclusion, profile considerations, overjet (Mendes et al., 2019), inclination of incisors,
degree of crowding, cephalometric values such as long or short facial height, steepness of the
mandibular plane, and the need for dental compensation (S. E. Bishara & Jakobsen, 1997).
Characteristics of Class II Malocclusion
Two major categories exist for the classification of Class II malocclusions; distinguished
primarily based on the inclination of the maxillary incisors. Class II division 1 malocclusions
were characterized by Edward Angle as having labially inclined maxillary incisors (Angle,
1907). These malocclusions typically present with an increased buccal overjet with or without
maxillary arch narrowing (S. E. Bishara, 2006). Alternatively, Class II division 2 malocclusions
presented with lingual or upright maxillary incisors, often with excessive overbites and minimal
overjet (Angle, 1907). This lingual axial inclination of maxillary incisors is believed to be
consistent with the inclination of tooth bud development and often a narrow labiolingual crown
width (S. E. Bishara, 2006). An exaggerated curve of Spee is not uncommon in Class 2 division
2 patients in addition to lower incisor extrusion with impingement on palatal tissues.
In 1953, Fisk and his colleagues (1953) defined Class II division 1 malocclusions as
having six morphologic variations: 1) Maxilla and teeth positioned anteriorly in relation to the
cranium, 2) Maxillary teeth positioned anteriorly in the bone, 3) Underdeveloped mandible, 4)
Normal sized mandible in a posterior position, 5) Mandibular teeth posteriorly positioned in the
bone, or 6) Any combination of the above mentioned.
Skeletal characteristics of Class II malocclusions can be observed in cephalometric
radiographs displaying an increased ANB angle and Wits Appraisal (S. E. Bishara, 2006). In

19
Class II division 1 malocclusions, studies suggest that the maxilla to cranial base relationship is
often within normal range, and that the increased ANB angles and facial convexity are the result
of a retrusive mandible and chin position (Drelich, 1948). These patients may present with a
shortened mandibular body length or steeper mandibular plane angles (Maj, Luzi, & Lucchese,
1960). Class II division 2 cephalometric relationships often present with a larger angle of
convexity like their Class 1 counterpart. This finding could be attributed to a more protrusive
maxilla in relation to the mandible, or retrognathic mandible in relation to a normally positioned
maxillary basal bone (Hedges, 1958). The most consistent cephalometric finding that
distinguishes a Class II division 2 malocclusion is the upright inclination of the maxillary central
incisors.
Eruption of permanent first molars is influenced by the relationship of the primary second
molars. Bishara et al. (1988) found that when the primary molar relationship is considered to be a
distal step, the permanent occlusion will result in a Class II malocclusion which will not self-
correct. In the cases where primary molars are in a flush terminal plane relationship, an estimated
44% of them will develop into a Class II malocclusion while the remaining 56% finish as a Class
I occlusion. Environmental factors such as the early loss of primary second molars can cause
mesial drifting of permanent teeth and contribute to a Class II malocclusion.
There is no single etiological factor contributing to development of a Class II
malocclusion (Smith, 1938). Class II cases with an increased overjet can present with the lower
lip resting between the maxillary and mandibular incisors or a tongue thrust between the anterior
dentition. These compensatory lip and tongue positions often occur during swallowing and can
exaggerate the malocclusion. Additionally, this persistent muscle activity can cause narrowing of
the palate, incisor protrusion, spacing and proclination over time (Samir E. Bishara et al., 1988).

20
These patients may also present with a hyperactive mentalis muscle, which can contribute to
lingual axial inclination of incisors, reduced vertical facial height and a lower lip curl. Added
factors including thumb or lip sucking, mouth breathing, or swallowing habits can all contribute
to a Class II profile (Smith, 1938).
Biomechanical Considerations in Anchorage Preparation
Orthodontic anchorage can be defined as the resistance to tooth movement (Burstone &
Choy, 2015), or more specifically by Cope (2005) as the “amount of allowed movement of the
reactive unit.” The method of anchorage employed by the practitioner is crucial in managing
space closure in extraction cases and producing successful treatment outcomes.
Biologic variables can influence anchorage values and vary greatly between individuals
and dentoalveolar sites. When force is applied to a tooth with a large root, the stress magnitude at
the surrounding periodontal ligament (PDL) will be less than the stress magnitude of the same
force applied to a smaller tooth (Burstone & Choy, 2015). Fewer osteoclasts will be attracted to
the area of compression stress of a larger tooth as the force is distributed over a greater surface
area, giving reason as to why a larger tooth, like a molar, can expect to have a greater anchorage
value than an incisor. Furthermore, inflammatory mediators that contribute to tooth movement
can vary between individuals. An individual with decreased vascularity will have limited
recruitment of biologic inflammatory mediators like prostaglandins, cytokines and growth
factors which can delay or reduce tooth movement. Rate of bone metabolism can be influenced
by age, nutritional deficiencies, function of the kidneys and thyroid, local pathologies, systemic
conditions, or drug consumption (Dudic, Giannopoulou, & Kiliaridis, 2013).

21
Among individuals, variations in bone morphology and turnover occur in the maxilla and
mandible and specific dentoalveolar sites (Burstone & Choy, 2015). Generally speaking, the
maxilla is comprised of thinner cortical plates and more porous bone, whereas the mandible has
thicker cortical plates and dense cancellous bone. Areas of decreased bone density present with a
decreased anchorage value; less bone removal is required of osteoclasts and tooth movement can
be accelerated at these sites. This anatomic variation allows teeth in the maxilla to be moved
with more ease than in the mandibular arch.
Marcotte (1990) classified three types of orthodontic anchorage: Type A, Type B and
Type C. Type A anchorage, also known as maximum anchorage, defines the anterior dentition as
the active unit and posterior dentition as reactive. In this anchorage system, the reactive unit
remains stationary while the anterior teeth are actively retracted. In Type B anchorage, both
anterior and posterior segments are active, resulting in reciprocal space closure toward the
midpoint between them. Type C anchorage is inverse of Type A anchorage; the posterior
segment is actively protracted while the anterior is reactive and remains stationary.
Numerous methods to achieve orthodontic anchorage have been developed throughout
history. The clinician must account for anchorage based on the amount and direction of desired
space closure. One of the simplest methods to increase anchorage during space closure is to
increase the number of teeth in that segment. If the second premolar and first molar are ligated as
an anchor unit, the anchorage ratio is roughly 1:1; resulting in reciprocal space closure (Burstone
& Choy, 2015). Theoretically, in reciprocal space closure, one can expect the space to be closed
with 50% anterior retraction and 50% posterior protraction (McLaughlin, Bennett, & Trevisi,
2001). In order to increase the anchorage value of the posterior, the second molar can be
included with the posterior segment, altering the ratio to nearly 1.6:1; resulting in more anterior

22
retraction and a decrease in anchorage loss from the posterior (Burstone & Choy, 2015). When
minimal anchorage is desired and a majority of the space is to be closed by protraction of the
posterior segments, it would be beneficial to extract a second premolar and refrain from bonding
the second molar during initial treatment (McLaughlin et al., 2001). This approach will result in
a greater anterior anchor unit, as the ratio competes two molars versus eight teeth positioned
anterior to the extraction space. Molar protraction can be aided with the use of elastic to apply a
continuous, light force to the tooth.
In cases where utilization of the extractions space is necessary to resolve crowding or
reduce excessive overjet, maximum anchorage may be required. In these scenarios it is important
to control mesial movement of the molar. Methods to control this includes the use of lab
fabricated appliances such as a trans-palatal arch (TPA), Nance appliance or a lower lingual
holding arch (LLHA). While a TPA can assist by de-rotating and up-righting molars, stabilizing
transverse arch dimensions, and maintaining space in mixed dentition, some studies suggest it
does not significantly maintain the anteroposterior position of the maxillary molar in cases of
anterior retraction (Zablocki, McNamara, Franchi, & Baccetti, 2008). In these scenarios,
alternative methods of anchorage should be applied. Extraoral traction using a headgear can be
employed as a method of skeletal or dental modification. Force applied to the headgear tube on a
molar band can result in either tipping or bodily movements dependent on the direction of force
relative to the center of resistance of that tooth. However, the use of headgear may prove
challenging as it relies solely on patient compliance. Studies suggest that in order for headgear to
produce desired outcomes, it must be worn continuously for 12 hours per day (Jacobson, 1979).
The use of temporary anchorage devices (TADs), also known as mini-implant, for
skeletal anchorage has become increasingly common in the practice of orthodontics. This

23
method provides “absolute anchorage” in cases where complete anchorage must be maintained.
The TAD can be incorporated using direct or indirect anchorage. Anchorage can be indirectly
reinforced by ligating a TPA from the molars to palatal TADs during anterior retraction. Leung
et al. (2008) found that in this indirect system, a small loss of anchorage ranging between 0.2mm
to 1.6mm occurs likely due to TPA deformation. Alternatively, anterior retraction using direct
anchorage can be applied at the bracket level to the TAD, or to vertical hooks attached directly to
the archwire. Vertical hooks apply force near the center of resistance of the tooth to produce
bodily movement of the segment. Everdi (2005) suggested that bodily movement during
retraction of the anterior segment results in more favorable tissue response than two-step
retraction which involves tipping teeth followed by them uprighting. The use of TADs is
beneficial as placement is quick and success with immediate loading has been proven (Chen,
Kyung, Zhao, & Yu, 2009). Success of their placement can be influenced by insertion technique,
design, bone quality and quantity. Marquezan (2014) determined that diameter of the TAD has
greater influence on primary stability than length, as well as placement in areas of increased
cortical bone thickness.
Stability Following Orthodontic Treatment
Long-term stability following orthodontic treatment can be influenced by various factors
including the severity of pre-treatment malocclusion, oral habits, muscular balance, periodontal
status and an increased lower inter-canine width post-treatment (Anuwongnukroh,
Dechkunakorn, kunakornporamut, & Tua-Ngam, 2017).
Numerous studies have been published regarding the effects of increased inter-canine
width on post-treatment stability. It has been noted that more relapse can be expected following

24
canine expansion (Anuwongnukroh et al., 2017); causing notable irregularities after retention.
When inter-canine width is reduced, greater stability can be expected with minimal relapse
(Canut & Arias, 1999).
In untreated patients, the inter-canine width can be expected to decrease with age
(Sinclair & Little, 1983). This change can be due to the constant constriction of perioral muscles
on the maxillary and mandibular arches. Similarly, in orthodontically treated patients, the inter-
canine measurement tends to decrease in width long-term; suggesting that there should be an
attempt to maintain initial arch dimensions and inter-canine width to support improved long-term
transverse stability after treatment (Anuwongnukroh et al., 2017).
Rotational relapse following orthodontic treatment is more prevalent in areas of light
contacts or incomplete correction of original rotations (Zachrisson, 1997). The clinician may
consider re-contouring small contacts between incisors while maintaining anatomic form to
produce larger areas of contact (Tuverson, 1980). The distal contact between mandibular lateral
incisors can also be positioned slightly facial to the mesial contact of mandibular canines to
reduce post-treatment relapse (Zachrisson, 1997).
De La Cruz et al. (1995) found that the greater the change to the initial arch form during
treatment, the greater post-retention change can be expected. Patient’s treated with rounded
maxillary arch forms tend to become more tapered following retention. Due to individual
variation, prefabricated arch forms cannot be expected to fit the dental arch of every patient and,
therefore, customization should be considered when preparing archwires (Felton, Sinclair, Jones,
& Alexander, 1987). While the practitioner may aim to maintain the pre-treatment arch forms,
the maxillary arch is often adapted for coordination with the mandibular arch (Zachrisson, 1997).

25
If the anterior dentition is too upright following deep bite correction, a greater tendency
for relapse back to a deep bite following treatment can be expected (Lewis, 1987). The final
position of the incisors and inter-incisal relationship plays an important role in post-treatment
stability in the vertical dimension.

26
Chapter 3: Results
In each sample group there were six variables measured: maxillary intermolar width,
mandibular intermolar width, maxillary intercanine width, mandibular intercanine width, overjet
and overbite. Patients were treated with either two maxillary premolar extractions (N=22), or
four premolar extractions (N=24). Two-tailed paired T-tests were performed to determine if there
was a significant difference between variables pre-treatment, post-treatment and from virtual
setup with a significance level of P < 0.05. See Appendix C for complete statistical analysis
results.
GROUP 1
Paired Samples Statistics
Two Premolar Extractions Mean Std. Deviation Std. Error
Mean Pair 1 Treatment Mx Intermolar 44.2755 1.96555 0.41906
Setup Mx Intermolar 44.9545 1.93876 0.41334 Pair 2 Treatment Md Intermolar 43.3268 1.85364 0.39520
Setup Md Intermolar 43.3682 1.94383 0.41443 Pair 3 Treatment Mx Intercanine* 35.6773 1.76275 0.37582
Setup Mx Intercanine* 36.4818 1.55491 0.33151 Pair 4 Treatment Md Intercanine* 27.2659 0.93809 0.20000
Setup Md Intercanine* 28.1864 1.31413 0.28017 Pair 5 Tx Overjet 2.8164 1.03122 0.21986
Setup Overjet 2.4182 0.38992 0.08313 Pair 6 Treatment Overbite* 1.2109 0.86350 0.18410
Setup Overbite* 1.8864 0.66996 0.14284 Asterisk (*) indicates statistically significant P value
Table 1. Paired sample statistics of treatment and setup groups with two premolar extractions
This sample compared 22 patients treated with two maxillary premolar extractions.
Paired sample T-tests showed significant difference (P<.05) between maxillary intercanine width
(p=0.026), mandibular intercanine width (p=0.006), and overbite (p=0.014) between uLab virtual

27
setup and treatment groups. There was no significant difference in maxillary intermolar width
(p=0.078), mandibular intermolar width (p=0.922) or overjet (p=0.146) among the samples.
GROUP 2
Paired Samples Statistics
Four Premolar Extractions Mean Std. Deviation Std. Error
Mean Pair 1 Treatment Mx Intermolar* 45.8454 3.07397 0.62747
Setup Mx Intermolar* 46.9833 3.25625 0.66468 Pair 2 Treatment Md Intermolar 40.6683 2.36435 0.48262
Setup Md Intermolar 41.0500 2.92486 0.59703 Pair 3 Treatment Mx Intercanine* 35.9683 2.20478 0.45005
Setup Mx Intercanine* 37.9542 2.39691 0.48927 Pair 4 Treatment Md Intercanine* 27.8263 1.54234 0.31483
Setup Md Intercanine* 29.5542 2.00564 0.40940 Pair 5 Tx Overjet* 3.1100 0.65078 0.13284
Setup Overjet* 2.3583 0.46989 0.09592 Pair 6 Tx Overbite 1.5250 0.64900 0.13248
Setup Overbite 1.7667 0.65519 0.13374 Asterisk (*) indicates statistically significant P value
Table 2. Paired sample statistics of treatment and setup groups with four premolar extractions
This sample included 24 patients treated with four premolar extractions. Paired sample t-
tests showed significant difference between maxillary intermolar width (p=0.297), maxillary
intercanine width (p=0.000), mandibular intercanine width (p=0.000), and overjet (p=0.000)
between treatment and virtual setup groups. There was no significant difference between
mandibular intermolar width (p=0.297) or overbite (p=0.110) among the groups.

28
GROUP 3
Paired Samples Statistics
Two Premolar Extractions Mean Std. Deviation Std. Error
Mean Pair 1 Pre-treatment Mx Intermolar* 45.8500 2.76849 0.59024
Setup Mx Intermolar* 44.9545 1.93876 0.41334 Pair 2 Pre-treatment Md Intermolar* 41.9727 2.41822 0.51557
Setup Md Intermolar* 43.3682 1.94383 0.41443 Pair 3 Pre-treatment Mx Intercanine* 34.6818 2.58395 0.55090
Setup Mx Intercanine* 36.4818 1.55491 0.33151 Pair 4 Pre-treatment Md Intercanine* 26.9045 2.14908 0.45819
Setup Md Intercanine* 28.1864 1.31413 0.28017 Pair 5 Pre-treatment Overjet* 6.0000 2.75145 0.58661
Setup Overjet* 2.4182 0.38992 0.08313 Pair 6 Pre-treatment Overbite* 2.8727 1.66538 0.35506
Setup Overbite* 1.8864 0.66996 0.14284
Four Premolar Extractions
Pair 7 Pre-treatment Mx Intermolar* 47.4875 3.38761 0.69149 Setup Mx Intermolar* 46.9833 3.25625 0.66468
Pair 8 Pre-treatment Md Intermolar* 43.1625 3.00634 0.61367 Setup Md Intermolar* 41.0500 2.92486 0.59703
Pair 9 Pre-treatment Mx Intercanine* 35.7583 3.13409 0.63974 Setup Mx Intercanine* 37.9542 2.39691 0.48927
Pair 10 Pre-treatment Md Intercanine* 27.4250 2.63756 0.53839 Setup Md Intercanine* 29.5542 2.00564 0.40940
Pair 11 Pre-treatment Overjet* 4.4667 1.54488 0.31535 Setup Overjet* 2.3583 0.46989 0.09592
Pair 12 Pre-treatment Overbite 1.3417 1.69908 0.34682 Setup Overbite 1.7667 0.65519 0.13374
Asterisk (*) indicates statistically significant P value Table 3. Paired sample statistics of pre-treatment and setup groups
When comparing pre-treatment measurements to virtual setups for two premolar
extractions (N=22), paired sample T-tests showed significant difference for all variables

29
measured. In the four premolar extraction group (N=24), pre-treatment measurements compared
to setup showed significant difference for all variables except for overbite (p=0.139).
Paired Samples Statistics
Two Premolar Extractions Mean Std. Deviation Std. Error
Mean Pair 1 Pre-treatment Mx Intermolar* 45.8500 2.76849 0.59024
Treatment Mx Intermolar* 44.2755 1.96555 0.41906 Pair 2 Pre-treatment Md Intermolar* 41.9727 2.41822 0.51557
Treatment Md Intermolar* 43.3268 1.85364 0.39520 Pair 3 Pre-treatment Mx Intercanine* 34.6818 2.58395 0.55090
Treatment Mx Intercanine* 35.6773 1.76275 0.37582 Pair 4 Pre-treatment Md Intercanine 26.9045 2.14908 0.45819
Treatment Md Intercanine 27.2659 0.93809 0.20000 Pair 5 Pre-treatment Overjet* 6.0000 2.75145 0.58661
Treatment Overjet* 2.8164 1.03122 0.21986 Pair 6 Pre-treatment Overbite* 2.8727 1.66538 0.35506
Treatment Overbite* 1.2109 0.86350 0.18410
Four Premolar Extractions
Pair 7 Pre-treatment Mx Intermolar* 47.4875 3.38761 0.69149 Treatment Mx Intermolar* 45.8454 3.07397 0.62747
Pair 8 Pre-treatment Md Intermolar* 43.1625 3.00634 0.61367 Treatment Md Intermolar* 40.6683 2.36435 0.48262
Pair 9 Pre-treatment Mx Intercanine 35.7583 3.13409 0.63974 Treatment Mx Intercanine 35.9683 2.20478 0.45005
Pair 10 Pre-treatment Md Intercanine 27.4250 2.63756 0.53839 Treatment Md Intercanine 27.8263 1.54234 0.31483
Pair 11 Pre-treatment Overjet* 4.4667 1.54488 0.31535 Treatment Overjet* 3.1100 0.65078 0.13284
Pair 12 Pre-treatment Overbite 1.3417 1.69908 0.34682 Treatment Overbite 1.5250 0.64900 0.13248
Asterisk (*) indicates statistically significant P value Table 4. Paired sample statistics of pre-treatment and treatment groups

30
There was no significant difference between mandibular intercanine width between pre-
treatment and post-treatment groups treated with two maxillary premolar extractions. There was
a significant difference between maxillary intermolar width (p=0.000), mandibular intermolar
width (p=0.008), maxillary intercanine width (p=0.043), overjet (p=0.000) and overbite
(p=0.000).
There was no significant difference between maxillary intercanine width, mandibular
intercanine width and overbite between pre-treatment and post-treatment groups treated with
four premolar extractions. There was a significant difference between pre- and post-treatment in
maxillary intermolar width (p=0.000), mandibular intermolar width (p=0.000), and overjet
(p=0.000) treated with four extractions.

31
Intra-observer Error Rate
Intraclass Correlation Coefficient (ICC) estimates and their 95% confidence interval were
calculated using SPSS statistical package version 24 (SPSS Inc, Chicago IL) based on absolute-
agreement, 2-way mixed-effects model. An ICC value less than 0.5 indicates poor reliability,
0.5-0.75 indicates moderate, 0.75-0.9 indicates good, and lastly, greater than 0.9 indicates
excellent reliability. ICC calculations revealed excellent reliability among measurements, which
establishes reliable repeatability of measurements with a single examiner.
ICC
Maxillary Intermolar 0.987
Maxillary Intercanine 0.979
Mandibular Intermolar 0.989
Mandibular Intercanine 0.948
Overjet 0.976
Overbite 0.985
Table 5. Intra-observer reliability with Intraclass Correlation Coefficient (n=40)

32
Chapter 4: Discussion
This study aimed to determine whether there were significant differences between virtual
treatment simulations and actual treatment outcomes in Class II malocclusions treated with two
or four premolar extractions. Further comparison to pre-treatment dimensions were carried out to
determine whether there were significant changes, and potential implications on long-term
stability.
Treatment plans involving maxillary premolar extractions are generally selected to relieve
crowding in that arch or to reduce excessive overjet, with little to no change to the mandibular
arch. Within this study, overjet decreased in 20 of the 22 patients from pre- to post-treatment.
The two patients which did not have a decrease from pre-treatment values were likely treated
with extractions due to crowding in the maxillary arch. Similarly, of the 24 patients treated with
four premolar extractions, overjet decreased in all but three patients. There was no significant
difference in overjet between treatment outcomes and virtual simulations treated with two
extractions; suggesting that actual treatment and simulated projections produced similar results.
Deepening of the bite is a common characteristic observed in extraction cases. Uprighting
and relative extrusion of the maxillary anterior dentition can contribute to this when being
retracted to reduce overjet. In patients treated with two premolar extractions, we found a
statistically significant difference in overbite between both pre-treatment versus post-treatment
results and pre-treatment results versus virtual simulation. The data showed that from initial pre-
treatment values, overbite increased more post-treatment, while with virtual simulation, the
average change in overbite decreased. This suggests virtual simulation may have produced
superior results in preventing bite deepening from their initial values. In patients with deep bites

33
pre-treatment, mechanics such as segmented archwires can be applied to prevent further bite
deepening during retraction.
Pre- and post-treatment evaluation of patients treated with two premolar extractions found a
statistically significant difference between maxillary intercanine width, with a mean difference of
-0.99mm. This suggests that throughout the course of treatment, there was a tendency to expand
the maxillary intercanine width about 1mm from its initial parameters. In a study evaluating
dental arch changes post-retention in Class II division 1 malocclusions treated with extractions,
Anuwongnukroh et al. (2017) found that intercanine width increased significantly in both the
maxillary and mandibular arches following treatment. This increase in intercanine width post-
extraction can be attributed to the distalization of the canines into a wider area of the archform.
Alternatively, intermolar width can be expected to decrease after treatment, as the molars move
anteriorly into the extraction spaces occupying a narrower area of the archform (Shapiro, 1974).
Of the patients in this study treated with four premolar extractions, there was an average decrease
in intermolar width between pre- and post-treatment in both the maxillary and mandibular
arches. Therefore, the intercanine and intermolar width changes observed were consistent with
findings presented in the literature.
Evaluation of virtual simulation and treatment outcomes found statistically significant
differences in maxillary and mandibular intercanine widths in patients treated with two or four
premolar extractions. The mean difference in intercanine width among these groups suggests that
the virtual simulation expanded the canine width more than the actual treatment outcome in both
arches.
Comparison of pre-treatment dimensions to the virtual simulation found statistically
significant differences in maxillary and mandibular intercanine width in patients treated with two

34
and four premolar extractions. We found that there was a greater tendency to expand intercanine
width using 3D-software than during actual treatment, with an average increase of between 1.2-
2.1mm from pre-treatment dimensions. The general trend of expanding intercanine width may be
viewed as a potential weakness of virtual treatment simulation. However, a potential benefit of
this retrospective study design is that it offers the primary operator an opportunity to learn trends
and weaknesses of their treatment simulations which can then be applied to future patients.
A number of investigators have evaluated the effects of intercanine and intermolar width
changes following a post-retention phase. Shapiro et al. (1974) found that increased mandibular
intercanine width showed a strong tendency to return to pre-treatment dimensions at 10 years
post-retention. It has been suggested that Class II division 2 malocclusions show greater post-
treatment stability with intercanine expansion than their Class I and Class II division 1
counterparts. Similarly, a study by Motamedi (2015) found that an increase in intercanine width
was not maintained post-treatment. From this, we can conclude that intercanine expansion in
Class II division 1 malocclusions is not stable long-term. For patients in this study with increased
intercanine dimensions post-treatment, either prolonged or permanent retention may be indicated
to prevent unwanted relapse. Changes in intermolar dimensions did not present as much concern,
as a decrease in intermolar width has been found to remain following a post-retention period
(Motamedi et al., 2015).
The development of the Visualized Treatment Objective (VTO) by McLaughlin and Bennett
(1999) in 1971 has assisted clinicians in organizing and simplifying treatment planning for years.
Dental VTO analysis aids in diagnosis and treatment planning decisions by allowing the clinician
to visualize and quantify the degree and direction of movement required for desired correction. It
also can help determine whether such movements are reasonable within the confines of patient

35
anatomy. The clinician records detailed information such as midline relationships, initial and
desired canine and molar relationships, the degree of spacing or crowding and the curve of spee.
This simple analysis aids in treatment planning by creating a summary of anticipated treatment
changes required to achieve a desired outcome and inter-arch relationships. Important treatment
decisions including whether to extract or not extract can be evaluated, as well as whether
correction can be achieved with orthopedic tooth movement alone or if surgical intervention is
indicated. Despite its great contribution to treatment planning, the VTO is not without
limitations. This analysis uses 2-dimensional calculations to predict movement of 3-dimensional
structures. The dental VTO does not consider individual variability including the size or
angulation of the dentition, overjet and overbite.
The technique of using digital software demonstrated in this study produces a 3D simulation
of potential treatment outcomes. Much like a VTO analysis, digital software can quantify desired
tooth movement. These calculations incorporate features not included in the VTO such as
overjet, overbite and angulation changes of the dentition. This ability to directly visualize the
type, degree and direction of desired tooth movement using virtual simulations can aid in
treatment decisions.

36
Limitations and Future Studies
Several limitations should be noted as patients in this study were collected from the
database of a university residency program and therefore treated by various providers. Many
differing biomechanical approaches were used in the treatment of these patients, all of which can
influence final treatment outcomes. The sample was also limited by the amount of information
available as many patient files did not include important and relevant data like diagnostic aids or
pre-treatment STL files and therefore could not be included.
This study may be repeated in the future with a larger sample size in both two and four
premolar extraction groups. Furthermore, a prospective study could be designed using virtual
setups as a goal for treatment results. Post-treatment outcomes can be compared to virtual setups
to determine whether there is a statistically significant difference in variables when simulations
are used to guide treatment. Future studies may also compare the results of VTO analyses to
virtual setups to determine whether suggested degree and direction of prescribed tooth
movements coincide.
Conclusions
Digital models of 48 Class II division 1 malocclusion patients treated with two and four
premolar extractions were selected. Pre-treatment, post-treatment and virtual treatment
simulations were measured for intercanine width, intermolar width, overjet and overbite. The
purpose was to observe whether there were statistically significant changes among these
variables. The following conclusions can be made based on the findings in this study:
1. Despite statistically significant differences between treatment outcomes and virtual
setups in variables including overbite and overjet, the difference between them was not
clinically significant.

37
2. Statistically significant differences in both the maxillary and mandibular intercanine
widths between digital setups and treatment outcomes suggests that with software
simulations, the clinician tends to over-expand the intercanine width.
3. Virtual setups showed a tendency to expand intercanine dimensions more than the actual
treatment outcomes when comparing to the initial pre-treatment dimensions.
4. This study supports the use of virtual setups for the purpose of guiding treatment and
visualizing potential outcomes.

38
Appendix A: Data Results
GROUP 1: TWO EXTRACTIONS MAXILLARY INTERMOLAR
MEASUREMENTS
MANDIBULAR INTERMOLAR MEASUREMENTS
PRE-TX TREATMENT SETUP PRE-TX TREATMENT SETUP 45.2 43.48 45.6 39.5 42.04 41.9
43.5 44.63 44.2 40.2 41.49 41.4 49.4 47.53 47.5 43.1 42.73 43.4 47.6 44.24 46.8 45.1 44.38 47.6 45.7 45.43 43.4 45 43.75 44.4 43.1 41.57 43.6 40.7 42.27 43.3 49.1 44.51 46.7 44.1 42.6 45.9 40.8 41.73 42.4 38.2 43.11 43.1 41.3 41.13 43.4 39.1 39.26 41.2 49.9 47.23 47.9 45.6 46.73 46.6 45.4 45.03 46 42.7 40.11 44.1 46.5 43.92 45.3 41.7 42.47 42.6 44.4 43.4 43.7 41.2 42.3 41.8 48.1 44.24 46 44 44.62 45.4 44.4 44.81 42.8 39.6 42.73 40.6 48.8 45.36 45.4 46.7 46.32 45.5 42.7 41.71 42 38.1 44.9 40.4 48.6 47.21 44.2 42.3 45.68 43.1 47.5 45.68 46.2 42 43.56 42.3 48.9 46.02 49.2 42.7 44.88 44.3 45.1 44.5 42.9 41.3 44.6 43.2 42.7 40.7 43.8 40.5 42.66 42
MAXILLARY INTERCANINE MANDIBULAR INTERCANINE
PRE-TX TREATMENT SETUP PRE-TX TREATMENT SETUP 37.3 34.92 37.4 26.4 26.67 26.7 32.4 35.82 36.1 29.1 27.14 30.3 32.9 37.69 36.4 29 27.41 29.2 33.2 36.11 37.8 27.7 27.32 30.8 30.6 33.53 33.4 25.5 27.32 26.1 38.5 37.42 37.3 24.9 27.84 27.6 34.8 34.75 36.8 26.2 26.49 27.5 33.5 34.94 36.9 28.7 28.62 28.2

39
34.8 34.86 35.7
23.3 25.5 28.3 36.6 37.95 38.8 28.4 27.62 29.2
37 36.91 39 27.8 28.89 28.3 35 34.48 36.8 26.4 27.55 28.6
34.6 34.21 35.1 26.4 26.55 27.5 30.5 36.12 35 22.3 27.88 26.4
33 36.17 35.9 26.6 26.87 28.1 34.6 33.92 36 28.3 26.55 27.8 34.8 34.07 34.8 25.8 25.53 28.3 36.2 38.19 36.4 27.1 28.22 27.8 38.9 37.44 39.5 30.4 28.71 30 39.1 37.45 38 30.1 27.66 29.7 34.6 36.8 34.4 28.1 27.5 27.9 30.1 31.15 35.1 23.4 26.01 25.8
OVERJET OVERBITE
PRE-TX TREATMENT SETUP PRE-TX TREATMENT SETUP 5.6 2.8 2.8 3.3 0.1 1.9 12 3.6 2.3 5 0.8 4 3.1 4.13 2.4 3.1 1.21 2.4
13.5 4.6 2.5 4 2.3 1 7.3 3 2 -0.7 1.6 1.8
5 2 3.1 2.5 1.1 2.2 9 2.7 2.1 3.2 1.4 2.3
4.2 2.4 2.4 3.5 0.1 2.4 1.9 2 1.7 0.8 1.5 1 7.2 3.5 2.8 0.8 1.8 2
7 3.7 2 4.4 2.1 1.5 4.7 2.8 2.3 4 0.8 1.7 6.2 1.5 2.4 5.6 0.5 1.4
3 1.7 2.6 1.9 0.6 1.5 6.1 5.1 1.6 0.6 1 1.6 5.2 2.32 2.4 1.3 0.75 2.4 5.4 3 2.2 3.8 1 1.1 5.7 3.1 2.4 3.8 0.8 2.4 5.7 2.4 3 2.2 0.9 1.4 4.6 2.8 2.6 1.3 0.4 1.4 2.9 0.6 2.7 3.6 1.9 2.4 6.7 2.21 2.9 5.2 3.98 1.7

40
GROUP 2: FOUR EXTRACTIONS MAXILLARY INTERMOLAR
MEASUREMENTS
MANDIBULAR INTERMOLAR MEASUREMENTS
PRE-TX TREATMENT SETUP PRE-TX TREATMENT SETUP 46.5 43.63 46.8 40.5 37.98 41.5 48.7 45.6 49.6 44.2 41.54 42 50.2 49.03 51.1 46.4 43.19 44.6 45.8 44.23 45.5 40.9 40.1 40 52.1 49.64 50.9 44.3 42.38 43.9 45.5 46.16 46.2 41.9 41.46 41.1 50.8 47.94 49.7 43.6 42.2 44.1 44.8 42.7 44.1 40.2 37.71 37.6 46.6 44.49 46.4 43.6 39.8 41.3 47.9 48.37 49.7 47.2 41.07 42.2 47.8 45.13 45.9 41.9 39.62 40.3 50.4 49.43 50.5 45.9 43.81 44.5
51 48.58 49.5 46.2 41.81 44.1 50.9 46.41 47.9 44 40 41.2 41.9 40.14 41 38.7 36.55 36.3 50.9 51.5 51.6 48 44.78 47 42.6 41.52 42.1 40.5 38.11 37.3 41.1 40.82 40.9 38.5 37 37.1 48.9 45.61 48 45 40.84 40.6 51.8 49.41 48.7 46.4 41.81 42.9 42.4 42.93 42.3 38 39.38 36.3 43.5 42.96 43.5 39.7 38.84 37.1 49.5 47.57 48.2 46.6 45.7 41 48.1 46.49 47.5 43.7 40.36 41.2
MAXILLARY INTERCANINE MANDIBULAR INTERCANINE
PRE-TX TREATMENT SETUP PRE-TX TREATMENT SETUP 36.2 35.72 38.2 27.6 28.69 29.9 30.7 34.8 34.9 24.4 26.27 26.6 36.9 37.53 39.6 26.8 29.2 30.5 34.2 35.8 36.1 25 27.09 28.9 38.4 36.79 40.2 25.4 28.42 30 37.2 37.39 40.1 30.1 28.56 29.9 38.7 39.4 41.1 30.7 30.18 31.8 33.3 35.23 36.6 25.4 27.64 28.9 37.2 36.31 38 27 27.69 29.5 38.1 36.46 38.8 30.9 28.32 29.8

41
39.8 37.34 39.5
28.9 29.45 30.7 41 40.03 41.6 29.1 30.91 34.2
37.1 37.05 39.4 28.7 28.51 31.1 37.3 35.23 37.6 25.9 27.98 29.3 32.8 31.92 34.6 22.5 24.85 26.9
39 37.98 41.3 33.8 28.63 32.7 30.2 30.84 32.7 25.3 24.96 25.5 28.5 31.39 33.7 23.5 25.55 26.3 35.7 36.32 39.9 29.7 28.61 31 35.9 36.46 38.7 28.2 27.08 28.9
37 36.23 36.2 25.8 26.67 27.5 34.9 35.35 37.4 27.5 27.58 29.4 32.3 37.23 37.3 26.7 28.92 29.9 35.8 34.44 37.4 29.3 26.07 30.1
OVERJET OVERBITE
PRE-TX TREATMENT SETUP PRE-TX TREATMENT SETUP 5.5 3.1 2.2 2.6 0.3 1.6
4 2.68 2.1 0.6 1.49 1.1 5.1 3.8 3.4 3.2 1.8 2.6 3.9 4 2.9 2.4 1.5 2.1 4.4 3.3 2.6 1.8 2.9 2.1 5.7 2.68 2.9 1 1.19 1.9 3.8 3.2 2.4 1.1 1.4 1.7 3.5 2.4 1.6 1.6 2 1.5 3.3 3.2 2.1 0 0.8 1 1.9 2.5 2 0.2 0.8 1 5.4 3.8 2.2 2.2 2.1 1.9 6.7 4 2.2 2 2.1 1.6 1.7 2.7 1.7 -0.3 0.7 1 3.2 2.4 1.9 3.2 2.6 2 2.5 2.1 3 0 0.7 1 3.9 3.3 1.6 -3.4 1.4 0.7 5.3 3.08 2.1 3.3 1.42 1.4 4.7 2.6 2.3 2.9 1.3 3.4 7.3 3.1 2.4 2.3 1.6 2 3.8 2.9 2.9 0.2 2 2.5 4.3 3.3 2.7 4.3 2.1 2.8 7.8 2.7 2.2 -1.3 1.4 1.4 3.7 5 2.3 1.5 2.2 1.9 5.8 2.8 2.9 0.8 0.8 2.2
42
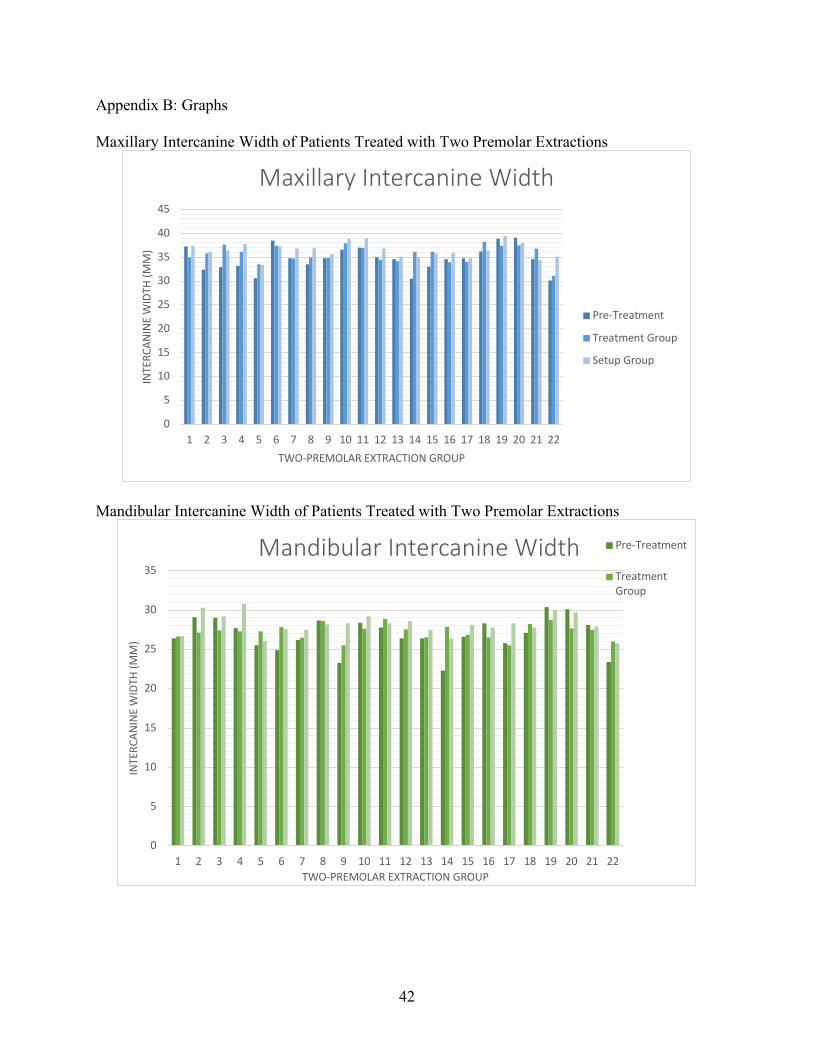
Appendix B: Graphs Maxillary Intercanine Width of Patients Treated with Two Premolar Extractions
Mandibular Intercanine Width of Patients Treated with Two Premolar Extractions
0
5
10
15
20
25
30
35
40
45
1 2 3 4 5 6 7 8 9 10 11 12 13 14 15 16 17 18 19 20 21 22
INTE
RCAN
INE
WID
TH (M
M)
TWO-PREMOLAR EXTRACTION GROUP
Maxillary Intercanine Width
Pre-Treatment
Treatment Group
Setup Group
0
5
10
15
20
25
30
35
1 2 3 4 5 6 7 8 9 10 11 12 13 14 15 16 17 18 19 20 21 22
INTE
RCAN
INE
WID
TH (M
M)
TWO-PREMOLAR EXTRACTION GROUP
Mandibular Intercanine Width Pre-Treatment
TreatmentGroup

43
Appendix C: Statistical Analysis Tables ANALYSIS OF TREATMENT AND SETUP GROUPS TREATED WITH TWO PREMOLAR EXTRACTIONS Paired T-Test
Paired Differences
Mean Std.
Deviation Std. Error
Mean
95% Confidence Interval of the
Difference Lower Upper
Pair 1
TX Mx Intermolar – SU Mx Intermolar
-0.67909
1.71753 0.36618 -1.44060 0.08242
Pair 2
Tx Mn Intermolar – SU Mn Intermolar
-0.04136
1.95414 0.41662 -0.90778 0.82505
Pair 3
TX Mx Canine – SU Mx Canine
-0.80455
1.57138 0.33502 -1.50126 -0.10783
Pair 4
TX Mn Canine – SU Mn Canine
-0.92045
1.40134 0.29877 -1.54177 -0.29914
Pair 5
TX Overjet – SU Overjet
0.39818 1.23803 0.26395 -0.15073 0.94710
Pair 6
TX Overbite – SU Overbite
-0.67545
1.18180 0.25196 -1.19944 -0.15147
t df Sig. (2-tailed) -1.855 21 0.078
-0.099 21 0.922
-2.401 21 0.026
-3.081 21 0.006
1.509 21 0.146 -2.681 21 0.014

44
ANALYSIS OF TREATMENT AND SETUP GROUPS TREATED WITH FOUR PREMOLAR EXTRACTIONS Paired T-Test
Paired Differences
Mean Std.
Deviation Std. Error
Mean
95% Confidence Interval of the Difference
Lower Upper Pair 1
TX Mx Intermolar – SU Mx Intermolar
-1.13792
1.08653 0.22179 -1.59672 -0.67912
Pair 2
Tx Mn Intermolar – SU Mn Intermolar
-0.38167
1.75112 0.35745 -1.12110 0.35777
Pair 3
TX Mx Canine – SU Mx Canine
-1.98583
1.02226 0.20867 -2.41750 -1.55417
Pair 4
TX Mn Canine – SU Mn Canine
-1.72792
0.96771 0.19753 -2.13654 -1.31929
Pair 5
TX Overjet – SU Overjet
0.75167 0.73529 0.15009 0.44118 1.06215
Pair 6
TX Overbite – SU Overbite
-0.24167
0.71277 0.14549 -0.54264 0.05931
t df Sig. (2-tailed) -5.131 23 0.000
-1.068 23 0.297
-9.517 23 0.000
-8.747 23 0.000
5.008 23 0.000
-1.661 23 0.110

45
ANALYSIS OF PRE-TREATMENT AND SETUP GROUPS TREATED WITH TWO AND FOUR PREMOLAR EXTRACTIONS Paired T-Test
Two Premolar Extractions
Paired Differences
Mean Std.
Deviation Std. Error
Mean
95% Confidence Interval of the
Difference Lower Upper
Pair 1
Pre Mx Intermolar – SU Mx Intermolar*
0.89545 1.66232 0.35441 0.15842 1.63249
Pair 2
Pre Mn Intermolar – SU Mn Intermolar*
-1.39545
1.24307 0.26502 -1.94660 -0.84431
Pair 3
Pre Mx Canine - SU Mx Canine*
-1.80000
1.83977 0.39224 -2.61571 -0.98429
Pair 4
Pre Mn Canine – SU Mn Canine*
-1.28182
1.52335 0.32478 -1.95724 -0.60640
Pair 5
Pre Overjet – SU Overjet*
3.58182 2.79006 0.59484 2.34478 4.81886
Pair 6
Pre Overbite – SU Overbite*
0.98636 1.66456 0.35489 0.24834 1.72439
Four Premolar Extractions
Pair 7
Pre Mx Intermolar – SU Mx Intermolar*
0.50417 1.17120 0.23907 0.00961 0.99872
Pair 8
Pre Mn Intermolar – SU Mn Intermolar*
2.11250 1.55320 0.31705 1.45664 2.76836
Pair 9
Pre Mx Canine - SU Mx Canine*
-2.19583
1.52984 0.31228 -2.84183 -1.54984
Pair 10
Pre Mn Canine – SU Mn Canine*
-2.12917
1.70587 0.34821 -2.84949 -1.40884
Pair 11
Pre Overjet – SU Overjet*
2.10833 1.51282 0.30880 1.46953 2.74714
Pair 12
Pre Overbite – SU Overbite
-0.42500
1.35719 0.27703 -0.99809 0.14809

46
t df
Sig. (2-
tailed) 2.527 21 0.020
-5.265
21 0.000
-4.589
21 0.000
-3.947
21 0.001
6.021 21 0.000 2.779 21 0.011
2.109 23 0.046
6.663 23 0.000
-7.032
23 0.000
-6.115
23 0.000
6.827 23 0.000 -
1.534 23 0.139
ANALYSIS OF PRE-TREATMENT AND POST-TREATMENT GROUPS TREATED WITH TWO AND FOUR PREMOLAR EXTRACTIONS Paired T-Test
Two Premolar Extractions
Paired Differences
Mean Std.
Deviation Std. Error
Mean
95% Confidence Interval of the
Difference Lower Upper
Pair 1
Pre Mx Intermolar – TX Mx Intermolar*
1.57455 1.53619 0.32752 0.89344 2.25566
Pair 2
Pre Mn Intermolar – TX Mn Intermolar*
-1.35409
2.17522 0.46376 -2.31853 -0.38965
Pair 3
Pre Mx Canine - TX Mx Canine*
-0.99545
2.16511 0.46160 -1.95541 -0.03550

47
Pair 4
Pre Mn Canine – TX Mn Canine
-0.36136
1.89389 0.40378 -1.20107 0.47834
Pair 5
Pre Overjet – TX Overjet*
3.18364 2.38531 0.50855 2.12605 4.24122
Pair 6
Pre Overbite – TX Overbite*
1.66182 1.75305 0.37375 0.88456 2.43908
Four Premolar Extractions
Pair 7
Pre Mx Intermolar – TX Mx Intermolar*
1.64208 1.36621 0.27888 1.06518 2.21898
Pair 8
Pre Mn Intermolar – TX Mn Intermolar*
2.49417 1.61382 0.32942 1.81271 3.17562
Pair 9
Pre Mx Canine - TX Mx Canine
-0.21000
1.85059 0.37775 -0.99144 0.57144
Pair 10
Pre Mn Canine – TX Mn Canine
-0.40125
2.06355 0.42122 -1.27261 0.47011
Pair 11
Pre Overjet – TX Overjet*
1.35667 1.54354 0.31507 0.70489 2.00845
Pair 12
Pre Overbite – TX Overbite
-0.18333
1.58657 0.32386 -0.85328 0.48662

48
t df
Sig. (2-
tailed) 4.808 21 0.000
-2.920
21 0.008
-2.157
21 0.043
-0.895
21 0.381
6.260 21 0.000 4.446 21 0.000
5.888 23 0.000 7.571 23 0.000
-0.556
23 0.584
-0.953
23 0.351
4.306 23 0.000 -
0.566 23 0.577

49
Appendix D: Reliability Studies Bland Altman Plot of Maxillary Intermolar Measurements
Intraclass Correlation Coefficient of Maxillary Intermolar Measurements
Reliability Statistics Cronbach's
Alpha N of Items .997 2
Intraclass Correlation Coefficient of Maxillary Intercanine Measurements
Reliability Statistics Cronbach's
Alpha N of Items .989 2
-0.4
-0.2
0
0.2
0.4
0.6
0.8
1
Diffe
renc
e be
twee
n m
easu
rem
ents
Mean of measurements
Bland Altman Plot of Maxillary Intermolar Width

50
Intraclass Correlation Coefficient of Mandibular Intermolar Measurements
Reliability Statistics Cronbach's
Alpha N of Items .994 2
Intraclass Correlation Coefficient
Intraclass 95% Confidence Interval F Test with True Value 0
Intraclass Correlation Coefficient
Intraclass
Correlationb
95% Confidence Interval F Test with True Value 0 Lower Bound
Upper Bound Value df1 df2 Sig
Single Measures
.979a .961 .989 95.178 39 39 .000
Average Measures
.989c .980 .994 95.178 39 39 .000
Two-way mixed effects model where people effects are random and measures effects are fixed. a. The estimator is the same, whether the interaction effect is present or not. b. Type A intraclass correlation coefficients using an absolute agreement definition. c. This estimate is computed assuming the interaction effect is absent, because it is not estimable otherwise.
Intraclass Correlation Coefficient
Intraclass
Correlationb
95% Confidence Interval F Test with True Value 0
Lower Bound
Upper Bound Value df1 df2 Sig
Single Measures
.987a .833 .996 338.668 39 39 .000
Average Measures
.993c .909 .998 338.668 39 39 .000
Two-way mixed effects model where people effects are random and measures effects are fixed. a. The estimator is the same, whether the interaction effect is present or not. b. Type A intraclass correlation coefficients using an absolute agreement definition. c. This estimate is computed assuming the interaction effect is absent, because it is not estimable otherwise.

51
Correlationb Lower Bound
Upper Bound Value df1 df2 Sig
Single Measures
.989a .979 .994 172.866 39 39 .000
Average Measures
.994c .989 .997 172.866 39 39 .000
Two-way mixed effects model where people effects are random and measures effects are fixed. a. The estimator is the same, whether the interaction effect is present or not. b. Type A intraclass correlation coefficients using an absolute agreement definition. c. This estimate is computed assuming the interaction effect is absent, because it is not estimable otherwise.
Intraclass Correlation Coefficient of Mandibular Intercanine Measurements
Reliability Statistics Cronbach's
Alpha N of Items .973 2
Intraclass Correlation Coefficient
Intraclass
Correlationb
95% Confidence Interval F Test with True Value 0
Lower Bound
Upper Bound Value df1 df2 Sig
Single Measures
.948a .905 .972 36.919 39 39 .000
Average Measures
.974c .950 .986 36.919 39 39 .000
Two-way mixed effects model where people effects are random and measures effects are fixed. a. The estimator is the same, whether the interaction effect is present or not. b. Type A intraclass correlation coefficients using an absolute agreement definition. c. This estimate is computed assuming the interaction effect is absent, because it is not estimable otherwise.
Intraclass Correlation Coefficient of Overjet Measurements

52
Reliability Statistics Cronbach's
Alpha N of Items .987 2
Intraclass Correlation Coefficient
Intraclass
Correlationb
95% Confidence Interval F Test with True Value 0
Lower Bound
Upper Bound Value df1 df2 Sig
Single Measures
.976a .954 .987 79.165 39 39 .000
Average Measures
.988c .977 .993 79.165 39 39 .000
Two-way mixed effects model where people effects are random and measures effects are fixed. a. The estimator is the same, whether the interaction effect is present or not. b. Type A intraclass correlation coefficients using an absolute agreement definition. c. This estimate is computed assuming the interaction effect is absent, because it is not estimable otherwise.
Intraclass Correlation Coefficient of Overbite Measurements
Reliability Statistics Cronbach's
Alpha N of Items .992 2
Intraclass Correlation Coefficient
Intraclass
Correlationb
95% Confidence Interval F Test with True Value 0
Lower Bound
Upper Bound Value df1 df2 Sig
Single Measures
.985a .972 .992 131.845 39 39 .000
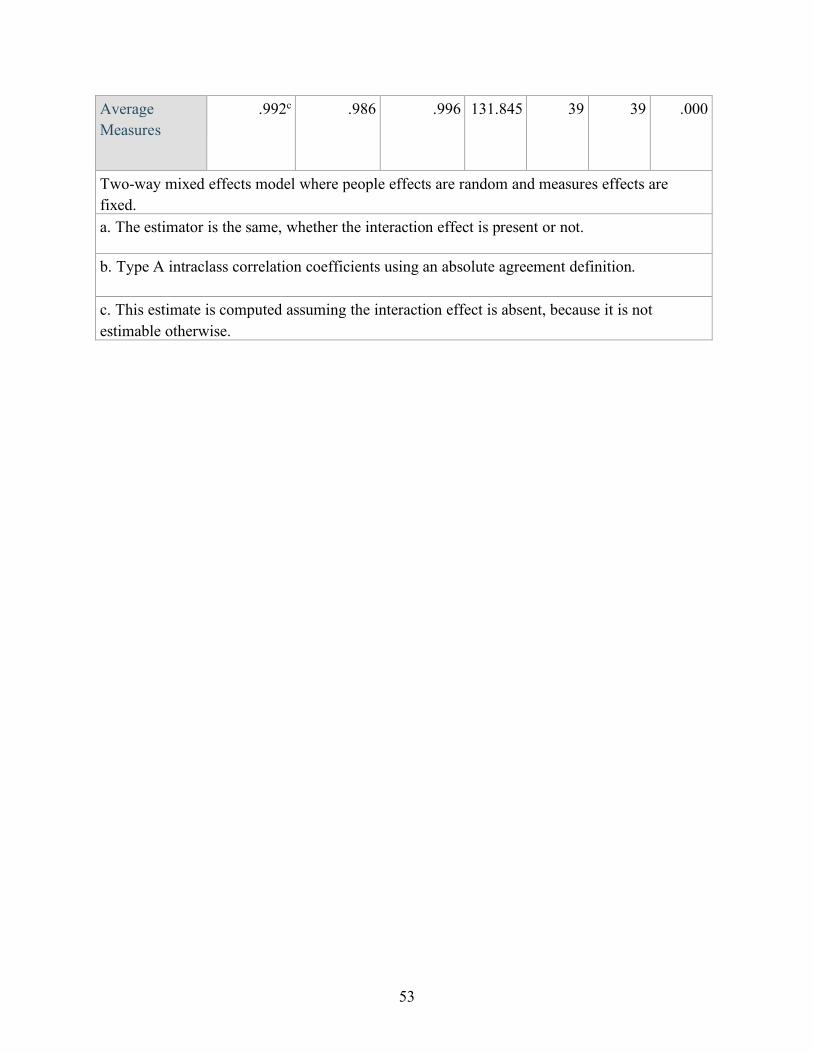
53
Average Measures
.992c .986 .996 131.845 39 39 .000
Two-way mixed effects model where people effects are random and measures effects are fixed. a. The estimator is the same, whether the interaction effect is present or not.
b. Type A intraclass correlation coefficients using an absolute agreement definition.
c. This estimate is computed assuming the interaction effect is absent, because it is not estimable otherwise.

54
Appendix E: IRB Exemption
- 1 - Generated on IRBNet
� �
������� ������������ ����� � ��� ��������
������ �������� �� ���� �������������������������� � ����������������� �!�"�#��"����$�%������&��"�� �!����"��������� '�� ()*�+�������������,�#�"���"���"%��"�-��&��"���������#�)� �-�
��" ������.������"/����/ �����%-���,�"����������"��%��� ��"����� �0�0��!1��!�1��2�030�4������5��#� !������� �������� ������$�"���%��&� 06�%-"������"�#����7�8
�
� ��9�����������������%����������1�/�4��&��"�%�"�����������" ���-��"����:�� ���%�%����,�%������"�����"���" �"�" ��-��"��������������,����;�� ����������;��/�,������,���"�,����2�,�������#���"�����"�"�"��8(<2�8*: =�>���,�,��%�,��6�%-":
?��/������"��������-�����" ���������-��,�����/�" ����������,�:
!���'�������5-���������,�"��%���"��������6�%-"��"�"����" ��������� �"��%�������-���������������,��"��#�" ��������� ����"�"�,����" ���6�%-"��--����"������;��/�,����" ����!���$����,@���" ��!�A�/ �� �� ���������,������#�" �%��"������"������%�""�,�!����%�,�<�����"@�����"�2��%��=!����%�"����� ��">���,�������"%��"�%�"������:
!�������-��&��"���;��;���-����#�������� �-��"���-��"����"��������%%��,�,�"�����"��"�<������� ���������!4��#��%�<���,���"����"�= �>��B(��B8�"�����������%-�������/�" �" ��4����������!����"�;�������$�%��������� ����&��"�:
����� ��#���"��" ���--����"����%���������" ���-��"�����"����C�������,�������"���;������!�A���;��/:�� ���,����� ��#������,�"�����%�,���-���������%�"��� ��(����)���*�:�? ���" �����;�����������,�-��"���� ����������%-��"�,��-���������%�"���"�)�)+),�� � �-!*�,* ..�"���� ��)�* ��*��"����"������!��$������"���������:
!������ �;��C���"������-���������"��"�" ������������������� �!�"�#��"����$�%������&��"���"�!�AD���;:�,��������� ���B(��B8:�4�����������,�������-��"�����"�"�����,�!�A1�"�!���������������-��,����:
�
����������������� �!�"�#��"����$�%������&��"�8( (��������,�4��9/���:�A�6�8( 8�:�E���F�#����1�;�,���B(8� 8
= �>��B(��B8�:�2�3G�= �>��B(� � (�:�!�AD���;:�,�

55
References Abu Arqoub, S. H., & Al-Khateeb, S. N. (2011). Perception of facial profile attractiveness of
different antero-posterior and vertical proportions. European Journal of Orthodontics,
33(1), 103–111. https://doi.org/10.1093/ejo/cjq028
Alcan, T., Ceylanoǧlu, C., & Baysal, B. (2009). The relationship between digital model accuracy
and time-dependent deformation of alginate impressions. Angle Orthodontist, 79(1), 30–36.
https://doi.org/10.2319/100307-475.1
Angle, E. H. (1907). Treatment of malocclusion of the teeth : Angle’s system (7th ed.).
Philadelphia.
Anuwongnukroh, N., Dechkunakorn, S., kunakornporamut, K., & Tua-Ngam, P. (2017). Dental
arch changes in postretention in Class II division 1 extraction cases. International
Orthodontics, 15(2), 208–220. https://doi.org/10.1016/j.ortho.2017.03.006
Barreto, M. S., Faber, J., Vogel, C. J., & Araujo, T. M. (2016). Reliability of digital orthodontic
setups. Angle Orthodontist, 86(2), 255–259. https://doi.org/10.2319/120914-890.1
Bishara, S. E. (2006). Class II Malocclusions: Diagnostic and Clinical Considerations With and
Without Treatment. Seminars in Orthodontics, 12(1), 11–12.
Bishara, S. E., & Jakobsen, J. R. (1997). Profile changes in patients treated with and without
extractions: assessments by lay people. American Journal of Orthodontics and Dentofacial
Orthopedics : Official Publication of the American Association of Orthodontists, Its
Constituent Societies, and the American Board of Orthodontics, 112(6), 639–644.
https://doi.org/10.1016/S0889-5406(97)70229-4
Bishara, Samir E., Hoppens, B. J., Jakobsen, J. R., & Kohout, F. J. (1988). Changes in the molar
relationship between the deciduous and permanent dentitions: A longitudinal study.

56
American Journal of Orthodontics and Dentofacial Orthopedics, 93(1), 19–28.
https://doi.org/10.1016/0889-5406(88)90189-8
Braun, S. (1999). The extraction—nonextraction decision revisited. American Journal of
Orthodontics and Dentofacial Orthopedics, 116(4), 21A-22A.
Burstone, C. J., & Choy, K. (2015). The Biomechanical Foundation of Clinical Orthodontics.
Camardella, L. T., Rothier, E. K. C., Vilella, O. V., Ongkosuwito, E. M., & Breuning, K. H.
(2016). Virtual setup: application in orthodontic practice. Journal of Orofacial Orthopedics,
77(6), 409–419. https://doi.org/10.1007/s00056-016-0048-y
Canut, J., & Arias, S. (1999). A long-term evaluation of treated Class II division 2
malocclusions: a retrospective study model analysis. European Journal of Orthodontics,
21(4), 377–386.
Chen, Y., Kyung, H., Zhao, W., & Yu, W. (2009). Critical factors for the success of orthodontic
mini-implants: a systematic review. American Journal of Orthodontics and Dentofacial
Orthopedics, 135(3), 284–291.
Cochrane, S., Cunningham, S., & Hunt, N. (1999). A comparison of the perception of the facial
profile between general public and three groups of clinicians. International Journal of
Orthodontia, Oral Surgery and Radiography, 14(4), 291–295.
Cope, J. B. (2005). Temporary anchorage devices in orthodontics: A paradigm shift. Seminars in
Orthodontics, 11(1), 3–9.
De la Cruz, A., Sampson, P., Little, R. M., Artun, J., & Shapiro, P. (1995). Long-term changes in
arch form after orthodontic treatment and retention. American Journal of Orthodontics and
Dentofacial Orthopedics, 107(5), 518–530.
Drelich, R. C. (1948). A cephalometric study of untreated Class II Division 1 malocclusion.

57
Angle Orthodontist, 18(3), 70–75.
Dudic, A., Giannopoulou, C., & Kiliaridis, S. (2013). Factors related to the rate of
orthodontically induced tooth movement. American Journal of Orthodontics and
Dentofacial Orthopedics, 143(5), 616–621. https://doi.org/10.1016/j.ajodo.2012.12.009
Everdi, N., & Acar, A. (2005). Zygomatic Anchorage for En Masse Retraction in the Treatment
of Severe Class II Division 1. Angle Orthodontist, 75(3), 483–490.
Felton, J. ., Sinclair, P. M., Jones, D. L., & Alexander, R. . (1987). A computerized analysis of
the shape and stability of mandibular arch form. American Journal of Orthodontics and
Dentofacial Orthopedics, 92(6), 478–483.
Fisk, G. V., Culbert, M. R., Grainger, R. M., Hemrend, B., & Moyers, R. (1953). The
morphology and physicology of distocclusion. American Journal of Orthodontics and
Dentofacial Orthopedics, 39(1), 3–12.
Fleming, P. S., Marinho, V., & Johal, A. (2011). Orthodontic measurements on digital study
models compared with plaster models: A systematic review. Orthodontics and Craniofacial
Research, 14(1), 1–16. https://doi.org/10.1111/j.1601-6343.2010.01503.x
Garino, F., & Garino, G. B. (2002). Comparison of Dental Ar ch Measur ements Betw een S t
one and Digital Casts. World J Orthod., 3, 1–5.
Hayashi, K., Sachdeva, A. U. C., Saitoh, S., Lee, S. P., Kubota, T., & Mizoguchi, I. (2013).
Assessment of the accuracy and reliability of new 3-dimensional scanning devices.
American Journal of Orthodontics and Dentofacial Orthopedics, 144(4), 619–625.
https://doi.org/10.1016/j.ajodo.2013.04.021
Hechler, S. L. (2008). Cone-Beam CT: Applications in Orthodontics. Dental Clinics of North
America, 52(4), 809–823. https://doi.org/10.1016/j.cden.2008.05.001

58
Hedges, R. (1958). A cephalometric evaluation of Class II Division 2. Angle Orthodontist, 28(4),
191–197.
Jacobson, A. (1979). A key to the understanding of extraoral forces. American Journal of
Orthodontics and Dentofacial Orthopedics, 75(4), 361–386.
Janson, G., Junqueira, C. H. Z., Mendes, L. M., & Garib, D. G. (2016). Influence of premolar
extractions on long-term adult facial aesthetics and apparent age. European Journal of
Orthodontics, 38(3), 272–280. https://doi.org/10.1093/ejo/cjv039
Janson, G., Sathler, R., Fernandes, T. M. F., Branco, N. C. C., & De Freitas, M. R. (2013).
Correction of Class II malocclusion with Class II elastics: A systematic review. American
Journal of Orthodontics and Dentofacial Orthopedics, 143(3), 383–392.
https://doi.org/10.1016/j.ajodo.2012.10.015
Kuo, E., & Miller, R. J. (2003). Automated custom-manufacturing technology in orthodontics.
American Journal of Orthodontics and Dentofacial Orthopedics, 123(5), 578–581.
https://doi.org/10.1016/S0889-5406(03)00051-9
Leung, M. T. C., Lee, T. C. K., Rabie, A. B. M., & Wong, R. W. K. (2008). Use of Miniscrews
and Miniplates in Orthodontics. Journal of Oral and Maxillofacial Surgery, 66(7), 1461–
1466. https://doi.org/10.1016/j.joms.2007.12.029
Lewis, P. (1987). Correction of deep anterior overbite: A report of three cases. American Journal
of Orthodontics and Dentofacial Orthopedics, 91(4), 342–345.
Macchi, A., Carrafiello, G., Cacciafesta, V., & Norcini, A. (2006). Three-dimensional digital
modeling and setup. American Journal of Orthodontics and Dentofacial Orthopedics,
129(5), 605–610. https://doi.org/10.1016/j.ajodo.2006.01.010
Mah, J. (2007). The evolution of digital study models. Journal of Clinical Orthodontics : JCO,

59
41(9), 557–561.
Maj, G., Luzi, C., & Lucchese, P. (1960). Cephalometric appraisal of Class II and Class III
malocclusions. Angle Orthodontist, 30(1), 26–34.
Maple, J. R., Vig, K. W. L., Beck, F. M., Larsen, P. E., & Shanker, S. (2005). A comparison of
providers’ and consumers’ perceptions of facial-profile attractiveness. American Journal of
Orthodontics and Dentofacial Orthopedics, 128(6), 690–696.
https://doi.org/10.1016/j.ajodo.2004.09.030
Marcotte, M. (1990). Biomechanics in orthodontics (1st ed). Toronto: BC Decker.
Marquezan, M., Mattos, C., Sant’Anna, E., DeSouza, M., & Maia, L. (2014). Does cortical
thickness influence the primary stability of miniscrews? A systematic review and meta-
analysis. Angle Orthodontist, 84(6), 1093–1103.
McLaughlin, R. P., & Bennett, J. C. (1999). The dental VTO: an analysis of orthodontic tooth
movement. Journal of Clinical Orthodontics : JCO, 33(7), 394–403.
McLaughlin, R. P., Bennett, J. C., & Trevisi, H. . (2001). Systemized Orthodontic Treatment
Mechanics. Edinburgh: Mosby.
Mendes, L. M., Janson, G., Zingaretti Junqueira-Mendes, C. H., & Garib, D. G. (2019). Long-
term profile attractiveness in Class II Division 1 malocclusion patients treated with and
without extractions. American Journal of Orthodontics and Dentofacial Orthopedics,
155(3), 362–371. https://doi.org/10.1016/j.ajodo.2018.04.030
Merrifield, L. (1982). The systems of directional force. J Charles H. Tweed Int Found., 10, 15–
29.
Motamedi, A. K., Dadgar, S., Teimouri, F., & Aslani, F. (2015). Stability of changes in
mandibular intermolar and intercuspid distances following orthodontic treatment. Dental

60
Research Journal, 12(1), 71–75. https://doi.org/10.4103/1735-3327.150336
Nelson, B., Hansen, K., & Hagg, U. (2000). Class II correction in patients treated with class II
elastics and with fixed functional appliances: a comparative study. American Journal of
Orthodontics and Dentofacial Orthopedics, 118(2), 142–149.
Shapiro, P. (1974). Mandibular dental arch form and dimension. Treatment and postretention
changes. American Journal of Orthodontics, 66(1), 58–70.
Sinclair, P. M., & Little, R. M. (1983). Maturation of untreated normal occlusions. American
Journal of Orthodontics, 83(2), 114–123. https://doi.org/10.1016/S0002-9416(83)90296-8
Skinner, E. W., & Pomes, C. (1946). Dimensional stability of alginate impression materials. The
Journal of the American Dental Association, 33, 1253–1260.
Smith, R. A. (1938). The Etiology of Angle Class II Division I Malocclusion. Angle
Orthodontist, 15–19.
Tomassetti, J. J., Taloumis, L. J., Denny, J. M., & Fischer, J. R. (2001). A comparison of 3
computerized Bolton tooth-size analyses with a commonly used method. The Angle
Orthodontist, 71(5), 351–357.
Tran, N. H., Tantidhnazet, S., Raocharernporn, S., Kiattavornchareon, S., Pairuchvej, V., &
Wongsirichat, N. (2018). Accuracy of Three-Dimensional Planning in Surgery-First
Orthognathic Surgery: Planning Versus Outcome. Journal of Clinical Medicine Research,
10(5), 429–436. https://doi.org/10.14740/jocmr3372w
Tuverson, D. (1980). Anterior interocclusal relations. Part I. American Journal of Orthodontics
and Dentofacial Orthopedics, 78(4), 361–370.
Vaden, J. L., & Kiser, H. E. (1996). Straight talk about extraction and nonextraction: a
differential diagnostic decision. American Journal of Orthodontics and Dentofacial

61
Orthopedics : Official Publication of the American Association of Orthodontists, Its
Constituent Societies, and the American Board of Orthodontics, 109(4), 445–452.
https://doi.org/10.1016/S0889-5406(96)70127-0
Wesemann, C., Muallah, J., Mah, J., & Bumann, A. (2017). Accuracy and efficiency of full-arch
digitalization and 3D printing: A comparison between desktop model scanners, an intraoral
scanner, a CBCT model scan, and stereolithographic 3D printing. Quintessence
International, 48(1), 41–50. https://doi.org/10.3290/j.qi.a37130
Wuerpel, E. (1931). Ideals and idealism. Angle Orthodontist, 1(1), 14–31.
Zablocki, H. L., McNamara, J. A., Franchi, L., & Baccetti, T. (2008). Effect of the transpalatal
arch during extraction treatment. American Journal of Orthodontics and Dentofacial
Orthopedics, 133(6), 852–860. https://doi.org/10.1016/j.ajodo.2006.07.031
Zachrisson, B. (1997). Important aspects of longer-term stability. Journal of Clinical
Orthodontics : JCO, 31(9), 562–583.

62
Curriculum Vitae
Graduate College
University of Nevada, Las Vegas
Sogol Shantiyai, DMD
Email: [email protected] Degrees: Bachelor of Science- Biology San Diego State University, 2012 Doctor of Dental Medicine Midwestern University College of Dental Medicine, 2016 General Practice Residency Stony Brook University, 2017 Thesis Title: Comparison of digital treatment setups and final treatment outcomes of Class II Division 1 malocclusions treated with premolar extractions Thesis Examination Committee: Chairperson, Tanya Al-Talib, D.D.S., M.S. Committee Member, Brian G. Chrzan, D.D.S., Ph.D. Committee Member, Robert A. Danforth, D.D.S. Graduate Faculty Representative, Amei Amei, Ph.D., M.S. Graduate Program Director, James K. Mah, D.D.S., M.S., D.M.Sc.