comparison between dynamics and control performance of mesophilic and thermophilic anaerobic sludge...
TRANSCRIPT

The Chemical Engineeri~ Journal, 55 (1994) B55-B66 B55
Comparison between dynamics and control performance of mesophilic and thermophilic anaerobic sludge digesters
Imad M. Alatiqi*, Ali A. Dadkhah, Ali M. Akbar and M.F. Hamouda Chemical Engineeriw Department, Kuwait University, PO Box 5969, 13060 S&at, Kuwait
(Received October 28, 1993)
Abstract
Two anaerobic digestion schemes, namely mesophilic and thermophilic processes, have been analysed for process stability and controllability. As in any control problem, three types of variable are distinguished in this study, i.e. disturbance, manipulated and controlled variables. Substrate concentration S, and influent temperature Ti are the disturbance variables. The manipulated variables are sewage sludge influent rate Q and specific heat addition rate G,. The controlled variables are effluent substrate concentration S and digestion temperature T. A control system including a proportional-integral (PI) controller and variable groups is proposed. Multivariable steady state methods such as relative gain array, Niederlinski stability criterion, singular value decomposition and Morari integral controllability are employed. Several dynamic analyses such as biggest log-modulus tuning, robustness analysis and ‘l)reus load rejection criterion are carried out. Steady state analysis results are used for variable pairing. The results of multivariable analysis show that thermophilic anaerobic digestion is more favourable in terms of speed of response and disinfection capability. It also maintains dynamic and steady state stability if controlled properly.
1. Introduction
A generalized anaerobic system can be visualized as a physicochemical system interacting with a biochemical system. The physicochemical system consists of gas, liquid and a biologically inert fraction of solids. The biochemical system consists of mi- crobial cells and related exoenzymes which act as amass and energytransfer unit. Interactions between the physicochemical and biochemical processes are complicated owing to strong influence of carbon dioxide or carbonic acid equilibria and high values of carbon dioxide partial pressure. Anaerobic deg- radation of compounds to carbon dioxide and water is carried out in series by various microbial pop- ulations each feeding on metabolites produced by the organisms. Anaerobic processes are used to digest waste waters high in suspended solids. The particulate suspended solids entering a biological reactor affect the composition of the mixed liquor sludge with respect to the fraction of active biomass. Thus anaerobic processes are inherently complex and can be described only with many assumptions [I, 21.
*Author to whom correspondence should be addressed.
The slow growth of methanogenic bacteria such as methanobacterium, methanococcus, methano- sarcina and methanospirilhun adds a few disad- vantages to the process, e.g. (i) time-consuming laboratory experiments, causing time factor limi- tations, to comprehend the dynamic behaviour of an anaerobic reactor and (ii) poor process stability. By designing a good control system, these can be overcome. Suitable dynamic mathematical models could be useful to evaluate the process behaviour and to formulate and evaluate digester control strat- egies [3-51. From the results of Alatiqi et al. [ 61 it is suggested that substrate concentration S and digestion temperature T are selected as the two controlled variables and inflow rate Q and heat input G, are taken as manipulated variables. It is also clear from their study that inlet temperature Ti and inlet substrate concentration Si are the two major disturbances of the system. Various methods such as relative gain array (RGA), Niederlinski stability criterion (Niederlinski index, NI), singular value decomposition (SVD) and Morari integral controll- ability (MIC) are employed to check the interaction analysis and integral controllability of the mesophilic and thermophilic processes. Tuning and detuning of the controller to meet the stability and load rejection criteria were also carried out by methods
0923-0467/94/$07.00 0 1994 Elsevier Science S.A. All rights reserved @gJO@3-0467C94)06060-H

B56 I.M. Alatiqi et al. / Comparison of mesophilic and thermophilic anaerobic sludge digesters
such as biggest log-modulus tuning (BLT), robust- ness analysis (RA) and Tyreus load rejection criterion (TLC).
The present work was carried out with the ob- jectives of(i) designing a closed-loop control scheme for an anaerobic digester operating in the mesophilic and thermophilic ranges of temperature (for this purpose the method proposed by Yu and Luyben [7] is used) and (ii) analysing the controllability and closed-loop response of the anaerobic digestion process.
Lastly, the performance of thermophihc and me- sophilic operations will be compared using the above methods and dynamic simulation.
2. Dynamic model
The digestion model can be presented in state space form using the equations given below and expanded in Appendix A.
If A is the coefficient matrix of the controlled variables X, B is the coefficient matrix of the ma- nipulated variables U and ris the coefficient matrix of the disturbance d,
X=AX+BU+rd
where the vectors X,
one obtains
(I)
U and d are given by
X=[;], u=[z.], d=[:] The symbols S, T, Q, G,, T,, and S,, represent the effluent substrate concentration, digestion temper- ature, influent flow rate, specific heat addition rate, steady state temperature and steady state concen- tration respectively.
Equation (1) can be written as
d
z
-F4 0 + F6 0
Fm 1 (2)
where Si and T, are the influent substrate concen- tration and temperature respectively and F3, F,, F4, F8, F7, F,, F6, F6 and F,, are functions of the process parameters as deIlned in Table 1.
If C is a measurement transformation matrix that converts the measured states X to the output Y, then the relation between vectors and Y and X can be given as
Y=CX (3)
TABLE 1. Functions of process parameters
F = o.o13s,x, 1
K+S.
F 2
= (O.O13T, -0.129)s,
(K+S,) - Q.lv
F = (O.O13T,-0.129xK 3
(K+SJ’
F
6 = SOS-S.
V
F = -(O.O13T,-O.l29yC& 7
yX(K+SJ2 - Q./X
F = -(0.013T,-o.l29)S~ 8
=(K+S,) - QJV
F,= - o.o13s*x,
=(K+S.,)
F,,= To, - T,
V
where
y= TOC [ 1 T
Our model is based on the measurement of substrate concentration S using the chemical oxygen demand (COD) method. The recommended real time mea- surement of S is total organic carbon (TOC). From correlations in the literature COD is 2.2 times TOC
PI. On setting Fll = l/2.2, then
Figures l-4 show the effect of inputs on the substrate concentration and Figs. 5 and 6 show the response of the micro-organism concentration to Q and Si. From Fig. 3 it is seen that the substrate concentra- tion increases with increasing inlet substrate con- centration, but reaches a steady state value with increasing micro-organism concentration as seen in Fig. 6. Thus the figures clearly show that the ther- mophilic case is more sensitive and faster in re- sponding to input perturbations.

I.M. Alatiqi et al. / Cmparison of mesophilic and thernwphilic anaerobic sludge digesters
3. Open-loop transfer functions
The process and disturbance gain matrices GPcsj and Gd+_) are obtained by performing transform of eqns. (1) and (3). Thus
G P(S) =
r
B57
the Laplace
(S+F,)(S’+F,S+F,F,)
F,o S+F,
,...I’ ,...”
,..’ . ..’
./ ,....’
.’
,;” /“’
,:’ . ..’
,:’
. ..”
O~l,l,l,l,l,l,l,l,l,I, 0 20 40 60 80 loo 124 140 160 180 200
Time (day) Fig. 1. Response of substrate concentration to + 10% pertur- bation in Q.
G d(s) =
FIIFGS -f’l,Fd’,S-FlF&‘,,Fti S2+F,S+F,F, (S+F6)(S2+F7+F3F8)
1 F6
s+F6
(5)
By solving the polynomials in the numerators and denominators with numerical values and after sim- plification, the process and disturbance transfer function matrices for the mesophiic and thermo- philic cases were obtained as given in Appendices B and C.
- bma.tlO%i~G~ ““.. so tkr. 40% h Cl
I ‘... “....,,
“....., .. . . . . . . . . . . . . . . . . . . . . . . ..*...................~
-15-e,
0 20 40 60 80 loo lx) 140 160 l&l 200
Time (day)
Fig. 2. Response of substrate concentration to + 10% pertur- bation in G,.
4. Steady state analysis techniques and variable pairing
When the off-diagonal elements in the transfer function matrix are not equal to zero, then there is some sort of interaction between the inputs and outputs in the system. As seen in the transfer function matrix, the off-diagonal elements are not equal to zero. Thus there is some level of interaction between the inputs Q and G, and outputs S and T. An open- loop block diagram for this case is shown in Fig. 7.
Some of the steady state analysis techniques that are employed here to test the proposed control

B58 I.M. Al.a.Zi.qi et al. / Comparison of mesophilic and therrmphilic anaerobic sludge digesters
0 20 40 60 80 100 120 140 160 180 200
Time (day) Fig. 3. Response of substrate concentration to + 10% perhx- bation in Si.
scheme for both the thermophilic and mesophilic cases are (i) relative gain array [ 8,9 1, (ii) Niederlinski stability criterion [lo], (iii) singular value decom- position [ 111 and (iv) Morari integral controllability
]91. Because of the scale sensitivity of steady state
analysis tools, the transfer functions are made di- mensionless by including the sensor and actuator gains as follows:
G = G,I ‘%I,‘%, G,~%zGva PC
[ Gn2Gp2,6-1 Gn2Gp22Gv2 1 The following assumptions were made for meas-
uring devices and valve gains. (1) The signal span is assumed to be 10-50 mA. (2) For the mesophilic case the steady state
capacity is assumed to be doubled and the range of flow rate is taken from 0 to 540 m3 day-‘.
(3) For TOC analysis a measurement range from 6000 to 10 000 mgTOC 1-l is assumed.
(4) The fuel valve range of G, is assumed to be between 0 and 0.6 “C day-’ and the thermocouple temperature range is taken to be from 10 to 60 “C.
(5) The thermocouple sensing range is assumed to be between 10 and 70 “C.
.18-
-20 I,I,I,I,I, I,‘,‘,I,‘l
0 20 40 60 80 100 120 140 160 180 200
Time (day) Fig. 4. Response of substrate concentration to + 10% pertur- bation in Ti.
The sensor and actuator gains based on the above assumptions are given in Table 2.
Thus
Q Gl
[
5.712 -1.709 s G 0 m(0) = -0.2 1 0.36 T
and
Q GU
1
8.014 -3.431 s G,, = -0.833 1 1 T
where subscripts “m” and “t” represent the me- sophilic and thermophilic processes respectively. The block diagram of the closed-loop system is shown in Fig. 8 and the digester control system is shown in Fig. 9.
4.1. Relative gain array @GA) One of the well-known measures for interaction
analysis is the RGA [S], which works on the steady state transfer function G,,. Knowing Gcoj, an es- timation of the B matrix is made. Here an element Bij of the B matrix represents the interaction between input i and output j.
Grosdidier et al. [9] predicted the Bij element of the RGA to be

I.&l. Akztiqi et al. / Comparison of mesophilic and thermophilic anaerobic sludge digesters B59
0,
-30
? % c: -60 0 c
x
3
E -90
z
-120
-150 I--
-XXtlO%ioQ X tber. tlO% in Q
. . . . . . . . . . . . . . . . . . . . . . . . . . . . . . . . . . . . . . . . . . .
0 20 40 60 80 100 120 140 160 180 200
Time (day) Fig. 5. Response of micro-organism concentration to + 10% perturbation in Q.
Bij = K,(K, - 1) (6)
where i and j denote input and output values respectively and Kij and Kij - 1 are elements of GCO, and G,, - 1 respectively. The sum of the elements in any row or column of B is equal to unity; when one element is equal to unity, this means that the other loops have no effect on this loop and hence are free from interaction. Therefore the criteria for pairing inputs and outputs using the RGA method are to choose pairings that give Bi,. which are closer to unity and avoid pairings with negative relative gain values.
Thus
B,= [
-
and
B,= -
Gu
-0.2 s 1 1.2 T
GU -0.55 s 1 1.55 T
MO-
120-
‘=M loo- E g J a- x 5 f 60-
;
40-
. . . . . . . . . . . . . . . . . . . . . . . . . . . . . . . . . . . . . . . , . . . .
..-. _.....
.:. ..:
.:’ j
; .:
;
.:
- X men tlO% in Si
-_ X tk tlO% in Si
0 20 40 60 80 100 120 140 160 180 200
Time (day) Fig. 6. Response of micro-organism concentration to + 10% perturbation in Si.
Fig. 7. Open-loop diagram of anaerobic digester.
TABLE 2. Sensor and actuator gains
Gain unit Mesophilic Thennophilic
Gv, Q m3 day-’ mK’ 13.5 40.5 G IIll S mA 1 mgTOC_’ 0.01 0.01 G,z G, “C day-’ n-A_’ 0.015 0.15 G In2 T mA YF1 0.8 0.667
Here the values of B, and B, indicate that the diagonal elements are those which are closer to unity. Thus S-Q and T-G, are the recommended pairings.
In both cases the interaction is small and no interaction compensator or decoupler is required.

B60 I.M. AL&i& et al. / Comparison of mesophilic and thenwphilic anaerobic sludge digesters
I 1
Fig. 8. Block diagram of closed-loop system for anaerobic digester.
Biogas
b-Q PC
Digested Sludge
Fig. 9. Feedback control system for anaerobic digester.
4.2. Niedm-linski stability criterion The Niederlinski index (NI) is defined as
NI = da G(O) I
@ii (7)
The Niederlinski index for the mesophilic and ther- mophilic schemes is calculated from equation (7). Positive values of NI, = 0.333 and NI,= 0.643 are
obtained, indicating the proposed control scheme to be stable.
4.3. Singular value decomposition ‘(SKD] SVD is a method to decompose a complex n X n
matrix A into three component matrices according to
where U and V are unitary matrices (UT= U-‘) and E is a diagonal matrix of singular values (a+~). The ratio S/c, where 6 and _a are the maximum and minimum singular values of GPcOj, is defined as the plant condition number (CN). A large condition number indicates a large degree of directionality (degree of dependence of variables or interaction). The singular value analysis results for the mesophilic case are
ui = 5.97, 0.287
[
0.999 -4.95x 1o-2 u=
- 4.95 x 1o-2 - 0.999 1 0.957 - 0.289
V= [ - 0.289 - 0.957 1 CN = 20.7
and for the thermophilic case
ui = 8.795, 0.586
v= [
0.915 - 0.402 - 0.402 - 0.915 1
CN=15
These results show that the interaction is higher in the mesophilic case. Therefore the condition number for the thermophilic case is lower, meaning that the interaction is lower in the thermophilic case than in the mesophilic one. This is in contrast with the RGA results.
4.4. Morari integral controllability (&UC) A system is defined to be integrally controllable
if there exists a range of positive gains starting from zero for which the closed-loop system is stable. A suificient and necessary condition for integral controllability is that all eigenvalues of the G& matrix be positive. G& is the plant steady state gain matrix with signs adjusted so that all diagonal elements have positive signs. For the digester model, in both the mesophilic and thermophilic cases, the diagonal elements of G& are positive, so that sign adjustment is not needed. The MIC results for the mesophilic and thermophilic cases respectively are
A, = 5.775, 0.297

i i I
0.01 10.0 Ml 10.0
w(llaW w&W
a Robustness Factor(max = 2.2) b. Lag Modulus(max = 4.0)
7 Sl
I.M. Alutiqi et al. / Comparison of mesophilic and thmmophilic anaerobic sludge digesters
c. Robustness Fador(mn = 2.54) d. Log Modulus (max = 3.94)
Fig. 10. Control system analysis in frequency domain. (a), (b) Mesophilic case; (c), (d) thermophilic case.
B61
A, = 8.4, 0.614
where A denotes an eigenvalue. All As are positive, so that the MIC criterion is met in both cases.
The MIC analysis results show that both systems are integrally controllable. Thus by controlling the system with PI-type controllers, there are some values of Kc which make the system stable.
6. Multivarlable frequency response and dynamic analysis
The closed-loop system can be written as
~0)=~~1~sP~S)+~12~sp<S)+~1I~i~s)+~12~I(s) (8)
T(a) = p2 1 &p(S) + p22 T*p(S) + D21 si@j + O22 G(S) (9)
where
D 12
= GalzG=zGvzG~(GdlzGp22-Gd2zGp,2) DN
D 21
= GdZlGc,Gv~Grnl(Gp,,Gdz1-Gpz1Gdl1) DN
D 22
= Gd2zGe,GvlG*.I(GPIIGd21-Gpz1Gdl,) DN
and

B62 IX. Alatiqi et al. / Comparison of mesophilic and thermophilic anaerobic sludge digesters
so Tii (day)
Irn
so
Tinn (day)
so
Tii (day)
Irn
0.16-
b.lS-
so
Time (day)
loo
F’ig. 11. Response of linearized mesophilic system to + 10% step change in Si load.
For tuning the two multiloop controllers and analysing the closed-loop performance, the following methods are used here: (i) biggest log-modulus tuning (BLT) [ 121; (ii) robustness analysis (PA) [ 131; (iii) Tyreus load rejection criterion (TLC) [ 141.
5.1. Biggest log-modulus tuning (BLT) This method, proposed by Luyben [ 12 ], uses a
multivariable Nyquist plot and equal detuning of all loops from the single-loop Ziegler-Nichols (ZN) setting.
The log-modulus L,
L c(iw) = 20 log SW I I
where
is calculated as
(IO)
w(iw) = - 1 + dW + G(w) C(iw)> (11)
Here C is the diagonal matrix of single-input-single- output (SISO) feedback controllers.
For the mesophilic case two PI controllers were tested for the BLT criterion. It was found that values of K,l=6, &=225, rilz3.5 days and ri2=4 days meet the BLT criterion.
5.2. Robustness analysis The ability of a system to remain stable over a
range of parameter changes due to model uncertainty is called robustness. Seldom is the model identical with the real process. Tyreus [ 131 gave a measure for the robustness of a control system as
tlACII< ql+;)-‘g (12)
I.M. Alatiqi et al. / Comparison of wwsophilic and therrrwphilic anaerobic sludge digesters B63
II0 I I
0 34 I#
Tim (day)
s E nl- 0
m. 0 II
Time (day)
se 1%
Time (day)
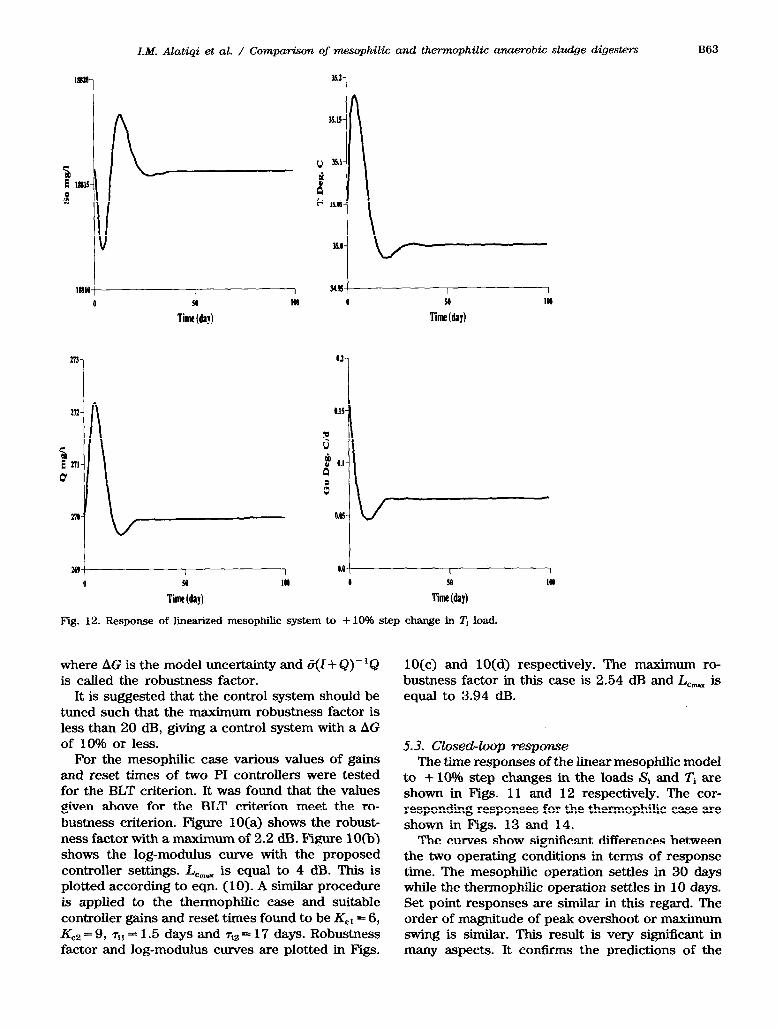
Fig. 12. Response of linearized mesophilic system to + 10% step change in T, load.
where AG is the model uncertainty and qI+ &)- ‘& is called the robustness factor.
It is suggested that the control system should be tuned such that the maximum robustness factor is less than 20 dB, giving a control system with a AG of 10% or less.
For the mesophilic case various values of gains and reset times of two PI controllers were tested for the BLT criterion. It was found that the values given above for the BLT criterion meet the ro- bustness criterion. Figure 10(a) shows the robust- ness factor with a maximum of 2.2 dB. Figure 10(b) shows the Iqg-modulus curve with the proposed controller settings. L,,, is equal to 4 dB. This is plotted according to eqn. (10). A similar procedure is applied to the thermophilic case and suitable controller gains and reset times found to be K,, = 6, K,, = 9, ru= 1.5 days and r12 = 17 days. Robustness factor and log-modulus curves are plotted in Figs.
10(c) and 10(d) respectively. The maximum ro- bustness factor in this case is 2.54 dB and L,, is equal to 3.94 dB.
5.3. Closed-loop response The time responses of the linear mesophihc model
to + 10% step changes in the loads Sj and Ti are shown in Figs. 11 and 12 respectively. The cor- responding responses for the thennophilic case are shown in Figs. 13 and 14.
The curves show significant differences between the two operating conditions in terms of response time. The mesophilic operation settles in 30 days while the thermophilic operation settles in 10 days. Set point responses are similar in this regard. The order of magnitude of peak overshoot or maximum swing is similar. This result is very significant in many aspects. It confirms the predictions of the

MB,, 0 10 M 30
Tie (day)
OS0
1 mo
aI 0 IO 20 30 0 30
Tie (day) Time (day)
Fig. 13. Response of linearized thermophilic system to + 1096 step change in S, load.
B64 I.M. Alatiqi et al. / Comparison of mesophilic and thmnmphilic anaerobic sludge digesters
MM 0 IO 1 30
Tit (day)
fJ1
steady state analysis in that interaction levels are comparable between the two operations. Further, it shows that the thermophilic operation, if controlled properly, is no more difficult to control than the mesophilic one. In fact, the faster recovery following upsets would make the thermophilic operation more attractive and less confusing to operators following organic shocks. Such shocks are typically recurrent every weekend in Kuwait farming communities, which causes disturbances to the mesophilic op- eration of higher frequency than its closed-loop time constant.
6. Conclusions
An effort was made to design a closed-loop control scheme for an anaerobic process. The in-
teraction analysis and integral controllability of the process were carried out using methods such aa relative gain array, Niederlinski stability criterion, singular value decomposition and Morari integral controllability.
The steady state analysis shows that although both systems are stable, the level of interaction is not the same in them. The RGA analysis shows that the thermophilic digestion has more interaction, while the SVD results show that the interaction is higher in the mesophilic case. However, the results in both cases are so close to each other that some scaling changes may reverse them. Owing to the low interaction values, it was decided that multiloop controllers are su&ient to control the process efficiently.

@- 0 10 M 30 6 10 m 36
Time (da)) Time (daJ) Fig. 14. Response of linearized thermophilic system to + 10% step change in Z’, load.
I.M. Al.&@ et al. / Comparison of mesophilic and thermophilic a nuerobic sludge digesters B65
5521
SW- e 16 24 36
Time (day)
Tuning and detuning of the controllers to meet the stability and load rejection criteria were carried out using methods such as biggest log-modulus tuning and robustness analysis. From these methods it was concluded that both processes are stable and robust with BLT settings.
The time response curves show that the mesophilic operation is three times slower than the thermophilic one. The dynamic error is comparable between the two modes. The thermophilic operation maintains the disinfection advantage but requires more in- vestment for heating.
Acknowledgment
The authors would like to thank Dr. Johnson Mathew for his valuable editorial reviews.
References
1 S.E. Jorgensen and M.J. Gromiec (eds.), Mathematical Models inBiological Wastewater Treatment, Elsevier, New York, 1985.
2 D.J. Picken, M.F. Fox and R. Buvet (eds.), Biomethane: Production and Uses, Turret-Wheatland, Rickmansworth, 1984.
3 J. Hemsley and A. Latten, in Sewage Sludge Stabilisakm and Disirlfection, Bruce, Chichester, 1984, pp. 125-141.
4 J.L. Thompson and A.P. Michaelson, in Sewage Sludge Stabilisabn and Disiqfection, Bruce, Chichester, 1984, pp. 92-106.
5 G.P. Noone and C.E. Brade, Water Pollut. Control, 81(4) (1982) 479-510.
6 I.M. Alatiqi, AA. Dadkhah and N.M. Jabr, Chem. Eng. J., 43 (1990) B81-BQl.
7 C.C. Yu and W.L. Luyben, Ind. Eng. Chem. Process. Res. Develop., 25 (1985) 498-503.
8 E.H. Bristol, IEEE Trans. Automat. Control, AC-11 (1966) 133.
9 P. Grosdidier, M. Morari and B.R. Holt, Ind Eng. Chem Fund., 24 (1985) 221-235.

B66 I.M. Al&i& et al. / Comparison of mesophilic and thermophilic anaerobic sludge digesters
10 A. Niederlinski, Automatica, 7 (1971) 691. 11 S. Skogesterd and M. Morari, Znd. Eng. Chem. Rex, 26
(1987) 2029-2035. 12 W.L. Luyben, Ind. Eng. Chem. Process. Res. Develop., 25
(1988) 326. 13 B.D. Tyreus, Lehigh University Distillation Control Short
Course, Bethlehem, PA, May 1984, unpublished results. 14 W.L. Luyben, Process M&l&g, Simulation and Control
for C+mical Engineers, McGraw-Hill, New York, 2nd edn., 1990.
Appendix A: Linerarized equations for an anaerobic digester
(O.O13T,--0.129)& Q,
Appendix B: Transfer functions for mesophilic case
G&311=
G p12 =
G p21=
G p22 =
G dll=
42.312(25.013s+ 1)
(3OS+ 1)(49.237S + 1)
- 11395.022
(3os+ 1)(49.237S+ 1)
- 1.851 x 1o-2 3os+ 1
30 3os+ 1
22.385
(3os+ 1)(49.2373+ 1)
- 379.834
Gd12= (3os+ 1)(49.237S+ 1)
Appendix C: Transfer functions for thermophilic case
G 19.789(6.4328+ 1)
‘I’= (lOS+ 1)(17.766S+ 1)
- 2287.341
Gp12= (lOS+ 1)(17.766S+ 1)
Gp21=
-3.086~10-~ 1os+ 1
G 10
p22= - 1os+ 1
8.075s
Gdll = (lOS+ 1)(17.766S+ 1)
- 228.734
Gd12= (lOS+ 1)(17.766S+ 1)
Gdzl=O
Gdz= 1
- 1os+ 1
Appendix D: Nomenclature
specilk heat addition rate (“C day- ‘) half-saturation constant (mg 1 - ‘) influent flow rate (m3 day- ‘) saturated influent flow rate (m3 day-‘) effluent substrate concentration (mgCOD l- ‘) influent substrate concentration (mgCOD 1-r) saturated substrate concentration (mgCOD 1 - ‘) digestion temperature (“C) influent temperature (“C) saturated digestion temperature (“C) volume of digester liquor (m3) micro-organism concentration (mg l- ‘) saturated micro-organism concentration (mg 1-l) micro-organism yield rate X/S (mg mgCOD- ‘)