comparing recognition performance and robustness of
TRANSCRIPT

1
Comparing Recognition Performance andRobustness of Multimodal Deep Learning Models
for Multimodal Emotion RecognitionWei Liu, Jie-Lin Qiu, Wei-Long Zheng, Member, IEEE, and Bao-Liang Lu∗, Fellow, IEEE
Abstract—Multimodal signals are powerful for emotion recog-nition since they can represent emotions comprehensively. In thispaper, we compare the recognition performance and robustnessof two multimodal emotion recognition models: deep canonicalcorrelation analysis (DCCA) and bimodal deep autoencoder(BDAE). The contributions of this paper are three folds: 1) Wepropose two methods for extending the original DCCA modelfor multimodal fusion: weighted sum fusion and attention-basedfusion. 2) We systemically compare the performance of DCCA,BDAE, and traditional approaches on five multimodal datasets.3) We investigate the robustness of DCCA, BDAE, and traditionalapproaches on SEED-V and DREAMER datasets under twoconditions: adding noises to multimodal features and replacingEEG features with noises. Our experimental results demonstratethat DCCA achieves state-of-the-art recognition results on allfive datasets: 94.6% on the SEED dataset, 87.5% on the SEED-IV dataset, 84.3% and 85.6% on the DEAP dataset, 85.3%on the SEED-V dataset, and 89.0%, 90.6%, and 90.7% on theDREAMER dataset. Meanwhile, DCCA has greater robustnesswhen adding various amounts of noises to the SEED-V andDREAMER datasets. By visualizing features before and afterDCCA transformation on the SEED-V dataset, we find that thetransformed features are more homogeneous and discriminativeacross emotions.
Index Terms—Multimodal emotion recognition, EEG, Eyemovement, Multimodal deep learning, Deep canonical correlationanalysis, Bimodal Deep AutoEncoder, Robustness.
I. INTRODUCTION
EMOTION strongly influences in our daily activities suchas interactions between people, decision making, learn-
ing, and working. Picard et al. developed the concept of affec-tive computing, which aims to be used to study and developsystems and devices that can recognize, interpret, process,
The work of Wei Liu and Bao-Liang Lu was supported in part by theNational Natural Science Foundation of China (61976135), the National KeyResearch and Development Program of China (2017YFB1002501), SJTUTrans-med Awards Research (WF540162605), the Fundamental ResearchFunds for the Central Universities, the 111 Project, and the China SouthernPower Grid (Grant No. GDKJXM20185761). (∗Corresponding author: Bao-Liang Lu, [email protected].)
Wei Liu and Bao-Liang Lu are with the Center for Brain-Like Computingand Machine Intelligence, Department of Computer Science and Engineering,the Key Laboratory of Shanghai Education Commission for Intelligent Inter-action and Cognitive Engineering, Brain Science and Technology ResearchCenter, Qing Yuan Research Institute, Shanghai Jiao Tong University, 800Dongchuan Rd., Shanghai 200240, China, and the Center for Brain-MachineInterface and Neuromodulation, Rui-Jin Hospital, Shanghai Jiao Tong Uni-versity School of Medicine, 197 Ruijin 2nd Rd., Shanghai 200020, China.
Jie-Lin Qiu is with the Computer Science Department, Carnegie MellonUniversity, Pittsburgh, PA, 15213, USA.
Wei-Long Zheng is with the Department of Brain and Cognitive Science,Massachusetts Institute of Technology, Cambridge, MA 02139, USA.
and simulate human affects [1]. Human emotion recognitionis a current hotspot in affective computing research, and itis critical for applications such as affective brain-computerinterface [2], emotion regulation and the diagnosis of emotion-related diseases [3].
Traditional emotion recognition systems are built with non-physiological signals [4], [5]. However, emotions also containreactions from the central and peripheral nervous systems.Besides, electroencephalography (EEG)-based emotion recog-nition has been demonstrated to be a reliable method becauseof its high recognition accuracy, objective evaluation and stableneural patterns [6], [7], [8], [9], [10].
In recent years, researchers have tended to study emotionsthrough EEG signals. Various methods have been proposedfor EEG-based emotion recognition [11], [12], [13], [14],[15], [16], [17], and one of the reasons is that EEG signalsare more accurate and difficult to deliberately change byusers. Moreover, other physiological signals such as elec-tromyogram, electrocardiogram, skin conductivity, respiration,and eye movement signals are also used to recognize emo-tions [18], [19].
Because of the complexity of emotions, it is difficult forsingle-modality signals to describe emotions comprehensively.Therefore, recognizing emotions with multiple modalities hasbecome a promising method [20], [21], [22], [23]. Manystudies indicate that multimodal data can reflect emotionalchanges from different perspective, which are conducive tobuilding a reliable and accurate emotion recognition model.
Multimodal fusion strategy is one of the key aspects intaking full advantage of multimodal signals. Lu and colleaguesemployed feature-level concatenation, MAX fusion, SUMfusion, and fuzzy integral fusion to merge EEG and eyemovement features [24]. Koelstra and colleagues evaluatedthe feature-level concatenation of EEG features and peripheralphysiological features [25]. Sun et al. built a hierarchicalclassifier by combining both feature-level and decision-levelfusion for emotion recognition tasks in the wild [26].
Currently, with the rapid development of deep learning,researchers are applying deep learning models to fuse multi-modal signals. Deep-learning-based multimodal representationframeworks can be classified into two categories: multimodaljoint representation and multimodal coordinated representa-tion [27]. Briefly, the multimodal joint representation frame-work takes all the modalities as input, and each modalitystarts with several individual neural layers followed by ahidden layer that projects the modalities into a joint space.
This is the author's version of an article that has been published in this journal. Changes were made to this version by the publisher prior to publication.The final version of record is available at http://dx.doi.org/10.1109/TCDS.2021.3071170
Copyright (c) 2021 IEEE. Personal use is permitted. For any other purposes, permission must be obtained from the IEEE by emailing [email protected].

2
The multimodal coordinated representation framework learnsseparate representations for each modality and coordinatesthem into a hyperspace with constraints between differentmodalities. Many deep learning models have been appliedto emotion recognition in very recent years [28], [29], [30],[31], [32], [33], however, the characteristics these two kindsof models have not yet been fully studied.
In this paper, we compare the recognition perfor-mance and robustness of deep canonical correlation anal-ysis (DCCA) [32], [34] and bimodal deep autoencoder(BDAE) [28], [35] for multimodal emotion recognition. DCCAlearns separate but coordinated representations for each modal-ity under canonical correlation analysis (CCA) constraints.BDAE, which is a method of multimodal joint representationframework, transforms multiple modalities and jointly learnsfused features automatically. The main contributions of thispaper on multimodal emotion recognition can be summarizedas follows:
1) We propose two multimodal fusion methods to extendthe original DCCA model: a weighted-sum fusion and anattention-based fusion. The weighted-sum fusion methodallows users to set different weights to different modali-ties while the attention-based fusion method will calculatethe weights adaptively.
2) For the SEED-V dataset, we systemically compare theemotion recognition performance of DCCA with that ofBDAE and other existing methods. Then, by visualizingtransformed features of DCCA, we find that differentemotions are disentangled in the coordinated hyperspace.And finally, we calculate and compare the mutual infor-mation of multimodal features before and after DCCAtransformation.
3) We compare the robustness of DCCA and BDAE and theconventional multimodal fusion methods on the SEED-V and DREAMER datasets under two conditions: addingnoises to multimodal features and replacing EEG featureswith noises. The experimental results show that DCCAhas higher robustness than both the BDAE and traditionalmethods under most noise conditions.
4) We systematically compare the recognition performanceof DCCA and BDAE for multimodal emotion recognitionon five benchmark datasets: the SEED, SEED-IV, SEED-V, DEAP, and DREAMER datasets. Our experimentalresults on these five datasets reveal that both DCCA andBDAE have better performance than traditional multi-modal fusion methods for multimodal emotion recogni-tion.
The remainder of this paper is organized as follows. SectionII summarizes the development and current state of multimodalfusion strategies. In Section III, we introduce the algorithmsof standard DCCA and the proposed weighted-sum fusionand attention-based fusion methods, BDAE, and the baselinemodels utilized in this paper. The experimental settings arereported in Section IV. Section V presents the experimentalcomparison results and discussions. Finally, conclusions andfuture work are given in Section VI.
II. RELATED WORK
Multimodal fusion has gained increasing attention fromresearchers in diverse fields due to its potential for innumerableapplications such as emotion recognition, event detection,image segmentation, and video classification [36]. Accordingto the level of fusion, traditional fusion strategies can be classi-fied into the following three categories: 1) feature-level fusion(early fusion), 2) decision-level fusion (late fusion), and 3)hybrid multimodal fusion. With the rapid development of deeplearning, an increasing number of researchers are employingdeep learning models to facilitate multimodal fusion.
A. Feature-level fusion
Feature-level fusion is a common and straightforwardmethod to fuse different modalities. The features extractedfrom various modalities are first combined into a high-dimensional feature and then sent as a whole to the mod-els [24], [25], [35].
The advantages of feature-level fusion are two-fold: 1) itcan utilize the correlation between different modalities at anearly stage, which better facilitates task accomplishment, and2) the fused data contain more information than a singlemodality, and thus, a performance improvement is expected.The drawbacks of feature-level fusion methods mainly residein the following: 1) it is difficult to represent the time syn-chronization between different modality features, 2) this typeof fusion method might suffer the curse of dimensionality onsmall datasets, and 3) larger dimensional features might stresscomputational resources during model training.
B. Decision-level fusion
Decision-level fusion focuses on the usage of differentclassifiers and their combination. Ensemble learning is oftenused to assemble these classifiers [37]. The term decision-levelfusion describes a variety of methods designed to merge theoutcomes and ensemble them into a single decision.
Rule-based fusion methods are most adopted in multimodalemotion recognition. Lu and colleagues utilized MAX fusion,SUM fusion, and fuzzy integral fusion for multimodal emotionrecognition, and they found the complementary characteristicsof EEG and eye movement features by analyzing confusionmatrices [24]. Although rule-based fusion methods are easy touse, the difficulty faced by rule-based fusion is how to designa good rule. If rules are too simple, they might not reveal therelationships between different modalities.
The advantage of decision-level fusion is that the decisionsfrom different classifiers are easily compared and each modal-ity can use its best suitable classifier for the task.
C. Hybrid fusion
Hybrid fusion is a combination of feature-level fusion anddecision-level fusion. Sun and colleagues built a hierarchicalclassifier by combining both feature-level and decision-levelfusion methods for emotion recognition [26]. Guo et al. builta hybrid classifier by combining fuzzy cognitive map andsupport vector machine (SVM) to classify emotional stateswith compressed sensing representation [38].
This is the author's version of an article that has been published in this journal. Changes were made to this version by the publisher prior to publication.The final version of record is available at http://dx.doi.org/10.1109/TCDS.2021.3071170
Copyright (c) 2021 IEEE. Personal use is permitted. For any other purposes, permission must be obtained from the IEEE by emailing [email protected].

3
D. Deep-learning-based fusion
For deep learning models, different types of multimodalfusion methods have been developed, and these methods canbe grouped into two categories based on the modality rep-resentation: multimodal joint representation and multimodalcoordinated representation [27].
The multimodal joint representation framework takes allthe modalities as input, and each modality starts with severalindividual neural layers followed by a hidden layer thatprojects the modalities into a joint space. Both transformationand fusion processes are achieved automatically by black-boxmodels and users do not know the meaning of the joint rep-resentations. The multimodal joint representation frameworkhas been applied to emotion recognition [28], [29] and naturallanguage processing [39].
The multimodal coordinated representation framework, in-stead of projecting the modalities together into a joint space,learns separate representations for each modality but coor-dinates them through a constraint. The most common co-ordinated representation models enforce similarity betweenmodalities. Frome and colleagues proposed a deep visualsemantic embedding (DeViSE) model to identify visual ob-jects [40]. Andrew and colleagues proposed DCCA method,which is another model under the coordinated representationframework [34].
In recent years, more and more researchers use attentionmechanism to fuse multimodal signals [41], [42], [43]. Zhouand colleagues proposed an attention-based bidirectional long-short term memory (LSTM) to deal with relation classificationin natural language processing [41]. Zadeh and colleaguesapplied attention-based fusion in the proposed delta-memoryattention network (DMAN) model to handle multi-view se-quential learning problems [42]. Li and colleagues proposedmultimodal adversarial representation network by combiningadversarial learning and attention mechanism for click-throughrate prediction problem [43]. In this paper, we propose anattention-based fusion strategy to extend the original DCCAmodel for emotion recognition.
III. METHODS
In this section, we describe the building processes ofstandard DCCA and the proposed weighted-sum fusion andattention-based fusion methods in Section III-A. The baselinemethods used in this paper are introduced in Section III-B.
A. Deep Canonical Correlation Analysis
In this paper, we introduce deep canonical correlation anal-ysis (DCCA) to multimodal emotion recognition. The originalDCCA was proposed by Andrew and colleagues [34], and itcomputes representations of two modalities by passing themthrough multiple stacked layers of nonlinear transformations.Figure 1 depicts the framework of DCCA used in this paper.
Let X1 ∈ RN×d1 be the instance matrix for the firstmodality and X2 ∈ RN×d2 be the instance matrix for thesecond modality. Here, N is the number of instances, and d1and d2 are the dimensions of the extracted features for thesetwo modalities, respectively. To transform the raw features of
O =f (X )
O!=f!(X!)
X�
X�
Fusion
CCA calculation CCA Loss
Classifier Classification Loss
Fig. 1. The framework of the DCCA used in this paper. Different modalitiesare transformed by different neural networks separately. The outputs (O1, O2)are regularized by the traditional CCA constraint. Various strategies can beadopted to fuse O1 and O2, and the fused features are used for emotionrecognition. We update the parameters to minimize both the CCA loss andthe classification loss.
two modalities nonlinearly, we build two deep neural networksfor the two modalities as follows:
O1 =f1(X1;W1), (1)O2 =f2(X2;W2), (2)
where W1 and W2 denote all parameters for the non-lineartransformations, O1 ∈ RN×d and O2 ∈ RN×d are the outputsof the neural networks, and d denotes the output dimension ofDCCA.
The goal of DCCA is to jointly learn the parameters W1
and W2 for both neural networks such that the correlation ofO1 and O2 is as high as possible:
(W ∗1 ,W∗2 ) = arg max
W1,W2
corr(f1(X1;W1), f2(X2;W2)). (3)
We use the backpropagation algorithm to update W1 andW2. The solution to calculating the gradients of the ob-jective function in Eq. (3) was developed by Andrew andcolleagues [34].
Let O1 = O′1− 1NO
′11 be the centered output matrix (similar
to O2). We define Σ12 = 1N−1 O1O
′2, Σ11 = 1
N−1 O1O′1 +r1I.
Here, r1 is a regularization constant (similar to Σ22). The totalcorrelation of the top k components of O1 and O2 is the sumof the top k singular values of matrix T = Σ
−1/211 Σ12Σ
−1/222 .
In this paper, we take k = d, and the total correlation is thetrace of T :
corr(O1, O2) =
(tr(T ′T )
)1/2
. (4)
The CCA loss is the negative of total correlation:
LCCA = −corr(O1, O2) (5)
Finally, we calculate the gradients with the singular decompo-sition of T = UDV ′,
∂corr(O1, O2)
∂O1=
1
N − 1(2∇11O1 +∇12O2), (6)
where
∇11 =− 1
2Σ−1/211 UDU ′Σ
−1/211 , (7)
∇12 =Σ−1/211 UV ′Σ
−1/222 , (8)
This is the author's version of an article that has been published in this journal. Changes were made to this version by the publisher prior to publication.The final version of record is available at http://dx.doi.org/10.1109/TCDS.2021.3071170
Copyright (c) 2021 IEEE. Personal use is permitted. For any other purposes, permission must be obtained from the IEEE by emailing [email protected].

4
O =f (X )
O!=f!(X!)
α
α!
SVM
Ofusion
multiply operator
adding operator
Fig. 2. The process for our proposed weighted sum fusion.
and ∂corr(O1, O2)/∂O2 has a symmetric expression.After the training of the two neural networks, the trans-
formed features O1, O2 ∈ S are in the coordinated hyperspaceS. In the original DCCA [34], the authors did not explic-itly describe how to use transformed features for real-worldapplications via machine learning algorithms. Users need todesign a strategy to take advantage of the transformed featuresaccording to their application.
In this paper, we extend the original DCCA to fuse multi-modal signals and propose two fusion strategies: 1) weightedsum fusion and 2) attention-based fusion.
1) Weighted sum fusion: For weighted sum fusion, thedetailed process for feature fusion and classification is depictedin Figure 2. We initialize two hyper-parameters α1 and α2,manually find the best value of these two weights, and fusedifferent modalities as follows:
O = α1O1 + α2O2, (9)
where α1 and α2 are weights satisfying α1 +α2 = 1. To findthe best combination of weights α1 and α2, the grid searchmethod is used to compare the performance of different weightcombinations. The α1 value varies in the range between 0 and1.0 with a step of 0.1. The grid search results are given inSection V.
And finally, we use SVM to build emotion model with thefused features. Since the tuning of α1 and α2 and optimizationof SVM can not be optimized with backpropagation, we actu-ally apply a two-stage training process which means that wefirst optimize the CCA loss and extract transformed features,and then we apply weighted sum fusion and SVM for emotionrecognition.
O�=f�(X�)
O�=f�(X�)
attention weights
α�
α�
output
Ofusion FC layer
multiply operator
adding operator
inner product
Fig. 3. The process for our proposed attention-based fusion.
2) Attention-based fusion: Figure 3 illustrates the detailedprocess for our proposed attention-based fusion. First, we
initialize an attention layer with parameters Wattn, then wecalculate the inner product of attention weights and outputs ofdifferent modalities and apply softmax to normalize the resultsgetting attention weights α1 and α2, respectively.
α1 =< O1,Wattn > (10)α2 =< O2,Wattn > (11)α1, α2 = softmax(α1, α2) (12)
After calculating the attention weights, we extract the fusedfeatures by:
O = α1O1 + α2O2 (13)
Next, a full-connected (FC) layer is add as classifier withwhich we can calculate the classification loss. Under attention-based fusion settings, all the updates can be calculated withbackpropagation, and we optimize both CCA loss and classi-fication loss simultaneously:
L = γ1LCCA + γ2Lclassification (14)
where γ1 and γ2 are hyper-parameters.In this paper, we conducted several experiments to discuss
the influences of different update ratios R = γ1/γ2. We keepthe parameter γ2 = 1.0 and choose γ1 from a set {0.1, 0.3,0.5, 0.7, 0.9, 1.0} so that the update ratio R of CCA loss andclassification loss ranges from 0.1 to 1.0. We utilize a largerγ2 since the classification performance is the key metric in themodel. Therefore, the penalty of the classification loss shouldbe larger than that of the CCA loss.
According to the construction process mentioned above, theextended DCCA brings the following advantages to multi-modal emotion recognition:• We can explicitly extract transformed features for each
modality (O1 and O2), so that it is convenient to examinethe characteristics and relationships of modality-specifictransformations.
• With specified CCA constraints, we can regulate the non-linear mappings (f1(·) and f2(·)) and make the modelpreserve the emotion-related information.
• For weighted sum fusion, we assign different prioritiesto these modalities based on our priori knowledge. InSection V-A, we describe how to find the best α1 and α2
and illustrate the influences brought by these two weights.• For attention-based fusion, we calculate weights for dif-
ferent modalities adaptively. The attention-based fusioncan be seen as an adaptive version of the weighted-sumfusion since the weights calculated by attention-basedfusion might be the same as weighted-sum fusion and thisguarantees that the performance of attention-based fusionwill not be worse than that of weighted-sum fusion.
B. Baseline methods1) Concatenation Fusion: The feature vectors from two
modalities are denoted as X1 = [x11, · · · , x1n] ∈ Rn andX2 = [x21, · · · , x2m] ∈ Rm, and the fused features can becalculated with the following equation:
Xfusion = Concat([X1, X2])
= [x11, · · · , x1n, x21, · · · , x2m]. (15)
This is the author's version of an article that has been published in this journal. Changes were made to this version by the publisher prior to publication.The final version of record is available at http://dx.doi.org/10.1109/TCDS.2021.3071170
Copyright (c) 2021 IEEE. Personal use is permitted. For any other purposes, permission must be obtained from the IEEE by emailing [email protected].

5
TABLE ISUMMARY OF DATASETS AND EXPERIMENTAL SETTINGS.
Dataset Task Modality Training Scheme Test SchemeSEED 3 emotions EEG, Eye movement session-dependent train : test=3 : 2
SEED-IV 4 emotions EEG, Eye movement session-dependent train : test=2 : 1SEED-V 5 emotions EEG, Eye movement subject-dependent 3-fold cross-validationDEAP 2 binary EEG, peripheral physiological signals subject-dependent 10-fold cross-validation
DREAMER 3 binary EEG, ECG subject-dependent 18-fold cross-validation
2) MAX Fusion: Assuming that we have K classifiers andC categories, there is a probability distribution for each samplePj(Yi|xt), j ∈ {1, · · · ,K}, and i ∈ {1, · · · , C}, where xtis a sample, Yi is the predicted label, and Pj(Yi|xt) is theprobability of sample xt belonging to class i generated bythe j-th classifier. The MAX fusion rule can be expressed asfollows:
Y = arg maxi{arg max
jPj(Yi|xt)}. (16)
3) Fuzzy Integral Fusion: A fuzzy measure µ on the setX is a function: µ : P(X) → [0, 1], which satisfies the twoaxioms: 1) µ(∅) = 0 and 2) A ⊂ B ⊂ X implies µ(A) ≤µ(B). In this paper, we use the discrete Choquet integral tofuse the multimodal features. The discrete Choquet integral ofa function f : X → R+ with respect to µ is defined by
Cµ(f) :=
n∑i=1
(f(x(i))− f(x(i−1))
)µ(A(i)), (17)
where ·(i) indicates that the indices have been permuted suchthat 0 ≤ f(x(1)) ≤ · · · ≤ f(x(n)), A(i) := {x(i), · · · , x(n)},and f(x(0)) = 0. We utilize the algorithm proposed by Tanakaand Sugeno [44] to calculate the fuzzy measure.
4) BDAE: BDAE was proposed by Ngiam and col-leagues [35]. In our previous work, we adopted BDAE tomultimodal emotion recognition [28]. The BDAE trainingprocedure includes encoding and decoding. In the encodingphase, we train two restricted Boltzmann machines (RBMs) forEEG features and eye movement features. These two hiddenlayers are concatenated together, and the concatenated layeris used as the visual layer of a new upper RBM. In thedecoding stage, we unfold the stacked RBMs to reconstruct theinput features. Finally, we use a back-propagation algorithmto minimize the reconstruction error.
IV. EXPERIMENTAL SETTINGS
In Section 4.1, we introduce the five datasets evaluated inthis paper. In Section 4.2, features extraction methods areintroduced. And experimental settings are presented in Section4.3. Table I shows the summary of datasets and experimentalsettings.
A. Datasets
Five typical multimodal emotion recognition datasets areselected for comparison study in this paper.
1) SEED dataset1: The SEED dataset was developed byZheng and Lu [6]. Fifteen Chinese film clips of three emotions(happy, neutral and sad) were used as stimuli in the experi-ments. Every participant took part in the experiment for threetimes. In this paper, we use the dataset as in our previouswork [24], [28], [29] for the comparison study ( 9 participants,27 sessions).The SEED dataset contains EEG signals and eyemovement signals.
2) SEED-IV dataset: The SEED-IV dataset was first usedin [21]. Seventy-two film clips were chosen as stimulimaterials. The dataset contains emotional EEG signals and eyemovement signals of four different emotions, i.e., happy, sad,neutral, and fear. Fifteen subjects (7 male and 8 female) par-ticipated in the experiments for three sessions were performedon different days.
3) SEED-V dataset: The SEED-V dataset was first usedin [45]. The dataset contains EEG signals and eye movementsignals for five emotions (happy, sad, neutral, fear, and dis-gust). Sixteen subjects (6 male and 10 female) were requiredto watch 15 movie clips (3 clips for each emotion), and eachof them performed the experiment three times. The SEED-V dataset used in this paper will be freely available to theacademic community as a subset of SEED2.
4) DEAP dataset: The DEAP dataset was developed byKoelstra and colleagues [25]. The EEG signals and peripheralphysiological signals of 32 participants were recorded whilewatching music videos. Participants rated each video on levelsof arousal, valence, like/dislike, dominance, and familiarity.
5) DREAMER dataset: The DREAMER dataset is amultimodal emotion dataset developed by Katsigiannis andRamzan [46]. The DREAMER dataset consists of EEG andelectrocardiogram (ECG) signals of 23 subjects (14 males and9 females). The participants watched 18 film clips to elicit 9different emotions. After watching a clip, the self-assessmentmanikins were used to acquire assessments of valence, arousal,and dominance.
B. Feature extraction
1) EEG feature extraction: For EEG signals, we extractdifferential entropy (DE) features using short-term Fouriertransforms with a 4-second Hanning window without over-lapping [47], [48].
We extract DE features from EEG signals (from the SEED,SEED-IV and SEED-V datasets) in five frequency bands for allchannels: delta (1-4 Hz), theta (4-8 Hz), alpha (8-14 Hz), beta(14-31 Hz), and gamma (31-50 Hz). There are in total 62 ×
1http://bcmi.sjtu.edu.cn/home/seed/index.html2http://bcmi.sjtu.edu.cn/home/seed/index.html
This is the author's version of an article that has been published in this journal. Changes were made to this version by the publisher prior to publication.The final version of record is available at http://dx.doi.org/10.1109/TCDS.2021.3071170
Copyright (c) 2021 IEEE. Personal use is permitted. For any other purposes, permission must be obtained from the IEEE by emailing [email protected].

6
TABLE IISUMMARY OF EXTRACTED EYE MOVEMENT FEATURES.
Eye movement parameters Extracted features
Pupil diameter (X and Y)
Mean, standard deviation,DE in four bands(0–0.2Hz,0.2–0.4Hz,0.4–0.6Hz,0.6–1Hz)
Disperson (X and Y) Mean, standard deviationFixation duration (ms) Mean, standard deviationBlink duration (ms) Mean, standard deviation
SaccadeMean and standard deviation ofsaccade duration(ms) andsaccade amplitude(◦)
Event statistics
Blink frequency,fixation frequency,fixation duration maximum,fixation dispersion total,fixation dispersion maximum,saccade frequency,saccade duration average,saccade amplitude average,saccade latency average.
5 = 310 dimensions for 62 EEG channels. The linear dynamicsystem method is used to filter out noise and artifacts [49].
For the DEAP dataset, we extract the DE features from fourfrequency bands: theta, alpha, beta, and gamma (no delta bandbecause the downloaded processed data is filtered to 4-75 Hz.).As a result, there are 128 dimensions for the DE features.
2) ECG feature extraction: In previous work of ECG-basedemotion recognition, researchers extracted time-domain fea-tures, frequency-domain features, and time-frequency-domainfeatures from ECG signals for emotion recognition [46], [50].Since there are no standard frequency separation methods forECG signals [51], we extract the logarithm of the averageenergy of five frequency bands (1– 4 Hz, 5 – 8 Hz, 9 – 14Hz, 15 – 31 Hz, and 32 – 50 Hz) from two ECG channels ofthe DREAMER dataset. As a result, we extract 10-dimensionalfeatures from the ECG signals.
3) Eye movement features: The eye movement featuresextracted from SMI ETG eye-tracking glasses3 contain bothstatistical features and computational features. Table II showsall 33 eye movement features used in this paper.
4) Peripheral physiological signal features: For peripheralphysiological signals from the DEAP dataset, we calculate sta-tistical features in the temporal domain: the maximum value,minimum value, mean value, standard deviation, variance, andsquared sum. For 8 channels of the peripheral physiologicalsignals, we extract 48 (6× 8)-dimensional features.
C. Model training
For the SEED dataset, the DE features of the first 9 movieclips are used as training data, and those of the remaining6 movie clips are used as test data. In this paper, we build‘session-dependent’ models for three emotions (happy, sad,and neutral), which is the same as in our previous work [24],[28], [29]. Since every participant took part in the experimentfor three sessions, and we build a model for every session, wecall the model ‘session-dependent’ as shown in Table I.
3https://en.wikipedia.org/wiki/SensoMotoric Instruments
As can be seen from Table I, the test schemes for differentdatasets are different. The five datasets used in this paper arecollected by different research teams at different times. Thetest schemes for emotion recognition tasks of these datasetsare different in the original papers [6], [21], [45], [25], [46].Most previous studies use the same test schemes as the originalpapers to report a fair comparison. In this paper, we also usethe same test schemes as the original papers to compare ourmethods with the existing methods.
For SEED-IV dataset, we use the data from the first 16trials as the training data and the data from the remaining 8trials as the test data [21]. DCCA is trained under ‘session-dependent’ setting to recognize four emotions (happy, sad,fear, and neutral)
For the SEED-V dataset, the training-testing separationstrategy is the same as that used by Zhao et .al [52]. Weadopt three-fold cross-validation to evaluate the performanceof DCCA on a five emotion (happy, sad, fear, neutral, anddisgust) recognition task. Since the participant watched 15movie clips in one session (the first 5 clips, the middle 5clips and the last 5 clips) and participated in three sessions,we concatenate features of the first 5 clips from three sessions(i.e., we concatenate features extracted from 15 movie clips)as the training data for fold one (with a similar operation forfolds two and three) which is a ‘subject-dependent’ setting.
For the DEAP dataset, we build a subject-dependent modelwith a 10-fold cross-validation on two binary classificationtasks: arousal-level classification and valence-level classifica-tion with a threshold of 5.
For the DREAMER dataset, we utilize leave-one-out cross-validation (i.e., 18-fold validation) to evaluate the performanceof DCCA, BDAE and baseline methods on three binaryclassification tasks (arousal, valence, and dominance), whichis the same as that used by Song et al. [53].
Table III summarizes the DCCA structures for thesedatasets. For all five datasets, the learning rate, batch size,and regulation parameter of DCCA are set to 0.001, 100,and 1e−8, respectively. For BDAE model, we use grid searchto find the best number of neurons in hidden layers (hiddenunits are selected from list [200, 150, 100, 90, 70, 50, 30,20, 15, 10]), and the optimization algorithm is RMSProp withlearning rate 0.001. Classifiers for baseline methods mentionedin Section III-B are linear SVM with the same experimentalsettings as DCCA and BDAE for different datasets.
V. EXPERIMENTAL RESULTS
In this section, we present the experimental results. InSections V-A and V-B, we examine the effectiveness of DCCAon the SEED-V and DREAMER datasets, respectively. In Sec-tion V-C, we compare the recognition performance of DCCA,BDAE, and the traditional multimodal fusion approaches onthe SEED, SEED-IV and DEAP datasets. In Sections V-Dand V-E, we evaluate the robustness of DCCA, BDAE, andtraditional methods on the SEED-V and DREAMER datasets,respectively.
It is worth noting that the weighted-sum fusion method isevaluated on all of the five datasets, while the attention-based
This is the author's version of an article that has been published in this journal. Changes were made to this version by the publisher prior to publication.The final version of record is available at http://dx.doi.org/10.1109/TCDS.2021.3071170
Copyright (c) 2021 IEEE. Personal use is permitted. For any other purposes, permission must be obtained from the IEEE by emailing [email protected].

7
TABLE IIISUMMARY OF THE DCCA STRUCTURES FOR FIVE DIFFERENT DATASETS
Datasets #HiddenLayers #HiddenUnits Output DimensionsSEED 6 400±40, 200±20, 150±20, 120±10, 60±10, 20±2 20SEED-IV 7 400±40, 200±20, 150±20, 120±10, 90±10, 60±10, 20±2 20SEED-V 2 searching for the best numbers between 50 and 200 12DEAP 7 1500±50, 750±50, 500±25, 375±25, 130±20, 65±20, 30±20 20DREAMER 2 searching for the best numbers between 10 and 200 5
method is only evaluated on the SEED-V dataset, and all theanalysis and discussion related to DCCA are based on theweighted-sum fusion method. This is because the SEED-V isa newly developed dataset and we want to give a completecomparison on this dataset. Besides, since the attention-basedfusion can be seen as an adaptive version of the weighted-sumfusion, the effectiveness of attention-based fusion method canbe evaluated on one dataset.
A. Effectiveness Evaluation of DCCA on the SEED-V dataset
We examine the effectiveness of DCCA on the SEED-Vdataset, which contains multimodal signals of five emotions(happy, sad, fear, neutral, and disgust).
1) Output dimension and fusion coefficients: We adopt thegrid search method with output dimensions ranging from 5 to50 and coefficients for the EEG features ranging from 0 to1, i.e. α1 = [0, 0.1, 0.2, · · · , 0.9, 1.0] for DCCA. Since α1 +α2 = 1, we can calculate the weight for the other modalityvia α2 = 1 − α1. Figure 4 shows the heat map of the gridsearch results. Each row gives different output dimensions,and each column is the weight of the EEG features (α1). Thenumbers in blocks are the accuracy rates, which are roundedto integers for simplicity, and the highest accuracy is markedby a small red circle. According to Figure 4, we set the outputdimension to 12 and the weight of the EEG features to 0.7(i.e., α1 = 0.7, α2 = 0.3).
5
10
11
12
13
14
15
20
25
30
35
40
50
0 0.1 0.2 0.3 0.4 0.5 0.6 0.7 0.8 0.9 1.0
Fig. 4. Selection of the best output dimension and EEG weight of DCCA onthe SEED-V dataset. Each row represents the number of output dimensions,and each column denotes the weight (α1) of the EEG features, and the highestrecognition accuracy is marked by a small red circle.
2) Update ratio R selection: According to experimentalsettings mentioned in Section III-A2, the update ratioR rangesfrom 0.1 to 1.0. Table IV shows the emotion recognition accu-racies of SEED-V dataset under different update ratios. From
Disgust
Fear
Fear
Sad
Sad
Neutral
Neutral
Happy
Happy
0.1
0.2
0.3
0.4
0.5
0.6
0.7
0.8
Predicted Label
Tru
e L
abel
Disgust
0.72
0.87
0.08
0.03 0.06 0.01 0.02
0.08 0.03 0.08
0.04 0.05 0.84 0.04 0.03
0.03 0.01 0.06 0.84 0.05
0.04 0.05 0.03 0.03 0.86
Fear Sad Neutral HappyDisgust
Disgust
Fear
Sad
Neutral
Happy
0.56 0.33
0.77 0.80
0.45
0.75
0.68
0.65
0.71
0.78
0.130.14
0.14
0.17
0.15 0.12
0.11 0.01 0.02
0.02
0.030.20
0.09
0.06
0.09
0.12
0.12
0.120.030.12
0.03
0.03
0.05
0.05 0.05
0.05 0.08
0.08 0.18 0.16
0.04
0.04
0.04
0.06 0.06
0.06 0.06 0.07
0.07 0.97
0.58 0.10 0.15
0.03
0.030.04 0.04
0.01
0.01 0.01 0.02
0.01
0.05
0.05 0.05 0.05 0.11
0.08 0.09
0.84
0.88
0.89
0.73
0.07
0.07
(a) EEG (b) Eye
(c) BDAE (d) DCCA
Fig. 5. Comparison of the confusion matrices of different methods on theSEED-V dataset. Subfigures (a), (b), and (c) are the confusion matrices from[52] for SVM classifiers of unimodal features and BDAE model of multimodalfeatures. Subfigure (d) is the confusion matrix of DCCA.
the results, the best performance is obtained with R = 0.7(i.e. γ1 = 0.7 and γ2 = 1.0). So in this paper, we set γ1 = 0.7and γ2 = 1.0. The setting R = 0.7 can effectively balancethe penalty between the CCA loss and the classification loss.Therefore, we use the ratio 0.7 in our further analysis.
TABLE IVEMOTION RECOGNITION ACCURACIES UNDER DIFFERENT UPDATE RATIOS
R (γ1/γ2) 0.1 0.3 0.5 0.7 0.9 1.0Acc (%) 84.5 84.8 84.4 85.3 85.1 84.3Std (%) 5.5 5.2 4.9 5.6 5.5 5.3
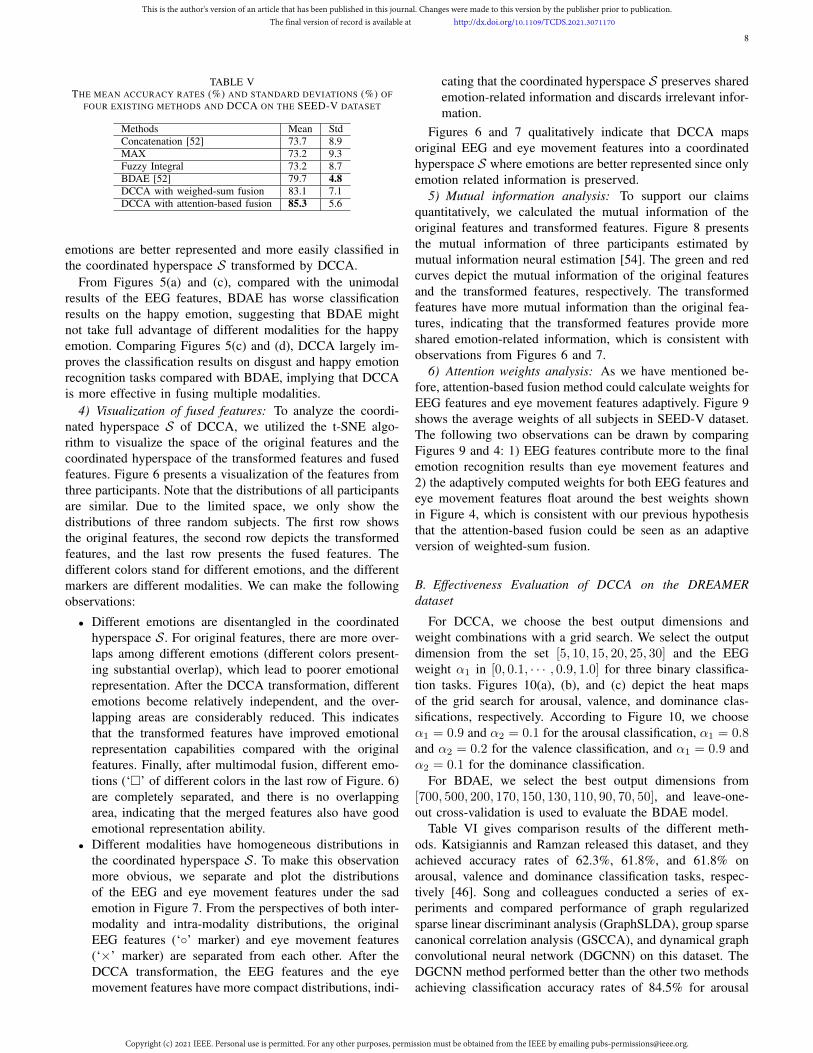
3) Emotion recognition performances: Table V summarizesthe emotion recognition results on the SEED-V dataset. Zhaoand colleagues [52] adopted feature-level concatenation andBDAE for fusing multiple modalities, and achieved meanaccuracy rates of 73.7% and 79.7%, respectively. The MAXfusion and fuzzy integral fusion yielded mean accuracy ratesof 73.2% and 73.2%, respectively. The mean accuracy rate ofDCCA with weighted-sum fusion is 83.1%, and the result forDCCA with attention-based fusion is 85.3% which is the bestresult among the six fusion strategies.
Figure 5 depicts the confusion matrices of different meth-ods. Figures 5(a), (b) and (c) are the confusion matricesfor the EEG features, eye movement features, and BDAE,respectively. Figure 5(d) depicts the confusion matrix forDCCA. From Figures 5(a), (b), and (d), for each of the fiveemotions, DCCA achieves a higher accuracy, indicating that
This is the author's version of an article that has been published in this journal. Changes were made to this version by the publisher prior to publication.The final version of record is available at http://dx.doi.org/10.1109/TCDS.2021.3071170
Copyright (c) 2021 IEEE. Personal use is permitted. For any other purposes, permission must be obtained from the IEEE by emailing [email protected].
8
TABLE VTHE MEAN ACCURACY RATES (%) AND STANDARD DEVIATIONS (%) OF
FOUR EXISTING METHODS AND DCCA ON THE SEED-V DATASET
Methods Mean StdConcatenation [52] 73.7 8.9MAX 73.2 9.3Fuzzy Integral 73.2 8.7BDAE [52] 79.7 4.8DCCA with weighed-sum fusion 83.1 7.1DCCA with attention-based fusion 85.3 5.6
emotions are better represented and more easily classified inthe coordinated hyperspace S transformed by DCCA.
From Figures 5(a) and (c), compared with the unimodalresults of the EEG features, BDAE has worse classificationresults on the happy emotion, suggesting that BDAE mightnot take full advantage of different modalities for the happyemotion. Comparing Figures 5(c) and (d), DCCA largely im-proves the classification results on disgust and happy emotionrecognition tasks compared with BDAE, implying that DCCAis more effective in fusing multiple modalities.
4) Visualization of fused features: To analyze the coordi-nated hyperspace S of DCCA, we utilized the t-SNE algo-rithm to visualize the space of the original features and thecoordinated hyperspace of the transformed features and fusedfeatures. Figure 6 presents a visualization of the features fromthree participants. Note that the distributions of all participantsare similar. Due to the limited space, we only show thedistributions of three random subjects. The first row showsthe original features, the second row depicts the transformedfeatures, and the last row presents the fused features. Thedifferent colors stand for different emotions, and the differentmarkers are different modalities. We can make the followingobservations:
• Different emotions are disentangled in the coordinatedhyperspace S. For original features, there are more over-laps among different emotions (different colors present-ing substantial overlap), which lead to poorer emotionalrepresentation. After the DCCA transformation, differentemotions become relatively independent, and the over-lapping areas are considerably reduced. This indicatesthat the transformed features have improved emotionalrepresentation capabilities compared with the originalfeatures. Finally, after multimodal fusion, different emo-tions (‘�’ of different colors in the last row of Figure. 6)are completely separated, and there is no overlappingarea, indicating that the merged features also have goodemotional representation ability.
• Different modalities have homogeneous distributions inthe coordinated hyperspace S. To make this observationmore obvious, we separate and plot the distributionsof the EEG and eye movement features under the sademotion in Figure 7. From the perspectives of both inter-modality and intra-modality distributions, the originalEEG features (‘◦’ marker) and eye movement features(‘×’ marker) are separated from each other. After theDCCA transformation, the EEG features and the eyemovement features have more compact distributions, indi-
cating that the coordinated hyperspace S preserves sharedemotion-related information and discards irrelevant infor-mation.
Figures 6 and 7 qualitatively indicate that DCCA mapsoriginal EEG and eye movement features into a coordinatedhyperspace S where emotions are better represented since onlyemotion related information is preserved.
5) Mutual information analysis: To support our claimsquantitatively, we calculated the mutual information of theoriginal features and transformed features. Figure 8 presentsthe mutual information of three participants estimated bymutual information neural estimation [54]. The green and redcurves depict the mutual information of the original featuresand the transformed features, respectively. The transformedfeatures have more mutual information than the original fea-tures, indicating that the transformed features provide moreshared emotion-related information, which is consistent withobservations from Figures 6 and 7.
6) Attention weights analysis: As we have mentioned be-fore, attention-based fusion method could calculate weights forEEG features and eye movement features adaptively. Figure 9shows the average weights of all subjects in SEED-V dataset.The following two observations can be drawn by comparingFigures 9 and 4: 1) EEG features contribute more to the finalemotion recognition results than eye movement features and2) the adaptively computed weights for both EEG features andeye movement features float around the best weights shownin Figure 4, which is consistent with our previous hypothesisthat the attention-based fusion could be seen as an adaptiveversion of weighted-sum fusion.
B. Effectiveness Evaluation of DCCA on the DREAMERdataset
For DCCA, we choose the best output dimensions andweight combinations with a grid search. We select the outputdimension from the set [5, 10, 15, 20, 25, 30] and the EEGweight α1 in [0, 0.1, · · · , 0.9, 1.0] for three binary classifica-tion tasks. Figures 10(a), (b), and (c) depict the heat mapsof the grid search for arousal, valence, and dominance clas-sifications, respectively. According to Figure 10, we chooseα1 = 0.9 and α2 = 0.1 for the arousal classification, α1 = 0.8and α2 = 0.2 for the valence classification, and α1 = 0.9 andα2 = 0.1 for the dominance classification.
For BDAE, we select the best output dimensions from[700, 500, 200, 170, 150, 130, 110, 90, 70, 50], and leave-one-out cross-validation is used to evaluate the BDAE model.
Table VI gives comparison results of the different meth-ods. Katsigiannis and Ramzan released this dataset, and theyachieved accuracy rates of 62.3%, 61.8%, and 61.8% onarousal, valence and dominance classification tasks, respec-tively [46]. Song and colleagues conducted a series of ex-periments and compared performance of graph regularizedsparse linear discriminant analysis (GraphSLDA), group sparsecanonical correlation analysis (GSCCA), and dynamical graphconvolutional neural network (DGCNN) on this dataset. TheDGCNN method performed better than the other two methodsachieving classification accuracy rates of 84.5% for arousal
This is the author's version of an article that has been published in this journal. Changes were made to this version by the publisher prior to publication.The final version of record is available at http://dx.doi.org/10.1109/TCDS.2021.3071170
Copyright (c) 2021 IEEE. Personal use is permitted. For any other purposes, permission must be obtained from the IEEE by emailing [email protected].

9
-40
40
-20
0
20
Original Features
DCCA Transfromed Features
DCCA Fused Features
Sub-01 Sub-02 Sub-03
EEG
Eye
HappySadNeutralDisgustFear
Fused
-40
40
-20
0
20
-40
40
-20
0
20
-40 40-20 0 20 -40 40-20 0 20 -40 40-20 0 20
Fig. 6. Feature distribution visualization by the t-SNE algorithm. The original features, transformed features, and fused features from the three subjects arepresented. The different colors stand for different emotions, and the different markers indicate different features.
-40 40-20 0 20
Original Features
DCCA Transfromed Features
-40 40-20 0 20
EEG
Eye
Sad
-40
40
-20
0
20
-40
40
-20
0
20
-40 40-20 0 20
Sub 1 Sub 2 Sub 3
Fig. 7. Distributions of EEG and eye movement features for the sad emotion. The transformed features have more compact distributions from both inter-modality and intra-modality perspectives.
classification, 86.2% for valence classification, and 85.0% fordominance classification [53]. For the concatenation fusionmethod, the emotion recognition accuracies are 71.4%, 70.1%,and 71.3% for arousal, valence, and dominance classificationtasks, respectively. For the MAX fusion method, the emotionrecognition accuracies are 72.7%, 72.2%, and 74.3% forarousal, valence, and dominance classification tasks, respec-tively. The fuzzy integral fusion method achieves 75.7%,72.4%, and 77.4% accuracies for arousal, valence, and domi-nance classification tasks, respectively. From Table VI, we cansee that BDAE and DCCA adopted in this paper outperformDGCNN. For BDAE, the recognition results for arousal,valence, and dominance are 88.6%, 86.6%, and 89.5%, respec-tively. DCCA achieves the best performance among all sevenmethods: 89.0%, 90.6%, and 90.7% for arousal, valence, and
dominance level recognitions, respectively.
C. Recognition Performance ComparisonIn this section, we present experimental results of DCCA
and BDAE on the SEED, SEED-IV, and DEAP datasets. TableVII lists the results obtained by seven existing methods andDCCA on the SEED dataset.
Lu and colleagues applied concatenation fusion, MAXfusion and fuzzy integral to fuse multiple modalities anddemonstrated that the fuzzy integral fusion method achievedthe accuracy of 87.6% [24]. Tang et al. [29] adopted bimodalLSTM, obtaining accuracy 94.0%. Recently, Yang and col-leagues [8] build a single-layer feedforward network (SLFN)with subnetwork nodes and achieved an accuracy of 91.5%.Song and colleagues [53] proposed DGCNN and obtained a
This is the author's version of an article that has been published in this journal. Changes were made to this version by the publisher prior to publication.The final version of record is available at http://dx.doi.org/10.1109/TCDS.2021.3071170
Copyright (c) 2021 IEEE. Personal use is permitted. For any other purposes, permission must be obtained from the IEEE by emailing [email protected].

10
20k 40k 60k 80k03.0
3.2
3.4
3.6
3.8
4.2
4.4
4.0
a) Sub 1 b) Sub 2 c) Sub 3
Original FeaturesDCCA transformed Features
20k 40k 60k 80k0 20k 40k 60k 80k0
Fig. 8. Mutual information (MI) estimation with MINE. The green curveshows the estimated MI for the original EEG features and eye movementfeatures. The red curve depicts the MI for the transformed features. The xaxis is the epoch number of the deep neural network used to estimate MI, andthe y axis is the estimated MI. Moving average smoothing is used to smooththe curves.
0.2
0.4
0.6
0.8
0 250 500 750 1000 1250 1500 1750
Att
enti
on W
eights
EEG weight Eye weight
Fig. 9. Visualization of weights calculated by attention-based fusion method.The y-axis shows the calculated weights for different modalities, and the x-axis shows different test samples in the datasets. Red dots stands for EEGweights and blue dots are weights for eye movement features. Similar toFigure 4, EEG features contribute more to the final recognition results andthe average weights for all EEG features and eye movement features are alsosimilar to results shown in Figure 4.
classification accuracy of 90.4%. In our previous work [28],BDAE method obtained 91.0% accuracy. From Table VII, wecan see that DCCA achieves the best result of 94.6% amongthe eight different methods.
Table VIII gives the results of five different methods on theSEED-IV dataset. We can observe from Table VIII that forSVM classifier with concatenation fusion, MAX fusion andfuzzy integral fusion, the four emotion states are recognizedwith a 77.6% mean accuracy rate at the very most. BDAEobtains a mean accuracy rate of 85.1%. DCCA outperforms theaforementioned two methods, with an 87.5% mean accuracyrate.
For DEAP dataset, Table IX shows the results of twobinary classifications. As we can observe, DCCA achieves thebest results in both arousal classification (84.3%) and valenceclassification (85.6%) tasks.
From the experimental results mentioned above, we can seethat DCCA outperforms BDAE and the existing methods onthe SEED, SEED-IV, and DEAP datasets.
D. Robustness Analysis on the SEED-V Dataset
EEG signals have a low signal-to-noise ratio (SNR) andare easily interfered with by external environmental noise. Tocompare the noise robustness of DCCA with that of BDAEand the traditional multimodal fusion methods, we designedtwo experimental schemes on noisy datasets:• We added Gaussian noise of different variances to both
the EEG and eye movement features. To highlight theinfluence of noise, we added noise to the normalizedfeatures since the directly extracted features are much
(a) Arousal
0 0.1 0.2 0.3 0.4 0.5 0.6 0.7 0.8 0.9 1.0
(b) Valence
(c) Dominance
5
10
15
20
25
30
5
10
15
20
25
30
5
10
15
20
25
30
Fig. 10. Selecting the best output dimension and weight combinations ofDCCA on the DREAMER dataset. The X-axis represents the weight for theEEG features, and the Y -axis represents the output dimensions. The highestrecognition accuracies are marked by a small red circle.
TABLE VICOMPARISON OF RECOGNITION ACCURACY (MEAN/STD, %) ON THEDREAMER DATASET. THREE BINARY CLASSIFICATION TASKS ARE
EVALUATED: AROUSAL-LEVEL, VALENCE-LEVEL, ANDDOMINANCE-LEVEL CLASSIFICATIONS. ‘–’ MEANS THE RESULT IS NOT
REPORTED.
Methods Arousal Valence DominanceSVM [46] 62.3/– 62.5/– 61.8/–SVM [53] 68.8/24.9 60.1/33.3 75.8/20.8GraphSLDA [53] 68.1/17.5 57.7/13.9 73.9/15.9GSCCA [53] 70.3/18.7 56.7/21.5 77.3/15.4DGCNN [53] 84.5/10.2 86.2/12.3 85.0/10.3Concatenation 71.4/8.2 70.1/10.8 71.3/9.7Max 72.7/8.4 72.2/7.6 74.3/6.7Fuzzy Integral 75.7/7.2 72.4/8.9 77.4/6.6BDAE 88.6/4.4 86.6/7.5 89.5/6.2DCCA 89.0/2.8 90.6/4.1 90.7/4.3
TABLE VIITHE MEAN ACCURACY RATES (%) AND STANDARD DEVIATIONS (%) OF
SEVEN EXISTING METHODS AND DCCA ON THE SEED DATASET. ‘–’MEANS THE RESULT IS NOT REPORTED.
Methods Mean StdConcatenation [24] 83.7 –MAX [24] 81.7 –Fuzzy Integral [24] 87.6 19.9DGCNN [53] 90.4 8.5SLFN with subnetwork nodes [8] 91.5 –Bimodal-LSTM [29] 94.0 7.0BDAE [28] 91.0 8.9DCCA 94.6 6.2
TABLE VIIITHE MEAN ACCURACY RATES (%) AND STANDARD DEVIATIONS (%) OF
FOUR EXISTING METHODS AND DCCA ON THE SEED-IV DATASET
Methods Mean StdConcatenation 77.6 16.4MAX 60.0 17.1Fuzzy Integral 73.6 16.7BDAE [21] 85.1 11.8DCCA 87.5 9.2
This is the author's version of an article that has been published in this journal. Changes were made to this version by the publisher prior to publication.The final version of record is available at http://dx.doi.org/10.1109/TCDS.2021.3071170
Copyright (c) 2021 IEEE. Personal use is permitted. For any other purposes, permission must be obtained from the IEEE by emailing [email protected].

11
TABLE IXTHE MEAN ACCURACY RATES (%) AND STANDARD DEVIATION (%) OF
THREE EXISTING METHODS AND DCCA FOR THE TWO BINARY EMOTIONCLASSIFICATION TASKS ON THE DEAP DATASET. ‘–’ MEANS THE RESULT
IS NOT REPORTED.
Methods Arousal ValenceMESAE [31] 84.2/– 83.0/–Bimodal-LSTM [29] 83.2/2.6 83.8/5.0BDAE [28] 80.5/3.4 85.2/4.5DCCA 84.3/2.3 85.6/3.5
larger than the generated noise (which is mostly less than1).
• Under certain extreme conditions, EEG signals may beoverwhelmed by noise. To simulate this situation, werandomly replace different proportions (10%, 30%, and50%) of EEG features with noise under a normal distribu-tion (X ∼ N (0, 1)), gamma distribution (X ∼ Γ(1, 1)),and uniform distribution (X ∼ U [0, 1]).
We compare the performance of three different combinationsof coefficients, i.e., α1 = 0.3 (DCCA-0.3), α1 = 0.5 (DCCA-0.5), and α1 = 0.7 (DCCA-0.7). The reason for choosingthese three coefficients combination is that we want to examinethe effect of different weight coefficients on the robustness ofDCCA. The EEG coefficients of 0.3, 0.5 and 0.7 representsettings where EEG features contribute less than, equal to andlarger than eye movement features, respectively.
1) Adding Gaussian noise: First, we investigate the robust-ness of different weight combinations in DCCA after addingGaussian noise of different variances to both the EEG and eyemovement features. Figure 11(a) depicts the results. Althoughthe model achieves the highest classification accuracy whenthe EEG weight is set to 0.7, it is also more susceptible tonoise. The robustness of the model decreases as the weightof the EEG features increases. Since a larger EEG weightleads to more EEG components in the fused features, we mightconclude that EEG features are more sensitive to noise thanare eye movement features.
Next, we compare the robustness of different models underGaussian noise with different variances. Taking both classifi-cation performance and robustness into consideration, we useDCCA with an EEG weight set to 0.5. Figure 11(b) showsthe performance of the various models. The performancedecreases with increasing variances of the Gaussian noise.DCCA obtains the best performance when the noise is lowerthan or equal toN (0, 1). The performance of the fuzzy integralfusion strategy exceeds DCCA when the noise is strongerthan or equal to N (0, 3). The accuracy rates of BDAE greatlyreduced even when minimal noise is added.
2) Replacing EEG features with noise: Table X shows thedetailed emotion recognition accuracies and standard devi-ations after replacing 10%, 30%, and 50% percent of theEEG features with different noise distributions. The recog-nition accuracies decrease with increasing noise proportions.In addition, the performances of seven different settings underdifferent noise distributions are very similar, indicating thatnoise distributions have limited influences on the recognitionaccuracies.
30
40
50
60
70
80
Acc
ura
cy (
%)
DCCA-0.5
DCCA-0.7
DCCA-0.3
30
40
50
60
70
80
Acc
ura
cy (
%)
DCCA-0.5
BDAE
ConcatMax
Fuzzy
(a) DCCA of different weights (b) Robustness of various methods
NoNoise N(0, 0.25) N(0, 0.5) N(0, 1) N(0, 3) N(0, 5) NoNoise N(0, 0.25) N(0, 0.5) N(0, 1) N(0, 3) N(0, 5)
Fig. 11. Performance on the SEED-V dataset of (a) DCCA with differentweights and (b) various methods when adding Gaussian noise of differentvariances.
To better observe the changing tendency, we plot the averagerecognition accuracies under different noise distributions withthe same noise ratio. Figure 12(a) shows the average accuraciesfor DCCA with different EEG weights. It is obvious that theperformance decreases with increasing noise percentages andthat the model robustness is inversely proportional to the ratioof the EEG modality. This is the expected performance. Sincewe only randomly replace EEG features with noise, largerEEG weights will introduce more noises to the fused features,resulting in a decrease in model robustness.
Similar to Figure 11(b), we also take DCCA-0.5, as acompromise between performance and robustness to comparewith other multimodal fusion methods. Figure 12(b) depictsthe trends of the accuracies of several models. It is obvi-ous that DCCA performs the best, the concatenation fusionachieves a slightly better performance than the fuzzy integralfusion method, and the BDAE model again presents the worstperformance.
Combining Figures 11 and 12, DCCA obtains the bestperformance under most noisy situations, whereas BDAEperforms the worst under noisy conditions. This might becaused by the following:
• As already discussed in previous sections, DCCA attempsto preserve emotion-related information and discard ir-relevant information. This property prevents the modelperformance from rapidly deteriorating by neglectingnegative information introduced by noise.
• BDAE minimizes the mean squared error which is sensi-tive to outliers [55]. The noisy training features will causethe weights to deviate from the normal range, resultingin a rapid decline in model performance.
no_noise 10% 30% 50%
60
65
70
75
80DCCA-0.5DCCA-0.7
DCCA-0.3
Acc
ura
cy (
%)
50
55
45
60
65
70
75
80DCCA-0.5
BDAE
ConcatMax
Fuzzy
Acc
ura
cy (
%)
no_noise 10% 30% 50%
(a) DCCA of different weights (b) Robustness of various methods
Fig. 12. Performance on the SEED-V dataset of (a) DCCA with differentwieghts and (b) various methods after replacing the EEG features with noise.
This is the author's version of an article that has been published in this journal. Changes were made to this version by the publisher prior to publication.The final version of record is available at http://dx.doi.org/10.1109/TCDS.2021.3071170
Copyright (c) 2021 IEEE. Personal use is permitted. For any other purposes, permission must be obtained from the IEEE by emailing [email protected].

12
TABLE XRECOGNITION ACCURACY (MEAN/STD (%)) ON THE SEED-V DATASET AFTER REPLACING DIFFERENT PROPORTIONS OF EEG FEATURES WITH VARIOUS
TYPES OF NOISE. FIVE FUSION STRATEGIES UNDER VARIOUS SETTINGS ARE COMPARED, AND THE BEST RESULTS FOR EACH SETTING ARE IN BOLD.
Methods No noise Gaussian Gamma Uniform10% 30% 50% 10% 30% 50% 10% 30% 50%
Concatenation 73.7/8.9 70.1/8.9 63.1/9.1 58.3/7.5 69.7/8.5 62.9/8.5 57.00/8.1 71.2/10.6 66.5/9.4 61.8/8.4MAX 73.2/9.3 67.7/8.4 58.3/8.4 51.1/7.0 67.2/10.3 59.2/9.8 50.6/6.8 67.5/9.7 60.1/9.3 52.7/7.8Fuzzy Integral 73.2/8.7 69.4/8.9 63.0/7.5 57.7/8.7 69.4/8.7 62.6/8.9 57.6/7.2 69.2/8.2 64.9/9.4 60.5/8.3BDAE 79.7/4.8 47.8/7.8 45.9/7.8 44.5/7.4 45.3/6.7 45.8/7.9 45.1/8.4 46.1/8.2 46.9/7.1 45.5/9.6DCCA-0.3 79.0/7.3 76.6/7.6 73.0/7.4 69.6/7.0 76.9/8.0 73.1/7.0 70.0/7.2 75.7/6.3 73.2/6.5 70.0/6.7DCCA-0.5 81.6/7.0 77.9/6.6 71.8/6.6 65.2/6.2 78.3/7.4 72.5/6.1 65.8/6.1 78.3/7.2 73.2/7.0 68.0/7.1DCCA-0.7 83.1/7.1 76.3/7.0 68.5/5.5 57.6/5.2 76.8/7.0 68.5/6.0 58.6/5.4 77.4/8.4 69.8/5.6 61.6/5.4
E. Robustness Analysis on the DREAMER Dataset
In this section, we present the comparison results of ro-bustness of different methods on arousal classification, va-lence classification, and dominance classification tasks onthe DREAMER dataset. Similar to previous settings in Sec-tion V-D, we also evaluate the robustness performance undertwo experimental settings: adding Gaussian noises to bothEEG and ECG features and replacing EEG features with noisesof Gaussian distribution, gamma distribution, and uniform dis-tribution. For DCCA, we evaluate the robustness performanceunder the best coefficients combination, i.e. α1 = 0.9 forarousal classification, α1 = 0.8 for valence classification andα1 = 0.9 for dominance classification.
1) Adding Gaussian noise: We compare therobustness of different multimodal fusion methods afteradding Gaussian noises of different standard deviation(N(0, 0.25), N(0, 0.5), N(0, 0.1), N(0, 0.3), N(0, 0.5)) toboth EEG and ECG features. Table XI shows the resultsof arousal, valence and dominance classification tasks afteradding various Gaussian noises. From Table XI, we observethat the model performance decreases with the noise standarddeviations become larger. In addition, DCCA has betterrobustness performance than other methods, and BDAE alsohas a worse performance compared with other methods. Thetrends of robustness performance of different methods areconsistent in all the three tasks.
To better compare the overall performance of differentmethods, we calculate the average accuracies of all threebinary classification tasks under different noise standard de-viations. Figure 13(a) shows the average curves of these fivemultimodal fusion methods. From Figure 13(a), it is obviousthat DCCA has the best robustness performance, BDAE hasthe worst performance, and the concatenation fusion, MAXfusion, and the fuzzy integral methods have similar robustnessperformance.
Comparing Figure 13(a) and Figure 11(b), the curves inFigure 13(a) change smoother than curves in Figure 11(b)which might be related to the characteristics of differentdatasets. Since the tasks of the DREAMER dataset are bi-nary classifications, the worst recognition accuracies of noiseclassifiers tend to be maintained at around 50% leading to astable change in Figure 13(a).
2) Replacing EEG features with noises: Table XII showsthe results of replacing 10%, 30%, and 50% percent ofEEG features with Gaussian, Gamma, and Uniform noises for
50
60
70
80DCCA
BDAE
ConcatMax
Fuzzy
Acc
ura
cy (
%)
90
60
65
55
70
75
80
85
90
NoNoise 10% 30% 50%
Acc
ura
cy (
%)
95
NoNoise N(0, 0.25) N(0, 0.5) N(0, 1) N(0, 3) N(0, 5)
DCCA
BDAE
ConcatMax
Fuzzy
(a) Adding noises to EEG and eye movement features (b) Replacing EEG features with noises
Fig. 13. Model performance on the DREAMER dataset after (a) addingGaussian noise of different variances and (b) replacing EEG features withnoises. The curves shows the average performance of the three binaryclassification tasks. The x-axis is the type of the Gaussian noise, and they-axis stands for the mean accuracies.
arousal classification, valence classification, and dominanceclassification. The influences brought by noise types are notvery obvious which is consistent with trends shown in Table X.
To better depict the performance of different methods foreach of the three binary classification tasks, we first calculatethe average performance of the same noise percentage overdifferent noise types and then we calculate the average perfor-mance over all three classification tasks. The averaged resultsas depicted in Figure 13(b). From Figure 13(b), we can seethat DCCA performs best since the accuracy reduction is lessthan other methods, while BDAE has the largest performancegap suggesting a poor robustness. For traditional fusion meth-ods, the fuzzy integral method has better performance thanconcatenation and MAX fusion methods.
VI. CONCLUSIONS AND FUTURE WORK
In this paper, we have systematically examined the recogni-tion performance of DCCA, BDAE and traditional methods onfive typical multimodal emotion datasets. Particularly, we haveproposed two multimodal fusion strategies to extend the orig-inal DCCA: a weighted-sum fusion strategy and an attention-based fusion strategy. Our experimental results demonstratethat DCCA is superior to BDAE and the traditional methodsfor multimodal emotion recognition on all five datasets, andthat the attention-based fusion strategy performs better thanweighted-sum fusion.
We have analyzed weights from both the weighted-sumfusion strategy and the attention-based fusion strategy. Our ex-perimental results demonstrate that the attention-based fusionstrategy can be seen as an adaptive version of the weighted-sum fusion strategy, where the weights calculated by the
This is the author's version of an article that has been published in this journal. Changes were made to this version by the publisher prior to publication.The final version of record is available at http://dx.doi.org/10.1109/TCDS.2021.3071170
Copyright (c) 2021 IEEE. Personal use is permitted. For any other purposes, permission must be obtained from the IEEE by emailing [email protected].

13
TABLE XIRECOGNITION ACCURACY (MEAN/STD (%)) FOR AROUSAL, VALENCE, AND DOMINANCE CLASSIFICATION TASKS OF THE DREAMER DATASET
AFTER ADDING GAUSSIAN NOISES OF DIFFERENT STANDARD DEVIATIONS TO BOTH EEG AND ECG FEATURES.
Methods No noise N(0, 0.25) N(0, 0.5) N(0, 1) N(0, 3) N(0, 5)
Arousal
Concatenation 71.4/8.2 54.0/5.3 53.6/5.8 53.4/7.5 52.7/12.6 52.2/16.9MAX 72.7/8.4 60.1/4.8 56.9/8.1 56.2/10.0 55.7/15.1 55.6/17.4Fuzzy Integral 75.7/7.2 62.9/5.6 62.6/6.6 62.3/7.6 62.2/8.8 61.9/9.7BDAE 88.6/4.4 68.8/7.8 66.8/3.8 67.0/4.6 58.6/15.0 58.6/15.3DCCA-0.9 89.0/2.8 87.1/2.8 87.0/2.6 85.0/2.2 83.2/3.3 82.8/3.4
Valence
Concatenation 70.1/10.8 53.7/4.1 53.5/4.8 53.4/6.0 53.3/10.0 52.2/14.5MAX 72.2/7.6 54.7/4.1 54.5/5.0 54.4/8.5 54.0/15.1 53.5/18.8Fuzzy Integral 72.4/8.9 60.3/4.6 58.9/5.2 58.8/7.1 58.4/11.1 57.6/14.1BDAE 86.6/7.5 65.0/8.8 65.6/5.9 64.4/9.2 51.3/22.7 49.9/24.7DCCA-0.8 90.6/4.1 85.8/2.9 84.8/2.7 84.4/3.1 83.1/4.7 82.2/6.1
Dominance
Concatenation 71.3/9.7 53.5/3.9 52.9/5.2 52.5/6.6 52.4/10.9 52.0/14.1MAX 74.3/6.7 54.7/5.5 54.6/6.3 54.3/8.5 54.0/14.2 53.7/17.1Fuzzy Integral 77.4/6.6 62.6/6.0 62.5/7.0 62.3/8.2 61.8/8.3 60.8/9.1BDAE 89.5/6.2 68.9/10.4 66.3/5.4 65.9/7.2 60.7/11.6 58.8/11.2DCCA-0.9 90.7/4.3 86.9/3.3 86.7/3.1 84.5/1.8 82.7/3.8 82.6/3.7
TABLE XIIRECOGNITION ACCURACY (MEAN/STD (%)) FOR AROUSAL, VALENCE, AND DOMINANCE CLASSIFICATION TASKS OF THE DREAMER DATASET
AFTER REPLACING DIFFERENT PROPORTIONS OF EEG FEATURES WITH VARIOUS TYPES OF NOISE.
Methods No noise Gaussian Gamma Uniform10% 30% 50% 10% 30% 50% 10% 30% 50%
Arousal
Concatenation 71.4/6.2 61.1/4.8 59.1/5.4 58.7/5.1 61.2/5.9 60.8/5.3 60.7/5.6 60.4/6.0 59.4/5.3 59.0/5.8MAX 72.7/8.4 60.6/6.6 59.6/6.9 58.1/6.3 61.3/6.8 59.5/6.9 58.2/5.8 60.7/7.4 60.3/7.1 58.9/7.1Fuzzy Integral 75.7/7.2 69.5/4.8 67.9/5.6 66.5/6.3 69.5/5.2 68.3/6.2 66.8/6.7 68.7/5.5 67.3/5.6 67.1/5.8BDAE 88.6/4.4 73.8/6.9 73.5/6.4 68.9/7.0 70.6/11.5 70.0/8.3 69.5/7.8 69.5/11.7 68.9/10.0 67.5/9.9DCCA-0.9 89.0/2.8 89.1/2.5 87.7/2.4 85.7/2.8 88.6/2.1 87.3/2.2 86.1/2.6 87.6/2.6 86.9/2.4 85.7/2.2
Valance
Concatenation 70.1/10.8 60.1/4.5 58.5/4.1 58.1/4.1 60.0/4.9 59.0/4.4 58.5/4.2 60.5/3.8 59.2/4.1 57.2/4.2MAX 72.2/7.6 59.5/4.8 58.1/4.6 57.8/5.3 59.2/5.2 57.8/5.1 56.4/5.6 58.3/4.9 57.4/4.5 57.0/5.5Fuzzy Integral 72.4/8.9 68.9/4.7 67.8/5.0 66.7/6.3 68.6/4.3 68.3/5.4 67.4/6.8 67.1/4.6 66.9/4.4 66.7/5.4BDAE 86.6/7.5 75.1/8.1 70.7/8.7 65.2/8.7 69.9/10.1 68.4/9.9 66.4/10.1 68.6/10.0 67.2/11.0 65.3/10.6DCCA-0.8 90.6/4.1 87.2/2.7 86.4/2.8 85.0/2.7 88.3/3.2 86.8/3.0 85.4/3.0 87.8/2.8 86.6/3.1 85.5/2.9
Dominance
Concatenation 71.3/9.7 60.7/5.8 60.4/5.2 60.3/5.6 60.5/5.0 60.4/5.5 60.4/5.9 60.8/5.4 60.5/5.0 60.1/4.8MAX 74.3/6.7 60.2/5.9 59.5/6.2 58.7/6.3 60.7/6.5 59.6/6.6 58.8/5.9 59.8/5.7 59.0/5.8 58.3/6.7Fuzzy Integral 77.4/6.6 69.6/4.8 67.4/4.7 66.9/5.8 69.6/4.8 69.6/4.8 67.0/6.2 69.2/4.6 69.1/4.3 68.7/4.8BDAE 89.5/6.2 76.9/8.0 71.1/9.3 67.9/9.0 71.4/9.7 70.1/9.2 67.3/8.7 70.0/10.0 66.9/11.5 65.0/10.3DCCA-0.9 90.7/4.3 88.9/3.5 86.8/2.2 85.7/2.8 89.0/8.9 86.6/2.5 85.9/2.5 88.5/4.4 86.6/2.9 85.9/1.9
attention-based fusion float around the best weights from theweighted-sum fusion.
We have analyzed properties of the transformed featuresin the coordinated hyperspace of DCCA. By applying the t-SNE method, we have found qualitatively that: 1) differentemotions are better represented since they are disentangledin the coordinated hyperspace; and 2) different modalitieshave compact distributions from both inter-modality and intra-modality perspectives. Our experimental results indicate thatthe features transformed by DCCA have higher mutual in-formation, indicating that DCCA transformation processespreserve emotion-related information and discard irrelevantinformation.
We have compared the robustness of DCCA and BDAEon the SEED-V and DREAMER datasets under two schemes:1) adding Gaussian noise of different variances to both EEGand eye movement features (or ECG features) and 2) replacing10%, 30%, and 50% percentage of EEG features with differenttypes of noise, the experimental results indicate that DCCApossesses the strongest robustness to noise data among all ofthe methods.
Although our extensive comparison results indicate that
DCCA in recognition performance and robustness is signif-icantly superior to both BDAE and the traditional multimodalfusion methods for multimodal emotion recognition, there isstill room for improvement in the following aspects. 1) TheCCA metric used in this paper can fuse only two modal-ities which limits the application of the DCCA method inreal life where more than two modalities might be fusedsimultaneously. We have achieved some preliminary resultsby extending CCA metric to generalized CCA metric [56]. Inthe future, we will evaluate the performance and robustness ofattention-based deep generalized CCA method to fuse differentmodalities on more datasets. 2) Only one simple attentionmechanism was used in this paper. In the future, we willexplore different types of attention mechanisms such as co-attention mechanism [57]. 3) We will investigate multimodalfusion strategies by applying tensor-based fusion [58], [59],[60] and generative adversarial networks [61] in the future.
REFERENCES
[1] R. W. Picard, Affective Computing. MIT press, 2000.[2] M. M. Shanechi, “Brain-machine interfaces from motor to mood,”
Nature Neuroscience, vol. 22, no. 10, pp. 1554–1564, 2019.
This is the author's version of an article that has been published in this journal. Changes were made to this version by the publisher prior to publication.The final version of record is available at http://dx.doi.org/10.1109/TCDS.2021.3071170
Copyright (c) 2021 IEEE. Personal use is permitted. For any other purposes, permission must be obtained from the IEEE by emailing [email protected].

14
[3] A. S. Widge, D. A. Malone Jr, and D. D. Dougherty, “Closing the loopon deep brain stimulation for treatment-resistant depression,” Frontiersin Neuroscience, vol. 12, p. 175, 2018.
[4] B. Ko, “A brief review of facial emotion recognition based on visualinformation,” Sensors, vol. 18, no. 2, p. 401, 2018.
[5] A. Yadollahi, A. G. Shahraki, and O. R. Zaiane, “Current state of textsentiment analysis from opinion to emotion mining,” ACM ComputingSurveys (CSUR), vol. 50, no. 2, p. 25, 2017.
[6] W.-L. Zheng and B.-L. Lu, “Investigating critical frequency bandsand channels for EEG-based emotion recognition with deep neuralnetworks,” IEEE Transactions on Autonomous Mental Development,vol. 7, no. 3, pp. 162–175, 2015.
[7] W.-L. Zheng, J.-Y. Zhu, and B.-L. Lu, “Identifying stable patterns overtime for emotion recognition from eeg,” IEEE Transactions on AffectiveComputing, vol. 10, no. 3, pp. 417–429, 2019.
[8] Y. Yang, Q. J. Wu, W.-L. Zheng, and B.-L. Lu, “EEG-based emotionrecognition using hierarchical network with subnetwork nodes,” IEEETransactions on Cognitive and Developmental Systems, vol. 10, no. 2,pp. 408–419, 2018.
[9] Z. Yin, Y. Wang, L. Liu, W. Zhang, and J. Zhang, “Cross-subject EEGfeature selection for emotion recognition using transfer recursive featureelimination,” Frontiers in Neurorobotics, vol. 11, p. 19, 2017.
[10] R. Fourati, B. Ammar, J. Sanchez-Medina, and A. M. Alimi, “Un-supervised learning in reservoir computing for EEG-based emotionrecognition,” IEEE Transactions on Affective Computing, pp. 1–1, 2020.
[11] X.-W. Wang, D. Nie, and B.-L. Lu, “Emotional state classification fromEEG data using machine learning approach,” Neurocomputing, vol. 129,pp. 94–106, 2014.
[12] Y. Li, W. Zheng, L. Wang, Y. Zong, and Z. Cui, “From regional to globalbrain: A novel hierarchical spatial-temporal neural network model forEEG emotion recognition,” IEEE Transactions on Affective Computing,pp. 1–1, 2019.
[13] X. Wu, W.-L. Zheng, and B.-L. Lu, “Identifying functional brainconnectivity patterns for EEG-based emotion recognition,” in 2019 9thInternational IEEE/EMBS Conference on Neural Engineering (NER).IEEE, 2019, pp. 235–238.
[14] Z. Guo, X. Wu, J. Liu, L. Yao, and B. Hu, “Altered electroencephalog-raphy functional connectivity in depression during the emotional face-word stroop task,” Journal of Neural Engineering, vol. 15, no. 5, p.056014, jul 2018.
[15] J. Li, S. Qiu, Y. Shen, C. Liu, and H. He, “Multisource transfer learningfor cross-subject EEG emotion recognition,” IEEE Transactions onCybernetics, vol. 50, no. 7, pp. 3281–3293, 2020.
[16] M. G. Machizawa, G. Lisi, N. Kanayama, R. Mizuochi, K. Makita,T. Sasaoka, and S. Yamawaki, “Quantification of anticipation of excite-ment with a three-axial model of emotion with EEG,” Journal of NeuralEngineering, vol. 17, no. 3, p. 036011, jun 2020.
[17] Y. Zhang, B. Liu, and X. Gao, “Spatiotemporal dynamics of workingmemory under the influence of emotions based on EEG,” Journal ofNeural Engineering, vol. 17, no. 2, p. 026039, apr 2020.
[18] J. Kim and E. Andre, “Emotion recognition based on physiologicalchanges in music listening,” IEEE Transactions on Pattern Analysis andMachine Intelligence, vol. 30, pp. 2067–2083, 2008.
[19] M. L.-H. Vo, A. M. Jacobs, L. Kuchinke, M. Hofmann, M. Conrad,A. Schacht, and F. Hutzler, “The coupling of emotion and cognition inthe eye: Introducing the pupil old/new effect,” Psychophysiology, vol. 45,no. 1, pp. 130–140, 2008.
[20] S. Poria, E. Cambria, R. Bajpai, and A. Hussain, “A review of affectivecomputing: from unimodal analysis to multimodal fusion,” InformationFusion, vol. 37, pp. 98–125, 2017.
[21] W.-L. Zheng, W. Liu, Y.-F. Lu, B.-L. Lu, and A. Cichocki, “Emotion-meter: A multimodal framework for recognizing human emotions,” IEEETransactions on Cybernetics, vol. 49, no. 3, pp. 1110–1122, March 2019.
[22] M. Soleymani, M. Pantic, and T. Pun, “Multimodal emotion recognitionin response to videos,” IEEE Transactions on Affective Computing,vol. 3, no. 2, pp. 211–223, April 2012.
[23] A. Mollahosseini, B. Hasani, and M. H. Mahoor, “Affectnet: A databasefor facial expression, valence, and arousal computing in the wild,” IEEETransactions on Affective Computing, vol. 10, no. 1, pp. 18–31, Jan 2019.
[24] Y.-F. Lu, W.-L. Zheng, B.-B. Li, and B.-L. Lu, “Combining eyemovements and EEG to enhance emotion recognition,” in Twenty-FourthInternational Joint Conference on Artificial Intelligence, 2015, pp. 1170–1176.
[25] S. Koelstra, C. Muhl, M. Soleymani, J.-S. Lee, A. Yazdani, T. Ebrahimi,T. Pun, A. Nijholt, and I. Patras, “DEAP: A database for emotionanalysis; using physiological signals,” IEEE Transactions on AffectiveComputing, vol. 3, no. 1, pp. 18–31, 2012.
[26] B. Sun, L. Li, X. Wu, T. Zuo, Y. Chen, G. Zhou, J. He, and X. Zhu,“Combining feature-level and decision-level fusion in a hierarchicalclassifier for emotion recognition in the wild,” Journal on MultimodalUser Interfaces, vol. 10, no. 2, pp. 125–137, 2016.
[27] T. Baltrusaitis, C. Ahuja, and L. Morency, “Multimodal machine learn-ing: A survey and taxonomy,” IEEE Transactions on Pattern Analysisand Machine Intelligence, vol. 41, no. 2, pp. 423–443, 2019.
[28] W. Liu, W.-L. Zheng, and B.-L. Lu, “Emotion recognition usingmultimodal deep learning,” in International Conference on NeuralInformation Processing. Springer, 2016, pp. 521–529.
[29] H. Tang, W. Liu, W.-L. Zheng, and B.-L. Lu, “Multimodal emotionrecognition using deep neural networks,” in International Conferenceon Neural Information Processing. Springer, 2017, pp. 811–819.
[30] X. Li, D. Song, P. Zhang, G. Yu, Y. Hou, and B. Hu, “Emotion recogni-tion from multi-channel EEG data through convolutional recurrent neuralnetwork,” in 2016 IEEE International Conference on Bioinformatics andBiomedicine (BIBM). IEEE, 2016, pp. 352–359.
[31] Z. Yin, M. Zhao, Y. Wang, J. Yang, and J. Zhang, “Recognition ofemotions using multimodal physiological signals and an ensemble deeplearning model,” Computer Methods and Programs in Biomedicine, vol.140, pp. 93–110, 2017.
[32] J.-L. Qiu, W. Liu, and B.-L. Lu, “Multi-view emotion recognition usingdeep canonical correlation analysis,” in International Conference onNeural Information Processing. Springer, 2018, pp. 221–231.
[33] Z. Wang, X. Zhou, W. Wang, and C. Liang, “Emotion recognition usingmultimodal deep learning in multiple psychophysiological signals andvideo,” International Journal of Machine Learning and Cybernetics,vol. 11, no. 4, pp. 923–934, 2020.
[34] G. Andrew, R. Arora, J. Bilmes, and K. Livescu, “Deep canonicalcorrelation analysis,” in International Conference on Machine Learning,2013, pp. 1247–1255.
[35] J. Ngiam, A. Khosla, M. Kim, J. Nam, H. Lee, and A. Y. Ng,“Multimodal deep learning,” in International Conference on MachineLearning, 2011, pp. 689–696.
[36] D. Lahat, T. Adali, and C. Jutten, “Multimodal data fusion: an overviewof methods, challenges, and prospects,” Proceedings of the IEEE, vol.103, no. 9, pp. 1449–1477, 2015.
[37] Z.-H. Zhou, Ensemble Methods: Foundations and Algorithms. CRCpress, 2012.
[38] K. Guo, R. Chai, H. Candra, Y. Guo, R. Song, H. Nguyen, and S. Su, “Ahybrid fuzzy cognitive map/support vector machine approach for EEG-based emotion classification using compressed sensing,” InternationalJournal of Fuzzy Systems, vol. 21, pp. 263–273, 2019.
[39] I. Naim, Y. C. Song, Q. Liu, H. Kautz, J. Luo, and D. Gildea,“Unsupervised alignment of natural language instructions with videosegments,” in Twenty-Eighth AAAI Conference on Artificial Intelligence.AAAI Press, 2014, pp. 1558–1564.
[40] A. Frome, G. S. Corrado, J. Shlens, S. Bengio, J. Dean, T. Mikolovet al., “Devise: A deep visual-semantic embedding model,” in Advancesin Neural Information Processing Systems, 2013, pp. 2121–2129.
[41] P. Zhou, W. Shi, J. Tian, Z. Qi, B. Li, H. Hao, and B. Xu, “Attention-based bidirectional long short-term memory networks for relation classi-fication,” in Proceedings of the 54th Annual Meeting of the Associationfor Computational Linguistics, 2016, pp. 207–212.
[42] A. Zadeh, P. P. Liang, N. Mazumder, S. Poria, E. Cambria, and L.-P.Morency, “Memory fusion network for multi-view sequential learning,”arXiv preprint arXiv:1802.00927, 2018.
[43] X. Li, C. Wang, J. Tan, X. Zeng, D. Ou, D. Ou, and B. Zheng,“Adversarial multimodal representation learning for click-through rateprediction,” in Proceedings of The Web Conference 2020, 2020, pp. 827–836.
[44] K. Tanaka and M. Sugeno, “A study on subjective evaluations of printedcolor images,” International Journal of Approximate Reasoning, vol. 5,no. 5, pp. 213–222, 1991.
[45] T.-H. Li, W. Liu, W.-L. Zheng, and B.-L. Lu, “Classification of fiveemotions from EEG and eye movement signals: Discrimination abilityand stability over time,” in 9th International IEEE/EMBS Conferenceon Neural Engineering (NER). IEEE, 2019, pp. 607–610.
[46] S. Katsigiannis and N. Ramzan, “DREAMER: A database for emotionrecognition through EEG and ECG signals from wireless low-cost off-the-shelf devices,” IEEE Journal of Biomedical and Health Informatics,vol. 22, no. 1, pp. 98–107, 2017.
[47] R.-N. Duan, J.-Y. Zhu, and B.-L. Lu, “Differential entropy fea-ture for EEG-based emotion classification,” in 2013 6th InternationalIEEE/EMBS Conference on Neural Engineering (NER). IEEE, 2013,pp. 81–84.
This is the author's version of an article that has been published in this journal. Changes were made to this version by the publisher prior to publication.The final version of record is available at http://dx.doi.org/10.1109/TCDS.2021.3071170
Copyright (c) 2021 IEEE. Personal use is permitted. For any other purposes, permission must be obtained from the IEEE by emailing [email protected].

15
[48] L.-C. Shi, Y.-Y. Jiao, and B.-L. Lu, “Differential entropy feature forEEG-based vigilance estimation,” in 2013 35th Annual InternationalConference of the IEEE Engineering in Medicine and Biology Society(EMBC). IEEE, 2013, pp. 6627–6630.
[49] L.-C. Shi and B.-L. Lu, “Off-line and on-line vigilance estimation basedon linear dynamical system and manifold learning,” in 2010 AnnualInternational Conference of the IEEE Engineering in Medicine andBiology. IEEE, 2010, pp. 6587–6590.
[50] Y. Hsu, J. Wang, W. Chiang, and C. Hung, “Automatic ECG-basedemotion recognition in music listening,” IEEE Transactions on AffectiveComputing, pp. 1–16, 2018.
[51] L. G. Tereshchenko and M. E. Josephson, “Frequency content andcharacteristics of ventricular conduction,” Journal of Electrocardiology,vol. 48, no. 6, pp. 933–937, 2015.
[52] L.-M. Zhao, R. Li, W.-L. Zheng, and B.-L. Lu, “Classification offive emotions from EEG and eye movement signals: Complementaryrepresentation properties,” in 9th International IEEE/EMBS Conferenceon Neural Engineering (NER). IEEE, 2019, pp. 611–614.
[53] T. Song, W. Zheng, P. Song, and Z. Cui, “EEG emotion recognition usingdynamical graph convolutional neural networks,” IEEE Transactions onAffective Computing, pp. 1–10, 2018.
[54] M. I. Belghazi, A. Baratin, S. Rajeshwar, S. Ozair, Y. Bengio,A. Courville, and D. Hjelm, “Mutual information neural estimation,”International Conference on Machine Learning, pp. 531–540, 2018.
[55] J. Kim and C. D. Scott, “Robust kernel density estimation,” Journal ofMachine Learning Research, vol. 13, no. Sep, pp. 2529–2565, 2012.
[56] Y.-T. Lan, W. Liu, and B.-L. Lu, “Multimodal emotion recognitionusing deep generalized canonical correlation analysis with an attentionmechanism,” International Joint Conference on Neural Networks 2020,pp. 1–6, 2020.
[57] D.-K. Nguyen and T. Okatani, “Improved fusion of visual and languagerepresentations by dense symmetric co-attention for visual questionanswering,” in Proceedings of the IEEE Conference on Computer Visionand Pattern Recognition, 2018, pp. 6087–6096.
[58] R. Socher, D. Chen, C. D. Manning, and A. Ng, “Reasoning with neuraltensor networks for knowledge base completion,” in Advances in neuralinformation processing systems. Citeseer, 2013, pp. 926–934.
[59] Z. Liu, Y. Shen, V. B. Lakshminarasimhan, P. P. Liang, A. Zadeh, andL.-P. Morency, “Efficient low-rank multimodal fusion with modality-specific factors,” arXiv preprint arXiv:1806.00064, 2018.
[60] M. Hou, J. Tang, J. Zhang, W. Kong, and Q. Zhao, “Deep multimodalmultilinear fusion with high-order polynomial pooling,” Advances inNeural Information Processing Systems, vol. 32, pp. 12 136–12 145,2019.
[61] M. Tao, H. Tang, S. Wu, N. Sebe, F. Wu, and X.-Y. Jing, “DF-GAN:Deep fusion generative adversarial networks for text-to-image synthesis,”arXiv preprint arXiv:2008.05865, 2020.
Wei Liu received his bachelor’s degree in Automa-tion Science from the School of Advanced Engineer-ing, Beihang University, Beijing, China, in 2014. Heis currently pursuing his Ph.D degree in ComputerScience from the Department of Computer Scienceand Engineering, Shanghai Jiao Tong University,Shanghai, China.
His research focuses on affective computing,brain-computer interface, and machine learning.
Jie-Lin Qiu received his bachelor’s degree in Elec-tronic Engineering from Shanghai Jiao Tong Uni-versity, Shanghai, China, in 2019. He is currently agraduate student in the Computer Science Depart-ment, Carnegie Mellon University, Pittsburgh, PA,USA. His research interests lie in the general area ofmachine learning, particularly in deep learning andmultimodal machine learning, with their applicationsin affective computing, brain-machine interfaces,computer vision, robotics, and autonomous systems.
Wei-Long Zheng (S’14-M’19) received the bache-lor’s degree in information engineering with the De-partment of Electronic and Information Engineering,South China University of Technology, Guangzhou,China, in 2012. He received the Ph.D. degree incomputer science with the Department of Com-puter Science and Engineering, Shanghai Jiao TongUniversity, Shanghai, China, in 2018. He was aresearch fellow in the Department of Neurology,Massachusetts General Hospital, Harvard MedicalSchool, USA, in 2018-2020. He is currently a Post-
doc Associate in Department of Brain and Cognitive Science at MassachusettsInstitute of Technology, USA. He received the IEEE Transactions on Au-tonomous Mental Development Outstanding Paper Award from IEEE Com-putational Intelligence Society in 2018. His research focuses on computationalneuroscience, affective computing, brain-computer interaction, and machinelearning.
Bao-Liang Lu (M’94–SM’01–F’21) received theB.S. degree in instrument and control engineeringfrom Qingdao University of Science and Technol-ogy, Qingdao, China, in 1982, the M.S. degree incomputer science and technology from NorthwesternPolytechnical University, Xi’an, China, in 1989, andthe Dr.Eng. degree in electrical engineering fromKyoto University, Kyoto, Japan, in 1994.
He was with the Qingdao University of Scienceand Technology from 1982 to 1986. From 1994to 1999, he was a Frontier Researcher with the
Bio-Mimetic Control Research Center, Institute of Physical and ChemicalResearch (RIKEN), Nagoya, Japan, and a Research Scientist with the RIKENBrain Science Institute, Wako, Japan, from 1999 to 2002. Since 2002, hehas been a Full Professor with the Department of Computer Science andEngineering, Shanghai Jiao Tong University, Shanghai, China. He received theIEEE Transactions on Autonomous Mental Development Outstanding PaperAward from the IEEE Computational Intelligence Society in 2018. His currentresearch interests include brain-like computing, neural network, deep learning,affective brain-computer interface, and emotion artificial intelligence.
Prof. Lu was the President of the Asia Pacific Neural Network Assemblyand the General Chair of the 18th International Conference on NeuralInformation Processing in 2011. He is currently the Associate Editor ofthe IEEE Transactions on Cognitive and Development Systems and a BoardMember of the Asia Pacific Neural Network Society.
This is the author's version of an article that has been published in this journal. Changes were made to this version by the publisher prior to publication.The final version of record is available at http://dx.doi.org/10.1109/TCDS.2021.3071170
Copyright (c) 2021 IEEE. Personal use is permitted. For any other purposes, permission must be obtained from the IEEE by emailing [email protected].