h recognition system robustness - mit csail · h recognition system robustness to microphone v...
TRANSCRIPT

Speech Recognition System Robustness
to Microphone Variations
by
Jane W. Chang
B.S., Electrical Engineering, Stanford University, 1992
Submitted to the Department of Electrical Engineering
and Computer Science
in partial ful�llment of the requirements for the degree of
Master of Science in Electrical Engineering and Computer Science
at the
MASSACHUSETTS INSTITUTE OF TECHNOLOGY
February 1995
c Massachusetts Institute of Technology 1995. All rights reserved.
Author : : : : : : : : : : : : : : : : : : : : : : : : : : : : : : : : : : : : : : : : : : : : : : : : : : : : : : : : : : : : :
Department of Electrical Engineering
and Computer Science
January 20, 1995
Certi�ed by : : : : : : : : : : : : : : : : : : : : : : : : : : : : : : : : : : : : : : : : : : : : : : : : : : : : : : : : :
Victor W. Zue
Senior Research Scientist
Thesis Supervisor
Accepted by : : : : : : : : : : : : : : : : : : : : : : : : : : : : : : : : : : : : : : : : : : : : : : : : : : : : : : : :
Frederic R. Morgenthaler
Chairman, Departmental Committee on Graduate Students

Speech Recognition System Robustness
to Microphone Variations
by
Jane W. Chang
Submitted to the Department of Electrical Engineering
and Computer Science
on January 20, 1995, in partial ful�llment of the
requirements for the degree of
Master of Science in Electrical Engineering and Computer Science
Abstract
This thesis seeks to improve our understanding of the e�ects of microphone variationsand compensation techniques on a speech recognition system, focusing on mismatchedconditions when the testing microphone is of lower quality than the training micro-phone. A methodology is designed to enable the isolation of microphone e�ects andthe benchmarking and comparison of techniques. The tasks are phonetic classi�-cation and recognition. The corpora and systems are respectively con�gured fromTIMIT [10] and SUMMIT [36].
TIMIT provides three micropone recordings, the close-talking Sennheiser, far-�eld B&K and Telephone, that are particularly useful for experiments on microphonevariations. Baseline analyses show that the Sennheiser and B&K di�er mainly atlow frequencies and result in moderate performance degradations under mismatchedconditions. In comparison, the Telephone shows larger deviations, and even afterdownsampling to remove di�erences at high frequencies, still su�ers severe perfor-mance degradations.
In reducing the errors due to mismatched testing, the thesis focuses on preprocess-ing techniques that compensate for microphone e�ects prior to recognition. Severalpreprocessing techniques are compared and analyzed. The most e�ective techniquessigni�cantly compensate for the relatively small di�erences and reduce error ratesfor the B&K and slightly reduce the larger mismatch and error rates for the Tele-phone. The thesis also explores further increases in microphone robustness that canbe achieved by techniques that incorporate microphone-speci�c data in training.
Thesis Supervisor: Victor W. Zue
Title: Senior Research Scientist

Acknowledgments
I deeply thank Victor Zue, my thesis supervisor, for his advice, support and encour-
agement. His valuable teachings have and continue to guide me through work and
life.
I also thank all of the Spoken Language Systems group: Jim Glass for providing
answers and encouragement; Mike Phillips for instructing me on the recognizer; Mike
McCandless for improving the recognizer; Stephanie Sene� for helping me with my
writing; Joe Polifroni for reading and encouraging; Christine Pao for maintaining the
systems; Vicky Palay and Sally Lee for keeping things in order; my �rst o�cemates,
Dave Goddeau and Bill Goldenthal, for showing me that students do graduate; and
everyone else for providing an excellent research environment.
I thank Rich Cox and others at AT&T Bell Laboratories for their support.
Finally, I thank my family, Mom, Dad, Kay and Fay, for their enduring love that
has sustained me through all of my endeavors.
This research was supported by an AT&T Bell Laboratories GRPW Fellowship
and Department of Defense Contract MDA904-93-C-4180.

Contents
1 Introduction 10
1.1 Background : : : : : : : : : : : : : : : : : : : : : : : : : : : : : : : : 111.2 Previous Work : : : : : : : : : : : : : : : : : : : : : : : : : : : : : : 12
1.2.1 Preprocessing Techniques : : : : : : : : : : : : : : : : : : : : 121.2.2 Other Techniques : : : : : : : : : : : : : : : : : : : : : : : : : 151.2.3 Discussion : : : : : : : : : : : : : : : : : : : : : : : : : : : : : 15
1.3 Objective : : : : : : : : : : : : : : : : : : : : : : : : : : : : : : : : : 161.4 Outline : : : : : : : : : : : : : : : : : : : : : : : : : : : : : : : : : : : 17
2 Methodology 19
2.1 Task : : : : : : : : : : : : : : : : : : : : : : : : : : : : : : : : : : : : 192.2 Corpus : : : : : : : : : : : : : : : : : : : : : : : : : : : : : : : : : : : 20
2.2.1 Data : : : : : : : : : : : : : : : : : : : : : : : : : : : : : : : : 202.2.2 Transcriptions : : : : : : : : : : : : : : : : : : : : : : : : : : : 212.2.3 Microphones : : : : : : : : : : : : : : : : : : : : : : : : : : : : 212.2.4 Subsets : : : : : : : : : : : : : : : : : : : : : : : : : : : : : : 21
2.3 System : : : : : : : : : : : : : : : : : : : : : : : : : : : : : : : : : : : 232.3.1 Signal Representation : : : : : : : : : : : : : : : : : : : : : : : 242.3.2 Segmentation : : : : : : : : : : : : : : : : : : : : : : : : : : : 262.3.3 Feature Extraction : : : : : : : : : : : : : : : : : : : : : : : : 262.3.4 Acoustic Modeling : : : : : : : : : : : : : : : : : : : : : : : : 272.3.5 Search : : : : : : : : : : : : : : : : : : : : : : : : : : : : : : : 27
2.4 Evaluation : : : : : : : : : : : : : : : : : : : : : : : : : : : : : : : : : 272.4.1 Error Rate : : : : : : : : : : : : : : : : : : : : : : : : : : : : : 282.4.2 Statistical Signi�cance : : : : : : : : : : : : : : : : : : : : : : 28
3 Data Analysis 30
3.1 Microphones : : : : : : : : : : : : : : : : : : : : : : : : : : : : : : : : 303.1.1 Sennheiser : : : : : : : : : : : : : : : : : : : : : : : : : : : : : 303.1.2 B&K : : : : : : : : : : : : : : : : : : : : : : : : : : : : : : : : 313.1.3 Telephone : : : : : : : : : : : : : : : : : : : : : : : : : : : : : 31
3.2 E�ects : : : : : : : : : : : : : : : : : : : : : : : : : : : : : : : : : : : 323.2.1 Convolutional E�ects : : : : : : : : : : : : : : : : : : : : : : : 323.2.2 Additive E�ects : : : : : : : : : : : : : : : : : : : : : : : : : : 33
3.3 Characteristics : : : : : : : : : : : : : : : : : : : : : : : : : : : : : : 34
4

3.3.1 Signal to Noise Characteristics : : : : : : : : : : : : : : : : : : 343.3.2 Spectrographic Characteristics : : : : : : : : : : : : : : : : : : 353.3.3 Spectral Characteristics : : : : : : : : : : : : : : : : : : : : : 363.3.4 Cepstral Characteristics : : : : : : : : : : : : : : : : : : : : : 40
3.4 Summary : : : : : : : : : : : : : : : : : : : : : : : : : : : : : : : : : 42
4 Baseline Experiments 44
4.1 Notation : : : : : : : : : : : : : : : : : : : : : : : : : : : : : : : : : : 444.1.1 Conditions : : : : : : : : : : : : : : : : : : : : : : : : : : : : : 444.1.2 Results : : : : : : : : : : : : : : : : : : : : : : : : : : : : : : : 45
4.2 General Results : : : : : : : : : : : : : : : : : : : : : : : : : : : : : : 454.2.1 Classi�cation : : : : : : : : : : : : : : : : : : : : : : : : : : : 454.2.2 Recognition : : : : : : : : : : : : : : : : : : : : : : : : : : : : 474.2.3 Discussion : : : : : : : : : : : : : : : : : : : : : : : : : : : : : 48
4.3 (S, B, 16) : : : : : : : : : : : : : : : : : : : : : : : : : : : : : : : : : 494.3.1 Classi�cation : : : : : : : : : : : : : : : : : : : : : : : : : : : 494.3.2 Recognition : : : : : : : : : : : : : : : : : : : : : : : : : : : : 54
4.4 (S, T, 8) : : : : : : : : : : : : : : : : : : : : : : : : : : : : : : : : : : 574.4.1 Classi�cation : : : : : : : : : : : : : : : : : : : : : : : : : : : 574.4.2 Recognition : : : : : : : : : : : : : : : : : : : : : : : : : : : : 61
4.5 Summary : : : : : : : : : : : : : : : : : : : : : : : : : : : : : : : : : 63
5 Preprocessing Techniques 64
5.1 Description : : : : : : : : : : : : : : : : : : : : : : : : : : : : : : : : 645.1.1 Convolutional E�ects : : : : : : : : : : : : : : : : : : : : : : : 645.1.2 Additive E�ects : : : : : : : : : : : : : : : : : : : : : : : : : : 675.1.3 Combined E�ects : : : : : : : : : : : : : : : : : : : : : : : : : 68
5.2 Comparison : : : : : : : : : : : : : : : : : : : : : : : : : : : : : : : : 695.2.1 Classi�cation : : : : : : : : : : : : : : : : : : : : : : : : : : : 695.2.2 Recognition : : : : : : : : : : : : : : : : : : : : : : : : : : : : 715.2.3 Discussion : : : : : : : : : : : : : : : : : : : : : : : : : : : : : 72
5.3 Analysis : : : : : : : : : : : : : : : : : : : : : : : : : : : : : : : : : : 735.3.1 (S, B) : : : : : : : : : : : : : : : : : : : : : : : : : : : : : : : 755.3.2 (S, T) : : : : : : : : : : : : : : : : : : : : : : : : : : : : : : : 80
5.4 Summary : : : : : : : : : : : : : : : : : : : : : : : : : : : : : : : : : 83
6 Training Techniques 84
6.1 Description : : : : : : : : : : : : : : : : : : : : : : : : : : : : : : : : 856.1.1 Multi-style Training : : : : : : : : : : : : : : : : : : : : : : : 856.1.2 Microphone Selection : : : : : : : : : : : : : : : : : : : : : : : 87
6.2 Comparison : : : : : : : : : : : : : : : : : : : : : : : : : : : : : : : : 886.2.1 Classi�cation : : : : : : : : : : : : : : : : : : : : : : : : : : : 886.2.2 Recognition : : : : : : : : : : : : : : : : : : : : : : : : : : : : 90
6.3 Summary : : : : : : : : : : : : : : : : : : : : : : : : : : : : : : : : : 91
5

7 Conclusion 92
7.1 Summary : : : : : : : : : : : : : : : : : : : : : : : : : : : : : : : : : 927.2 Future Work : : : : : : : : : : : : : : : : : : : : : : : : : : : : : : : : 93
A More on Preprocessing Techniques 95
6
List of Figures
2-1 MFSC �lter bank : : : : : : : : : : : : : : : : : : : : : : : : : : : : : 25
3-1 Spectrograms of the word \discipline" for each microphone : : : : : : 353-2 Mean MFSCs over the training set for each microphone : : : : : : : : 373-3 Mean broad class MFSCs over the training set for each microphone : 393-4 Mean MFCCs over the training set for each microphone : : : : : : : : 413-5 Cosine weighting function for MFCC[2] : : : : : : : : : : : : : : : : : 423-6 Mean MFCCs over the training set for each microphone after down-
sampling : : : : : : : : : : : : : : : : : : : : : : : : : : : : : : : : : : 43
4-1 Mean MFSCs over the training set for frequent confusion pairs due tothe B&K : : : : : : : : : : : : : : : : : : : : : : : : : : : : : : : : : : 53
4-2 Mean MFSCs over the training set for frequent confusion pairs due tothe Telephone : : : : : : : : : : : : : : : : : : : : : : : : : : : : : : : 60
5-1 Mean broad class MFSCs over the training set for each microphoneafter MN : : : : : : : : : : : : : : : : : : : : : : : : : : : : : : : : : : 74
5-2 Mean MFSCs over the training set for frequent confusion pairs due tothe B&K after MN : : : : : : : : : : : : : : : : : : : : : : : : : : : : 77
5-3 Mean MFSCs over the training set for frequent confusion pairs due tothe Telephone after MN : : : : : : : : : : : : : : : : : : : : : : : : : 81
7

List of Tables
1.1 Increase in word error rate in percent from matched to mismatchedtraining and testing conditions for various microphones, corpora andsystems : : : : : : : : : : : : : : : : : : : : : : : : : : : : : : : : : : 12
1.2 Decrease in word error rate in percent under mismatched conditionsand net increase in word error rate in percent from matched to mis-matched conditions for various techniques, microphones, corpora andsystems. : : : : : : : : : : : : : : : : : : : : : : : : : : : : : : : : : : 15
2.1 TIMIT acoustic-phonetic symbols with their IPA symbols and exampleoccurrences : : : : : : : : : : : : : : : : : : : : : : : : : : : : : : : : 22
2.2 Training, testing and development sets : : : : : : : : : : : : : : : : : 23
3.1 Average SNRs in dB for each microphone before and after downsampling 343.2 Broad classes with example phonemes : : : : : : : : : : : : : : : : : : 38
4.1 Example error rate matrix : : : : : : : : : : : : : : : : : : : : : : : : 454.2 Baseline classi�cation error rates in percent : : : : : : : : : : : : : : : 464.3 Baseline classi�cation error rates in percent after downsampling : : : 464.4 Baseline recognition error rates in percent : : : : : : : : : : : : : : : 474.5 Baseline recognition error rates in percent after downsampling : : : : 484.6 Breakdown in percent of tokens between (S, S, 16) and (S, B, 16) : : 504.7 Frequency in percent of the most frequent broad class misclassi�cations
due to the B&K : : : : : : : : : : : : : : : : : : : : : : : : : : : : : : 504.8 Frequency in percent of the most frequent misclassi�cations with their
most frequent substitutions due to the B&K : : : : : : : : : : : : : : 514.9 Frequency in percent of the most frequent misclassi�cations with their
most frequent substitutions due to the Sennheiser : : : : : : : : : : : 544.10 Frequency in percent of the most frequent substitutions with their most
frequent misclassi�cations due to the B&K : : : : : : : : : : : : : : : 554.11 Frequency in percent of the most frequent deletions due to the B&K : 564.12 Frequency in percent of the most frequent insertions that do not occur
on the B&K : : : : : : : : : : : : : : : : : : : : : : : : : : : : : : : : 564.13 Breakdown in percent of tokens between (S, S, 16) and (S, T, 8) : : : 574.14 Frequency in percent of the most frequent broad class misclassi�cations
due to the Telephone : : : : : : : : : : : : : : : : : : : : : : : : : : : 58
8

4.15 Frequency in percent of the most frequent misclassi�cations with theirmost frequent substitutions due to the Telephone : : : : : : : : : : : 58
4.16 Frequency in percent of the most frequent substitutions with their mostfrequent misclassi�cations due to the Telephone : : : : : : : : : : : : 61
4.17 Frequency in percent of the most frequent deletions due to the Telephone 624.18 Frequency in percent of the most frequent insertions that do not occur
on the Telephone : : : : : : : : : : : : : : : : : : : : : : : : : : : : : 63
5.1 Classi�cation error rates in percent for various preprocessing techniques 695.2 Recognition error rates in percent for various preprocessing techniques 715.3 Frequency in percent of the most frequent misclassi�cations with their
most frequent substitutions that do not occur on the B&K after MN : 765.4 Recognition error rates in percent before and after MN : : : : : : : : 785.5 Frequency in percent of the most frequent substitutions with their most
frequent misclassi�cations that do not occur on the B&K after MN : 785.6 Frequency in percent of the most frequent deletions that do not occur
on the B&K after MN : : : : : : : : : : : : : : : : : : : : : : : : : : 795.7 Frequency in percent of the most frequent misclassi�cations with their
most frequent substitutions that do not occur on the Telephone afterMN : : : : : : : : : : : : : : : : : : : : : : : : : : : : : : : : : : : : : 80
5.8 Recognition error rates in percent before and after preprocessing : : : 825.9 Frequency in percent of the most frequent deletions that do not occur
on the Telephone after CDCN : : : : : : : : : : : : : : : : : : : : : : 82
6.1 Classi�cation and recognition error rates in percent for multi-styletraining before and after downsampling : : : : : : : : : : : : : : : : : 86
6.2 Classi�cation and recognition error rates in percent for multi-styletraining in combination with various preprocessing techniques : : : : 86
6.3 Classi�cation and recognition error rates in percent for microphoneselection in combination with various preprocessing techniques : : : : 88
6.4 Classi�cation error rates in percent before and after preprocessing andtraining : : : : : : : : : : : : : : : : : : : : : : : : : : : : : : : : : : 89
6.5 Recognition error rates in percent before and after preprocessing andtraining : : : : : : : : : : : : : : : : : : : : : : : : : : : : : : : : : : 90
A.1 Example error rate table : : : : : : : : : : : : : : : : : : : : : : : : : 95A.2 Error rates in percent for MN : : : : : : : : : : : : : : : : : : : : : : 96A.3 Error rates in percent for RASTA : : : : : : : : : : : : : : : : : : : : 96A.4 Error rates in percent for BCMN : : : : : : : : : : : : : : : : : : : : 96A.5 Error rates in percent for SUB : : : : : : : : : : : : : : : : : : : : : : 97A.6 Error rates in percent for SSUB : : : : : : : : : : : : : : : : : : : : : 97A.7 Error rates in percent for SUBMN : : : : : : : : : : : : : : : : : : : : 98A.8 Error rates in percent for CDCN : : : : : : : : : : : : : : : : : : : : 98
9

Chapter 1
Introduction
Historically, many factors have impeded the deployment of speech recognition tech-
nology. One factor is accuracy, in that speech recognition systems must be able to
achieve low error rates in order to perform their intended tasks in deployment. An-
other factor is robustness, in that systems must also be able to maintain low error
rates under conditions that may vary in deployment. With the progress of speech
recognition technology, systems have attained high accuracy under testing conditions
that are well matched to the conditions used in training. Yet, systems still cannot
maintain such accuracy under mismatched training and testing conditions.
Lack of robustness to variations in testing continues to impede the deployment
of speech recognition technology. For example, the speaker, environment and micro-
phone can all contribute to variations in the input signal to the speech recognition
system. The speaker may vary what or how he speaks. The environment may vary
in reverberation or noise level. The microphone may vary in transductional or posi-
tional characteristics. Under such deployment conditions, current speech recognition
systems cannot maintain low error rates to perform their intended tasks.
10

1.1 Background
This thesis studies speech recognition system robustness to microphone variations.
The microphone can have large e�ects on the speech recognition system. Even with
the same speaker and environment, di�erent microphones record di�erent signals for
input to the system. For example, microphones use di�erent transduction principles,
such as pressure or pressure gradience, which alter the signal in di�erent ways. The
positioning of the microphone also causes distortion. Generally, as the distance rela-
tive to the speaker's mouth increases, the microphone records less oral resonance and
more non-oral sounds, such as nasal and glottal resonances and environmental noise.
In order to achieve the lowest error rates, most speech recognition systems are
trained and tested using a high quality, head-mounted, close-talking, noise-canceling
microphone. While such microphones may be suitable for some applications, other
transducers, such as hand-, lapel-, table- or boom-mounted microphones and tele-
phones, may be more suitable for other applications. Nevertheless, current speech
recognition systems lack robustness to microphone variations and cannot be used
with microphones that are mismatched to the one used in training. For example,
preliminary experiments show a 150% increase in word error rate, from 28% under
the matched condition when training on a Sennheiser to 69% under the mismatched
condition when testing on a table-mounted Crown microphone, on the Air Travel
Information Service (ATIS) corpus using the SUMMIT [36, 37] system developed at
MIT. Table 1.1 shows similar increases in word error rate in percent from matched
to mismatched training and testing conditions for various microphones, corpora and
systems. Regardless of the microphones or corpora used, all systems su�er at least a
150% increase in error rate from matched to mismatched conditions.
1ATIS is the Air Travel Information Service corpus.2Sennheiser refers to a head-mounted microphone.3Crown refers to a table-mounted microphone.4WSJ is the Wall Street Journal corpus.5Assorted refers to the secondary microphones, including lapel-, table-, and boom-mounted mi-
crophones, telephones and speaker phones, used to collect the Wall Street Journal (WSJ) corpus.6Shure refers to a unidirectional microphone.7Realistic refers to a unidirectional microphone.
11

System Corpus Train Test Match Mismatch IncreaseSUMMIT (MIT) ATIS1 Sennheiser2 Crown3 28 69 150DECIPHER (SRI) [27] ATIS Sennheiser Crown 23 91 300SPHINX (CMU) [23] WSJ4 Sennheiser Assorted5 8 39 390BYBLOS (BBN) [3] WSJ Sennheiser Assorted 12 40 230TANGORA (IBM) [6] private Shure6 Realistic7 2 8 300
Table 1.1: Increase in word error rate in percent frommatched to mismatched trainingand testing conditions for various microphones, corpora and systems
1.2 Previous Work
As the severe performance degradations incurred by microphone variations become
apparent, researchers have begun to address the issue of microphone robustness.
Many techniques have been developed to reduce the performance degradations in-
curred by mismatched training and testing conditions. The most common are pre-
processing techniques that apply signal processing algorithms to the recorded signal
in order to compensate for microphone variations before input to the speech recogni-
tion system. Other techniques compensate for microphone variations as part of the
recognition process.
1.2.1 Preprocessing Techniques
Preprocessing techniques apply speech enhancement algorithms [21] to compensate
for the e�ects of microphone variations on the recorded signal. Most microphone
e�ects are mathematically modeled by convolution and addition in the time domain.
For example, variations in the speaker vocal tract, environmental acoustics and mi-
crophone transfer function have convolutional e�ects. Variations in environmental
noise have additive e�ects.
Convolutional E�ects
Some techniques focus on compensating for the convolutional e�ects of microphone
variations on the recorded signal. These techniques often take advantage of the cor-
12

respondence of convolution in the time domain to addition in the cepstral domain
and estimate cepstral compensation vectors to subtract the microphone e�ects. For
example, Mean Normalization (MN) [3, 23] uses the cepstral mean of each utterance
as its compensation vector. Relative Spectral Processing (RASTA) [14] applies an
exponentially decaying highpass �lter to the cepstral vectors of each utterance. Other
�lters, such as bandpass �lters [19], have also been applied.
Additive E�ects
Other techniques focus on compensating for the additive e�ects of microphone varia-
tions on the recorded signal. These techniques often estimate spectral or log spectral
compensation vectors to subtract the microphone e�ects. For example, RASTA [16]
�ltering has been applied to the log spectral vectors of each utterance. Some tech-
niques discriminate between speech and noise to estimate compensation vectors. For
example, Spectral Subtraction [33] and Log-Spectral Subtraction (SUB) [34] respec-
tively use histograms in the spectral and log spectral domains to determine speech
and noise thresholds. Other techniques [7] apply optimal algorithms such as Min-
imum Mean Square Error (MMSE) estimation to determine compensation vectors.
For example, MinimumMean Log-Spectral Distance [8] applies MMSE estimation to
minimize log spectral distance.
Combined E�ects
Combined techniques compensate for both the convolutional and additive e�ects of
microphone variations on the recorded signal. Some techniques combine indepen-
dently estimated compensation vectors. For example, MN and SUB have been com-
bined in cascade [1]. Other techniques estimate joint compensation vectors. For
example, Linear-Logarithmic (LIN-LOG) RASTA [15] uses logarithmic transforms to
estimate non-linear compensation vectors. Many jointly combined techniques [1] ap-
ply Vector Quantization (VQ) algorithms. For example, Adaptive Labeling (AL) [28]
and Tied Mixture Normalization (TMN) [3] apply VQ codebook transformations to
13

adapt di�erent microphone training and testing conditions.
Researchers at CMU have developed the largest number of techniques for in-
creasing microphone robustness. SNR-Dependent Cepstral Normalization (SDCN) [1]
and Phone-Dependent Cepstral Normalization (PDCN) [23] respectively use instan-
taneous Signal-to-Noise Ratios (SNRs) and preliminary phone hypotheses to estimate
compensation vectors. Codebook-Dependent Cepstral Normalization (CDCN) [1]
applies Maximum Likelihood (ML) estimation to determine convolutional and ad-
ditive parameters and MMSE esimation to minimize VQ codeword distances. Fixed
CDCN [2] (FCDCN) combines SDCN SNRmeasurements with CDCN VQ codewords.
Multiple FCDCN (MFCDCN) combines multiple FCDCN techniques for di�erent
microphones. Interpolated MFCDCN (IMFCDCN) interpolates between MFCDCN
compensation vectors.
Results
Preprocessing techniques reduce the performance degradations incurred by micro-
phone mismatches. For example, preliminary experiments show a 36% decrease in
word error rate, from 69% to 44%, when using either MN or CDCN under the �rst
mismatched condition described in Table 1.1. Yet, despite such error reductions,
preprocessing techniques cannot fully recover the increased error rates caused by
mismatched conditions. For example, given that mismatched testing incurs a 150%
increase in error, a 36% decrease after preprocessing still results in a net 60% increase
in error from the matched condition. Table 1.2 shows similar decreases in word error
rate in percent under mismatched conditions and net increases in word error rate in
percent from matched to mismatched conditions when using various preprocessing
techniques for the microphones, corpora and systems described in Table 1.1. Re-
gardless of the techniques, microphones or corpora used, all systems su�er at least
a net 60% increase in error rate from matched to mismatched conditions even after
preprocessing.
14

System Corpus Train Test Technique Without With Decrease NetTechnique Technique Increase
SUMMIT ATIS Sennheiser Crown MN 69 44 36 60CDCN 69 44 36 60
DECIPHER ATIS Sennheiser Crown RASTA 91 62 32 170SPHINX WSJ Sennheiser Assorted RASTA 39 28 28 250
MN 39 21 46 160MFCDCN 39 15 62 90IMFCDCN 39 15 62 90PDCN 39 16 59 100
BYBLOS WSJ Sennheiser Assorted MN 40 32 20 160TMN 40 21 47 70
TANGORA private Shure Realistic AL 8 4 50 100
Table 1.2: Decrease in word error rate in percent under mismatched conditions andnet increase in word error rate in percent from matched to mismatched conditions forvarious techniques, microphones, corpora and systems.
1.2.2 Other Techniques
Other techniques compensate for microphone variations as part of the speech recog-
nition process. For example, feature extraction techniques [25], such as those based
on auditory models, can be applied to extract more robust features and produce
more robust models. Auditory models [32, 12, 17] approximate the characteristics
of the human auditory system and may capture some of the robustness of the hu-
man recognition system. Training techniques can also be applied to reduce mismatch
and produce more robust models. For example, multi-style training [22] trains the
speech recognition system on multiple speaking styles in order to increase robustness
to mismatched conditions when testing on abnormal speaking styles, such as stressed
speech. Multi-style training on di�erent microphones may also increase microphone
robustness.
1.2.3 Discussion
Although researchers have begun to address the issue of microphone robustness, un-
derstanding of the e�ects of microphone variations and techniques on the speech
recognition system is still lacking. This need for improved understanding is related
to the lack of comparative study, despite numerous e�orts towards increasing micro-
phone robustness.
15

As shown in Table 1.2, researchers use many di�erent techniques, microphones,
corpora, and systems. For example, techniques vary in their data requirements. While
some techniques do not require microphone data and can be applies to many micro-
phones, other microphone-speci�c techniques require simultaneously recorded micro-
phone training data and apply only to the trained microphones.
Tasks also vary, from phonetic classi�cation and recognition, to isolated and con-
tinuous speech word recognition. Many experiments are performed in word recog-
nition. These experiments are particularly di�cult to compare, due to confounding
factors in word recognition. For example, corpora use di�erent vocabularies, and
systems use di�erent language models. Word recognition experiments are also partic-
ularly di�cult to perform due to computational requirements. For example, CMU [1]
developed many techniques on their private Alphanumeric corpus instead of the Wall
Street Journal (WSJ) corpus because the computation for the larger WSJ corpus
would have been prohibitive.
These di�erences in tasks, corpora and systems confound understanding and com-
parison. With so many other variations between experiments, the particular e�ects
of the microphone variations are obscured, making it di�cult, if not impossible, to
compare and understand the e�ects of di�erent techniques.
1.3 Objective
The objective of this thesis is to improve our understanding of the e�ects of mi-
crophone variations and compensation techniques on the speech recognition system.
To this end, the thesis performs a comparative study, with a focus on realistic mis-
matched conditions in deployment, where the testing microphone is of lower quality
than the training microphone.
First, the thesis designs a methodology in order to enable the isolation, analysis
and comparison of microphone variations and techniques. The TIMIT [9, 10, 20]
corpus and SUMMIT [36, 37] system are con�gured for experiments in phonetic
classi�cation and recognition under di�erent microphone training and testing con-
16
ditions. These experiments focus on fundamental e�ects of microphone variations
and techniques at the phonetic level and reduce confounding e�ects of corpus and
system dependent variables at the word level. They require shorter training and test-
ing cycles and allow generalization from classi�cation to recognition. They also use
a commonly accepted corpus designed for acoustic-phonetic experiments to provide
baseline comparison and analysis.
Using this methodology, the thesis benchmarks and compares a wide range of
techniques in order to understand their e�ects on the speech recognition system. The
techniques are implemented and developed with attention to data requirements. The
thesis focuses on preprocessing techniques that do not require microphone-speci�c
data. Analysis of these techniques reveals their ability to compensate for microphone
e�ects on the recorded signal and reduce the performance degradations incurred by
mismatched training and testing conditions. The thesis also considers training tech-
niques that require microphone-speci�c data to understand further increases in mi-
crophone robustness that can be achieved.
Overall, the thesis is directed towards fundamental improvements in understand-
ing and performance, with the expectation that increased microphone robustness at
the phonetic level will generalize to other tasks and domains.
1.4 Outline
The remainder of the thesis contains six chapters and an appendix. Chapter 2 covers
the experimental methodology. A methodology is designed in order to perform a
comparative study. The tasks are phonetic classi�cation and recognition. The corpora
and systems are respectively con�gured from TIMIT [9, 10, 20] and SUMMIT [36, 37].
The evaluation is based on error rate and statistical signi�cance.
Chapter 3 covers the preliminary data analysis. An analysis of the microphones
and data serves as the basis for understanding the e�ects of microphone variations
and techniques. The microphones are described. The e�ects of the microphones on
the recorded signal are modeled. The signal to noise, spectrographic, spectral and
17

cepstral characteristics of the microphone data are examined.
Chapter 4 presents the baseline experiments in phonetic classi�cation and recog-
nition for di�erent training and testing conditions. These experiments are analyzed
to understand the e�ects of microphone variations and provide a baseline for experi-
ments with compensation techniques. General results are discussed, and mismatched
conditions are analyzed.
Chapter 5 presents the experiments with preprocessing techniques. These experi-
ments are analyzed and compared, in order to understand the e�ects of preprocessing
without microphone-speci�c data on the speech recognition system. Techniques are
described, general results are compared and the most e�ective techniques are ana-
lyzed.
Chapter 6 presents the experiments with training techniques. These experiments
are analyzed and compared, in order to understand the e�ects of training with
microphone-speci�c data on the speech recognition system. Techniques are described,
and results are compared.
In Chapter 7, the thesis is summarized, and future work is discussed. Appendix A
provides more experimental results for various preprocessing techniques.
18

Chapter 2
Methodology
Despite e�orts towards microphone robustness, di�erences in methodology confound
understanding of the e�ects of microphone variations and compensation techniques on
the speech recognition system. For example, tasks vary from phonetic classi�cation to
word recognition. Corpora vary from small private corpora to large standard corpora.
These di�erences obscure the e�ects of microphone variations and techniques and
confound comparison.
This thesis designs a consistent experimental methodology for a comparative
study. This methodology enables the isolation of microphone e�ects and the bench-
marking of techniques. The tasks are phonetic classi�cation and recognition. The
microphone corpora and phonetic classi�cation and recognition systems are respec-
tively con�gured from the TIMIT [9, 10, 20] corpus and SUMMIT [36, 37] system.
The evaluation is based on error rate and statistical signi�cance.
2.1 Task
The tasks are phonetic classi�cation and recognition. Phonetic classi�cation requires
the determination of the phonetic identity of a segment given the signal and its end-
points. Classi�cation involves signal representation, feature extraction and acoustic
modeling. Phonetic recognition requires the determination of a phonetic string given
19

the signal only. Recognition combines classi�cation with segmentation and search.
Experiments on the phonetic level have many advantages. They focus on the
fundamental units of sound in speech. They reduce the confounding e�ects of corpus
and system dependent variables, such as vocabulary and language models. They
require less computation and shorter training and testing cycles. They also allow
generalization in analysis from classi�cation to recognition.
2.2 Corpus
The corpora are con�gured from TIMIT [9, 10, 20], a collection of read speech with
time-aligned phonetic and orthographic transcriptions. Experiments on TIMIT have
many advantages. TIMIT is speci�cally designed for the acquisition of acoustic-
phonetic knowledge and the development of phonetic recognition systems. TIMIT
is also commonly accepted for benchmarking and comparison. Most importantly,
TIMIT is recorded on three di�erent microphones. These recordings of identical ut-
terances spoken by identical speakers allow comparison of di�erences incurred by
variations in microphone only. With these recordings, TIMIT provides three micro-
phone corpora that are particularly useful for phonetic experiments on microphone
variations.
2.2.1 Data
TIMIT was collected from 630 speakers, 70% male and 30% female, covering 8 major
dialects of American English. Each speaker read 10 utterances, 2 \sa" dialect utter-
ances that were read by all 630 speakers, 5 of the 450 \sx" phonemically compact
utterances that were each read by 7 speakers, and 3 of the 1890 \si" phonetically di-
verse utterances that were each read by only 1 speaker, for a total of 6300 utterances.
20

2.2.2 Transcriptions
TIMIT provides time-aligned acoustic-phonetic transcriptions for all utterances. Ta-
ble 2.1 shows the 61 TIMIT acoustic-phonetic symbols with their International Pho-
netic Alphabet (IPA) symbols and example occurrences.
2.2.3 Microphones
The TIMIT microphone corpora are referred to as the Sennheiser, B&K and Tele-
phone. The �rst two corpora were recorded in stereo with a head-mounted Sennheiser
model HMD414 on one channel and a boom-mounted Bruel and Kjaer (B&K) model
4165 on the other. A quiet environment was maintained using a noise-isolated sound
booth. Nevertheless, the B&K recorded a low frequency acoustic rumble that was
later removed with a 70 Hz cuto� high pass �lter. The third corpus [18] was recorded
after transmitting the Sennheiser data over a telephone network. A telephone envi-
ronment was simulated using an arti�cial mouth, a telephone handset and local and
long distance telephone lines.
The Sennheiser and Telephone corpora were respectively released as TIMIT [9, 10,
20] and Network TIMIT (NTIMIT) [18], but the B&K corpus was never released. In
order to con�gure TIMIT for experiments on microphone variations, the B&K data
were acquired from archived tapes. Data from 97.3%, 613 out of 630, speakers were
read from tape, but data from the remaining 2.7%, 17 out of 630, speakers could not
be recovered1.
2.2.4 Subsets
TIMIT training and testing subsets have been determined by the National Institute
of Standards and Technology (NIST) [10] based on several criteria. The sets do not
include the \sa" utterances that were read by all speakers, nor do they share speakers
or \sx" and \si" utterances. Each set covers all dialects and phonemes in di�erent
1The 17 unread speakers were fajw0, fbmh0, fjem0, fjwb0, et0, mcal0, mcmb0, mdac0, mdas0,mdwd0, mgjf0, mjjb0, mrkm0, mrvg0, msfh1, msfv0 and msjs1.
21

IPA TIMIT Example IPA TIMIT Examplea aa bot | ix debit@ ae bat i iy beet^ ah but J jh jokeO ao bought k k keya˚ aw bout k kcl k closure{ ax about l l lay{˚ ax-h suspect m m mom} axr butter n n noona˚ ay bite 4 ng singb b bee F nx winnerb bcl b closure o ow boatC ch choke O˚ oy boyd day p p pead dcl d closure ˆ pau pauseD dh then p pcl p closureF dx muddy ? q batE eh bet r r raylŒ el bottle s s seamŒ em bottom S sh shenŒ en button t t tea4Œ eng Washington t tcl t closure• epi epenthetic silence T th thin5 er bird U uh booke ey bait u uw bootf f fin u ux tootg g gay v v vang gcl g closure w w wayh hh hay y y yachtH hv ahead z z zoneI ih bit Z zh azure- h# utterance initial and �nal silence
Table 2.1: TIMIT acoustic-phonetic symbols with their IPA symbols and exampleoccurrences
22

contexts. The \core" testing set contains data from 24 speakers, 2 male and 1 female
of each dialect, each of whom spoke 8 di�erent utterances, for a total of 192 testing
utterances. The training set contains data from 462 speakers, each of whom spoke 8
utterances not included in the testing set, for a total of 3696 utterances.
In determining subsets for experiments on microphone variations, the criterion is
to maintain consistency across microphones. Because the B&K data are incomplete,
the subsets only include NIST utterances that could be acquired for the B&K. All
NIST testing utterances were acquired. However, utterances for 11 NIST training
speakers could not be read, and an additional 5 NIST training utterances were found
to be corrupted2. The resulting training and testing sets are respectively 97.5% and
100% of the NIST subsets. A development set is also determined from the speakers
and utterances not included in the training and testing sets. Table 2.2 describes the
training, testing and development sets.
# phonemes # utterances # speakersTraining set 139,257 3,603 451Testing set 7330 192 24Development set 12,978 383 48
Table 2.2: Training, testing and development sets
2.3 System
The classi�cation and recognition systems are con�gured from the Speech Under-
standing by Machine at MIT (SUMMIT) [36, 37] system. SUMMIT is a segment-
based system that explicitly detects phonetic segment boundaries in order to extract
features in relation to speci�c acoustic events. The classi�cation system involves sig-
nal representation, feature extraction and acoustic modeling. The recognition system
combines these components with segmentation and search. Consistency is maintained
2The corrupted utterances were si1368 by mjpm0, si1412 by mppc0, si2151 by mtdp0, sx90 bymrmg0 and sx107 by mtkd0.
23

across systems in order to allow generalization in analysis. In addition, simple pa-
rameters are used in order to expedite training.
2.3.1 Signal Representation
The classi�cation and recognition systems use a Mel-Frequency Cepstral Coe�cient
(MFCC) [24, 25] signal representation. This representation is both e�ective and
e�cient.
Short Time Fourier Analysis
Given a signal, amplitude normalization is applied to remove di�erences in recording
amplitudes. The signal is multiplicatively scaled such that the maximum sample
is 16 bits. Then, preemphasis is applied to enhance higher frequency components
and attenuate lower frequency components. Equation 2.1 shows the �rst di�erence
preemphasis.
y[m] = x[m]� �x[m� 1] (2:1)
where
x[m] : original signal
y[m] : preemphasized signal
� = 0:97
A Short Time Fourier Transform (STFT) is applied to produce a time dependent
spectral representation. At an analysis rate of 200 Hz, the normalized and preempha-
sized signal is windowed using a 25.6 ms Hamming window, and the windowed signal
is transformed using a 512 point FFT, to produce 1 frame of spectral coe�cients
every 5 ms.
Spectral Representation
Given a frame of spectral coe�cients, an auditory �lter bank is applied to produce
the Mel-Frequency Spectral Coe�cient (MFSC) [25] representation. Figure 2-1 shows
24

the MFSC �lter bank.
0 1000 2000 3000 4000 5000 6000 70000
0.2
0.4
0.6
0.8
1
Frequency (Hz)
Pow
er (
dB)
Figure 2-1: MFSC �lter bank
The MFSC �lter bank contains 40 �lters that roughly approximate the frequency
response of the basilar membrane in the cochlea of the inner ear. The �lters span
156{6844 Hz and are spaced on a Mel-frequency scale, which is respectively linear and
logarithmic below and above 1 kHz. The �lters are triangular and multiplicatively
scaled by area.
The MFSC representation consists of the 40 coe�cients that correspond to the
logarithm of the signal energy in the 40 MFSC �lters. This log spectral representation
is useful in analysis and the development of compensation techniques.
Cepstral Representation
Given a frame of MFSCs, a cosine transformation is applied to produce the MFCC
signal representation. Equation 2.2 shows the cosine transformation.
Y [i] =NXj=1
X[j]cos[i(j �1
2)�
N] (2:2)
25

where
X[j] : MFSC coe�cient j
Y [i] : MFCC coe�cient i
N : number of MFSC coe�cients
The MFCC representation consists of the 14 lower-order coe�cients that corre-
spond to the cosine transformation of N MFSC coe�cients. The MFCC indices, i,
range from 0 to 13. The MFSC indices, j, range from 1 to N . The number of MF-
SCs used in the cosine transformation, N , is either 40 or 30. When N is 40, all 40
MFSCs are used, and the cepstral representation spans 156{6844 Hz. This case cor-
responds to the original 16 kHz sampling rate. When N is 30, only the 30 lower-order
MFSCs are used, and the cepstral representation is e�ectively bandlimited to span
only 156{3469 Hz, the lower half of the original bandwidth. This case corresponds
approximately to downsampling by a factor of 2 to an 8 kHz sampling rate.
The MFCC representation is widely used for benchmarking and comparison. It
also uses fewer coe�cients and is quite e�cient, and these coe�cients are less cor-
related through cosine transformation and more e�ectively modeled by independent
densities [24].
2.3.2 Segmentation
In classi�cation, the TIMIT time-aligned phonetic transcription is used to provide
segment boundaries. In recognition, a segmentation algorithm [13] is used to provide
segment hypotheses and scores. The algorithm associates each frame with one of its
neighbors and marks a boundary when the direction of association changes from past
to future. Using the resulting regions, the algorithm iterates until the entire utterance
is described by one multi-level representation, called a dendrogram.
2.3.3 Feature Extraction
The classi�cation and recognition systems extract 36 features for each segment. Of the
36 features, 1 is the duration of the segment, and the remaining 35 are averages over
26
varying intervals inside and outside the segment, respectively representing intra- and
inter-segmental information. The features were determined by applying an automatic
feature selection algorithm [31]. Acoustic-phonetic knowledge was used to propose
property detectors with free parameters. For example, one property detector was time
averaging over an interval, and the corresponding parameters were the initial and �nal
times of the interval. A measure of phonetic discrimination was maximized over the
space spanned by the parameters in order to determine the maximally discriminative
features, called Generalized Measurements (GMs).
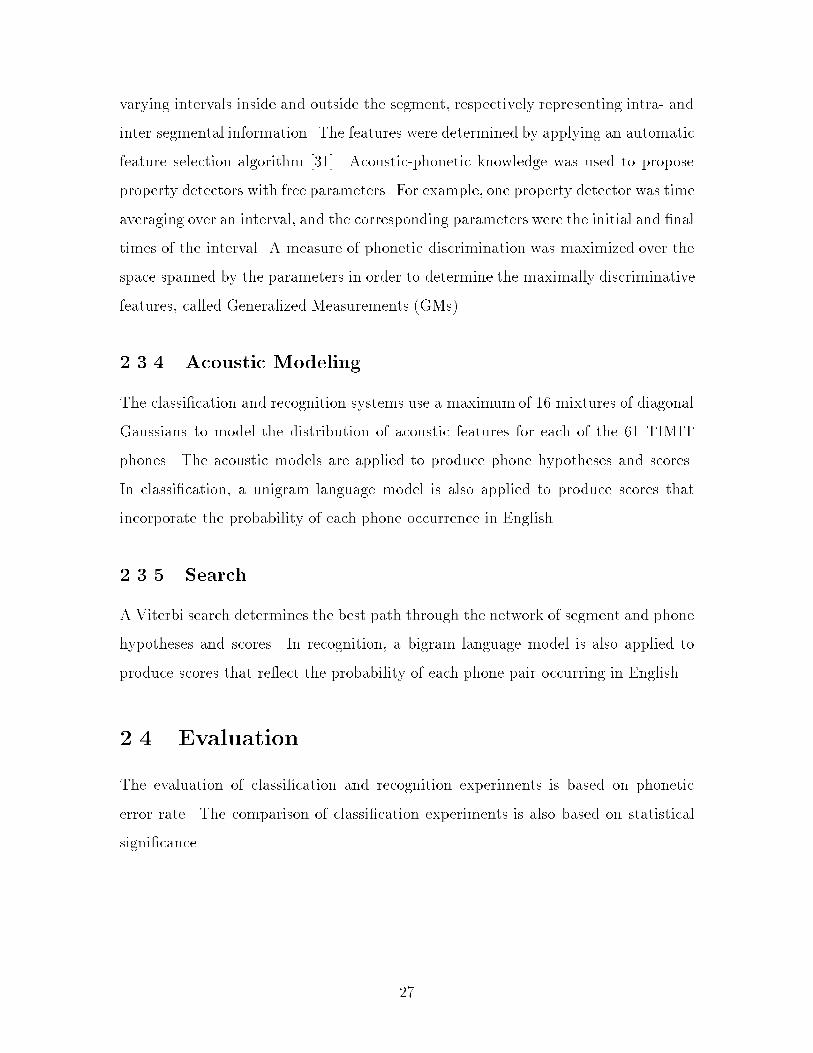
2.3.4 Acoustic Modeling
The classi�cation and recognition systems use a maximum of 16 mixtures of diagonal
Gaussians to model the distribution of acoustic features for each of the 61 TIMIT
phones. The acoustic models are applied to produce phone hypotheses and scores.
In classi�cation, a unigram language model is also applied to produce scores that
incorporate the probability of each phone occurrence in English.
2.3.5 Search
A Viterbi search determines the best path through the network of segment and phone
hypotheses and scores. In recognition, a bigram language model is also applied to
produce scores that re ect the probability of each phone pair occurring in English.
2.4 Evaluation
The evaluation of classi�cation and recognition experiments is based on phonetic
error rate. The comparison of classi�cation experiments is also based on statistical
signi�cance.
27

2.4.1 Error Rate
The overall performance metric is the error rate among 56 phonetic classes. The
6 closures, /b /, /d /, /g /, /p /, /t/ and /k /, are grouped into one class, /cl/.
Each of the other 55 TIMIT phonemes constitutes its own class. In classi�cation,
the error rate consists of only substitutions of one class for another. In recognition,
the error rate includes substitutions, deletions and insertions, and varies depending
on the evaluation technique used. The NIST alignment and scoring algorithm [30]
minimizes the total error rate, as measured by the sum of the substitution, deletion
and insertion error rates. In this thesis, the NIST algorithm is used to evaluate the
recognition experiments.
2.4.2 Statistical Signi�cance
Statistical signi�cance is also used as a comparative metric. The availability of di�er-
ent microphone recordings of identical TIMIT data allows the application of the Mc-
Nemar signi�cance test [11]. In measuring the signi�cance between two experiments,
the McNemar test considers only those tokens which are correct in one experiment
and incorrect in the other, since tokens which are correct or incorrect in both exper-
iments do not contribute to information about relative performance. Equation 2.3
shows the McNemar signi�cance between two experiments.
S =
8>>>>>>>>>>>><>>>>>>>>>>>>:
0:5k�1Pk
m=i
0B@
k
m
1CA if i > k=2
0:5k�1Pj
m=0
0B@
k
m
1CA if j < k=2
1:0 if i = k=2
(2:3)
28
where
i : number of tokens correct in experiment one and incorrect in experiment two
j : number of tokens correct in experiment two and incorrect in experiment one
k = i+ j
S : signi�cance
When S is lower than the signi�cance level, the two experiments are signi�cantly
di�erent. When S is higher than the signi�cance level, there is not enough evidence
to conclude on a di�erence. In this thesis, the McNemar test is used to compare all
classi�cation experiments with a signi�cance level of 0.01. Unless stated otherwise,
comparative results in classi�cation are statistically signi�cant.
29

Chapter 3
Data Analysis
TIMIT provides three microphone corpora that are useful for experiments on micro-
phone variations. The recordings of identical utterances spoken by identical speakers
allow comparison of di�erences incurred by variations in microphone only. A pre-
liminary analysis of the microphones and data serves as the basis for understanding
these di�erences and the subsequent experimental results. The TIMIT microphones
are described, the e�ects of the microphones on the recorded signal are modeled,
and the signal to noise, spectrographic, spectral and cepstral characteristics of the
microphone data are examined.
3.1 Microphones
The TIMIT microphones have di�erent properties that result in di�erent recordings of
the same input. The three sets of microphone data are referred to as the Sennheiser,
B&K and Telephone.
3.1.1 Sennheiser
The Sennheiser [9, 35] is a pressure-gradient microphone with a at frequency re-
sponse, plus or minus 2 dB, that extends well beyond the frequency range used by
the speech recognition system, approximately 100{7000 Hz. Pressure-gradient micro-
30
phones [4] record the pressure di�erence between two closely spaced transducers and
are highly dependent on recording distance and direction relative to the speaker's
mouth. The Sennheiser is a head-mounted, close-talking microphone that maintains
a constant distance and direction near and in line with the mouth. It also has noise-
canceling characteristics that reduce its sensitivity to non-oral sounds from other dis-
tances and directions, such as nasal and glottal resonances and environmental noise.
The Sennheiser is the highest quality of the TIMIT microphones and is the standard
recording microphone for many corpora and systems.
3.1.2 B&K
The B&K [9] is a pressure microphone also with a at response extending beyond
the frequency range of interest. Pressure microphones [4] record pressure directly.
Although the B&K is an omnidirectional microphone that is not as dependent on
direction, it is also a boom-mounted, far-�eld microphone that records from a more
variable distance farther from the speaker's mouth. As a result, the B&K is more
sensitive to non-oral sounds and of lower quality than the Sennheiser.
3.1.3 Telephone
The Telephone [18] is a combination of a Sennheiser microphone, a telephone micro-
phone and a telephone channel. The Sennheiser recording was played back through an
arti�cial mouth that simulated the acoustic characteristics between a speaker's mouth
and a telephone handset. The playback was recorded using a telephone handset-
mounted pressure microphone and transmitted over local and long distance telephone
lines. In addition to microphone e�ects, the Telephone also su�ers from transmission
e�ects, which include bandlimiting to 300{3400 Hz and other distortions. As a result,
the Telephone is the lowest quality of the TIMIT microphones.
31

3.2 E�ects
The e�ects of the microphones on the recorded signal can be mathematically modeled
by convolution and addition in the time domain. These models are used in the devel-
opment of preprocessing techniques, and we maintain their dichotomy for purposes
of discussion, recognizing that the distinction is rather arbitrary. For example, a
convolutional e�ect, viewed in the appropriate domain, is additive, so a spectral sub-
traction compensates for either additive or convolution e�ects, depending on whether
a logarithm has been taken or not.
3.2.1 Convolutional E�ects
Some e�ects are modeled as convolutional distortions caused by Linear Time Invari-
ant (LTI) �lters. For example, variations in the speaker vocal tract, environmental
acoustics and microphone transfer function have convolutional e�ects. In addition,
bandlimiting and other linear distortions in the Telephone are also modeled by LTI
�lters. Equation 3.1 shows the convolutional e�ect in the time domain.
y[m] = x[m] � h[m] (3:1)
where
x[m] : original signal
y[m] : distorted signal
h[m] : impulse response of the distortion
This e�ect is multiplicative in the spectral domain,
Y (ejw) = X(ejw)H(ejw); (3:2)
additive in the log spectral domain,
Y (ejw) = X(ejw) + H(ejw); (3:3)
32

and additive in the cepstral domain,
y[m] = x[m] + h[m]: (3:4)
Convolutional e�ects are assumed to vary slowly with respect to speech in that the
characteristics of the speaker, environment and microphone remain relatively constant
over the duration of each utterance. Using this assumption, additive log spectral or
cepstral compensation vectors can be estimated.
3.2.2 Additive E�ects
Other e�ects are modeled as additive distortions that are uncorrelated with speech.
For example, variations in environmental noise level and interference in telephone
transmission have additive e�ects. Equation 3.5 shows the additive e�ect in the time
domain.
y[m] = x[m] + n[m] (3:5)
where
x[m] : original signal
y[m] : noisy signal
n[m] : noise
This e�ect is also additive in the spectral domain,
Y (ejw) = X(ejw) +N(ejw): (3:6)
Additive e�ects are also assumed to vary slowly with respect to speech and are
modeled as stationary white Gaussian random processes. Using these assumptions,
additive spectral compensation vectors can be estimated.
33

3.3 Characteristics
The signal to noise, spectrographic, spectral and cepstral characteristics of the mi-
crophone data are examined. Given identical speakers and utterances, these charac-
teristics re ect di�erences between the microphones.
3.3.1 Signal to Noise Characteristics
Signal to Noise Ratio (SNR) measures the ratio of signal power to noise power. SNR
is a commonly used measurement to compare the quality of di�erent microphone
recordings. In general, the higher the SNR, the better the quality.
The average SNR for each microphone recording is computed as the mean signal
power averaged over the training set utterances divided by the mean noise power
averaged over the training set utterances. For each utterance, the mean signal power
is the power averaged over all the frames, except those within the beginning and
ending silence segments labeled as /h#/, which are averaged to compute the mean
noise power. In this thesis, the power in each frame is taken to be the �rst MFCC
coe�cient, MFCC[0], which is the sum of the MFSC coe�cients, that correspond to
the power in dB in the MFSC �lters. The original 16 kHz SNR is computed over
all 40 MFSCs. The downsampled 8 kHz SNR is computed over only the lower 30
MFSCs, Table 3.1 shows the average SNRs in dB for each microphone before and
after downsampling.
Sennheiser B&K Telephone16 kHz SNR 23.8 21.2 11.48 kHz SNR 26.1 23.3 15.4
Table 3.1: Average SNRs in dB for each microphone before and after downsampling
The high quality noise-canceling Sennheiser has the highest SNR. The lower qual-
ity non-noise-canceling B&K and Telephone have lower SNRs, suggesting higher error
rates in classi�cation and recognition. The particularly low Telephone SNR is pre-
sumably due to transmission e�ects. For example, transmission bandlimiting causes
34

a lack of high frequency energy that correponds to low SNRs in the upper MFSC
�lters. Downsampling increases the Telephone SNR by about 2 dB relative to the
Sennheiser and B&K, but even after downsampling, the Telephone still has the lowest
SNR by many dB.
3.3.2 Spectrographic Characteristics
Spectrograms show temporal and spectral characteristics of the STFT. Figure 3-
1 shows spectrograms of the word \discipline" extracted from the same utterance
spoken by the same speaker for each microphone1. The x axis shows time, the y axis
shows frequency and the gray scale shows spectral magnitude. Plots of zero crossing
rate, total energy, and low frequency energy are also included. The word \discipline"
is transcribed as [d d Is{p p l|n (@)].
Sennheiser B&K Telephone
Wide Band Spectrogram
0
1
2
3
4
5
6
7
8
0
1
2
3
4
5
6
7
8
Time (seconds)0.8 0.9 1.0 1.1 1.2 1.3
kHz kHz
0 0
8 8
16 16Zero Crossing Rate
dB dBTotal Energy
dB dBEnergy -- 125 Hz to 750 Hz
Waveform
0.8 0.9 1.0 1.1 1.2 1.3
Wide Band Spectrogram
0
1
2
3
4
5
6
7
8
0
1
2
3
4
5
6
7
8
Time (seconds)0.8 0.9 1.0 1.1 1.2 1.3
kHz kHz
0 0
8 8
16 16Zero Crossing Rate
dB dBTotal Energy
dB dBEnergy -- 125 Hz to 750 Hz
Waveform
0.8 0.9 1.0 1.1 1.2 1.3
Wide Band Spectrogram
0
1
2
3
4
5
6
7
8
0
1
2
3
4
5
6
7
8
Time (seconds)0.8 0.9 1.0 1.1 1.2 1.3
kHz kHz
0 0
8 8
16 16Zero Crossing Rate
dB dBTotal Energy
dB dBEnergy -- 125 Hz to 750 Hz
Waveform
0.8 0.9 1.0 1.1 1.2 1.3
Figure 3-1: Spectrograms of the word \discipline" for each microphone
In comparison to the Sennheiser and Telephone, the B&K shows an increase in
1The utterance, \si" 2119, is \the instinct to discipline has been lost". The speaker, rjm, is male.
35

low frequency energy. The non-gradient B&K does not have the highpass character-
istic that results from taking the di�erence between two transducers in the gradient
Sennheiser. In addition, the boom-mounted far-�eld B&K records from a farther dis-
tance relative to the speaker's mouth and is more sensitive to non-oral sounds than
the close-talking noise-canceling Sennheiser. Some of these non-oral sounds, such as
nasal and glottal resonances and environmental noise, can occur at low frequencies.
For example, the B&K shows more low frequency energy in the nasal, /n/. The B&K
also shows more low frequency energy in the closures, /d / and /p /, stops, /d/ and
/p/, and fricative, /s/. This increase in low frequency energy can obscure the voicing
feature and suggests di�culty in discriminating phonemes along this dimension.
In comparison to the Sennheiser and B&K, the Telephone shows a lack of high
frequency energy due to transmission bandlimiting and an increase in background
energy due to signal normalization and other transmission e�ects. For example, the
Telephone shows no high frequency energy for the stops, /d/ and /p/, and the frica-
tive, /s/. This lack of high frequency energy can obscure stop and fricative features
and suggests di�culty in discriminating phonemes along the manner dimension.
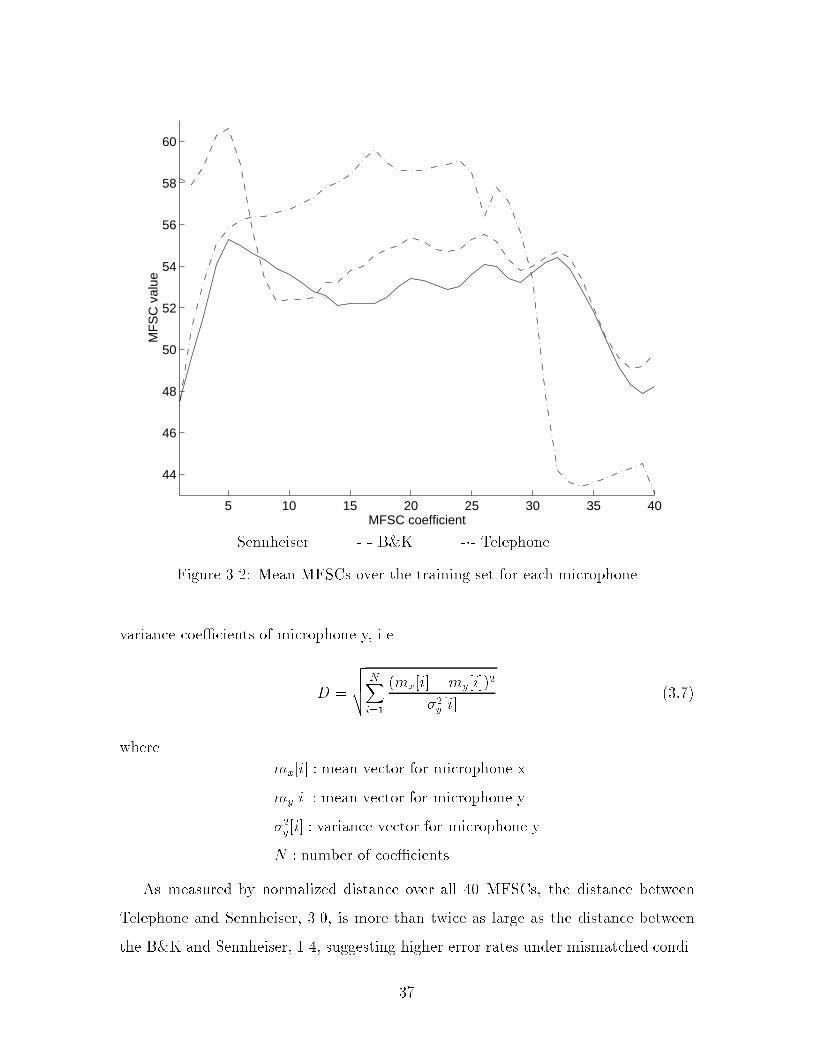
3.3.3 Spectral Characteristics
Figure 3-2 shows mean MFSCs averaged over the training set for each microphone.
For notational consistency, solid, dashed and dash-dotted lines respectively represent
the Sennheiser, B&K and Telephone.
As seen in the spectrograms, the B&K shows an increase in low frequency energy,
presumably due to e�ects recorded by the non-gradient, boom-mounted far-�eld B&K
but not by the gradient, close-talking, noise-canceling Sennheiser. The Telephone
shows a lack of high frequency energy and an increase in background energy due to
transmission and normalization e�ects.
These di�erences between microphones can be quanti�ed by applying a distance
measure to their mean and variance vectors. Given vectors for microphone x and y,
the normalized distance from microphone x to y is computed as the square root of
the sum of the squared di�erences between the mean coe�cients normalized by the
36
5 10 15 20 25 30 35 40
44
46
48
50
52
54
56
58
60
MFSC coefficient
MF
SC
val
ue
| Sennheiser - - B&K -�- Telephone
Figure 3-2: Mean MFSCs over the training set for each microphone
variance coe�cients of microphone y, i.e.
D =
vuut NXi=1
(mx[i]�my[i])2
�2y [i](3:7)
where
mx[i] : mean vector for microphone x
my[i] : mean vector for microphone y
�2y[i] : variance vector for microphone y
N : number of coe�cients
As measured by normalized distance over all 40 MFSCs, the distance between
Telephone and Sennheiser, 3.0, is more than twice as large as the distance between
the B&K and Sennheiser, 1.4, suggesting higher error rates under mismatched condi-
37

tions involving the Telephone. Downsampling, as measured by normalized distance
over only the 30 lower MFSCs, decreases the distance between the Telephone and
Sennheiser to 2.0, suggesting that downsampling can reduce Telephone errors.
Deviations between microphones have di�erent e�ects on di�erent phonemes de-
pending on their spectral characteristics. Phonemes that share similar spectral char-
acteristics are generally produced by the same manner of articulation and can be
grouped into broad manner classes. Under mismatched conditions, when deviations
are small, phonemes may be classi�ed in the correct broad class but may be misclas-
si�ed within the class. For example, the small deviations at low frequencies in the
B&K can obscure the voicing feature that discriminates phonemes within the obstru-
ent classes. When deviations are large, phonemes are more likely to be misclassi�ed
in the incorrect broad class. For example, the large deviations at high frequencies in
the Telephone can obscure obstruent features that discriminate fricatives and stops.
In order to examine these e�ects, the TIMIT phonemes are grouped into six broad
classes generally based on manner of articulation. Table 3.2 shows these six broad
classes with example phonemes.
Broad class Example phonemesVowel a @ ^ O a { a EH 5 e |io O U uSemivowel lrw yNasal m n 4Strong obstruent CJsSzZWeak obstruent b d D fg k p tT vSilence b d •g k ˆp t h#
Table 3.2: Broad classes with example phonemes
Strident fricatives and a�ricate releases form the strong obstruent class. Weak
fricatives and stop releases form the weak obstruent class. Closures are grouped with
the silence class. In addition, allophones, such as syllabic and apped realizations,
are grouped with their corresponding classes.
Figure 3-3 shows mean broad class MFSCs averaged over the training set for each
microphone.
38

0 10 20 30 40
40
50
60
70
80
Vowel
MFSC0 10 20 30 40
40
50
60
70
80
Strong obstruent
MFSC
0 10 20 30 40
40
50
60
70
80
Semivowel
MFSC0 10 20 30 40
40
50
60
70
80
Weak obstruent
MFSC
0 10 20 30 40
40
50
60
70
80
Nasal
MFSC0 10 20 30 40
40
50
60
70
80
Silence
MFSC
|
Sennheiser - - B&K -�- Telephone
Figure 3-3: Mean broad class MFSCs over the training set for each microphone
39

As measured by normalized distance over 40 MFSCs, the B&K and Sennheiser
di�er mostly in the nasal and silence classes. In these classes, the B&K shows a low
frequency peak that is presumably due to nasal resonances, pre-voicing and environ-
mental noise. The B&K also di�ers in the strong obstruent class, which shows a
low frequency variation presumably due to voicing and environmental noise. These
deviations suggest confusions between the nasal and silence classes and within the
obstruent class over voicing.
In comparison to the B&K and Sennheiser, the Telephone and Sennheiser show
larger di�erences that suggest more between-class errors. As measured by normalized
distance over the 30 lower MFSCs, the Telephone and Sennheiser mostly di�er in the
weak obstruent and silence classes presumably due to transmission e�ects and signal
normalization. The Telephone also di�ers in the semivowel class, which shows a mid-
frequency variation that can obscure formant structures. These deviations suggest
confusions between the weak obstruent and silence classes and within the semivowel
class.
3.3.4 Cepstral Characteristics
Figure 3-4 shows mean MFCCs averaged over the training set for each microphone.
The �rst coe�cient, MFCC[0], has a relatively large value that re ects total energy.
The higher order coe�cients, MFCC[1{13], have relatively smaller values that re-
ect spectral distribution. MFCC[0] is clipped in order to focus on the higher order
MFCCs.
As with the MFSCs, the normalized distance between Telephone and Sennheiser,
2.7, is almost twice as large as the distance between the B&K and Sennheiser, 1.4,
suggesting higher error rates under mismatched conditions involving the Telephone.
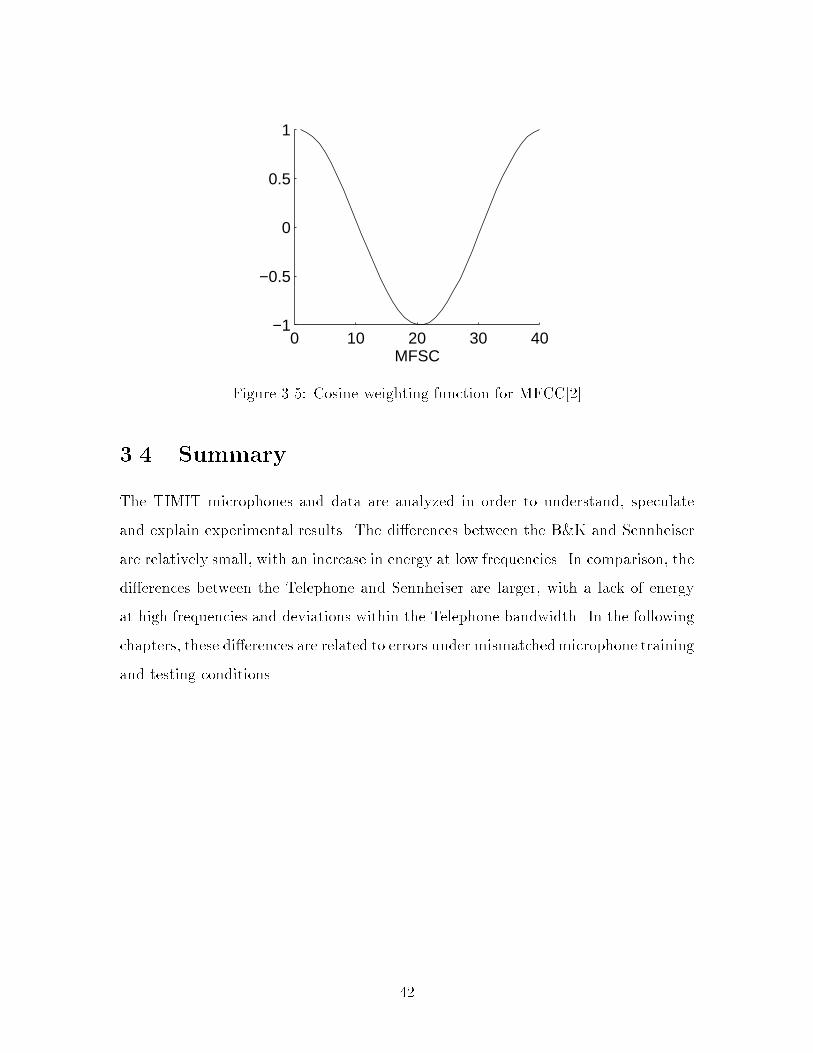
An examination of the MFCC signal representation shows that the large cepstral
deviations in the Telephone are mostly due to di�erences in spectral distribution. For
example, the value of MFCC[2] is much more negative for the Telephone than for the
Sennheiser and B&K. Figure 3-5 shows the cosine weighting function for MFCC[2]. In
computing MFCC[2], the energy at middle frequencies, MFSC[10{30], is subtracted
40

0 2 4 6 8 10 12
−120
−100
−80
−60
−40
−20
0
20
40
60
80
MFCC coefficient
MF
CC
val
ue
| Sennheiser - - B&K -�- Telephone
Figure 3-4: Mean MFCCs over the training set for each microphone
from the energy at low and high frequencies, MFSC[1{10] and MFSC[30{40]. Lack
of energy at high frequencies, above MFSC[30], results in large negative values for
MFCC[2].
Downsampling corresponds approximately to applying the cosine weighting func-
tion over only the lower 30 MFSCs. Figure 3-6 shows mean MFCCs averaged over
the training set for each microphone after downsampling.
Downsampling decreases the normalized distance between the Telephone and
Sennheiser to 1.3, suggesting that downsampling can reduce error rates under mis-
matched conditions when training on the Sennheiser and testing on the Telephone.
41
0 10 20 30 40−1
−0.5
0
0.5
1
MFSC
Figure 3-5: Cosine weighting function for MFCC[2]
3.4 Summary
The TIMIT microphones and data are analyzed in order to understand, speculate
and explain experimental results. The di�erences between the B&K and Sennheiser
are relatively small, with an increase in energy at low frequencies. In comparison, the
di�erences between the Telephone and Sennheiser are larger, with a lack of energy
at high frequencies and deviations within the Telephone bandwidth. In the following
chapters, these di�erences are related to errors under mismatchedmicrophone training
and testing conditions.
42

0 2 4 6 8 10 12
−120
−100
−80
−60
−40
−20
0
20
40
60
80
MFCC coefficient
MF
CC
val
ue
| Sennheiser - - B&K -�- Telephone
Figure 3-6: Mean MFCCs over the training set for each microphone after downsam-pling
43

Chapter 4
Baseline Experiments
Baseline experiments are performed in phonetic classi�cation and recognition for dif-
ferent microphone conditions. These experiments are analyzed to understand the
e�ects of microphone variations and used in comparison to experiments with com-
pensation techniques. Analysis focuses on the realistic conditions when the system
is trained on the high quality Sennheiser and tested on the lower quality B&K and
Telephone.
4.1 Notation
The microphone is abbreviated by its initial. S, B and T respectively correspond to
the Sennheiser, B&K and Telephone. Other notations are introduced for denoting
microphone conditions and presenting experimental results.
4.1.1 Conditions
The microphone training and testing condition is denoted by a parenthesized ordered
pair. (X, Y) corresponds to the condition when microphone X is used in training
and microphone Y is used in testing. For clarity, the sampling rate may be speci�ed
by a third argument in the parenthesized notation. (X, Y, Z) is the condition when
training on X and testing on Y at a Z kHz sampling rate. The 3 sets of TIMIT
44

microphone data provide 9 training and testing conditions at 16 kHz. Downsampling
provides 9 downsampled training and testing conditions at 8 kHz.
4.1.2 Results
Error rates in percent are presented in a matrix. Table 4.1 shows an example error
rate matrix.
S B TS (S, S) (S, B) (S, T)B (B, S) (B, B) (B, T)T (T, S) (T, B) (T, T)
Table 4.1: Example error rate matrix
Rows show training microphones. Columns show testing microphones. Diagonal
entries correspond to matched conditions when training and testing on the same
microphone. O�-diagonal entries correspond to mismatched conditions when testing
on a microphone di�erent from the one used in training.
4.2 General Results
Baseline experiments are performed for all microphone conditions before and after
downsampling. General classi�cation and recognition results are presented and dis-
cussed.
4.2.1 Classi�cation
Table 4.2 shows baseline classi�cation error rates in percent.
The diagonal entry shows that the matched testing condition achieves the lowest
error rate for each training microphone. Increases in error rate down the diagonal
re ect decreases in the quality of the microphone. The lowest error rate is achieved
by (S, S, 16), increasing 6% to (B, B, 16) and 33% to (T, T, 16). These results are
45

S B TS 31.2 38.9 66.7B 35.6 33.1 67.5T 81.1 76.9 41.6
Table 4.2: Baseline classi�cation error rates in percent
consistent with those in the literature. For example, a previous study [5] also shows
a 33% increase in error rate, from 25.2% under (S, S, 16) to 33.5% under (T, T, 16),
when evaluating on 39 rather than 56 classes.
Error rates o� the diagonal re ect di�erences between the training and testing
microphones. Error rates increase moderately under mismatched conditions involv-
ing the Sennheiser and B&K. For example, the (S, S, 16) error rate increases by 25%
to (S, B, 16). However, error rates increase severely under all mismatched conditions
involving the Telephone. For example, the (S, S, 16) error rate increases by 114% to
(S, T, 16). These results are consistent with the analyses in the previous chapter.
In comparison to the Sennheiser and B&K, the Telephone shows large di�erences
in signal-to-noise, spectral and cepstral characteristics. As downsampling reduces
all of these di�erences, downsamping also reduces the severe performance degrada-
tions under mismatched conditions involving the Telephone. Table 4.3 shows baseline
classi�cation error rates in percent after downsampling.
S B TS 33.5 42.0 55.7B 37.4 34.0 57.6T 49.9 55.2 41.8
Table 4.3: Baseline classi�cation error rates in percent after downsampling
Downsampling causes the speech recognition system to focus on acoustic infor-
mation below 4 kHz, e�ectively bandlimiting the Sennheiser and B&K to match the
transmission bandwidth of the Telephone. Increases in error rate for the Sennheiser
and B&K re ect the loss of high frequency information. For example, the (S, S, 16)
46
error rate increases by 7% to (S, S, 8). However, downsampling does not cause a loss
of high frequency information for the Telephone. For the matched condition, down-
sampling results in a statistically insigni�cant di�erence in error rate between (T, T,
16) and (T, T, 8). For mismatched conditions involving the Telephone, downsam-
pling results in reductions in error rate. For example, the error rate under (S, T, 16)
decreases by 16% to (S, T, 8). Although downsampling can reduce error rates under
mismatched conditions, even after downsampling, mismatched conditions involving
the Telephone still su�er large performance degradations. For example, the (S, S, 8)
error rate increases by 66% to (S, T, 8). These degradations are presumably due to
transmission e�ects other than bandlimiting in the Telephone.
4.2.2 Recognition
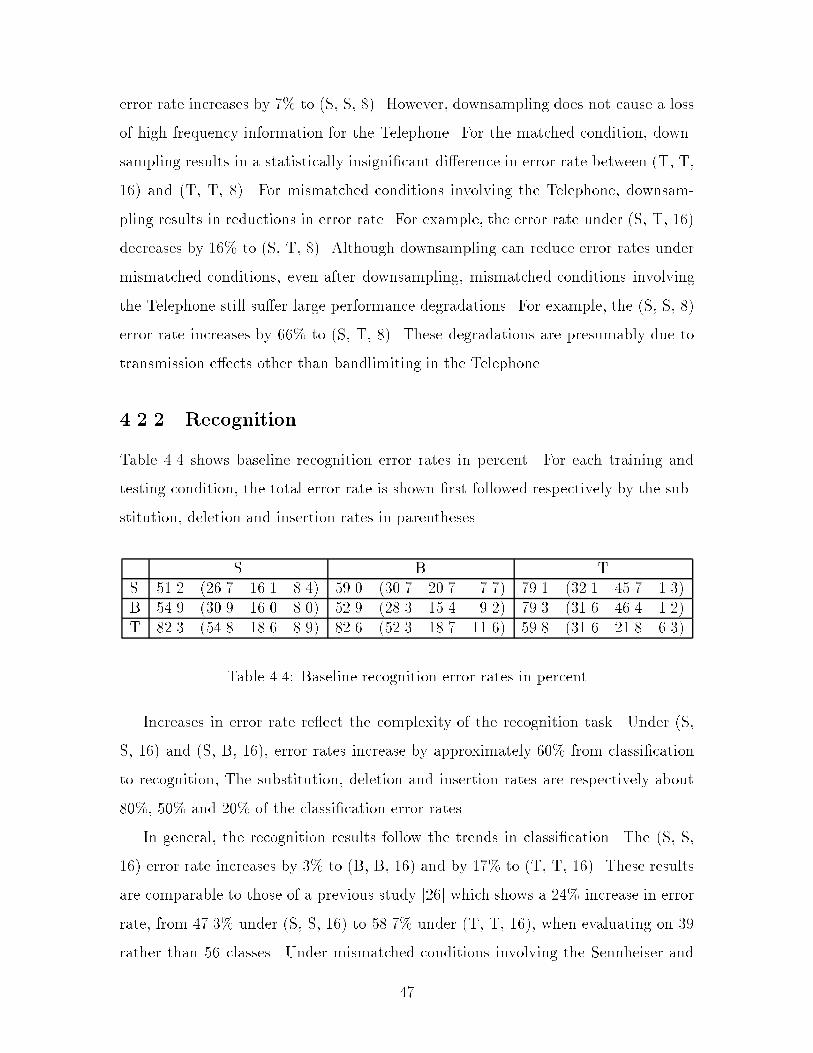
Table 4.4 shows baseline recognition error rates in percent. For each training and
testing condition, the total error rate is shown �rst followed respectively by the sub-
stitution, deletion and insertion rates in parentheses.
S B TS 51.2 (26.7 16.1 8.4) 59.0 (30.7 20.7 7.7) 79.1 (32.1 45.7 1.3)B 54.9 (30.9 16.0 8.0) 52.9 (28.3 15.4 9.2) 79.3 (31.6 46.4 1.2)T 82.3 (54.8 18.6 8.9) 82.6 (52.3 18.7 11.6) 59.8 (31.6 21.8 6.3)
Table 4.4: Baseline recognition error rates in percent
Increases in error rate re ect the complexity of the recognition task. Under (S,
S, 16) and (S, B, 16), error rates increase by approximately 60% from classi�cation
to recognition, The substitution, deletion and insertion rates are respectively about
80%, 50% and 20% of the classi�cation error rates.
In general, the recognition results follow the trends in classi�cation. The (S, S,
16) error rate increases by 3% to (B, B, 16) and by 17% to (T, T, 16). These results
are comparable to those of a previous study [26] which shows a 24% increase in error
rate, from 47.3% under (S, S, 16) to 58.7% under (T, T, 16), when evaluating on 39
rather than 56 classes. Under mismatched conditions involving the Sennheiser and
47

B&K, error rates increase moderately, with the (S, S, 16) error rate increasing by
15% to (S, B, 16). Under mismatched conditions involving the Telephone, error rates
increase severely, with the (S, S, 16) error rate increasing by 54% to (S, T, 16). The
previous study [26] shows a 45% increase in error rate, from 47.3% under (S, S, 16)
to 68.7% under (S, T, 16).
Table 4.5 shows baseline recognition error rates in percent after downsampling.
Downsampling reduces the severe performance degradations under mismatched con-
ditions involving the Telephone. For example, the error rate under (S, T, 16) shows
an 8% decrease to (S, T, 8). Yet, even after downsampling, mismatched conditions
involving the Telephone still su�er large performance degradations that are presum-
ably due to transmission e�ects other than bandlimiting. For example, the (S, S, 8)
error rate increases by 43% to (S, T, 8).
S B TS 55.7 (31.5 12.6 11.6) 62.7 (35.5 15.4 11.7) 73.1 (31.4 38.2 3.4)B 59.8 (31.0 22.6 6.2) 56.6 (30.4 17.0 9.2) 75.5 (31.6 41.8 2.1)T 68.5 (41.9 14.2 12.4) 73.7 (45.5 13.3 14.9) 63.9 (34.8 19.4 9.7)
Table 4.5: Baseline recognition error rates in percent after downsampling
4.2.3 Discussion
The baseline phonetic classi�cation and recognition systems perform comparably with
those in the literature [5, 26]. Classi�cation experiments show the e�ects of micro-
phone variations on the signal representation, feature extraction and acoustic mod-
eling components in the speech recognition system. These experiments are useful for
analysis. Recognition experiments show the e�ects of microphone variations on the
entire system, combining the classi�cation with the segmentation and search compo-
nents. These experiments are more complex and result in higher error rates that are
more di�cult to analyze.
In order to establish a complete set of benchmarks, experiments cover all micro-
phone training and testing conditions before and after downsampling. The Sennheiser
48
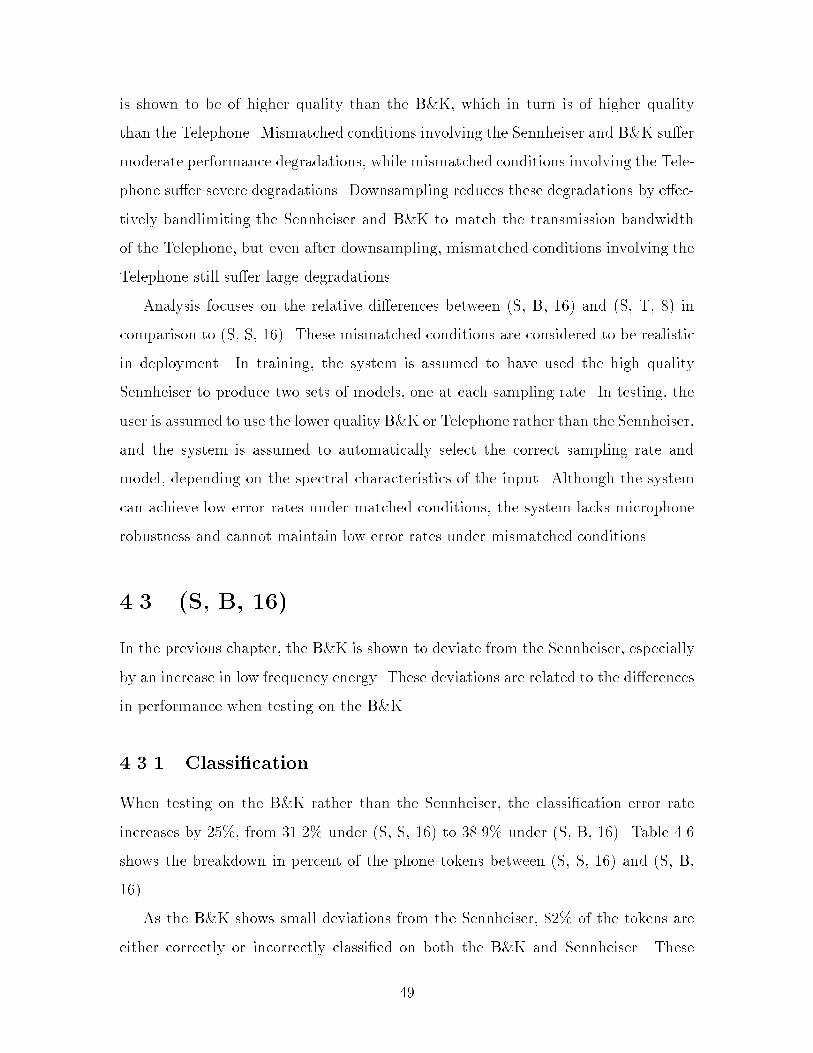
is shown to be of higher quality than the B&K, which in turn is of higher quality
than the Telephone. Mismatched conditions involving the Sennheiser and B&K su�er
moderate performance degradations, while mismatched conditions involving the Tele-
phone su�er severe degradations. Downsampling reduces these degradations by e�ec-
tively bandlimiting the Sennheiser and B&K to match the transmission bandwidth
of the Telephone, but even after downsampling, mismatched conditions involving the
Telephone still su�er large degradations.
Analysis focuses on the relative di�erences between (S, B, 16) and (S, T, 8) in
comparison to (S, S, 16). These mismatched conditions are considered to be realistic
in deployment. In training, the system is assumed to have used the high quality
Sennheiser to produce two sets of models, one at each sampling rate. In testing, the
user is assumed to use the lower quality B&K or Telephone rather than the Sennheiser,
and the system is assumed to automatically select the correct sampling rate and
model, depending on the spectral characteristics of the input. Although the system
can achieve low error rates under matched conditions, the system lacks microphone
robustness and cannot maintain low error rates under mismatched conditions.
4.3 (S, B, 16)
In the previous chapter, the B&K is shown to deviate from the Sennheiser, especially
by an increase in low frequency energy. These deviations are related to the di�erences
in performance when testing on the B&K.
4.3.1 Classi�cation
When testing on the B&K rather than the Sennheiser, the classi�cation error rate
increases by 25%, from 31.2% under (S, S, 16) to 38.9% under (S, B, 16). Table 4.6
shows the breakdown in percent of the phone tokens between (S, S, 16) and (S, B,
16).
As the B&K shows small deviations from the Sennheiser, 82% of the tokens are
either correctly or incorrectly classi�ed on both the B&K and Sennheiser. These
49

(S, B, 16) correct (S, B, 16) incorrect(S, S, 16) correct 56 13(S, S, 16) incorrect 5 26
Table 4.6: Breakdown in percent of tokens between (S, S, 16) and (S, B, 16)
tokens do not contribute to information about relative performance and are not ex-
amined. Instead, the remaining 18% of the tokens that are correctly classi�ed under
one condition and incorrectly classi�ed under the other are extracted for examination.
Analysis focuses on the 13% of the tokens that are incorrectly classi�ed under
(S, B, 16) but correctly classi�ed under (S, S, 16). These tokens are the additional
classi�cation errors due to testing on the B&K rather than the Sennheiser. In order to
examine general errors, these additional misclassi�cations are grouped into the broad
phonetic classes described in Table 3.2. Table 4.7 shows the frequency in percent of
the most frequent misclassi�cations between various broad classes that occur due to
testing on the B&K.
Class Class FrequencyVowel Vowel 29.9Weak obstruent Weak obstruent 15.6Strong obstruent Strong obstruent 9.6Vowel Semivowel 7.6Nasal Silence 4.5Weak obstruent Silence 4.3Nasal Weak obstruent 4.0
Table 4.7: Frequency in percent of the most frequent broad class misclassi�cationsdue to the B&K
Overall, approximately 60% of the misclassi�cations occur within broad classes,
while the remaining 40% occur between broad classes. The table shows the most
frequent within and between class errors, totaling to approximately 75% of the addi-
tional misclassi�cations between (S, B, 16) and (S, S, 16).
The within-class errors almost all occur within one of the vowel or obstruent
classes. These results are consistent with the observations in the previous chapter that
50

the B&K vowels and obstruents show small deviations from those of the Sennheiser,
leading to errors within broad classes. For example, vowels can be confused with each
other due to variations in formant frequencies. Obstruents can be confused due to
variations in the voicing feature.
The between-class errors mostly occur between the nasal, silence and weak obstru-
ent classes or the vowel and semivowel classes. These results are also consistent with
the observations in the previous chapter that the B&K nasals and silences show larger
deviations from those of the Sennheiser, leading to errors between broad classes. For
example, nasals, silences and weak obstruents are similar in that they have low levels
of energy and can be confused due to variations in nasal resonances, voicing, and
environmental noise. Vowels and semivowels are similar in formant structure and can
be confused due to variations in spectral amplitudes.
In order to examine speci�c errors, the additional misclassi�cations are sorted by
phoneme. Table 4.8 shows the frequency in percent of the most frequent misclassi�-
cations of various phonemes with their most frequent substitutions that occur due to
testing on the B&K.
Phoneme Frequency Substitutioncl 14.1 ns 11.2 zt 6.2 dp 4.9 bv 4.9 mE 4.4 If 4.1 v
Table 4.8: Frequency in percent of the most frequent misclassi�cations with theirmost frequent substitutions due to the B&K
The table shows the seven phonemes that are most often misclassi�ed, totaling to
approximately 50% of the additional misclassi�cations between (S, B, 16) and (S, S,
16). Some phonemes are often misclassi�ed as phonemes in other broad classes. For
example, the silence class, /cl/, accounts for the largest percent of additional misclas-
si�cations and is most frequently misclassi�ed as the nasal, /n/. The weak voiced
51

fricative, /v/, is often misclassi�ed as the nasal, /m /. These errors are presumably
due to confusions over nasal resonance, voicing and room noise.
Other phonemes are often misclassi�ed within their broad class. For example, the
unvoiced fricatives, /s/ and /f/, and stops, /t/ and /p/, are often misclassi�ed as
their voiced counterparts, /z/, /v/, /d/ and /b/. In fact, 67% of the within-obstruent
errors are misclassi�cations between unvoiced and voiced phonemes, presumably due
to confusions over voicing and noise energy. In addition, the lax vowel, /E/, is often
misclassi�ed as another lax vowel, /I/, presumably due to confusions over formant
frequencies.
Four of the most frequent confusion pairs, the misclassi�cations of /cl/ as /n/, /s/
as /z/, /v/ as /m / and /E/ as /I/, are extracted for further examination. Figure 4-
1 shows mean MFSCs averaged over the training set for these frequent confusion
pairs that occur due to testing on the B&K. The B&K and Sennheiser recordings of
the misclassi�ed phoneme are respectively denoted by solid and dotted lines. The
Sennheiser recording of the substituted class is denoted by a dashed line.
The occurrence of a confusion means that the B&K recording of the misclassi-
�ed phoneme di�ers from the Sennheiser recording of that phoneme and resembles
the Sennheiser recording of the substituted phoneme. As measured by normalized
distance, the B&K phoneme, denoted by the solid line, is often closer to the in-
correct Sennheiser phoneme, denoted by the dotted line, than the correct Sennheiser
phoneme, denoted by the dashed line. Although the confusions involve di�erent broad
classes with di�erent spectral characteristics, they all show low frequency deviations.
The between-class confusions of /cl/ as /n/ and /v/ as /m / can be explained by the
peak in low frequency energy in the B&K /cl/ and /v/. The within-class confusions
of /s/ as /z/ and /E/ and /I/ can be explained by the variations at low frequencies
in the B&K /s/ and /E/.
Having analyzed the additional errors due to the B&K, analysis is shifted to the
5% of the tokens that are incorrectly classi�ed under (S, S, 16) and correctly classi�ed
under (S, B, 16). These are the additional errors due to testing on the Sennheiser
rather than the B&K. Table 4.9 shows the frequency in percent of the most frequent
52

| /cl/ (B) � � � /cl/ (S) - - /n/ (S) | /s/ (B) � � � /s/ (S) - - /z/ (S)
0 10 20 30 40
35
40
45
50
55
MFSC0 10 20 30 40
40
50
60
70
MFSC
| /v/ (B) � � � /v/ (S) - - /m / (S) | /E/ (B) � � � /I/ (S) - - /E/ (S)
0 10 20 30 40
45
50
55
60
MFSC0 10 20 30 40
55
60
65
70
75
MFSC
Figure 4-1: Mean MFSCs over the training set for frequent confusion pairs due to theB&K
53

misclassi�cations of various phonemes with their most frequent substitutions due to
testing on the Sennheiser.
Phoneme Frequency Substitutionz 30.1 si 18.6 |u 6.2 w
Table 4.9: Frequency in percent of the most frequent misclassi�cations with theirmost frequent substitutions due to the Sennheiser
In comparing (S, S, 16) to (S, B, 16), /z/ accounts for the largest percent of
additional misclassi�cations and is most frequently misclassi�ed as /s/. In contrast,
misclassi�cations of /s/ as /z/ are common in comparing (S, B, 16) to (S, S, 16). This
trend describes many of the misclassi�cations that occur under matched conditions
but not under mismatched conditions. In general, under mismatched conditions,
classes that are often substituted for other classes may also be correctly classi�ed more
often. On the other hand, these occurrences may result from incorrect transcription
of the corpus. For example, English voiced fricatives, such as /z/, are often devoiced,
especially at the end of the sentence. Some of these devoiced phonemes may have
been mislabeled by human transcribers due to phonological compensation.
4.3.2 Recognition
When testing on the B&K rather than the Sennheiser, the recognition error rate
increases by 15%, from 51.2% under (S, S, 16) to 59.0% under (S, B, 16). The substi-
tution and deletion rates respectively increase by 15% and 29%, while the insertion
rate decreases by 8%. These di�erences are separated for further examination.
Substitutions
47% of the additional errors are substitutions. Table 4.10 shows the frequency in per-
cent of the most frequent substitutions of various phonemes with their most frequent
misclassi�cations due to testing on the B&K.
54

Phoneme Frequency Misclassi�cationcl 20.2 ns 10.1 zk 7.7 tt 7.2 dp 4.6 b
Table 4.10: Frequency in percent of the most frequent substitutions with their mostfrequent misclassi�cations due to the B&K
The table shows the �ve phonemes that account for the largest increase in substi-
tutions, totaling to approximately 50% of the additional substitutions between (S, B,
16) and (S, S, 16). /cl/ accounts for the largest percent of additional substitutions
and is most frequently confused with /n/. The remaining substitutions are unvoiced
obstruents, /s/, /t/ and /p/, which are often confused with their voiced counterparts,
/z/, /d/ and /b/. These substitutions are presumably due to low frequency di�er-
ences between the B&K and Sennheiser that obscure nasal resonance, voicing and
environmental noise. Furthermore, these substitutions resemble the errors in classi�-
cation and suggest that some of the previous analyses can be applied to recognition.
Deletions
The remaining 53% of the additional errors are deletions. Table 4.11 shows the
frequency in percent of the most frequent deletions due to testing on the B&K.
The table shows the phonemes that account for the largest increase in deletions,
totaling to approximately 50% of the additional deletions between (S, B, 16) and
(S, S, 16). /cl/ accounts for the largest percent of additional deletions. Other weak
events, such as the nasal, /n/, and the reduced vowels, /^/, /|/ and /}/ are also
often deleted. These deletions are presumably due to e�ects such as environmental
noise that obscure the presence of weak events. In addition, the obstruents, /s/, /p/
and /t/, are often deleted. These deletions also resemble the errors in classi�cation
and suggest that phonemes that have low classi�cation scores may be deleted rather
55

Phoneme Frequencycl 20.3n 4.9^ 4.7s 4.4} 4.2| 4.2p 4.2t 3.9
Table 4.11: Frequency in percent of the most frequent deletions due to the B&K
than substituted.
Insertions
In comparing (S, B, 16) to (S, S, 16), the insertion rate decreases. Table 4.12 shows
the frequency in percent of the most frequent insertions that do not occur when
testing on the B&K.
Phoneme Frequencyt 18.0k 11.5cl 9.8? 7.4• 5.7
Table 4.12: Frequency in percent of the most frequent insertions that do not occuron the B&K
The phonemes, such as /t/ and /cl/, that account for large percentages of the
decrease in insertions, also account for large percentages of the increase in deletions.
This trend describes many of the insertions that occur under matched conditions but
not under mismatched conditions. In general, under mismatched conditions, classes
that are often deleted may not be inserted as often.
56
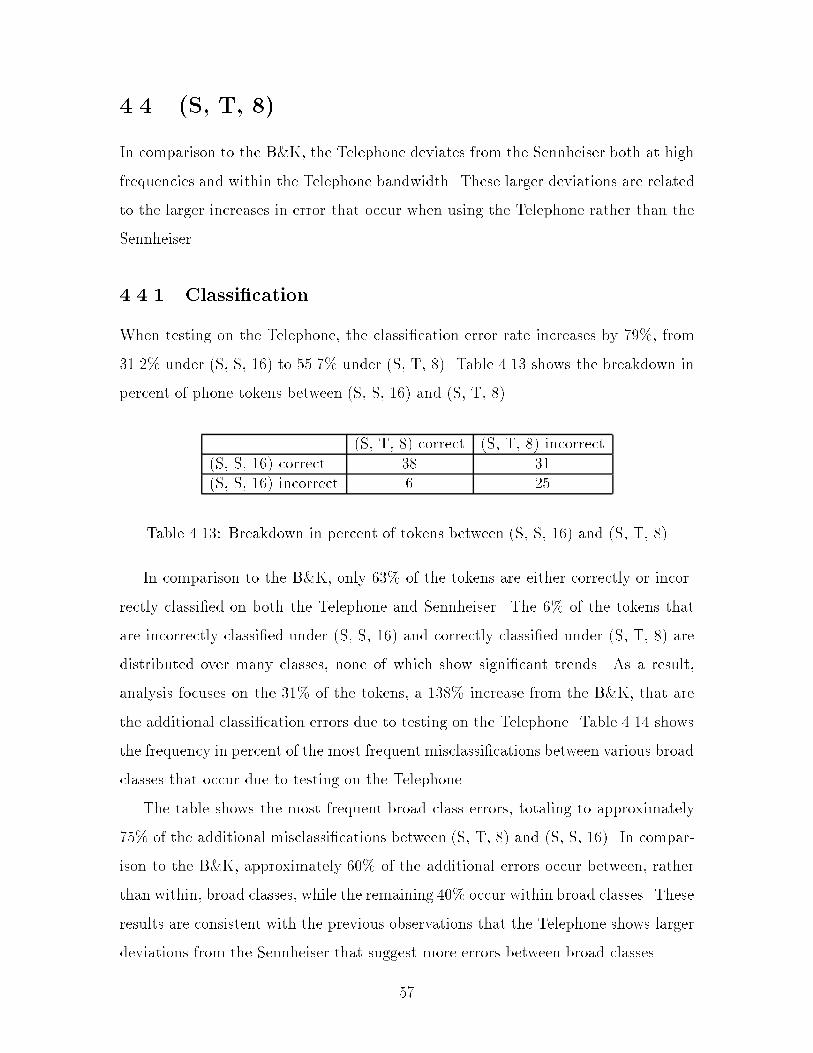
4.4 (S, T, 8)
In comparison to the B&K, the Telephone deviates from the Sennheiser both at high
frequencies and within the Telephone bandwidth. These larger deviations are related
to the larger increases in error that occur when using the Telephone rather than the
Sennheiser.
4.4.1 Classi�cation
When testing on the Telephone, the classi�cation error rate increases by 79%, from
31.2% under (S, S, 16) to 55.7% under (S, T, 8). Table 4.13 shows the breakdown in
percent of phone tokens between (S, S, 16) and (S, T, 8).
(S, T, 8) correct (S, T, 8) incorrect(S, S, 16) correct 38 31(S, S, 16) incorrect 6 25
Table 4.13: Breakdown in percent of tokens between (S, S, 16) and (S, T, 8)
In comparison to the B&K, only 63% of the tokens are either correctly or incor-
rectly classi�ed on both the Telephone and Sennheiser. The 6% of the tokens that
are incorrectly classi�ed under (S, S, 16) and correctly classi�ed under (S, T, 8) are
distributed over many classes, none of which show signi�cant trends. As a result,
analysis focuses on the 31% of the tokens, a 138% increase from the B&K, that are
the additional classi�cation errors due to testing on the Telephone. Table 4.14 shows
the frequency in percent of the most frequent misclassi�cations between various broad
classes that occur due to testing on the Telephone.
The table shows the most frequent broad class errors, totaling to approximately
75% of the additional misclassi�cations between (S, T, 8) and (S, S, 16). In compar-
ison to the B&K, approximately 60% of the additional errors occur between, rather
than within, broad classes, while the remaining 40% occur within broad classes. These
results are consistent with the previous observations that the Telephone shows larger
deviations from the Sennheiser that suggest more errors between broad classes.
57
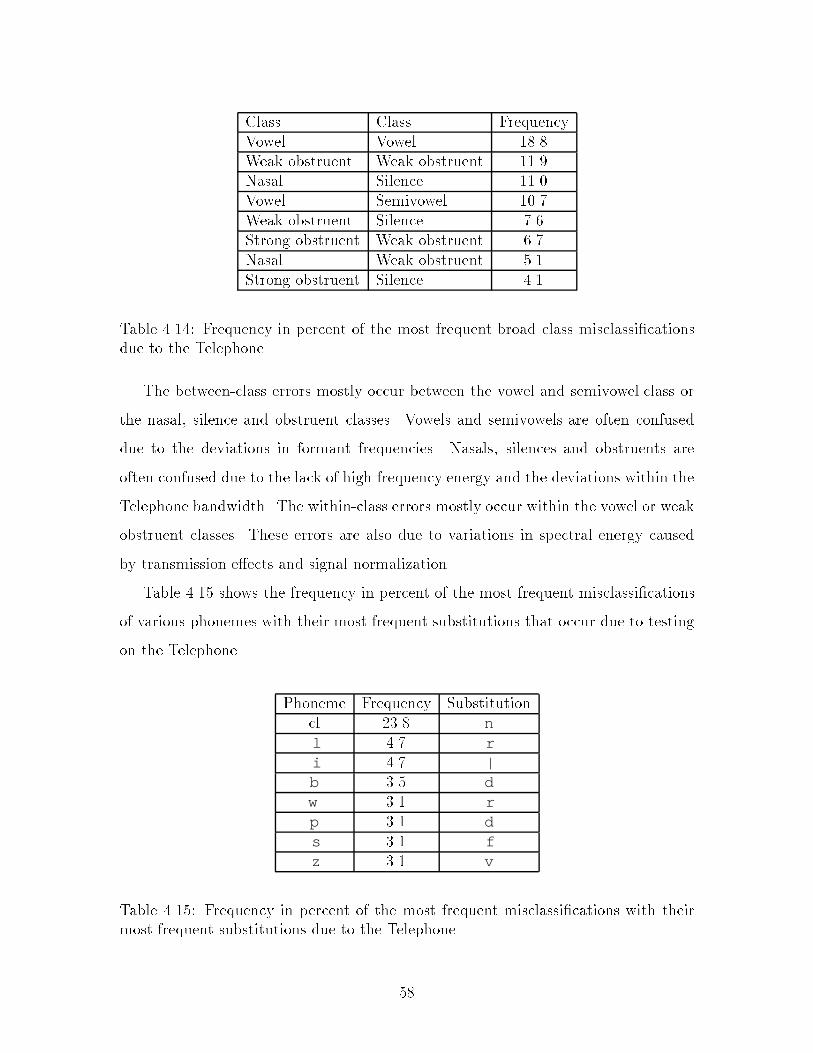
Class Class FrequencyVowel Vowel 18.8Weak obstruent Weak obstruent 11.9Nasal Silence 11.0Vowel Semivowel 10.7Weak obstruent Silence 7.6Strong obstruent Weak obstruent 6.7Nasal Weak obstruent 5.1Strong obstruent Silence 4.1
Table 4.14: Frequency in percent of the most frequent broad class misclassi�cationsdue to the Telephone
The between-class errors mostly occur between the vowel and semivowel class or
the nasal, silence and obstruent classes. Vowels and semivowels are often confused
due to the deviations in formant frequencies. Nasals, silences and obstruents are
often confused due to the lack of high frequency energy and the deviations within the
Telephone bandwidth. The within-class errors mostly occur within the vowel or weak
obstruent classes. These errors are also due to variations in spectral energy caused
by transmission e�ects and signal normalization.
Table 4.15 shows the frequency in percent of the most frequent misclassi�cations
of various phonemes with their most frequent substitutions that occur due to testing
on the Telephone.
Phoneme Frequency Substitutioncl 23.8 nl 4.7 ri 4.7 |b 3.5 dw 3.1 rp 3.1 ds 3.1 fz 3.1 v
Table 4.15: Frequency in percent of the most frequent misclassi�cations with theirmost frequent substitutions due to the Telephone
58

The table shows the eight phonemes that are most often misclassi�ed, totaling to
approximately 50% of the additional misclassi�cations between (S, T, 8) and (S, S,
16). The silence class, /cl/, accounts for almost 25% of additional misclassi�cations
and is most frequently misclassi�ed as the nasal, /n/. /cl/ is also often confused with
other weak events, such as the weak and strong voiced fricatives, /v/ and /z/. These
errors constitute many of the between-broad-class errors.
The stops, /b/ and /p/ and fricatives, /s/, /z/ and /f/ are often misclassi�ed
as other stops and fricatives, /d/, /f/, /v/ and /s/. In comparison to the B&K
obstruents, which are often misclassi�ed along the voicing dimension due to low fre-
quency variations, the Telephone obstruents are often misclassi�ed along the place-
of-articulation dimension due to the lack of high frequency information. The tense
vowel, /i/, and semivowels, /w / and /l/, are often misclassi�ed as the reduced vowel
and semivowels, /|/ and /r/. In comparison to the B&K vowels and semivowels,
which show reasonable misclassi�cations due to small variations at low frequencies,
the Telephone vowels and semivowels are often coarsely misclassi�ed due to larger
deviations over the formant region.
Four of the most frequent confusion pairs, the misclassi�cations of /cl/ as /n/, /l/
as /r/, /i/ as /I/ and /b/ as /d/, are extracted for further examination. Figure 4-2
shows mean MFSCs averaged over the training set for these frequent confusion pairs
that occur due to testing on the Telephone.
As measured by normalized distance over the 30 lower MFSCs, the misclassi�ed
Telephone phoneme is often closer to the incorrect Sennheiser phoneme than the
correct Sennheiser phoneme. Even within the Telephone bandwidth, the Telephone
shows deviations at all frequencies. The confusion of /cl/ as /n/ can be explained by
the increase in background energy due to transmission and normalization e�ects. The
confusions of /l/ as /r/ and /i/ and /I/ can be explained by the variations in spectral
energy within the formant region. The confusion of /b/ as /d/ can be explained by
the variations in low frequency energy.
59

| /cl/ (T) � � � /cl/ (S) - - /n/ (S) | /l/ (T) � � � /l/ (S) - - /r/ (S)
0 10 20 30 40
35
40
45
50
55
MFSC0 10 20 30 40
45
50
55
60
65
70
MFSC
| /i/ (T) � � � /i/ (S) - - /I/ (S) | /b/ (T) � � � /b/ (S) - - /d/ (S)
0 10 20 30 40
45
50
55
60
65
70
MFSC0 10 20 30 40
45
50
55
60
MFSC
Figure 4-2: Mean MFSCs over the training set for frequent confusion pairs due to theTelephone
60

4.4.2 Recognition
When testing on the Telephone, the recognition error rate increases by 15%, from
51.2% under (S, S, 16) to 73.1% under (S, T, 8). The substitution and deletion rates
respectively increase by 18% and 137%, while the insertion rate decreases by 60%.
Substitutions
18% of the additional error are substitutions. Table 4.16 shows the frequency in per-
cent of the most frequent substitutions of various phonemes with their most frequent
misclassi�cations due to testing on the Telephone.
Phoneme Frequency Misclassi�cationcl 38.3 ft 9.0 rs 6.0 r
Table 4.16: Frequency in percent of the most frequent substitutions with their mostfrequent misclassi�cations due to the Telephone
/cl/ accounts for almost 40% of additional substitutions and is most frequently
confused with the weak unvoiced fricative, /f/. /cl/ is also confused with other weak
events such as the lax vowel, /|/, and the nasal, /n/. These errors are presumably
due to deviations that obscure weak features. In addition, the unvoiced stop, /t/,
and fricative, /s/, are often confused with /r/. These errors are presumably due to
deviations that obscure mid and high frequency features.
Deletions
The remaining 82% of the additional errors are deletions. Table 4.17 shows the
frequency in percent of the most frequent deletions of various phonemes due to testing
on the Telephone.
The table shows the phonemes that account for the largest increase in deletions,
totaling to approximately 50% of the additional deletions between (S, T, 8) and
61

Phoneme Frequencycl 22.5z 4.2| 4.1s 3.7I 3.7t 3.2b 3.1D 3.0n 2.9
Table 4.17: Frequency in percent of the most frequent deletions due to the Telephone
(S, S, 16). /cl/ accounts for almost 25% of the additional deletions. Other weak
events, such as the bandlimited obstruents, /z/, /s/, /t/, /b/ and /D/, the reduced
vowels, /|/ and /I/, and the nasal, /n/, are also often deleted. These deletions are
presumably due to transmission e�ects that obscure the presence of weak events.
These deletions also resemble the errors in classi�cation and suggest that some of the
previous analyses can be applied to recognition. The large di�erences between the
Telephone and Sennheiser suggest very low classi�cation scores that may lead to large
increases in deletions.
Insertions
In comparing (S, T, 8) to (S, S, 16), the insertion rate decreases. Table 4.18 shows
frequency in percent of the most frequent insertions of various phonemes that do not
occur when testing on the Telephone.
As with the B&K, phonemes that are often deleted may not be inserted as of-
ten. For example, /n/, /cl/ and /t/ account for large percentages of the decrease in
insertions and the increase in deletions.
62

Phoneme Frequencyn 21.4cl 15.8h# 9.9t 9.6
Table 4.18: Frequency in percent of the most frequent insertions that do not occuron the Telephone
4.5 Summary
Baseline experiments are performed in phonetic classi�cation and recognition for all
microphone conditions before and after downsampling. Analysis focuses on the real-
istic mismatched conditions when the system is trained on the Sennheiser and tested
on the B&K or Telephone. The classi�cation and recognition systems su�er mod-
erate performance degradations when tested on the B&K and severe performance
degradations when tested on the Telephone. Although recognition is more di�cult to
analyze, with the use of consistent systems, the additional recognition errors, mostly
deletions and substitutions, are shown to resemble the additional classi�cation er-
rors, and the understanding gained from classi�cation may generalize to recognition.
Both mismatched conditions su�er large increases in error due to closures and other
weak events and vowels and semivowels that can be easily confused. In addition, the
B&K shows large increases in error between voiced and unvoiced obstruents due to
its deviation from the Sennheiser at low frequencies, and the Telephone shows large
increases in error rate between all obstruents due to its deviation at high frequencies.
63

Chapter 5
Preprocessing Techniques
Experiments are performed with preprocessing techniques that do not require micro-
phone-speci�c data. These experiments are compared and analyzed to understand
the e�ects of preprocessing on the speech recognition system. Analysis focuses on the
techniques that achieve the lowest error rates under the mismatched conditions when
training on the Sennheiser and testing on the B&K or Telephone.
5.1 Description
Of the techniques developed towards microphone robustness, the most common pre-
processing techniques apply signal processing algorithms directly to the recorded
signal in order to compensate for the e�ects of microphone variations before input
to the speech recognition system. Preprocessing techniques vary from requiring no
microphone-speci�c data to requiring simultaneously recorded microphone training
data. This thesis focuses on preprocessing techniques that do not use microphone-
speci�c data.
5.1.1 Convolutional E�ects
Mean Normalization (MN) [3, 23] and Relative Spectral Processing (RASTA) [14] are
two related techniques that focus on compensating for e�ects that are modeled by
64

convolution in the time domain. Broad Class Mean Normalization (BCMN) applies
MN to segment-based systems and uses a preliminary broad class hypothesis for each
segment. All of these techniques assume that the convolutional e�ects on the recorded
signal do not vary over the interval of interest, and estimate compensation vectors to
subtract in the cepstral domain.
MN
In MN [3, 23], Equation 5.1 is applied to each cepstral frame in the utterance.
�y[m] = �x[m]�1
N
NXn=1
�x[n] (5:1)
where
�x[m] : cepstral vector for frame m
�y[m] : compensated cepstral vector for frame m
N : number of frames in the utterance
1 � m � N
The MN compensation vector for each frame in the utterance is the cepstral mean
vector averaged over all frames in the utterance. Subtracting this vector removes
the non-varying component over each utterance and normalizes the mean across all
utterances. The development set is used to experiment with various mean estimates.
For example, shorter term means can be obtained by averaging over speci�ed numbers
of frames, and longer term means by averaging over all eight utterances spoken by
each speaker. The results presented are obtained using the cepstral mean vector
estimated from each utterance, which achieves comparable or lower error rates under
mismatched conditions than other estimates investigated.
65

RASTA
In RASTA [14], Equation 5.2 is applied to each cepstral frame in the utterance.
�y[m] = �x[m]� �x[m� 1] + ��y[m� 1] (5:2)
where
�x[m] : cepstral vector for frame m
�y[m] : compensated cepstral vector for frame m
� : exponential decay factor
RASTA applies an exponentially decaying highpass �lter to each utterance in
order to remove the slowly varying cepstral components over each utterance. In
comparison to MN, the RASTA compensation vector varies for each frame and is a
weighted average computed over an interval that depends on the exponential decay
factor, �. The development set is used to experiment with di�erent values of �. As
� approaches 1, RASTA achieves lower error rates under mismatched conditions. In
the limit, when � is 1, the average is computed over the entire utterance and removes
the non-varying component, as in MN. The results presented are obtained using an
� of 0.99.
BCMN
As shown in Chapters 3 and 4, microphones have di�erent e�ects on di�erent pho-
netic classes depending on their spectral characteristics, suggesting that techniques
should also vary for di�erent classes. BCMN attempts to account for broad class
e�ects in a segment-based system by making a preliminary broad class hypothesis for
the segment in the utterance and using these hypotheses to estimate cepstral com-
pensation vectors to subtract. Experiments show that, given the correct broad class
instead of the hypothesis, BCMN is very e�ective, suggesting that the technique can
reduce confusions over features that discriminate phonemes within broad classes. In
comparison to MN, the BCMN compensation vector varies for each broad class and
66

is the cepstral mean averaged over the segments that are hypothesized to belong to
that broad class. The development set is used to experiment with di�erent broad
class groupings. As the number of broad classes approaches 1, BCMN achieves lower
error rates under mismatched conditions. The results presented are obtained using
2 broad classes, one containing the sonorant vowels, semivowels and nasals and the
other containing the obstruents and silences.
5.1.2 Additive E�ects
Log-Spectral Subtraction (SUB) [33] focuses on compensating for e�ects that are
modeled by addition in the time domain. Segment-based subtraction (SSUB) applies
SUB to segment-based systems. Both techniques assume that the additive e�ects on
the recorded signal are uncorrelated with speech and do not vary over the interval of
interest, and estimate compensation vectors to subtract in the log spectral domain.
SUB
In SUB [33], Equation 5.3 is applied to each log spectral frame in the utterance.
�Y [m] = �X[m] + max(log(1� 10�X [m]� �N[m]); �Cmax[m]) (5:3)
where
�X [m] : log spectral vector for frame m
�Y [m] : compensated log spectral vector for frame m
�N [m] : estimated log spectral noise vector for frame m
�Cmax[m] : maximum log spectral compensation vector for frame m
The SUB compensation vector for each frame in the utterance is a function of the
recorded log spectral vector and the estimated noise vector. Adding this compensation
vector removes the e�ects of noise in the log spectral domain. The development set is
used to experiment with various noise estimates. For example, noise can be estimated
67
by setting thresholds on histograms or by averaging over silence regions. The results
presented are obtained using the noise vector estimated from the beginning and ending
silence regions for each utterance.
SSUB
Segment subtraction (SSUB) attempts to makemore accurate estimates for a segment-
based system by averaging over the frames in each segment. In comparison to SUB,
the SSUB log spectral compensation vector varies for each segment rather than for
each frame.
5.1.3 Combined E�ects
The linear cascade of SUB and MN (SUBMN) uses independent compensation vec-
tors to account for convolutional and additive e�ects. Codeword-Dependent Cepstral
Normalization (CDCN) [1] uses joint compensation vectors to account for the com-
bined e�ects. Both techniques assume that the additive e�ects on the recorded signal
are uncorrelated with speech.
SUBMN
SUBMN compensates for additive and convolutional e�ects by applying SUB followed
by MN. Experiments show that techniques that are e�ective individually are often
enhanced when combined and that the removal of additive followed by convolutional
e�ects is often more e�ective. The results presented are obtained using SUB in cas-
cade with MN, which achieves comparable or better results than other combinations
investigated.
CDCN
CDCN [1] compensates for joint e�ects by applying Maximum Likelihood (ML) es-
timation to determine convolutional and additive parameters and Minimum Mean
68

Square Error (MMSE) estimation to determine compensation vectors. Of all the
techniques described, CDCN is by far the most complex and is the only technique
not explictly implemented for this thesis. For details, refer to Acero's doctoral the-
sis [1].
5.2 Comparison
Classi�cation and recognition experiments under di�erent microphone conditions are
performed with the preprocessing techniques. Results are compared in order to un-
derstand the ability of preprocessing techniques to increase microphone robustness.
5.2.1 Classi�cation
Table 5.1 shows classi�cation error rates in percent for various preprocessing tech-
niques. Under (S, S), the baseline and compensated classi�cation error rates are shown
(S, S) (S, B) (S, T)Baseline 31.2 38.9 55.7MN 31.3 34.6 52.5RASTA 32.8 35.9 55.6BCMN 32.0 35.5 55.4SUB 31.9 39.5 55.1SSUB 31.9 39.1 54.0SUBMN 31.9 34.6 51.7CDCN 31.7 34.2 55.2
Table 5.1: Classi�cation error rates in percent for various preprocessing techniques
in the �rst column. For each training microphone, the baseline is the lower bound
on error rate, and preprocessing may increase error rates under matched conditions.
These increases in error rate for the matched conditions re ect the cost of using the
techniques to increase microphone robustness. With the exception of RASTA, none
of the techniques cause statistically signi�cant changes in error rate, suggesting that
the cost of using the techniques to increase microphone robustness in classi�cation is
69

small if not insigni�cant.
For each testing microphone, the baseline is the upper bound on error rate, and
preprocessing usually decreases error rates under mismatched conditions. These de-
creases in error rate with preprocessing re ect the ability of the techniques to reduce
the degradations due to mismatched testing. However, preprocessing usually does not
decrease error rates under mismatched conditions below error rates under matched
conditions. With respect to the matched condition, the remaining error rate increases
re ect the inability of the techniques to achieve complete microphone independence.
Under (S, B), the baseline and compensated classi�cation error rates are shown
in the second column of Table 5.1. For reference, the baseline classi�cation error rate
under (B, B) is 33.1%. All of the techniques signi�cantly decrease error rate, with
the exception of SUB and SSUB. Since SUB and SSUB focus on additive e�ects,
and the combined techniques achieve comparable results to techniques that focus on
convolutional e�ects, the di�erences between recording on the B&K and Sennheiser
in a noise-isolated environment may be mostly convolutional rather than additive.
Of the techniques, MN, SUBMN and CDCN insigni�cantly di�er from each other
in achieving the largest reductions in error rate, decreasing error by more than 10%
and resulting in less than 5% increases in error from (B, B). This suggests that
preprocessing can e�ectively compensate for the di�erences between the B&K and
Sennheiser.
Under (S, T), the baseline and compensated classi�cation error rates are shown
in the third column. For reference, the baseline classi�cation error rate under (T, T)
is 41.4%. None of the techniques signi�cantly decrease error rate, with the excep-
tion of MN and SUBMN. MN and SUBMN insigni�cantly di�er from each other in
achieving the largest reductions in error rate, decreasing error by approximately 5%.
Nevertheless, they are less e�ective for the Telephone than for the B&K, resulting in
approximately 25% increases in error from (T, T). This suggests that preprocessing
cannot compensate for the larger di�erences between the Telephone and Sennheiser.
Overall, MN and SUBMN are the most e�ective techniques in classi�cation. Un-
der matched conditions, these techniques do not degrade performance. Under mis-
70

matched conditions, they signi�cantly reduce the moderate degradations in the B&K
and slightly reduce the severe degradations in the Telephone.
5.2.2 Recognition
Table 5.2 shows recognition error rates in percent for various preprocessing techniques.
Recognition error rates are higher than classi�cation error rates but follow the same
(S, S) (S, B) (S, T)Baseline 51.2 59.0 73.1MN 51.1 54.8 71.0RASTA 52.8 56.2 72.1BCMN 53.0 58.8 76.1SUB 50.9 58.1 74.2SSUB 51.4 58.3 73.9SUBMN 51.7 55.3 73.2CDCN 51.1 54.6 67.7
Table 5.2: Recognition error rates in percent for various preprocessing techniques
trends. Under (S, S), the preprocessing techniques cause small changes in error rate,
re ecting that the cost of using the techniques to increase microphone robustness is
small.
Under (S, B), all of the techniques substantially decrease recognition error rate,
with the exception of SUB and SSUB, which do not focus on compensating for the
convolutional di�erences between the B&K and Sennheiser. MN and CDCN achieve
the largest decreases in error rate, by more than 7%, lowering the (S, B) error rate
to within 2% of the baseline (B, B) error rate of 52.9%.
Under (S, T), the large di�erences between the Telephone and Sennheiser render
most of the techniques ine�ective in recognition, and only MN, RASTA and CDCN
substantially decrease error rate. CDCN achieves the largest decrease in error rate,
by 7%, but still results in a 13% increase from the baseline (T, T) error rate of 59.8%.
The recognition results are similar to those in classi�cation except that CDCN is
more e�ective than the linear cascade of SUB and MN. Overall, MN and CDCN are
71

the most e�ective techniques in recognition. These techniques maintain performance
under (S, S), signi�cantly improve performance under (S, B) and slightly improve
performance under (S, T).
5.2.3 Discussion
Preprocessing techniques are benchmarked in phonetic classi�cation and recognition.
Of the techniques, MN, SUBMN and CDCN are most e�ective in increasing micro-
phone robustness for the TIMIT microphones, while RASTA and BCMN are moder-
ately e�ective, and SUB and SSUB have insigni�cant e�ects. Without increasing error
rates for the training microphone, the most e�ective techniques can maintain lower
error rates for testing microphones that are relatively similar to the training micro-
phone, but more severely mismatched conditions still su�er signi�cant performance
degradations. These techniques are further analyzed in the following section.
As an additional note, the preprocessing techniques are selected and implemented
based on a study of previous work and may not cover all approaches or use optimal
algorithms. The thesis does not aspire to achieve comprehensive coverage or optimal
implementation, nor does it attempt to determine whether one technique is absolutely
better than another. Rather, a consistent methodology is used to make comparisons
in order to improve understanding of the e�ects of preprocessing techniques on the
speech recognition system. Regardless, results always re ect the systems, corpora
and microphones used. For example, RASTA [14] is developed for a system that
uses a linear predictive front end, unlike the Mel-frequency cepstral front end used
in SUMMIT. SUB [33] and SSUB are developed for corpora that mainly di�er in
additive e�ects, unlike the Sennheiser and B&K corpora in TIMIT.
Furthermore, researchers have made and continue to make improvements towards
increased microphone robustness. In this thesis, modi�cations have been made, al-
gorithms have been developed, and improvements have been proposed. For example,
both SSUB and BCMN are developed for segment-based systems. These techniques
rely on segment hypotheses and can be improved with more robust segmentation.
BCMN also relies on broad class hypotheses and can be improved with more robust
72

classi�cation. In addition, instead of applying preprocessing techniques prior to and
separate from recognition, these techniques can be incorporated with other compo-
nents in the speech recognition system. For example, BCMN can be combined with
acoustic and language modeling to produce more robust broad class hypotheses and
more e�ective compensation. Preprocessing can also be combined with training to
produce more robust models, as discussed in the next chapter.
5.3 Analysis
Of the techniques, MN, SUBMN and CDCN are most e�ective, but since the cascade
of SUB and MN does not o�er signi�cant advantages over using MN alone, analysis
focuses on the MN and CDCN techniques, which represent the extremes with regard
to algorithmic and computational complexity. The MN [3, 23] algorithm estimates
a compensation vector using the mean averaged over each frame in the utterance.
With this simple algorithm, MN consistently achieves comparable or lower classi�-
cation and recognition error rates under all microphone conditions, except (S, T) in
recognition. The CDCN [1] algorithm estimates a compensation vector using iterative
ML and MMSE estimation techniques. With this complex algorithm, CDCN achieves
comparable results to MN, with superior performance under (S, T) in recognition.
Analysis focuses on MN, but CDCN is analyzed where its abilities exceed those of
MN.
By subtracting the cepstral mean from each utterance, MN normalizes the cepstral
mean averaged over the training set for each microphone to zero. Since the cepstral
and log spectral coe�cients are related by a linear transformation, the log spectral
mean is likewise normalized. The general e�ects of this compensation can be analyzed
by broad class. Figure 5-1 shows mean broad class MFSCs averaged over the training
set for each microphone after MN. In comparison to Figure 3-3, MN reduces the
di�erence between the B&K and Sennheiser for all broad classes, as measured by
normalized distance over 40 MFSCs. For example, MN compensates for the low
frequency peak in the B&K that is presumably due to nasal and glottal resonances
73

0 10 20 30 40−20
−10
0
10
20
Vowel
MFSC0 10 20 30 40
−20
−10
0
10
20
Strong obstruent
MFSC
0 10 20 30 40−20
−10
0
10
20
Semivowel
MFSC0 10 20 30 40
−20
−10
0
10
20
Weak obstruent
MFSC
0 10 20 30 40−20
−10
0
10
20
Nasal
MFSC0 10 20 30 40
−20
−10
0
10
20
Silence
MFSC
|
Sennheiser - - B&K -�- Telephone
Figure 5-1: Mean broad class MFSCs over the training set for each microphone afterMN
74
and environmental e�ects, suggesting fewer confusions between the nasal and silence
classes and within the obstruent and vowel classes. As measured by normalized
distance over the lower 30 MFSCs, MN reduces the di�erences between the Telephone
and Sennheiser for all broad classes, except the weak obstruent class. For example,
MN compensates for the variations in the vowel and semivowel classes that may
obscure formant energies, suggesting fewer confusions within and between the vowels
and semivowels. Overall, the e�ects of the preprocessing suggest reductions in error
under mismatched conditions, although in comparison to the B&K, the Telephone
still shows signi�cant residual deviations even after preprocessing. A more detailed
analysis of (S, B) and (S, T) in classi�cation and recognition show the types of errors
that can be e�ectively compensated for and the types of errors that still occur despite
preprocessing.
5.3.1 (S, B)
In the previous chapter, the baseline (S, B) and (S, S) conditions are compared to
analyze the additional errors due to mismatched testing. In this section, a comparison
is made of the (S, B) condition, before and after preprocessing, to show how the
baseline errors are a�ected by preprocessing. Analysis focuses on MN, since CDCN
does not o�er signi�cant advantages for (S, B).
Classi�cation
MN decreases the classi�cation error rate by 11%, from 38.9% under the baseline
to 34.6% after preprocessing. Analysis focuses on those tokens that are incorrectly
classi�ed under the baseline but correctly classi�ed after MN. Table 5.3 shows the
frequency in percent of the most frequent misclassi�cations of these tokens with their
most frequent substitutions. The table shows the eight phonemes that are most often
misclassi�ed under the baseline but not after MN, totaling to approximately 50% of
the reduction in error caused by preprocessing. In comparison to Table 4.8, these
corrections are similar to the errors caused by mismatched testing on the B&K rather
75
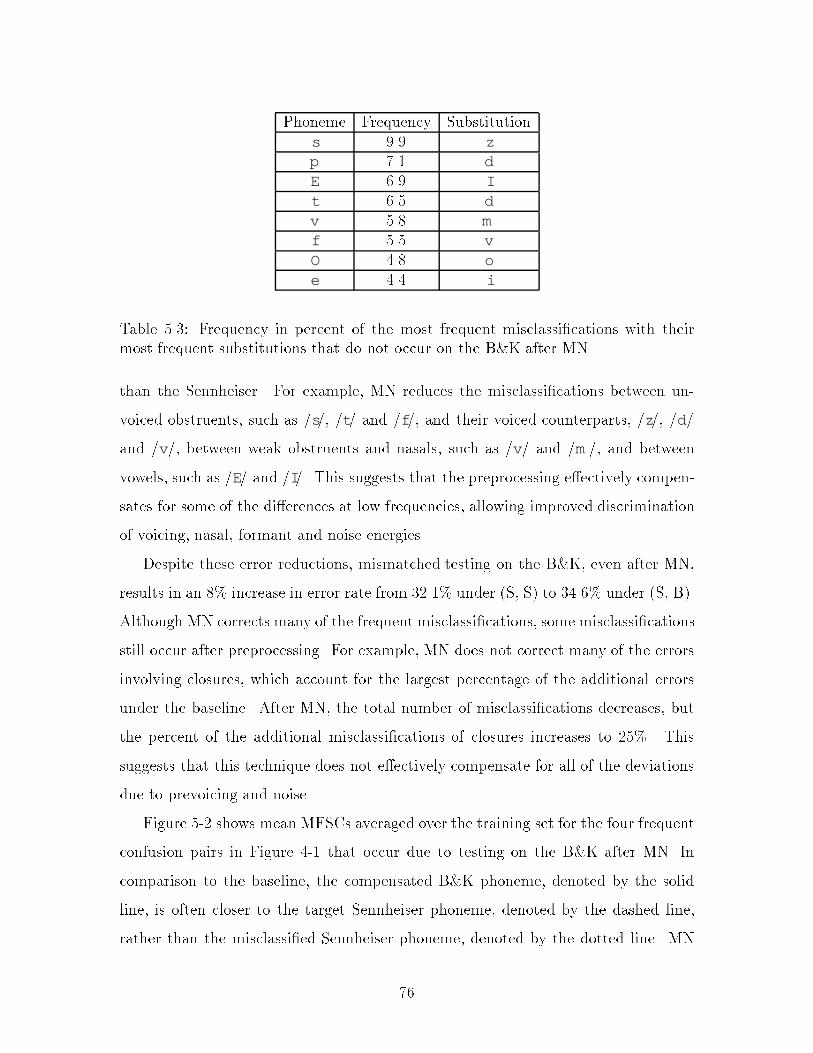
Phoneme Frequency Substitutions 9.9 zp 7.1 dE 6.9 It 6.5 dv 5.8 mf 5.5 vO 4.8 oe 4.4 i
Table 5.3: Frequency in percent of the most frequent misclassi�cations with theirmost frequent substitutions that do not occur on the B&K after MN
than the Sennheiser. For example, MN reduces the misclassi�cations between un-
voiced obstruents, such as /s/, /t/ and /f/, and their voiced counterparts, /z/, /d/
and /v/, between weak obstruents and nasals, such as /v/ and /m /, and between
vowels, such as /E/ and /I/. This suggests that the preprocessing e�ectively compen-
sates for some of the di�erences at low frequencies, allowing improved discrimination
of voicing, nasal, formant and noise energies.
Despite these error reductions, mismatched testing on the B&K, even after MN,
results in an 8% increase in error rate from 32.1% under (S, S) to 34.6% under (S, B).
Although MN corrects many of the frequent misclassi�cations, some misclassi�cations
still occur after preprocessing. For example, MN does not correct many of the errors
involving closures, which account for the largest percentage of the additional errors
under the baseline. After MN, the total number of misclassi�cations decreases, but
the percent of the additional misclassi�cations of closures increases to 25%. This
suggests that this technique does not e�ectively compensate for all of the deviations
due to prevoicing and noise.
Figure 5-2 shows mean MFSCs averaged over the training set for the four frequent
confusion pairs in Figure 4-1 that occur due to testing on the B&K after MN. In
comparison to the baseline, the compensated B&K phoneme, denoted by the solid
line, is often closer to the target Sennheiser phoneme, denoted by the dashed line,
rather than the misclassi�ed Sennheiser phoneme, denoted by the dotted line. MN
76

| /cl/ (B) � � � /cl/ (S) - - /n/ (S) | /s/ (B) � � � /s/ (S) - - /z/ (S)
0 10 20 30 40−20
−15
−10
−5
0
5
MFSC0 10 20 30 40
−10
0
10
20
MFSC
| /v/ (B) � � � /v/ (S) - - /m / (S) | /E/ (B) � � � /I/ (S) - - /E/ (S)
0 10 20 30 40
5
10
15
20
MFSC0 10 20 30 40
−5
0
5
10
MFSC
Figure 5-2: Mean MFSCs over the training set for frequent confusion pairs due to theB&K after MN
e�ectively compensates for many of the di�erences at low frequencies, suggesting
fewer misclassi�cations after preprocessing. For example, the low frequency variation
that confuses the voicing feature between /s/ and /z/ is removed. The low frequency
peaks that confuse the voiced and nasalized events, /v/ and /m /, are separated. The
low frequency peaks that confuse the formants of /E/ and /I/ are also discriminated.
Relative to these corrections, the confusion between /cl/ and /n/ is not as e�ectively
compensated for, suggesting misclassi�cations even after preprocessing.
77

Recognition
Table 5.4 shows recognition error rates in percent before and after MN. MN decreases
Total Substitution Deletion InsertionBaseline 59.0 30.7 20.7 7.7MN 54.8 29.0 16.2 9.6
Table 5.4: Recognition error rates in percent before and after MN
the total recognition error rate by 7%. As in classi�cation, MN e�ectively compensates
for many, but not all, of the additional errors caused by mismatched testing on the
B&K rather than the Sennheiser. After preprocessing, testing on the B&K still causes
a 7% increase in recognition error rate from 51.2% under (S, S) to 54.8% under (S,
B). Analysis focuses on the more frequent substitutions and deletions.
Decreases in substitutions account for 27% of the reduction in error. Table 5.5
shows the frequency in percent of the most frequent substitutions of various phonemes
with their most frequent misclassi�cations that do not occur when testing on the B&K
after MN. The table shows the seven phonemes that are most often substituted un-
Phoneme Frequency Misclassi�cations 10.1 zn 9.4 mk 7.9 tcl 7.2 DE 6.8 Ir 6.5 5t 6.1 d
Table 5.5: Frequency in percent of the most frequent substitutions with their mostfrequent misclassi�cations that do not occur on the B&K after MN
der the baseline but not after MN, totaling to approximately 50% of the decrease in
subsitutions caused by preprocessing. MN e�ectively compensates for many of the
baseline substitutions shown in Table 4.10. For example, MN reduces the substitu-
tions within obstruents, such as /s/ and /z/, /k/ and /t/, and /t/ and /d/. MN also
78

reduces some of the substitutions involving closures. Despite these error reductions,
MN only corrects some of the baseline errors, and many of the same substitutions still
occur after preprocessing. Even after MN, mismatched testing on the B&K results in
a 9% increase in substitution rate.
Decreases in deletions account for the remaining 73% of the reduction in error.
Table 5.6 shows the frequency in percent of the most frequent deletions of various
phonemes that do not occur when testing on the B&K after MN. The table shows
Phoneme Frequencycl 14.6n 7.7t 4.9l 4.4p 4.4E 4.1a 3.8| 3.8} 3.8
Table 5.6: Frequency in percent of the most frequent deletions that do not occur onthe B&K after MN
phonemes that are most often deleted under the baseline but not after MN, totaling to
approximately 50% of the decrease in deletions. MN e�ectively compensates for most
of the baseline deletions shown in Table 4.11. For example, MN reduces the deletions
of weak events such as /cl/, /n/, /t/, /p/ amd /}/. After MN, although mismatched
testing on the B&K results in increased substitution and insertion rates, the deletion
rate does not change. This suggests that preprocessing can e�ectively compensate
for e�ects, such as additive noise, which may obscure the presence of weak events.
This also suggests that preprocessing may signi�cantly improve classi�cation scores,
resulting in fewer deletions.
79

5.3.2 (S, T)
In comparison to B&K, the Telephone shows larger deviations both at high frequencies
and within the Telephone bandwidth that cause larger increases in error when using
the Telephone. In this section, a comparison is made of the (S, T) condition, before
and after preprocessing. Although MN achieves lower error rates in classi�cation,
CDCN achieves lower error rates in recognition. Analysis attempts to reveal the
advantages of each technique.
Classi�cation
MN decreases the classi�cation error rate by 6%, from 55.7% under the baseline to
52.5% after preprocessing. Of those tokens that are incorrectly classi�ed under the
baseline but correctly classi�ed after MN, Table 5.7 shows the frequency in percent
of the most frequent misclassi�cations with their most frequent substitutions. The
Phoneme Frequency Substitution| 18.8 rcl 13.1 nz 7.4 vl 6.8 r{ 6.0 r
Table 5.7: Frequency in percent of the most frequent misclassi�cations with theirmost frequent substitutions that do not occur on the Telephone after MN
table shows the phonemes that are most often misclassi�ed under the baseline but
not after MN, totaling to approximately 50% of the error reduction. In comparison to
Table 4.15, these corrections are similar in kind to the errors caused by mismatched
testing on the Telephone, but preprocessing only compensates for a small fraction of
the large numbers of baseline errors. Even after MN, using the Telephone results in
a 68% increase in error rate from 32.1% under (S, S) to 52.5% under (S, T), and all
of the baseline misclassi�cations still occur after preprocessing. This suggests that
the preprocessing can only partially compensate for the large di�erences between the
80

Telephone and Sennheiser.
Figure 5-3 shows mean MFSCs averaged over the training set after MN for two of
the frequent confusion pairs in Figure 4-2 that occur due to testing on the Telephone
after MN. In comparison to Table 4-2, MN reduces some of the di�erences between
| /cl/ (T) � � � /cl/ (S) - - /n/ (S) | /l/ (T) � � � /l/ (S) - - /r/ (S)
0 10 20 30 40−20
−15
−10
−5
0
5
MFSC0 10 20 30 40
−5
0
5
10
15
MFSC
Figure 5-3: Mean MFSCs over the training set for frequent confusion pairs due to theTelephone after MN
the Telephone and Sennheiser, but preprocessing is not as e�ective for the Telephone
as the B&K. For example, the Telephone /cl/ is closer to the Sennheiser /cl/ than
the Sennheiser /n/, but the Telephone still deviates widely from the Sennheiser.
Similarly, the Telephone /l/ is closer to the Sennheiser /l/ than the Sennheiser /r/,
but the formants are not clearly discriminated. This suggests di�culty in classi�cation
for the Telephone even after preprocessing.
Recognition
Table 5.8 shows recognition error rates in percent before and after preprocessing.
With such poor results in classi�cation, MN is even less e�ective in recognition,
decreasing the error rate by only 3%. As in classi�cation, MN e�ectively compensates
for only a fraction of the large numbers of additional errors caused by mismatched
testing on the Telephone. Furthermore, MN is not able to compensate for the deletions
81

Total Substitution Deletion InsertionBaseline 73.1 31.4 38.2 3.4MN 71.0 30.8 37.2 3.1CDCN 67.7 32.7 31.2 3.8
Table 5.8: Recognition error rates in percent before and after preprocessing
of closures that account for the largest percentage of the error under the baseline.
Although CDCN results in a higher total error rate in classi�cation than MN, it
e�ectively compensates for many more of the baseline misclassi�cations of closures.
This di�erence is presumably responsible for the ability of CDCN to achieve lower
error rates in recognition. In recognition, CDCN is the most e�ective of all the
techniques in compensating for mismatched testing on the Telephone, decreasing
the error rate by 7%. All of the error reduction is in deletions. Table 5.9 shows
the frequency in percent of the most frequent deletions of various phonemes that
do not occur when testing on the Telephone after CDCN. The table shows the two
Phoneme Frequencycl 44.3k 5.3
Table 5.9: Frequency in percent of the most frequent deletions that do not occur onthe Telephone after CDCN
phonemes that are most often deleted under the baseline but not after CDCN, totaling
to approximately 50% of the decrease in deletions. CDCN e�ectively compensates
for the baseline deletions shown in Table 4.17, especially the deletion of /cl/. Despite
these error reductions, CDCN cannot compensate for the large numbers of errors
caused by testing on the Telephone, and even after CDCN, the recognition error rate
increases by 32% from 51.2% under (S, S) to 67.7% under (S, T).
82

5.4 Summary
Experiments with preprocessing techniques are compared and analyzed to understand
their e�ects on the speech recognition system. The most e�ective techniques com-
pensate for most of the relatively small di�erences in the B&K but only a fraction
of the larger di�erences in the Telephone. As a result, preprocessing can increase
microphone robustness to small mismatches between training and testing conditions
but cannot maintain low error rates under severely mismatched conditions.
83
Chapter 6
Training Techniques
Although preprocessing techniques can reduce performance degradations under mis-
matched conditions, they do not enable the speech recognition system to achieve
microphone robustness. By nature, preprocessing techniques attempt to compen-
sate for microphone e�ects on the recorded signal without a�ecting the recognition
process. Since the data used to train the acoustic models may be recorded using a
microphone di�erent from the one used in testing, regardless of the compensation, the
recognizer parameters may still be suboptimal, thus leading to performance degrada-
tions. With the availability of microphone-speci�c training data in TIMIT, a more
e�ective technique may be to apply algorithms that directly account for microphone
variations in training, thereby reducing mismatch and performance degradations.
This chapter explores the increases in microphone robustness that can be achieved
by using microphone-speci�c data in training. Experiments are conducted using
multi-style training and microphone selection. Multi-style training [22] involves pool-
ing the data into one set of models. Microphone selection involves training a sepa-
rate set of models for each microphone and automatically selecting the best models
during testing. These techniques are compared with the baseline and preprocess-
ing techniques to understand the advantages of using microphone-speci�c training
techniques.
84

6.1 Description
6.1.1 Multi-style Training
Multi-style training (MULTI) [22] was originally used to train a speech recognition
system on multiple speaking styles in order to increase robustness to mismatched con-
ditions when the system is trained on normal speaking styles and tested on abnormal
speaking styles, such as speaking under stress. In general, these experiments show
that incorporating multiple styles in training improves performance under di�erent
styles in testing. Multi-style training decreases the mismatch between training and
testing conditions by incorporating di�erent conditions in training. As a result, the
model parameters, such as the means and variances use in the previous chapters, are
averaged over di�erent data and better matched to variations in testing. In addition,
multi-style training may produce more robust models by causing the system to focus
on acoustic features that are consistent across conditions. As a result, the models
may be richer and provide a better description of more robust features.
For microphone robustness, multi-style training involves training the system on a
composite training set consisting of one third of the original training sets from each
of the TIMIT microphones. By using only one third of the data for each microphone,
the size of the composite set is identical to the baseline in order to ensure a fair
comparison. The thirds do not overlap and contain the same number, plus or minus
one, of male and female speakers and utterances.
In order to determine the e�ects of downsampling on multi-style training, ex-
periments are performed at both 16 and 8 kHz. Table 6.1 shows classi�cation and
recognition error rates in percent for multi-style training before and after downsam-
pling.
In classi�cation, the combination of multi-style training with downsampling does
not cause statistically signi�cant changes in error rate for the Telephone and slightly
decreases the error rate for the Sennheiser and B&K. Similarly, in recognition, the
combination results in comparable but slightly higher error rates. Since multi-style
training accounts for the di�erences between the Sennheiser and Telephone by training
85

Classi�cation RecognitionSennheiser B&K Telephone Sennheiser B&K Telephone
16 kHz MULTI 34.3 35.8 45.5 54.6 56.9 63.98 kHz MULTI 35.8 37.2 45.5 57.3 59.5 66.5
Table 6.1: Classi�cation and recognition error rates in percent for multi-style trainingbefore and after downsampling
on utterances with both spectral distributions, the models are more robust and can
capture information in di�erent spectral regions. Therefore, it is not necessary to
downsample in order to focus the system on acoustic features in the low frequency
regions.
In order to determine the e�ects of preprocessing on multi-style training, experi-
ments are also performed in combination with the preprocessing techniques. Table 6.2
shows classi�cation and recognition error rates for multi-style training in combination
with various preprocessing techniques.
Classi�cation RecognitionSennheiser B&K Telephone Sennheiser B&K Telephone
MULTI 34.3 35.8 45.5 54.6 56.9 63.9MULTI-MN 33.4 34.5 44.5 52.9 55.9 64.5MULTI-RASTA 35.2 36.6 45.7 54.3 57.2 65.4MULTI-BROAD 35.0 36.1 46.1 54.2 57.0 66.5MULTI-SUB 35.0 35.9 45.3 53.9 56.8 64.5MULTI-SSUB 34.3 35.5 44.7 54.4 56.9 64.6MULTI-SUBMN 34.0 34.5 44.6 53.4 55.8 65.1MULTI-CDCN 34.7 35.3 45.9 52.1 55.1 64.0
Table 6.2: Classi�cation and recognition error rates in percent for multi-style trainingin combination with various preprocessing techniques
In classi�cation, the combination of multi-style training with MN or SUBMN re-
sults in small decreases in error rate, while the combination with other preprocessing
techniques does not cause statistically signi�cant changes in performance. In recog-
nition, the use of preprocessing in addition to multi-style training also does not cause
large decreases in error rate. Multi-style training directly accounts for microphone
86

variations in training rather than compensating for e�ects on the signal prior to recog-
nition. The reductions in error achieved by multi-style training seem to subsume most
of the reductions in error achieved by preprocessing techniques.
6.1.2 Microphone Selection
Microphone selection (SELECT) involves training separate models to match each
di�erent testing microphone. Like multi-style training, microphone selection also
decreases the mismatch between training and testing conditions by incorporating
di�erent data in training. Unlike multi-style training, microphone selection provides
a separate model to directly match each condition rather than pooling the data and
averaging the model parameters over di�erent conditions. As a result, microphone
selection may be able to model and represent more diverse testing conditions, but the
models are not more robust in the sense that training separate models does not cause
the system to focus on robust features that are consistent across di�erent conditions.
An added complexity in microphone selection is that the matching model must be
determined in testing. One method of automatic selection is to use the model that
corresponds to the highest scoring output. Another method is to train a separate
microphone classi�er to determinemicrophone identity. In the limit, if the microphone
can always be determined correctly, for example by the user, the system can always
perform under matched conditions, and the robustness issue is avoided.
For our microphone experiments, microphone selection involves using the full
training set to train three models, one for each TIMIT microphone. For each testing
utterance, the microphone model that corresponds to the highest scoring output is au-
tomatically selected. Since separate models are trained to directly match each testing
condition, downsampling in order to improve performance under mismatched condi-
tions is not necessary with microphone selection. In fact, the e�ects of transmission
bandlimiting on the Telephone only facilitate the process of automatic microphone
selection.
Experiments are performed in combination with preprocessing in order to deter-
mine the e�ects of preprocessing on microphone selection. Table 6.3 shows classi�ca-
87
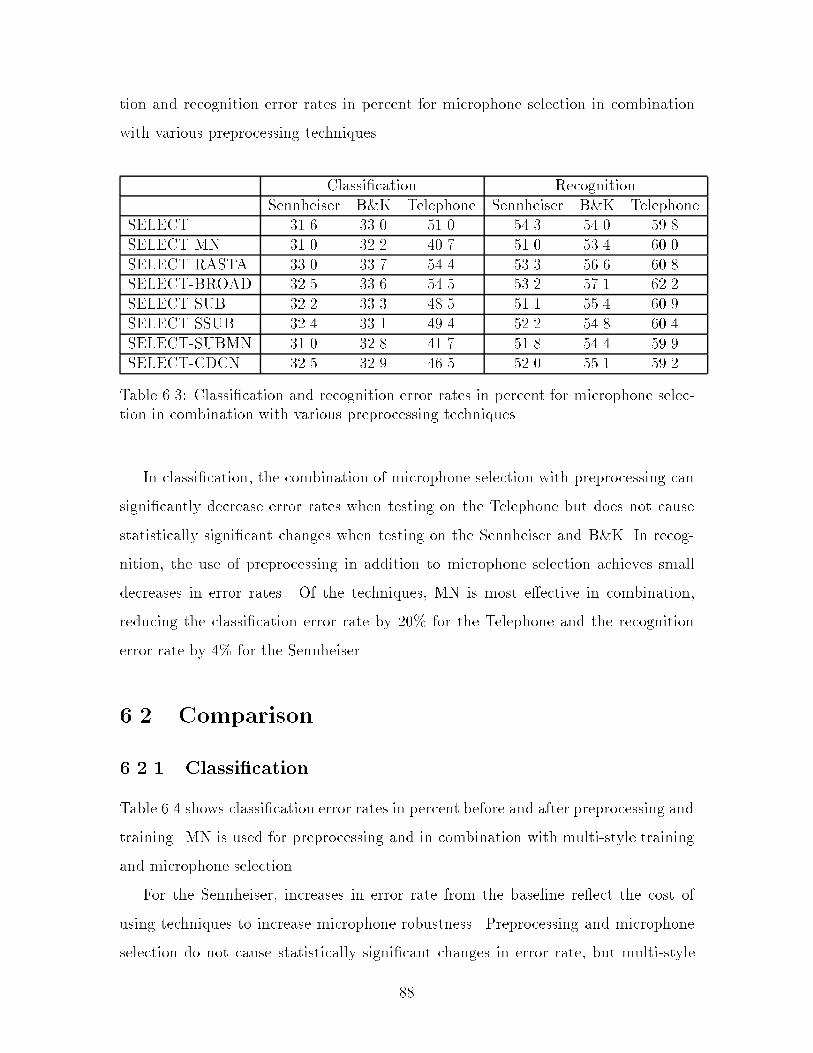
tion and recognition error rates in percent for microphone selection in combination
with various preprocessing techniques.
Classi�cation RecognitionSennheiser B&K Telephone Sennheiser B&K Telephone
SELECT 31.6 33.0 51.0 54.3 54.0 59.8SELECT-MN 31.0 32.2 40.7 51.0 53.4 60.0SELECT-RASTA 33.0 33.7 54.4 53.3 56.6 60.8SELECT-BROAD 32.5 33.6 54.5 53.2 57.1 62.2SELECT-SUB 32.2 33.3 48.5 51.1 55.4 60.9SELECT-SSUB 32.4 33.1 49.4 52.2 54.8 60.4SELECT-SUBMN 31.0 32.8 41.7 51.8 54.4 59.9SELECT-CDCN 32.5 32.9 46.5 52.0 55.1 59.2
Table 6.3: Classi�cation and recognition error rates in percent for microphone selec-tion in combination with various preprocessing techniques
In classi�cation, the combination of microphone selection with preprocessing can
signi�cantly decrease error rates when testing on the Telephone but does not cause
statistically signi�cant changes when testing on the Sennheiser and B&K. In recog-
nition, the use of preprocessing in addition to microphone selection achieves small
decreases in error rates. Of the techniques, MN is most e�ective in combination,
reducing the classi�cation error rate by 20% for the Telephone and the recognition
error rate by 4% for the Sennheiser.
6.2 Comparison
6.2.1 Classi�cation
Table 6.4 shows classi�cation error rates in percent before and after preprocessing and
training. MN is used for preprocessing and in combination with multi-style training
and microphone selection.
For the Sennheiser, increases in error rate from the baseline re ect the cost of
using techniques to increase microphone robustness. Preprocessing and microphone
selection do not cause statistically signi�cant changes in error rate, but multi-style
88

Sennheiser B&K TelephoneBaseline 31.2 38.9 55.7Preprocessing 31.3 34.6 52.5Multi-style training 33.4 34.5 44.5Microphone selection 31.0 32.2 40.7
Table 6.4: Classi�cation error rates in percent before and after preprocessing andtraining
training increases the error rate by 10%. Preprocessing and microphone selection
both produce models that only use high quality training data. These techniques
maintain the lowest error rates under the high quality matched condition and can
improve microphone robustness at no cost. Multi-style training produces models
that use both low and high quality training data. This technique introduces some
mismatch when using the Sennheiser and results in performance degradations under
high quality conditions.
For the B&K, decreases in error rate from the baseline re ect the ability of the
technique to increase microphone robustness between the Sennheiser and B&K.With-
out microphone-speci�c data, preprocessing can decrease the error rate by 11%. In
comparison, with microphone-speci�c data, multi-style training does not result in
a statistically signi�cant change, but microphone selection achieves an additional
7% decrease in error rate. As discussed in previous chapters, the B&K di�ers from
Sennheiser mainly by a peak in low frequency energy. The use of preprocessing to
compensate for these relatively small di�erences is very e�ective, at least comparable
to the use of pooled models with multi-style training, and only slightly less e�ective
than the use of separate models with microphone selection.
For the Telephone, preprocessing decreases the error rate by 6%. In comparison,
multi-style training and microphone selection respectively achieve additional 13% and
22% decreases in error rate. In comparison to the B&K, the di�erences between the
Telephone and Sennheiser are larger, resulting in larger performance degradations.
Under such conditions, preprocessing without microphone-speci�c data is not as ef-
fective, and training with microphone-speci�c data achieves signi�cant reductions in
89

error rate.
Of all the techniques, microphone selection is most e�ective. With microphone
selection, performance for the three microphones is not statistically di�erent from the
baseline matched (S, S), (B, B) and (T, T) conditions. In this sense, microphone
selection enables the classi�cation system to achieve microphone robustness between
the Sennheiser, B&K and Telephone.
6.2.2 Recognition
Table 6.5 shows recognition error rates in percent before and after preprocessing and
training. Recognition error rates are higher but follow the trends in classi�cation.
Sennheiser B&K TelephoneBaseline 51.2 59.0 73.1Preprocessing 51.1 54.8 71.0Multi-style training 52.9 55.9 64.5Microphone selection 51.0 53.4 60.0
Table 6.5: Recognition error rates in percent before and after preprocessing andtraining
Under matched conditions, preprocessing does not increase the error rate. Under
mismatched conditions, preprocessing compensates for the di�erences between the
B&K and Sennheiser and e�ectively decreases the (S, B) error rate, but preprocess-
ing cannot compensate for the larger deviations for the Telephone and only slightly
reduces the (S, T) error rate. In comparison, multi-style training can signi�cantly
decrease the error rate when using the Telephone, at the cost of increasing the error
rates when using the Sennheiser and B&K. This averaging of error rates corresponds
to the pooling of data in one set of models. Overall, microphone selection achieves
the best results, further reducing the error rates when using the B&K and Telephone
without increasing the error rate when using the Sennheiser. Since performance with
microphone selection is comparable to the baseline (S, S), (B, B) and (T, T) condi-
tions. this technique comes the closest to achieving microphone robustness, at least
90

in the context of these experiments.
6.3 Summary
Experiments with training techniques are compared and analyzed to understand their
e�ects on the speech recognition system. Multi-style training averages performance
across di�erent conditions. In comparison to preprocessing, this results in improve-
ments under the severelymismatched conditions but comes at the cost of degradations
under other conditions. On the other hand, microphone selection results in signi�-
cant improvements under all mismatched conditions without degrading matched con-
ditions. With the availability of microphone speci�c data, this training technique
enables the system to achieve large increases in microphone robustness.
91
Chapter 7
Conclusion
7.1 Summary
This thesis seeks to improve our understanding of the e�ects of microphone variations
and compensation techniques on the speech recognition system. A methodology is
designed to enable the isolation of microphone e�ects and the benchmarking and
comparison of techniques. The tasks of phonetic classi�cation and recognition are
studied in order to reduce the e�ects of confounding task, corpus and system depen-
dent variables. The TIMIT [10] corpus and SUMMIT [36] system are con�gured for
classi�cation and recognition experiments on microphone variations. The Sennheiser,
B&K and Telephone recordings of the commonly accepted TIMIT acoustic-phonetic
corpus are found to be particularly useful for comparative studies in microphone
robustness.
The microphones and data are analyzed in order to understand the e�ects of
microphone variations on the recorded signal. The deviations between the B&K
and Sennheiser are relatively small, with an increase in energy at low frequencies
due to di�erences between the non-gradient boom-mounted far-�eld and gradient
close-talking noise-canceling microphones. The deviations between the Telephone and
Sennheiser are larger, with a lack of energy at high frequencies and other variations
within the Telephone bandwidth due to transmission e�ects and signal normalization.
92

Baseline experiments are performed in phonetic classi�cation and recognition for
all microphone conditions before and after downsampling. Downsampling reduces
error rates for mismatched conditions involving the Telephone by e�ectively bandlim-
iting the Sennheiser and B&K to match the transmission bandwidth of the Telephone.
Analysis focuses on the realistic mismatched conditions when the system is trained
on the Sennheiser and tested on the B&K or Telephone. Mismatched testing on the
B&K causes moderate performance degradations that can be explained by the low
frequency deviations. Mismatched testing on the Telephone, even after downsam-
pling, causes severe degradations that are more di�cult to analyze due to the higher
levels of distortion in the Telephone.
Towards increasing microphone robustness, the thesis focuses on preprocessing
techniques that compensate for microphone e�ects on the recorded signal prior to
recognition. Several preprocessing techniques that do not require speci�c-microphone
data are implemented and developed for comparison and analysis. Of the techniques,
simple Mean Normalization [23] is found to e�ectively compensate for most of the
low frequency deviations and signi�cantly reduce performance degradations for the
B&K. In comparison, the complex Codeword-Dependent Cepstral Normalization [1]
is found to more e�ectively compensate for some of the larger deviations and slightly
reduce degradations for the Telephone. Overall, preprocessing can increase micro-
phone robustness to small mismatches between training and testing conditions but
cannot maintain low error rates under severely mismatched conditions.
The thesis also explores training techniques that directly account for microphone
variations in training rather than compensating for e�ects prior to recognition. These
techniques incorporate microphone-speci�c data in training to reduce microphone
mismatches and further increase microphone robustness, especially for Telephone.
7.2 Future Work
Future work includes experiments in word recognition to verify that improvements
gained at the phonetic level generalize to the word level. In addition, techniques
93

can be improved to achieve greater microphone robustness. Preprocessing techniques
may be able to take advantage of microphone-speci�c data in order to more e�ectively
compensate for severe microphone mismatches. Training techniques may be able to
use less than full sets of microphone-speci�c training data and produce more robust
models. The remaining parts of the speech recognition system can also be investi-
gated in the context of microphone robustness. More robust segmentation and search
algorithms may reduce the large error rates in recognition. Other representations
and features may be more robust than the cepstral coe�cients, which are sensitive
to microphone e�ects such as transmission bandlimiting and noise [29]. For example,
duration is microphone-invariant and can potentially reduce errors, such as confu-
sions between voiced and unvoiced phonemes. Representations based on auditory
models [32] have also been shown to be more robust to additive noise. Overall, more
integrated strategies may enable speech recognition systems to achieve microphone
robustness.
94

Appendix A
More on Preprocessing Techniques
This appendix contains more experimental results for various preprocessing tech-
niques. Table A.1 shows an example error rate table that is used to present classi�ca-
tion and recognition error rates in percent before and after downsampling under var-
ious microphone conditions for each preprocessing technique. The rows and columns
respectively show training and testing microphones. The top three and fourth rows
respectively show results at 16 and 8 kHz. The left and right halves respectively show
results in classi�cation and recognition.
Classi�cation RecognitionS B T S B T
S (S, S, 16) (S, B, 16) (S, T, 16) (S, S, 16) (S, B, 16) (S, T, 16)B (B, S, 16) (B, B, 16) (B, T, 16) (B, S, 16) (B, B, 16) (B, T, 16)T (T, S, 16) (T, B, 16) (T, T, 16) (T, S, 16) (T, B, 16) (T, T, 16)S (T, S, 8) (T, B, 8) (T, T, 8) (T, S, 8) (T, B, 8) (T, T, 8)
Table A.1: Example error rate table
95

Table A.2 shows error rates in percent for MN [23].
Classi�cation RecognitionS B T S B T
S 31.3 34.6 61.7 51.1 54.8 77.0B 32.8 32.6 56.8 51.3 53.1 75.0T 79.5 75.9 40.6 84.6 83.8 60.0S 34.0 36.3 52.5 56.0 58.4 71.0
Table A.2: Error rates in percent for MN
Table A.3 shows error rates in percent for RASTA [14].
Classi�cation RecognitionS B T S B T
S 32.8 35.9 63.5 52.8 56.2 77.7B 34.3 33.6 59.9 54.3 55.4 76.4T 81.4 76.7 41.8 81.2 80.3 60.8S 35.2 38.4 55.6 57.6 60.1 71.1
Table A.3: Error rates in percent for RASTA
Table A.4 shows error rates in percent for BCMN.
Classi�cation RecognitionS B T S B T
S 32.0 35.5 66.5 53.0 58.8 79.2B 34.2 33.3 67.1 55.1 54.3 80.5T 81.4 81.8 42.4 83.1 84.1 61.2S 34.5 37.2 54.5 57.3 59.1 74.9
Table A.4: Error rates in percent for BCMN
96

Table A.5 shows error rates in percent for SUB [33].
Classi�cation RecognitionS B T S B T
S 31.9 39.5 65.9 50.9 58.1 77.4B 35.9 33.4 68.4 55.6 54.0 79.7T 75.3 73.7 42.0 80.5 80.4 60.9S 34.2 42.4 55.1 55.5 62.8 74.2
Table A.5: Error rates in percent for SUB
Table A.6 shows error rates in percent for SSUB.
Classi�cation RecognitionS B T S B T
S 31.9 39.1 66.0 51.4 58.3 78.2B 35.8 33.1 67.5 55.1 53.5 79.7T 75.4 73.5 41.3 82.1 82.8 60.4S 33.7 41.8 54.0 55.1 62.0 73.9
Table A.6: Error rates in percent for SSUB
97

Table A.7 shows error rates in percent for the cascade of SUB and MN.
Classi�cation RecognitionS B T S B T
S 31.9 34.6 59.9 51.7 55.3 76.9B 33.4 33.2 58.0 51.9 53.9 75.8T 76.8 73.6 41.2 87.5 86.4 59.9S 34.5 37.5 51.7 55.7 59.2 73.2
Table A.7: Error rates in percent for SUBMN
Table A.8 shows error rates in percent for CDCN [1].
Classi�cation RecognitionS B T S B T
S 31.7 34.2 58.4 51.1 54.6 70.9B 33.6 32.7 59.6 51.4 54.0 73.0T 63.2 63.2 40.8 74.5 75.2 59.2S 35.4 37.9 55.2 55.7 58.5 67.7
Table A.8: Error rates in percent for CDCN
98

Bibliography
[1] A. Acero. Acoustical and Environmental Robustness in Automatic Speech Recog-
nition, Ph. D. Thesis, CMU, 1990.
[2] A. Acero and R. Stern. \Towards environment-independent spoken language sys-tems," Proc. DARPA Speech and Natural Language Workshop, 157{162, 1990.
[3] T. Anastasakos, F. Kubala, J. Makhoul and R. Schwartz. \Adaptation to newmicrophones using tied-mixture normalization," Proc. ICASSP I:433{435, 1994.
[4] L. Beranek. Acoustics. Acoustical Society of America, 1954.
[5] B. Chigier. \Phonetic classi�cation on wide-band and telephone quality speech,"Proc. DARPA Speech and Natural Language Workshop, 291{295, 1992.
[6] S. Das, A. Nadas, D. Nahamoo and M. Picheny. \Adaptation techniques forambience and microphone compensation in the IBM Tangora speech recognitionsystem," Proc. ICASSP, I:21{24, 1994.
[7] Y. Ephraim. \A minimummean square error approach for speech enhancement,"Proc. ICASSP, 829{832, 1990.
[8] A. Erell and M. Weintraub. \Estimation using log-spectral-distance criterion fornoise-robust speech recognition," Proc. ICASSP, 853{876, 1990.
[9] W. Fisher, G. Doddington, and K. Goudie-Marshall. \The DARPA speech recog-nition database: speci�cation and status," Proc. DARPA Speech Recognition
Workshop, 93{99, 1986.
[10] J. Garofolo, L. Lamel, W. Fisher, J. Fiscus, D. Pallett and N. Dahlgren. DARPATIMIT Acoustic-Phonetic Continuous Speech Corpus CD-ROM. National Insti-tute of Standards and Technology, 1990.
[11] L. Gillick and S. Cox. \Some statistical issues in the comparison of speech recog-nition algorithms," Proc. ICASSP, 532{535, 1989.
[12] O. Ghitza. \Auditory neural feedback as a basis for speech processing," Proc.
ICASSP, 91{94, 1988.
99

[13] J. Glass. Finding acoustic regularities in speech: applications to phonetic recog-
nition, Ph. D. Thesis, MIT, 1988.
[14] H. Hermansky, N. Morgan, A. Bayya and P. Kohn. \Compensation for the ef-fect of the communication channel in auditory-like analysis of speech (RASTA-PLP)," Proc. Eurospeech, 1367{1370, 1991.
[15] H. Hermansky, N. Morgan and H. Hirsch. \Recognition of speech in additiveand convolutional noise based on RASTA spectral processing," Proc. ICAASP,II:83{86, 1993.
[16] H. Hirsch, P. Meyer and H. Ruehl. \Improved speech recognition using high-pass�ltering of subband envelopes," Proc. Eurospeech, 413{416, 1991.
[17] M. Hunt and C. Lefebvre. \A comparison of several acoustic representationsfor speech recognition with degraded and undegraded speech," Proc. ICAASP,262{265, 1989.
[18] C. Jankowski, A. Kalyanswamy, S. Basson and J. Spitz. \N-TIMIT:a phoneti-cally balanced, continuous speech, telephone bandwidth speech database," Proc.ICASSP, 109{112, 1990.
[19] B. Juang, L. Rabiner and J. Wilpon. \On the use of bandpass liftering in speechrecognition," IEEE Trans. ASSP, Vol. 35, Jul. 1987.
[20] L. Lamel, R. Kassel and S. Sene�, \Speech database development: design andanalysis of the acoustic-phonetic corpus," Proc. DARPA Speech Recognition
Workshop, 100{109, 1986.
[21] J. Lim, ed., Speech Enhancement, Prentice-Hall, 1983.
[22] R. Lippmann, E. Martin and D. Paul, \Multi-style training for robust isolated-word speech recognition," Proc. ICASSP, 17.4.1{4, 1987.
[23] F. Liu, R. Stern, A. Acero and P. Moreno. \Environment normalization for robustspeech recognition using direct cepstral comparisons," Proc. ICASSP, II:61{64,1994.
[24] P. Melmerstein and S. Davis. \Comparison of parametric representations formonosyllabic word recognition in continously spoken sentences," IEEE Trans.
ASSP, Vol. 28, Aug. 1980.
[25] H. Meng. The Use of Distinctive Features for Automatic Speech Recognition, M.S. Thesis, MIT, 1991.
[26] P. Moreno and R. Stern. \Sources of degradation of speech recognition in thetelephone network". Proc. ICASSP, I:109{112, 1994.
100

[27] H. Murveit, M. Butzberger and M. Weintraub. \Reduced channel dependencefor speech recognition," Proc. DARPA Speech and Natural Language Workshop,280{284, 1992.
[28] A. Nadas, D. Nahamoo and M. Picheny. \Adaptive labeling: normalizationof speech by adaptive transformations based on vector quantization," Proc.
ICASSP, 521{524, 1988.
[29] J. Openshaw and J. Mason. \On the limitations of cepstral features in noise,"Proc. ICASSP, II:49{52, 1994.
[30] D. Pallett. \Benchmark tests for DARPA resource management performanceevaluations," Proc. ICASSP, 536{539, 1989.
[31] M. Phillips and V. Zue. \Automatic discovery of acoustic measurements for pho-netic classi�cation," Proc. ICSLP, 795{798, 1992.
[32] S. Sene�. Pitch and Spectral Analysis of Speech Based on an Auditory Synchrony
Model, Ph. D. Thesis, MIT, 1985.
[33] D. Van Compernolle. \Increased noise immuninity in large vocabulary speechrecognition with the aid of spectral subtraction," Proc. ICASSP, 1143{1146,1987.
[34] D. Van Compernolle. \Spectral estimation using a log-distance error criterionapplied to speech recognition," Proc. ICASSP, 258{261, 1989.
[35] K. Yu. A Study of Microphone and Signal Representation E�ects on Speech
Recognition, B. S. Thesis, MIT, 1992.
[36] V. Zue, J. Glass, M. Phillips and S. Sene�. \Acoustic segmentation and phoneticclassi�cation in the SUMMIT system," Proc. ICASSP, 389{392, 1989.
[37] V. Zue, J. Glass, D. Goodine, M. Phillips and S. Sene�. \The SUMMIT speechrecognition system: phonological modelling and lexical access," Proc. ICASSP,49{52, 1990.
101