comparative profitability of dominant crop rotation … filea focus group discussion was conducted...
TRANSCRIPT
37
COMPARATIVE PROFITABILITY OF DOMINANT CROP ROTATION
IN SOME SELECTED AREAS OF BHOLA DISTRICTS IN
BANGLADESH
Md. Jahangir Kabir1, R. Nelson
2, N.P. Dalgliesh
3, M.F.S. Sikder
4 and M.G. Rabbani
5
ABSTRACT
Three villages namely Southcharpata of sadar upazilla, Togbi of Borhanuddin upazilla and
Maddajoynagar of Daulatkhan upazilla of Bhola districts were purposively selected for this
survey. A focus group discussion was conducted in each village by using a brief cheek list and
structure schedule for collecting necessary data. Survey was conducted during 31/07/07 to
02/08/07. A group of farmers like land owner, share cropper and laborer were included in each
focus group discussion. Proportion of area coverage by the chilli and wheat was comparatively
low whereas these two crops are comparatively more profitable than that of other Rabi crops.
Findings of all three villages indicated that the gross return and gross margin of any cropping
pattern could be increased substantially with the inclusion of chilli or wheat into the existing rice
based dominant cropping patterns of the farmers. It is due to the comparatively good yield
potentiality and good market price of chilli and wheat than that of other Rabi crops.
Key words: Chilli, crop rotation, dominant crops, profitability, wheat, rice
INTRODUCTION
Consumption of wheat is around 4 million tonnes per annum in Bangladesh. It is increasing at 3% per
annum, whereas production is now under 2 million tonnes and is decreasing over the years. The
situation has created serious concerns for food security and for diminishing foreign currency reserves.
Agricultural land is mainly extensively farmed in the country but an estimated 800,000 ha of land in
southern Bangladesh that could have potential for production of wheat and other crops remains
uncultivated during the dry (rabi) season. This is because of irrigation resources are very limited due
to the general unsuitability of the area for deep and shallowtube wells. Other constraints have added to
the perception that the area is too risky for wheat in a rice-wheat rotation. Sowing of wheat is delayed
than optimum planting date because of long duration T. Aman rice, soil suitability for seeding seed
become late for monsoon rain and land preparation takes more time with bullock-drawn plough.
Furthermore, this area is hotter with a shorter winter (average 3ºC) than the northern districts and soil
salinity decrease potentiality of wheat in the costal areas (Carberry et al., 2006).
Assuming 400,000 ha of fallow land is available for rabi cropping season and the yield is around 2.5
t/ha. These southern zones have the potential to produce 1 million tonnes of wheat annually and it
could have positive impact on the national deficit. Assuming a conservative adoption rate of 10 %
within 5 years of project completion equates to an annual benefit of approximately Tk 1.4 billion
($ A28 million). The consequences of bringing high levels of agricultural production to an area that
1Senor Scientific officer, Division of Agricultural Economics, Bangladesh Rice Research Institute,
Gazipur; 2Resources Economist, CSIRO Sustainable Ecosystems, Australia;
3Farming Systems
Researcher, CSIRO Sustainable Ecosystems, Australia; 4Director General, Bangladesh Rice Research
Institute, Gazipur; 5Assistant Professor, Hajee Mohammad Danesh Science and Technology
University, Dinajpur 5200, Bangladesh
J. Sci. Technol. (Dinajpur) Vol. 8: 37-52 (2010)
ISSN 1994-0386

38
normally remains largely fallow for six months of the year will flow on to increase activity and wealth
for the region. Farmers will able to double their income from a very low support on modern
technology. They currently depend primarily on one rice crop per year to provide income for their
families from farms that are not sufficient (commonly less than 1 ha) (Rawson et al., 2006).
The coastal districts of the current southern lands of Bangladesh have been created by siltation,
particularly over the last 70 years. The land growth is still occurring (Rawson et al., 2006). They
began as very saline mud flats but as the years have passed and they have been leached annually by
monsoonal rains, they have become progressively less saline and more suitable for cropping. During
the rabi season they are cropped with T aman or T aus rice, irrigated by the fresh waters of the
monsoon, but in the rabi season the salt rises as the land dries and crusts the surface, seemingly
making it unsuited to productive cropping. Historically it may have been wise for farmers to leave the
land fallow during rabi season because of salt, but that situation is changing due to the annual leaching
process (Rawson et al., 2006).
Sustainability of rice-wheat systems is now a major concern for researchers (Ahmed, 1996).
Neoclassical theory posits that producers are profit-maximizes who take decisions based on expected
profitability. Generally, while making production decisions, the farmers consider returns against
expected cost. Sometimes it is mentioned that the yield they receive does not cover the cost of
production. A number of new cropping pattern are being practiced by the farmers, it is very much
important to identify the profitability of dominant cropping patterns for under varying farming
situations for selecting best suitable option. Furthermore, the rate of expansion of any pattern depends
on yield and profit potentiality of the cropping systems. Mandal, M. A. S., (1986) conducted a study
on An Economic Analysis of Design Versus Farmers Cropping Patterns in Two Villages in
Mymensingh‟ and found that Yields of crops grown under alternate improve pattern with improve
management were significantly higher than the yields of the same crops under farmers‟ management
in existing pattern. Farming System Research and Development Programme (FSRDP), 1987 carried
out a research work at Kazirshimla of Mymensingh district. The researcher monitored the cropping
pattern in the FSRDP area. It was found that the farmers were continuously changing cropping pattern
keeping aman rice constant. However, they were changing the varieties of aman rice. Farmers
considered aman rice as the main crop, which faces relatively less natural hazard and uncertainty.
Rashid, H., (1994) conducted a research on „An Economic Study of Farmers Growing Crops with
Potato and Without ptato in Selected Area of Dinajpur‟ and found that the cropping patterns with
potato generated higher net income than those without potato patterns Wheat – Purbachi – BR11 and
Wheat–Purbachi–Pajam. Hossain (1996) conducted a study on relative profitability of alternative
cropping patterns in two villages Telehara and Dakshimbhag under Kotwali Thana of Bogra district.
He found that farmers in the study area followed 5 cropping patterns, which were basically rice based.
He also found that the return over cash cost as well as gross margin of the cropping pattern Potato -
HYV Boro - T. Aman were the highest. Baksh. E (2004) did a research on Economic Efficiency and
Sustainability of Wheat Production in Wheat Based Cropping Systems in North-West Bangladesh and
found that among the selected wheat and Boro-based cropping patterns, farmers received the highest
gross margin (Tk. 32,294/ha) as well as net return (Tk. 21,999/ha) from the cropping pattern T. Aman-
Wheat-Jute both in Dinajpur and Rangpur. However study on profitability of dominant cropping
patterns adopted in the southern costal areas of Bangladesh is scarce. The present study gives detailed
information about these aspects on the costal districts of Bhola. Realizing the importance of the above
goal, the research was formulated with following specific objectives:
i. to identify the major cropping pattern;
ii. to explore the agronomy of those cropping pattern and
iii. to determine the economic viability of wheat and other major Rabi crops in the study
area
Journal of Science and Technology, Vol. 8, 2010

39
MATERIALS AND METHODS
Three villages namely Southcharpata of sadar upazilla, Togbi of Borhanuddin upazilla and
Maddajoynagar of Daulatkhan upazilla were purposively selected for this survey. A focus group
discussion was conducted in each village by using a brief cheek list and structure schedule for
collecting necessary data. Survey was conducted during 31/07/07 to 02/08/07. The researcher himself
collected the data from the selected farmers. A group of farmers like land owner, share cropper and
laborer were included in each focus group discussion. Farmers were interviewed on agronomy of
different crops like sowing, harvesting time, variety used, practiced cropping pattern and area
coverage by each cropping pattern in the villages. Farmers were asked on average rate of input use for
producing selected crops, yield of each crop, per unit purchase and selling prices of relevant input and
output. The main difficulty to collect data in the context of Bangladesh is that the investigator has to
relay upon the memory of the farmers (Kabir, 1999). To deal with the problem, all possible efforts
were made by the researcher to ensure the collection of reasonably accurate data from the farmers.
RESULTS AND DISCUSSIONS
Prevailing cropping patterns
Most widely adapted cropping pattern of Southcharpata village were, Boro rice-Fallow-T.Aman rice
(18%), Boro rice-T.Aus rice-T.Aman rice (18%), Wheat-D.Aus rice-T. Aman rice (12%), Grass pea-
D.Aus rice-T.Aman rice(12%), Mustard-D.Aus rice-T.Aman rice (9%), Chilli-Fallow/T&D-T.Aman
rice (8% ), etc.
Significant cultivated area of Togbi village was practiced by patterns Boro rice-Fallow-T.Aman rice
(44%), Mungbean-D.Aus rice/Fallow- T.Aman rice (17%), Chilli- Fallow/D &T.Aus rice-T.Aman rice
(13%), Grass pea -D.Aus rice- T.Aman rice (6), Groundnut-D.Aus rice-T.Aman rice (3%) and Wheat-
D.Aus rice- T.Aman rice (2%).
Among of the prevailing cropping patterns at Maddajoynagar village, bulk share of area was adopted
by cropping patterns like Grass pea- D. Aus rice-T.Aman rice (14%), Mungbean-D. Aus rice- T.Aman
rice (13%), Chilli-T.Aus rice-T.Aman (13%), Cowpea-D.Aus rice-T.Aman rice (12%), Groundnut-
T.Aus rice-T.Aman rice (12%), Sweet potato-D.Aus rice-T.Aman rice (11%) and wheat-D.Aus rice-
T.Aman rice (7%).
It was observed from the findings that farmers were cultivated rice in both Kharif 1 and Kharif 2
seasons and results indicated that there was no significant difference in the prevailing Rabi crops in the
survey villages. But Boro rice was not cultivated in Maddajoynagar village. It is needed to be
identified the major causes of adaptation of different Rabi crops in each village.
Sowing and harvesting time of crops
Time of sowing is an important factor for getting good yield from Rabi crops (Kabir 2002). It was
found from the following crop calendar that some farmers of the villages were shown and transplanted
within optimum time and some were shown and transplanted in late of their Kharif 1 and Kharif 2
crops. It was observed from the crop calendar that most of farmers could not show and transplant their
Rabi crops within optimum time. There were differences in sowing/transplanting and harvesting time
of crops among the survey villagers. Farmers were mentioned that sometimes they were delay to
transplant T.Aman rice due to late maturity of Aus rice, drought and flood at transplanting time. They
also mentioned that due to late maturity of T.Aman rice and late Zo (proper moisture in soil for seed
germination) are the main causes of late sowing of Rabi crops.
Kabir et al.

40
Table 1. Crop Calendar of Southcharpata village
Name of
crops
January February March April May June July August September October November December
Rabi season Kharif 1 season Kharif 2 season Rabi season
T.Aman rice
(HYV)
T.Aman rice
(Local)
Aus rice
(HYV/Local)
Boro rice
(HYV)
Wheat
(HYV)
Mustard
(HYV)
Potato
(HYV/Local)
S. Potato
(HYV/Local)
Grass pea
(HYV/Local)
Chilli
(HYV/Local)
G. Nut
(HYV/Local)
Sesame
(HYV/Local)
Mungbean
(HYV/)
Cow pea
Source: Survey, 2007
Journal of Science and Technology, Vol. 8, 2010

41
Table 2. Crop Calendar of Togbi village
Name of
crops
January February March April May June July August September October November December
Rabi season Kharif 1 season Kharif 2 season Rabi season
T.Aman rice
(HYV)
T.Aman rice
(Local)
T. Aus rice
(HYV/Local)
D. Aus
(HYV/Local)
Boro rice
(HYV)
Wheat
(HYV)
Mustard
(HYV)
Potato
(HYV/Local)
Grass pea
(HYV/Local)
Chilli
(HYV/Local)
G. Nut
(HYV/Local)
Mungbean
(HYV/)
Source: Survey, 2007
Kabir et al.

42
Table 3. Crop Calendar of Maddajoynagar village
Name of
crops
January February March April May June July August September October November December
Rabi season Kharif 1 season Kharif 2 season Rabi season
T.Aman rice
(HYV)
T.Aman rice
(Local)
T. Aus
(HYV/Local)
D. Aus
(HYV/Local)
Wheat
(HYV)
Mungbean
(HYV)
Cowpea
Grass pea
(HYV/Local)
Chilli
(HYV/Local)
S. Potato
(HYV/Local)
Source: Survey, 2007
Journal of Science and Technology, Vol. 8, 2010

43
Costs and Returns of dominant crops in the survey villages Estimating cost is exclusively necessary for enterprise costs and subsequently determining the viability
of the enterprise from the view of farm families because it influences the decision making process of
the producers. For determining costs and returns, enterprise budgeting technique was followed. On the
basis of gross margin analysis, the relative profitability of wheat and other major Rabi crops were
calculated. Reason to choose this analysis is that the farmers of Bangladesh are very eager to know
their return over their variable cost (Kabir 1999).
For estimating the total variable cost of producing each crop included costs of human labor, plowing,
seed, fertilizer, irrigation and insecticide etc. For purchased inputs actual cost paid was considered.
But for the home supplied inputs, like family labor, seed etc cost was calculated by applying the
principle of opportunity cost. Per hectare gross return was determined by multiplying the farmers
received output of each crops with their respective market price. Limitation of determining gross
return was that it did not consider return received from by product like straw of rice and wheat etc
because farmers do not sale straw.
Gross return was calculated by using the following formula: GR=Yi X Pi
GR=Gross Return, Yi=Total quantity of output (kg), Pi =Per unit price (Tk/kg)
Details average rate of input use, yield, cost and return was presented in Table 1, 2 and 3 and Figure 1,
2 and 3. Item wise cost and return was briefly discussed as follows:
Human labor cost
Human labor was the most important and largely used input for producing crops in Bangladesh. It is
due to that most of the intercultural operation of crop cultivation was done by manually (Kabir 1999).
Labor was required for different operation such as land preparation, seed sowing, transplanting,
weeding, fertilizer application, harvesting, carrying, threshing and drying etc. There was variation in
rate of labor used among different group of farmers even for producing same crops. Average rate of
labor used for different operation was considered for estimating labor cost. Farmers used hired and
family labor for different inter cultural operations of crops. Both hired and family labor cost was
considered for estimating labor cost. In case of family labor, opportunity cost of labor was considered.
There was a difference in wage rate between male and female labor but for this report average wage
rate of male labor in the survey area was considered because female labour were hired for harvesting
pulses, chillies, sometimes for weeding Rabi crops and paid as kinds.
In Southcharpata village, the highest number of human labor was used for producing chilli which was
131 man-days/ha and respective cost was Tk. 15720/ha followed by Boro rice (120 man-days/ha and
Tk. 14400/ha), wheat (106 man-days/ha and Tk.12720/ha), Aus rice (107 man-days/ha and
Tk.12840/ha), T.Aman rice (104 man-days/ha and Tk.12480/ha), mustard (40 man-days/ha and
Tk.4800/ha) and grass pea (24 man-days/ha and Tk. 2880/ha) (Table 1).
In Togbi village, highest number of human labor was used for producing chilli which was 125 man-
days/ha and respective cost was Tk. 15000/ha followed by Boro rice (117 man-days/ha and Tk.
14040/ha), wheat (108 man-days/ha and Tk.12960/ha), Aus rice (106 man-days/ha and Tk.12720/ha),
T.aman rice (102 man-days/ha and Tk.12240/ha), mungbean (88 man-days/ha and Tk.10560/ha),
groundnut (78 man-days/ha and Tk.9360/ha) and grass pea (31 man-days/ha and Tk. 3720/ha) (Table
2).
In Maddajoynagar village, highest number of human labor was used for producing chilli which was
130 man-days/ha and respective cost was Tk. 15600/ha followed by Aus rice (105 man-days/ha and
Tk. 12600/ha), wheat (104 man-days/ha and Tk.12480/ha), T. Aman rice (101 man-days/ha and
Tk.12120/ha), mungbean (82 man-days/ha and Tk.9840/ha), cowpea (41 man-days/ha and
Tk.4920/ha) and grass pea (33 man-days/ha and Tk. 3960/ha) (Table 3).
Kabir et al.

44
Findings of the report point out that chilli, Boro rice and wheat were comparatively labor intensive
than other Rabi crops. For getting clear conception on labor employment in different Rabi crops
further details survey of farmers and laborer is essential. It is needed to find out that whether there is
any yield variation or not in Rabi crop on labor employment.
Ploughing Cost
Animal power and power tiller both were used for land preparation in the survey villages. Power tiller
was mainly used for land preparation by all most all the farmers. Animal power was usually used for
final pass of plough or leveling purpose. Since cost of tillage of power tiller and animal power is about
to same so that all groups of farmers have special preference to power tiller. It may be due to power
tiller is available, save time for land preparation and reduce turn around time between two consecutive
crops. There was variation in number of plough among the Rabi crops and different group of farmers.
Average number of plough for each crop and rental charge of power tiller was considered for
estimating tillage cost. In Southcharpata village per hectare costs of tillage for T.Aman rice, Aus rice,
Boro rice, chilli, wheat, and mustard grass pea were Tk.2409/ha, Tk.3212/ha,Tk.2409/ha, Tk.3212/ha,
Tk.3212/ha, Tk.2409/ha, Tk.0 /ha, respectively (Table 1). In Togbi village per hectare costs of tillage
for T.Aman rice, Aus rice, Boro rice, chilli, mungbean, grass pea, groundnut and wheat were
Tk.2409/ha, Tk.2409/ha, Tk.2409/ha, Tk.3212/ha, Tk.3212/ha, Tk.0/ha, Tk.2409/ha, Tk.3212/ha,
respectively (Table 2). In Moddajoynagar village per hectare costs of tillage for T.Aman rice, Aus rice,
grass pea, mungbean, chilli, wheat, and cowpea were Tk.2409/ha, Tk.2409/ha, Tk.0/ha,
Tk.2409/ha,Tk.3212/ha, Tk.3212/ha, Tk.2409/ha, respectively (Table 3). Grass pea was shown in
T.Aman rice field as relay crops so that no tillage cost was considered for grass pea in survey villages.
It is needed to find out that whether there is any yield variation or not with by the number of plough.
Cost of seeds
Farmer used home supplied and purchased seed or seedlings for producing crops. There was variation
in seed rate among of the different group of farmers. Average seed rate and market price of seed and
seedlings was considered for estimating seed cost. Opportunity cost was considered for home supplied
seed. Seedling development cost was not considered in this study. In Southcharpata village per hectare
seed costs was highest for wheat cultivation (Tk.4158/ha) followed by Boro rice (Tk.1550/ha), chilli
(Tk.1543/ha), grass pea (Tk.1400/ha), T.Aman rice (Tk.1160/ha), Aus rice (Tk.1136/ha) and mustard
(Tk.320/ha) (Table 1). In Togbi village per hectare seed costs was highest for groundnut cultivation
(Tk.4320/ha) followed by wheat (Tk.3915/ha), chilli (Tk.11843/ha), Boro rice (Tk.1475/ha),
mungbean (Tk.1240/ha), Aus rice (Tk.1155/ha), T.Aman rice (Tk.1140/ha) and grass pea (Tk.1080/ha)
(Table 2). In Maddajoynagar village per hectare seed costs was highest for wheat cultivation
(Tk.3807/ha) followed by chilli (Tk.1721/ha), cowpea (Tk.11380/ha), mungbean (Tk.1360/ha), grass
pea (Tk.1325/ha), Aus rice (Tk.1073/ha) and T.Aman rice (Tk.972/ha) (Table 3).
Findings of the report specify that seed cost of wheat and groundnut was comparatively high among of
the Rabi crops in all three villages. It indicated that initial investment in wheat and groundnut was
high.
Cost of Fertilizer
Fertilizer plays an important role in yield variation of all crops. Timely fertilizer application with
recommended dose is very essential for getting good yield from all crops (Kabir 2002). It was
observed in exploratory field that there was a wide gap between timely fertilizer application with
recommended dose and applied dose of fertilizer for producing crop in the survey villages. Most of the
farmers used different type of fertilizer namely urea, TSP, MP, Gypsum for cultivation of crops in the
survey villages. There was wide variation in fertilizer dose among different group of farmers even for
producing the same crop. Average amount of fertilizer dose used by farmers for producing different
Journal of Science and Technology, Vol. 8, 2010

45
crops and prevailing market price of respective fertilizer was considered for calculating fertilizer cost.
In Southcharpata village per hectare fertilizer costs was the highest for producing chilli (Tk.8102/ha)
followed by Boro rice (Tk.6786/ha), wheat (Tk.4780/ha), T.Aman rice (Tk.4232/ha), Aus rice
(Tk.3359/ha), mustard (Tk.3302/ha) and grass pea (Tk.211/ha) (Table 1). In Togbi village per hectare
fertilizer costs was the highest for producing chilli (Tk.7977/ha) followed by Boro rice (Tk.6609/ha),
wheat (Tk.3784/ha), T.Aman rice (Tk.3472/ha), groundnut (Tk.3293/ha), Aus rice (Tk.3027/ha),
mungbean (Tk.777/ha) and grass pea (Tk.504/ha) (Table 2). In Maddajoynagar village per hectare
fertilizer costs was the highest for producing chilli (Tk.5958/ha) followed by T.Aman rice
(Tk.3474/ha), Aus rice (Tk.3019/ha), wheat (Tk.2633/ha), mungbean (Tk.763/ha), cowpea
(Tk.572/ha), and grass pea (Tk.202/ha) (Table 3).
Findings of the report point out that for producing chilli, Boro rice and wheat farmers are to invest
more than that of other Rabi crops. However farmers were spent very minimum amount of money for
fertilizer purpose for producing grass pea, mungbean, cowpea etc. It was observed from report that
there was a variation in fertilizer application among the villages. It may be due to lack of knowledge
on fertilizer dose or insufficient money with farmers for fertilizer purpose.
Table 4. Per hectare cost and return of majors Rabi crops of Southcharpata village of sadar upazilla of
Bhola districts
Items
T. Aman rice Aus rice Boro rice Wheat Grass pea Mustard Chilli
Qty. Tk./
ha Qty.
Tk./h
a Qty. Tk./ha Qty. Tk./ha Qty.
Tk./
ha Qty.
Tk./
ha Qty. Tk./ha
Plowing (No.) 3 2409 4 3212 3 2409 4 3212 - - 3 2409 4 3212
Human labor
(man-days/ha) 104
1248
0 107 12840 120 14400 106 12720 24 2880 40 4800 131 15720
Seed/Seedling
(kg/ha) 58 1160 71 1136 62 1550 154 4158 56 1400 8 320 - 1543
Fertilizer: 4232 3359 6786 4780 211 3302 8102
Urea (kg/ha) 185 1202 154 1001 247 1606 185 1203 34 211 151 982 146 949
TSP (kg/ha) 93 1860 77 1540 154 3080 90 1800 - - 110 2200 224 4480
MP (kg/ha) 46 736 31 496 77 1232 70 1120 - - - - 108 1728
Gypsum (kg/ha) 62 434 46 322 124 868 77 537 - - - - 135 945
Insecticide - 771 - 617 - - - - - - - - 2161
Irrigation - - - - 7718 - - - - - - 1643
Total cost -
2105
2 - 21164 - 33789 24750 4491
1071
1 32381
Yield 2975 2835 4414 2470 659 547 3115
Gross Return -
2677
5 - 24806 - 41993 - 48165 -
1422
0 -
1367
5 - 62300
Gross Margin - 5723 - 3642 - 8204 - 23415 - 9729 - 2964 - 29919
Human Labor @ Tk 120/man-days, Bullock Power and power tiller @ Tk 803/Plough/ha, Manure @
Tk 0.5/kg, Urea @ Tk 6.5/kg, TSP @ Tk 20/kg, MP @ Tk 16/kg, Gypsum Tk @ Tk 7/kg, Zinc @ Tk
120/kg, T.Aman rice @ Tk 9/kg, Aus rice @ Tk 8.75/kg,Boro rice @ Tk 9. 5/kg, Wheat @ Tk
19.5/kg, Grass pea Tk 20/kg, Mustard Tk 25/kg, Chilli Tk 20/kg, T.Aman rice seed @ Tk. 20/kg, Aus
rice seed @ Tk. 16/kg,Boro rice seed @ Tk. 25/kg, Wheat seed @ Tk. 27/kg, Grass pea seed @ Tk.
25/kg, Mustard seed @ Tk. 40/kg.
Kabir et al.

46
Table 5. Per hectare cost and return of majors Rabi crops of Togbi village of Borhan uddin upazilla of
Bhola districts
Items T.Aman
rice Aus rice Boro rice Chilli
Mungbe
an
Grass
pea
Ground
nut
Wheat
Qty. Tk./ha Qty. Tk./
ha Qty.
Tk./
ha Qty.
Tk./
ha
Qty
.
Tk./
ha
Qt
y.
Tk./
ha Qty.
Tk./
ha Qty. Tk./ha
Plowing
(No) 3 2409 3 2409 3 2409 4 3212 4 3212 3 2409 4 3212
Human
labor
(Mandays
/ha)
102 12240 106 127
20 117
1404
0 125
1500
0 88
1056
0 31 3720 78 9360 108 12960
Seed
(kg/ha) 60 1140 77 1155 59 1475 - 1843 31 1240 54 1080 108 4320 145 3915
Fertilizer: - 3472 - 3027 6609 - 7977 777 504 3293 3748
Urea
(kg/ha) 148 962 125 813 235 1528 173 1125 35 227 37 240 30 195 180 1170
TSP
(kg/ha) 74 1628 63 1386 136 2992 210 4620 25 550 12 264 86 1892 82 1804
MP
(kg/ha) 49 882 46 828 62 1116 124 2232 - - - - 25 450 43 774
Gypsum - - - 139 973 154 1078 - - - - 108 756 - -
Insecticid
e - 673 - 618 - 1080 - 2245 - 798 - - - - - -
Irrigation - - - 7410 - 1240 - - - - - - - -
Total cost - 19934 -
1992
9 -
3302
3 -
3259
5 -
1658
7 - 5304 -
1938
2 - 23835
Yield 2995 2794 4786 - 3242 - 679
71
0 1420 - 2099
Gross
return - 26206 -
2374
9 -
4427
1 -
6484
0 -
2379
5 -
1136
0 -
2556
0 - 40931
Gross
Margin - 6272 - 3820 -
1124
8 -
3224
5 - 7178 - 6056 - 6178 - 17096
Human Labor @ Tk 120/man-days, Bullock Power and power tiller @ Tk 803/Plough/ha, Urea @ Tk
6.5/kg, TSP @ Tk 22/kg, MP @ Tk 18/kg, Gypsum Tk @ Tk 7/kg, Zinc @ Tk 80/kg, T.Aman rice @
Tk 8. 75/kg, Aus rice @ Tk 8.5/kg, Boro rice @ Tk 9. 25/kg, Wheat Tk 19.5/kg, Grass pea Tk 20/kg,
Mungbean Tk 35/kg, Chilli Tk 20/kg, T.Aman rice seed @ Tk. 19/kg, Aus rice seed @ Tk. 15/kg,
Boro rice seed @ Tk. 25/kg, Wheat seed @ Tk. 27/kg, Grass pea seed @ Tk. 25/kg, Mungbean seed
@ Tk. 40/kg.
Cost of Irrigation
Supplementary irrigation is very essential for getting desired yield from Rabi crops. It was observed in
survey villages that there was scarcity of irrigation sources. Farmers were applied irrigation for
producing Boro rice and chilli. Farmers of Maddajoynagar did not grow Boro rice due to the lack of
irrigation facilities. In the Southcharpata village farmers used irrigation for crops like Boro rice and
chilli while T.Aman rice, Aus rice, wheat, grass pea, and mustard were grown under the rain-fed
condition. It was apparent from Table that per hectare irrigation cost for Boro rice and chilli were Tk.
7718 and Tk. 1643 respectively (Table 4). In the Togbi village farmers used irrigation for crops like
Boro rice and chilli while T.Aman rice, Aus rice, wheat, grass pea, mungbean and groundnut were
grown under the rain-fed condition. It was apparent from Table that per hectare irrigation cost for Boro
rice and chilli were Tk. 7410 and Tk. 1240 respectively (Table 2). In the maddajoynagar village
farmers were grown all crops in rain fed condition but chilli. It was apparent from Table that per
hectare irrigation cost for Chilli were 1464 (Table 6).
Cost of Insecticides
Farmers were applied insecticides for T.Aman rice, Aus rice, Boro rice, mungbean and chilli. Farmers
usually do not applied insecticide for cultivation of grass pea, groundnut, wheat, mustard and cowpea,
etc (Table 4, 5 and 6).
Journal of Science and Technology, Vol. 8, 2010
47
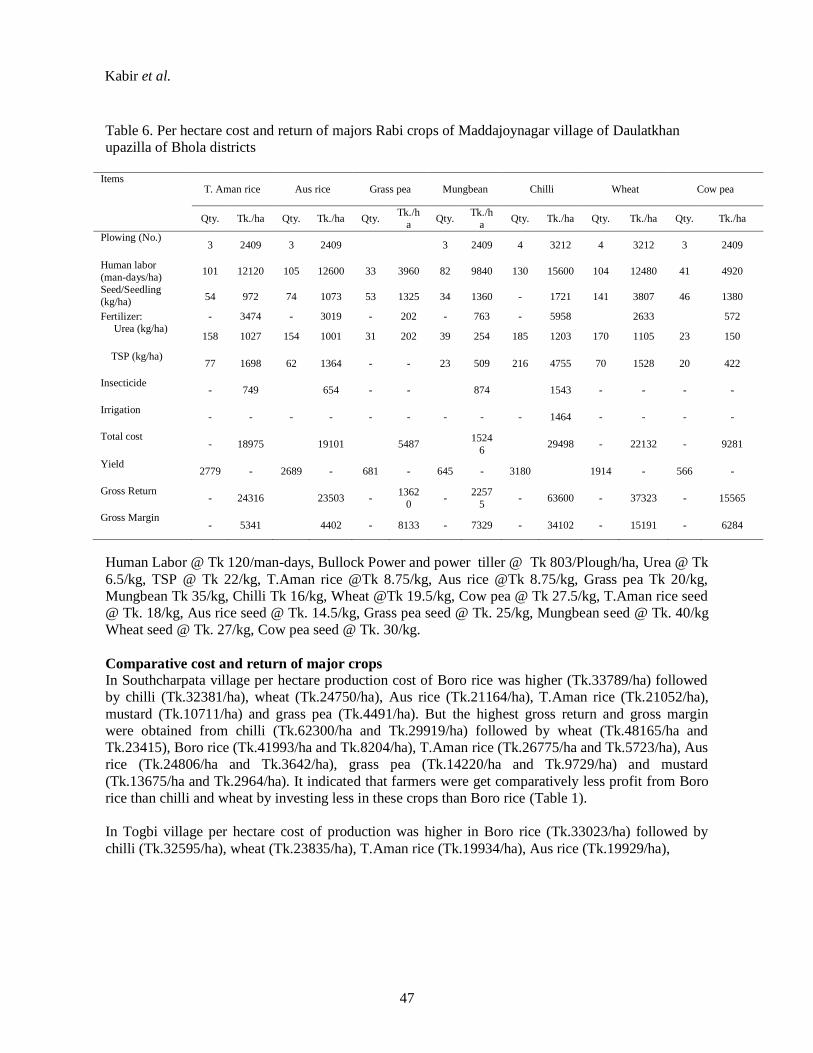
Table 6. Per hectare cost and return of majors Rabi crops of Maddajoynagar village of Daulatkhan
upazilla of Bhola districts
Items
T. Aman rice Aus rice Grass pea Mungbean Chilli Wheat Cow pea
Qty. Tk./ha Qty. Tk./ha Qty. Tk./h
a Qty.
Tk./h
a Qty. Tk./ha Qty. Tk./ha Qty. Tk./ha
Plowing (No.) 3 2409 3 2409 3 2409 4 3212 4 3212 3 2409
Human labor
(man-days/ha) 101 12120 105 12600 33 3960 82 9840 130 15600 104 12480 41 4920
Seed/Seedling
(kg/ha) 54 972 74 1073 53 1325 34 1360 - 1721 141 3807 46 1380
Fertilizer: - 3474 - 3019 - 202 - 763 - 5958 2633 572
Urea (kg/ha) 158 1027 154 1001 31 202 39 254 185 1203 170 1105 23 150
TSP (kg/ha) 77 1698 62 1364 - - 23 509 216 4755 70 1528 20 422
Insecticide - 749 654 - - 874 1543 - - - -
Irrigation - - - - - - - - - 1464 - - - -
Total cost - 18975 19101 5487
1524
6 29498 - 22132 - 9281
Yield 2779 - 2689 - 681 - 645 - 3180 1914 - 566 -
Gross Return - 24316 23503 -
1362
0 -
2257
5 - 63600 - 37323 - 15565
Gross Margin - 5341 4402 - 8133 - 7329 - 34102 - 15191 - 6284
Human Labor @ Tk 120/man-days, Bullock Power and power tiller @ Tk 803/Plough/ha, Urea @ Tk
6.5/kg, TSP @ Tk 22/kg, T.Aman rice @Tk 8.75/kg, Aus rice @Tk 8.75/kg, Grass pea Tk 20/kg,
Mungbean Tk 35/kg, Chilli Tk 16/kg, Wheat @Tk 19.5/kg, Cow pea @ Tk 27.5/kg, T.Aman rice seed
@ Tk. 18/kg, Aus rice seed @ Tk. 14.5/kg, Grass pea seed @ Tk. 25/kg, Mungbean seed @ Tk. 40/kg
Wheat seed @ Tk. 27/kg, Cow pea seed @ Tk. 30/kg.
Comparative cost and return of major crops
In Southcharpata village per hectare production cost of Boro rice was higher (Tk.33789/ha) followed
by chilli (Tk.32381/ha), wheat (Tk.24750/ha), Aus rice (Tk.21164/ha), T.Aman rice (Tk.21052/ha),
mustard (Tk.10711/ha) and grass pea (Tk.4491/ha). But the highest gross return and gross margin
were obtained from chilli (Tk.62300/ha and Tk.29919/ha) followed by wheat (Tk.48165/ha and
Tk.23415), Boro rice (Tk.41993/ha and Tk.8204/ha), T.Aman rice (Tk.26775/ha and Tk.5723/ha), Aus
rice (Tk.24806/ha and Tk.3642/ha), grass pea (Tk.14220/ha and Tk.9729/ha) and mustard
(Tk.13675/ha and Tk.2964/ha). It indicated that farmers were get comparatively less profit from Boro
rice than chilli and wheat by investing less in these crops than Boro rice (Table 1).
In Togbi village per hectare cost of production was higher in Boro rice (Tk.33023/ha) followed by
chilli (Tk.32595/ha), wheat (Tk.23835/ha), T.Aman rice (Tk.19934/ha), Aus rice (Tk.19929/ha),
Kabir et al.

48
19934
26206
6272
1992923749
3820
33023
44271
11248
32595
64840
32245
16587
23795
71785304
11360
6056
19382
25560
6178
23835
40931
17096
0
10000
20000
30000
40000
50000
60000
70000
Cost a
nd te
turn
(Tk./h
a)
Aman Aus Boro Chilli Mungbean Grasspea Groundnut Wheat
Figure 3. Profitability of major crops at Togbi village
Journal of Science and Technology, Vol. 8, 2010
49
groundnut (Tk.19382/ha), mungbean (Tk.16587/ha) and grass pea (Tk.5304/ha) whereas the highest
gross return and gross margin were obtained from chilli (Tk.64840/ha and Tk.32245/ha) followed by
wheat (Tk.40931/ha and Tk.17096), Boro rice (Tk.44271/ha and Tk.11248/ha), T.Aman rice
(Tk.26206/ha and Tk.6272/ha), mungbean (Tk.23795/ha and Tk.7178/ha), groundnut (Tk.25560/ha
and Tk.6178/ha), Aus rice (Tk.23749/ha and Tk.3820/ha) and grass pea (Tk.11360/ha and
Tk.6056/ha). Farmers were achieved a good amount of gross return and gross margin from chilli and
wheat than that of other Rabi crops (Table 5). In Maddajoynagar village per hectare cost of production
was higher in chilli (Tk.29498/ha) followed by wheat (Tk.22132/ha), Aus rice (Tk.19101/ha), T.Aman
rice (Tk.18975/ha), mungbean (Tk.15246/ha), cowpea (Tk.9281/ha), and grass pea (Tk.5487/ha). The
highest gross return and gross margin were also obtained from chilli (Tk.63600/ha and Tk.34102/ha)
followed by wheat (Tk.37323/ha and Tk.15191/ha) T.Aman rice (Tk.24316/ha and Tk.5341), Aus rice
(Tk.23503/ha and Tk.4402/ha), mungbean (Tk.22575/ha and Tk.7329/ha), cowpea (Tk.15565/ha and
Tk.6284/ha) and grass pea (Tk.13620/ha and Tk.8133/ha) (Table 6).
Findings of the report point out that among of the Rabi crops, cost of production of chilli, Boro rice
and wheat were comparatively higher than that of mungbean, cowpea, groundnut, mustard and grass
pea whereas gross return from chilli and wheat was comparatively higher than that of other Rabi crops
of the survey villages.
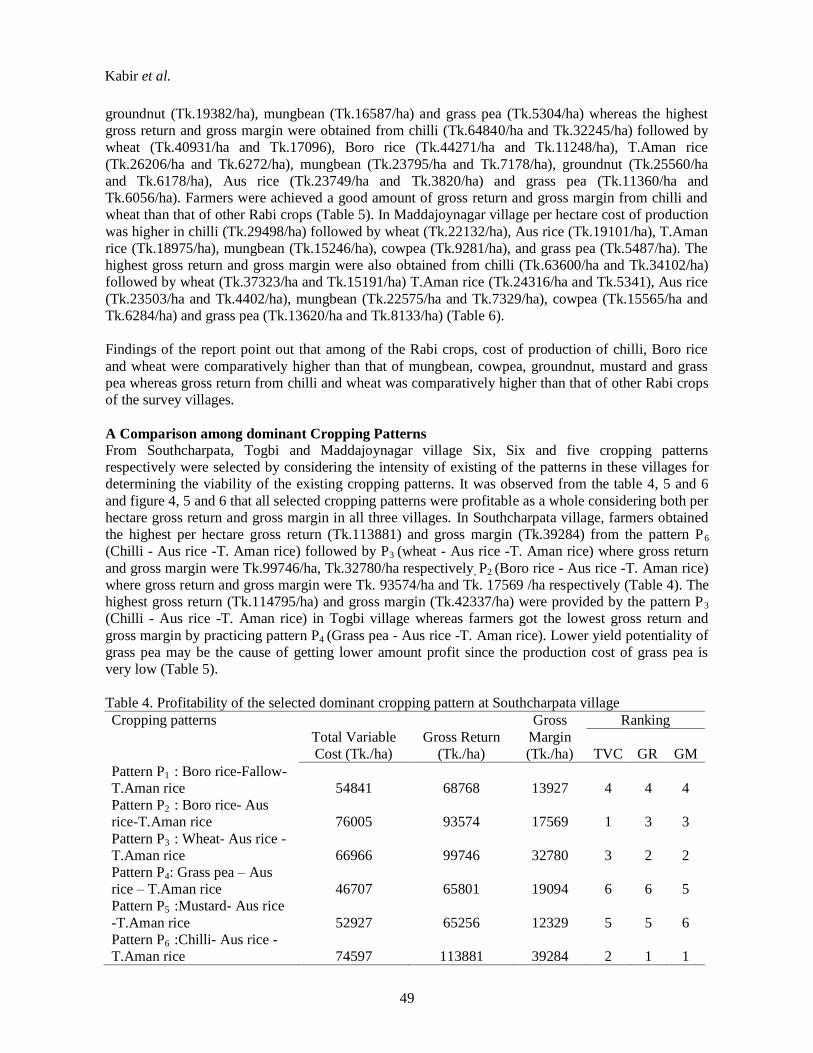
A Comparison among dominant Cropping Patterns From Southcharpata, Togbi and Maddajoynagar village Six, Six and five cropping patterns
respectively were selected by considering the intensity of existing of the patterns in these villages for
determining the viability of the existing cropping patterns. It was observed from the table 4, 5 and 6
and figure 4, 5 and 6 that all selected cropping patterns were profitable as a whole considering both per
hectare gross return and gross margin in all three villages. In Southcharpata village, farmers obtained
the highest per hectare gross return (Tk.113881) and gross margin (Tk.39284) from the pattern P6
(Chilli - Aus rice -T. Aman rice) followed by P3 (wheat - Aus rice -T. Aman rice) where gross return
and gross margin were Tk.99746/ha, Tk.32780/ha respectively, P2 (Boro rice - Aus rice -T. Aman rice)
where gross return and gross margin were Tk. 93574/ha and Tk. 17569 /ha respectively (Table 4). The
highest gross return (Tk.114795/ha) and gross margin (Tk.42337/ha) were provided by the pattern P3
(Chilli - Aus rice -T. Aman rice) in Togbi village whereas farmers got the lowest gross return and
gross margin by practicing pattern P4 (Grass pea - Aus rice -T. Aman rice). Lower yield potentiality of
grass pea may be the cause of getting lower amount profit since the production cost of grass pea is
very low (Table 5).
Table 4. Profitability of the selected dominant cropping pattern at Southcharpata village
Cropping patterns
Total Variable
Cost (Tk./ha)
Gross Return
(Tk./ha)
Gross
Margin
(Tk./ha)
Ranking
TVC GR GM
Pattern P1 : Boro rice-Fallow-
T.Aman rice 54841 68768 13927 4 4 4
Pattern P2 : Boro rice- Aus
rice-T.Aman rice 76005 93574 17569 1 3 3
Pattern P3 : Wheat- Aus rice -
T.Aman rice 66966 99746 32780 3 2 2
Pattern P4: Grass pea – Aus
rice – T.Aman rice 46707 65801 19094 6 6 5
Pattern P5 :Mustard- Aus rice
-T.Aman rice 52927 65256 12329 5 5 6
Pattern P6 :Chilli- Aus rice -
T.Aman rice 74597 113881 39284 2 1 1
Kabir et al.

50
Incase of Maddajoynagar village, farmers earned the highest per hectare gross return (Tk. 111419) and
gross margin (Tk. 43845) from the pattern P3 (Chilli - Aus rice -T. Aman rice). The second highest
gross return (Tk. 85142/ha) and gross margin (Tk.24934/ha) was obtained by the pattern P5 (wheat -
Aus rice -T. Aman rice) (Table 6).
It was observed from the comparative profitability of the selected dominant cropping patterns that
farmers were achieved more profit from comparatively lower adapted patterns. It is needed to identify
the major causes of adoption of Rabi crops.
Table 5. Profitability of the selected dominant cropping pattern at Togbi village
Patterns Total
variable cost
(Tk./ha)
Gross
return
(Tk./ha)
Gross
margin
(Tk./ha)
Ranking
TVC GR GM
Pattern P1 : Boro rice-Fallow-
T.Aman rice 52957 70477 17520 5 5 3
Pattern P2 : Mungbean -Aus rice-
T.Aman rice 56450 73750 17300 4 4 4
Pattern P3 : Chilli-Aus rice-
T.Aman rice 72458 114795 42337 1 1 1
Pattern P4 : Grass pea-Aus rice-
T.Aman rice 45167 61315 16148 6 6 6
Pattern P5: Groundnut -Aus rice-
T.Aman rice 59245 75515 16270 3 3 5
Pattern P6 : Wheat-Aus rice-
T.Aman rice 63698 90886 27188 2 2 2
Table 6. Profitability of the selected dominant cropping pattern at Maddajoynagar village
Patterns Total
Variable Cost
(Tk./ha)
Gross
Return
(Tk./ha)
Gross Margin
(Tk./ha)
Ranking
TVC GR GM
Pattern P1 : Grass pea –Aus rice-
T.Aman rice 43563 61439 17876 5 5 3
Pattern P2 : Mungbean -Aus rice-
T.Aman rice 53322 70394 17072 3 3 4
Pattern P3 : Chilli – Aus rice –
T.Aman rice 67574 111419 43845 1 1 1
Pattern P4 : Cow pea -Aus rice-
T.Aman rice 47357 63384 16027 4 4 5
Pattern P5: Wheat-Aus rice-
T.Aman rice 60208 85142 24934 2 2 2
Journal of Science and Technology, Vol. 8, 2010

51
CONCLUSIONS
It was observed from the findings of crops statistics and prevailing cropping pattern, 36%, 47 %, and 0
% percent cultivated area of Southcharpata,Togbi and Maddajoynagar village respectively was
occupied by Boro rice in Rabi season. It was also observed that there were about 12%, 2% and 7%
cultivated area of Southcharpata,Togbi and Maddajoynagar village respectively was occupied by
wheat. Remaining cultivated area was mostly occupied by grass pea, cowpea, mustard and mungbean
etc. Farmers of survey villages mentioned that there was scarcity of supplementary irrigation facilities
that is why they prefer to grow Rabi crops which were possible to grow under rain-fed condition.
Kabir et al.

52
Farmers of survey villages also said that they have affinity to grow Boro rice in Rabi season where
there are supplementary irrigation facilities. It may be due to that rice is their first preferred cereal
crops. They grow wheat, grass pea, cow pea, mustard, mungbean etc. in rain-fed condition. Findings
of the report point out that among of the Rabi crops, cost of production of chilli, Boro rice and wheat
were comparative higher than that of mungbean, cowpea, groundnut, mustard and grass pea whereas
gross return from chilli and wheat was comparatively higher than that of other Rabi crops of the
survey villages.
Results of this report also point out that proportion of area coverage by the chilli and wheat was not
significant whereas these two crops are comparatively more profitable than that of other Rabi crops.
Findings of all three villages indicated that the gross return and gross margin of any cropping pattern
could be increased substantially with the inclusion of chilli or wheat into the existing rice based
dominant cropping patterns of the farmers. It is due to the comparatively good yield potentiality and
good market price of chilli and wheat than that of other Rabi crops. In future survey needs to be
identifying the major causes of not adopting and not all Rabi crops.
REFERENCES
Ahmed S.M and Craig A. Meisner, 1996. Wheat Research and Development in Bangladesh.
Baksh E. 2004. Economic Efficiency and Sustainability of Wheat Production in Wheat Based BARI,
FSRDP.1987. A Research work on Monitored the Cropping Pattern in the FSRDP area at
Kazirshimla of Mymensingh district, Annual Research Report, BARI, Gazipur.
Carberry et al., 2006. Scoping study to assess the technical and economic feasibility of wheat
production in southern Bangladesh. Final report for ACIAR project SRA SMCN/2005/042.
Cropping Systems in North-West Bangladesh. An unpublished Ph.D. in Ag. Econ. Thesis, Bangladesh
Agricultural University, Mymensingh.
Hossain D. 1996. Relative Profitability from Alternative Cropping Patterns Under Irrigated Condition
in a Selected Area of Bogra District. An unpublished M.Sc. Ag. Econ. Thesis, Bangladesh
Agricultural University, Mymensingh.
Kabir M., JASMG. Hafeez, MAA. Begum and AF. Mollah. June 2002. Factors Influencing Okra and
Ash Gourd Production in Some Selected of Bangladesh: Bangladesh. Journal of Agricultural
Research. Vol. 27(2). BARI, Joydebpur, Bangladesh
Kabir MJ. (1999). “An Economic Evaluation of Okra and Ash Gourd vegetables in Gazipur and
Chittagong districts of Bangladesh” an unpublished MS thesis submitted to Department of
Agricultural Economics, BSMRAU, Gazipur, Bangladesh.
Mandal MAS. 1986. An Economic Analysis of Design Versus Farmers Cropping Patterns in Two
Villages in Mymensingh. Research Report No. 12, Bureau of Socio-Economic Research and
Training, Bangladesh Agricultural University, Mymensingh.
Rashid H. 1994. An Economic Study of Farmers Growing Crops with Potato and Without Potato in
Selected Area of Dinajpur. An unpublished M.Sc. Ag. Econ. Thesis, Bangladesh Agricultural
University, Mymensingh.
Rawson et al. 2006. On-farm wheat trials in Bangladesh: a study to reduce perceived constraints to
yield in traditional wheat areas and southern lands that remain fallow during the dry season.
Experimental Agriculture 43(1) (in press)
Journal of Science and Technology, Vol. 8, 2010