comparative life cycle assessment ingeo™ biopolymer…/media/files/natureworks/what-is... ·...
TRANSCRIPT

Final Report
Comparative Life Cycle Assessment Ingeo™ biopolymer, PET, and PP
Drinking Cups
for
Starbucks Coffee Company
Seattle, WA
&
NatureWorks LLC
by
PE Americas
Boston, MA
December 12, 2009
Contact:
Marc Binder
Liila Woods
PE Americas
344 Boylston Street
Boston, MA 02116, USA
Phone +1 [617] 247-4477
Fax +1 [617] 236-2033
E-mail [email protected]
Internet www.pe-international.com
ii
CONTENTS
LIST OF FIGURES ....................................................................................................................... IV�
LIST OF TABLES .......................................................................................................................... V�
ACRONYMS VI�
1� INTRODUCTION ................................................................................................. 1�
2� GOALS OF THE STUDY ..................................................................................... 3�
3� SCOPE OF THE STUDY ..................................................................................... 4�
3.1� System Description Overview ........................................................................... 4�
3.2� Functional Unit .................................................................................................. 5�
3.3� Study Boundaries .............................................................................................. 5�
3.3.1� Technology Coverage .......................................................................................... 6�3.3.2� Geographic Coverage .......................................................................................... 7�3.3.3� Time Coverage .................................................................................................... 7�
3.4� Selection of Impact Assessment Categories ................................................... 7�
3.5� Data Collection .................................................................................................. 8�
3.5.1� Limitations of Data ............................................................................................... 9�3.5.2� Production Phase ................................................................................................ 9�
3.5.2.1� PET Granulate ................................................................................................. 9�3.5.2.2� Ingeo Granulate ............................................................................................. 11�3.5.2.3� PP Granulate ................................................................................................. 12�3.5.2.4� Cup & Lid Manufacturing ................................................................................ 13�3.5.2.5� Transportation ................................................................................................ 14�
3.5.3� End of Life Phase .............................................................................................. 14�3.5.4� Fuels and Energy and Background Materials ..................................................... 15�3.5.5� Co-product Allocation ........................................................................................ 15�3.5.6� Emissions to Air, Water and Soil ........................................................................ 15�3.5.7� Cut-off Criteria ................................................................................................... 16�3.5.8� Data Quality ...................................................................................................... 16�
3.6� Software and Databases ................................................................................. 18�
3.7� Quality Assurance ........................................................................................... 18�
3.8� Critical Review ................................................................................................. 19�
3.8.1� Panel ................................................................................................................. 19�4� DESCRIPTION OF SCENARIOS ...................................................................... 20�
5� ENVIRONMENTAL RESULTS .......................................................................... 21�
5.1� Scenario Descriptions ..................................................................................... 21�
5.2� Life Cycle Impact Assessment Results .......................................................... 22�
5.2.1� Primary Energy Demand - non renewable ressources ........................................ 22�
iii
5.2.2� Global Warming Potential .................................................................................. 23�5.2.3� Acidification Potential ......................................................................................... 24�5.2.4� Eutrophication Potential ..................................................................................... 25�5.2.5� Summer Smog (POCP) ..................................................................................... 26�5.2.6� Water Consumption ........................................................................................... 27�5.2.7� Relevance of Different Phases ........................................................................... 27�5.2.8� Overall findings .................................................................................................. 29�
6� CONCLUSIONS & RECOMMENDATIONS ....................................................... 31�
APPENDIX A.� LIFE CYCLE IMPACT ASSESSMENT CATEGORIES ...................................... 32�
APPENDIX B.� LIFE CYCLE IMPACT ASSESSMENT RESULTS COMPARISON OF INGEO
2005, 2009, AND TARGET SCENARIOS .......................................................... 36�
APPENDIX C.� SCENARIOS FOR 1 BILLION CUPS ................................................................ 40�
APPENDIX D.� COMPOSTING .................................................................................................. 43�
APPENDIX E.� COMPARISON OF INGEO 2009 SCENARIOS WITH COMPOSTING TO PET
AND PP ............................................................................................................ 47�
APPENDIX F.� SCENARIOS FOR TRACI IMPACT ASSESSMENT METHODOLOGY ............. 49�
REFERENCES .......................................................................................................................... 52�
CRITICAL REVIEW STATEMENT ............................................................................................... 53�
iv
LIST OF FIGURES
Figure 1: General Flow Diagram for Systems Analyzed ............................................................... 4�Figure 2: System Boundaries Diagram ........................................................................................ 6�Figure 3: PET via DMT production model .................................................................................. 10�Figure 4: PET via terephthalic acid and ethylene glycol production model .................................. 10�Figure 5: Process Flow Diagram for Manufacturing of NatureWorks Ingeo Resin ....................... 11�Figure 6: Polypropylene Granulate Production Model ................................................................ 12�Figure 7: Propylene Production Model ....................................................................................... 13�Figure 8: Primary Energy Demand ............................................................................................ 22�Figure 9: Global Warming Potential ........................................................................................... 23�Figure 10: Acidification Potential ............................................................................................... 24�Figure 11: Eutrophication Potential ............................................................................................ 25�Figure 12: Summer Smog (POCP) ............................................................................................ 26�Figure 13: Water Consumption .................................................................................................. 27�Figure 14: Relative contribution to each impact by sub-process – PET ...................................... 28�Figure 15: Relative contribution to each impact by sub-process – PLA 2009 .............................. 28�Figure 16: Relative contribution to each impact by sub-process – PLA 2009 .............................. 29�Figure 17. Greenhouse Effect ................................................................................................... 33�Figure 18: Acidification Potential ............................................................................................... 33�Figure 19: Eutrophication Potential ............................................................................................ 34�Figure 20: Photochemical Ozone Creation Potential .................................................................. 35�Figure 21. Primary Energy Demand-Non Renewable Resources, Comparison .......................... 36�Figure 22. Global Warming Potential, Comparison .................................................................... 37�Figure 23. Acidification Potential, Comparison ........................................................................... 37�Figure 24. Eutrophication Potential, Comparison ....................................................................... 38�Figure 25. Summer Smog, Comparison ..................................................................................... 38�Figure 26. Water Consumption, Comparison ............................................................................. 39�Figure 27. Primary Energy Demand, Non-Renewable Resources (billion cups) .......................... 40�Figure 28. Global Warming Potential (billion cups) ..................................................................... 41�Figure 29. Acidification Potential (billion cups) ........................................................................... 41�Figure 30. Eutrophication Potential (billion cups) ....................................................................... 42�Figure 31. Ozone Creation Potential (billion cups) ..................................................................... 42�Figure 32: Process Flow Diagram for Industrial Composting Ingeo Cups ................................... 45�Figure 33: Industrial Composting Influence on Life Cycle Impacts .............................................. 45�Figure 34: Comparison of Life Cycles across Impacts ................................................................ 47�Figure 35. Global Warming Potential (TRACI) ........................................................................... 49�Figure 36. Acidification Potential (TRACI) .................................................................................. 50�Figure 37. Eutrophication Potential (TRACI) .............................................................................. 50�Figure 38. Smog Creation Potential (TRACI) ............................................................................. 51�

v
LIST OF TABLES
Table 1: System Boundaries ....................................................................................................... 6�Table 2: Cup and Lid Specifications .......................................................................................... 13�Table 3: Transportation ............................................................................................................. 14�Table 4: Technical Parameters of Scenarios ............................................................................. 20�
vi
ACRONYMS
ACC American Chemistry Council
AP Acidification Potential
CO2 Carbon Dioxide
EoL End of Life
EP Eutrophication Potential
GaBi Ganzheitlichen Bilanzierung (German for holistic balancing)
GHG Green house gas emissions
GWP Global Warming Potential
EPA Environmental Protection Agency
HIPS High impact polystyrene
IFEU Institute for Energy and Environmental Research
IP Intellectual Property
IPCC Intergovernmental Panel on Climate Change
ISO International Standards Organization
kg Kilogram
LCA Life Cycle Assessment
LCI Life Cycle Inventory
LCIA Life Cycle Impact Assessment
MJ Mega Joule
NOx Nitrogen Oxides
OPS Oriented polystyrene
OVAM Public Waste Agency for the Flemish Region
oz Ounce
PE Polyethylene
PEA PE Americas
PET Polyethylene terephthalate
PLA Polylactic Acid
PP Polypropylene
TRACI Tool for Reduction and Assessment of Chemical and Other Environmental
Impacts
WNC West North Central

1
1 INTRODUCTION
Life Cycle Assessment (LCA) is a standardized scientific method for systematic analysis
of any kind of flows (e.g. mass and energy) associated with the life cycle of a specified
product or with technological or service or manufacturing process systems (ISO, 2006a).
The approach in principle aims at a holistic and comprehensive analysis of the above
items including raw materials acquisition, manufacturing, as well as use and End of Life
(EoL) management. According to the International Organization for Standardization
(ISO), 14040/44 standards, an LCA study consists of four phases: (1) goal and scope
(framework and objective of the study); (2) life cycle inventory (input/output analysis of
mass and energy flows from operations along the products value chain); (3) Life Cycle
Impact Assessment (evaluation of environmental relevance, e.g. Global Warming
Potential); and (4) interpretation (e.g. optimization potential) (ISO, 2006a; ISO, 2006b).
The goal and scope stage outlines among others the rationale of the study, the
anticipated use of the results of the study, the boundary conditions, the data
requirements and the assumptions to analyze the product system under consideration.
The goal of the study is based upon the specific questions which need to be answered,
the target audience and the stakeholders involved and the intended application. The
scope of the study defines the systems boundary in terms of technological, geographical,
and temporal coverage of the study, attributes of the product system, and the level of
detail and the complexity addressed by the study.
The Life Cycle Inventory (LCI) stage qualitatively and quantitatively documents the
materials and energy used (input) as well as the products and by-products generated
and the environmental releases to the environmental compartments and the wastes
streams (output) for the product system being studied. The LCI data can be used on its
own to: understand total emissions, wastes and resource use associated with the
material or product being studied; to improve production or product performance; or it
can be further analyzed and interpreted to provide insights into the potential
environmental impacts from the system (Life Cycle Impact Assessment (LCIA) and
interpretation).
Starbucks Coffee Company (Starbucks) is interested in integrating sustainable
packaging materials into its cold beverage cup designs. In order to do so, Starbucks is
exploring alternative materials for its current polyethylene terephthalate (PET) cold cups
and flat lids, seeking better environmental performance characteristics when examined
from a life cycle perspective. NatureWorks LLC (NatureWorks), manufacturer of Ingeo™1
biopolymer (polylactide acid, PLA), could potentially supply this material, an alternative to
PET, to Starbucks’ drinking cup manufacturer (Solo). To support this effort, Starbucks
and NatureWorks have partnered to analyze the environmental performance of Ingeo
with respect to the total life cycle of select options of bio-based materials and plastics.
Polypropylene (PP) as an alternative to the current PET cup was also considered. The
1 Ingeo
TM is the trade name of the polylactide biopolymers produced by Natureworks LLC.

2
results as given in the underlying report are only valid for Ingeo™ biopolymer, a
polylactide polymer produced by Natureworks LLC. The results are not valid for PLA in
general.
3
2 GOALS OF THE STUDY
Starbucks Coffee Company (Starbucks) is interested in
• Continually improving its environmental sustainability performance;
• Analyzing sustainable material alternatives for use in its products;
• Exploring alternative material options for use in its 16 ounce cold cup and flat lid
system; and
• Comparing viable alternatives (e.g. Ingeo, PP) to its current use of polyethylene
terephthalate (PET) in these drinking cup systems.
The goals of this study are:
• Analyze and compare the environmental performance of PET, Ingeo and PP;
• Support the material selection decisions within Starbucks by determining which
material (PET, Ingeo, PP) is currently the most suitable, from an environmental
perspective for the purpose defined.
The intended audience of this study is Starbucks and NatureWorks, for internal
applications and decision-making. In addition to this internal usage and audience, the
results of this study may be made available to the public in the future, at the discretion of
Starbucks and NatureWorks. A third party critical review panel has been engaged to
meet the ISO standards for comparative assertion studies.
This LCA is an original ISO 14040-series compliant study comparing 16-ounce cold
beverage drinking cups and flat lids comprising of virgin PET, virgin PLA (Ingeo), and
virgin PP.
The life cycle phases of the beverage cup and lid product systems that were studied
include:
• Cradle-to-polymer factory gate pellet production for PET, Ingeo, and PP,
• Pellet transportation to converter,
• Conversion of pellet into cups and lids,
• Transport of cups and lids to Starbucks shops,
• Waste disposal in landfill
4
3 SCOPE OF THE STUDY
The following section describes the general scope of the project to achieve the stated
goals. This includes the identification of specific products to be assessed, the supporting
product systems, boundary of the study, allocation procedures, and cut-off criteria.
3.1 SYSTEM DESCRIPTION OVERVIEW
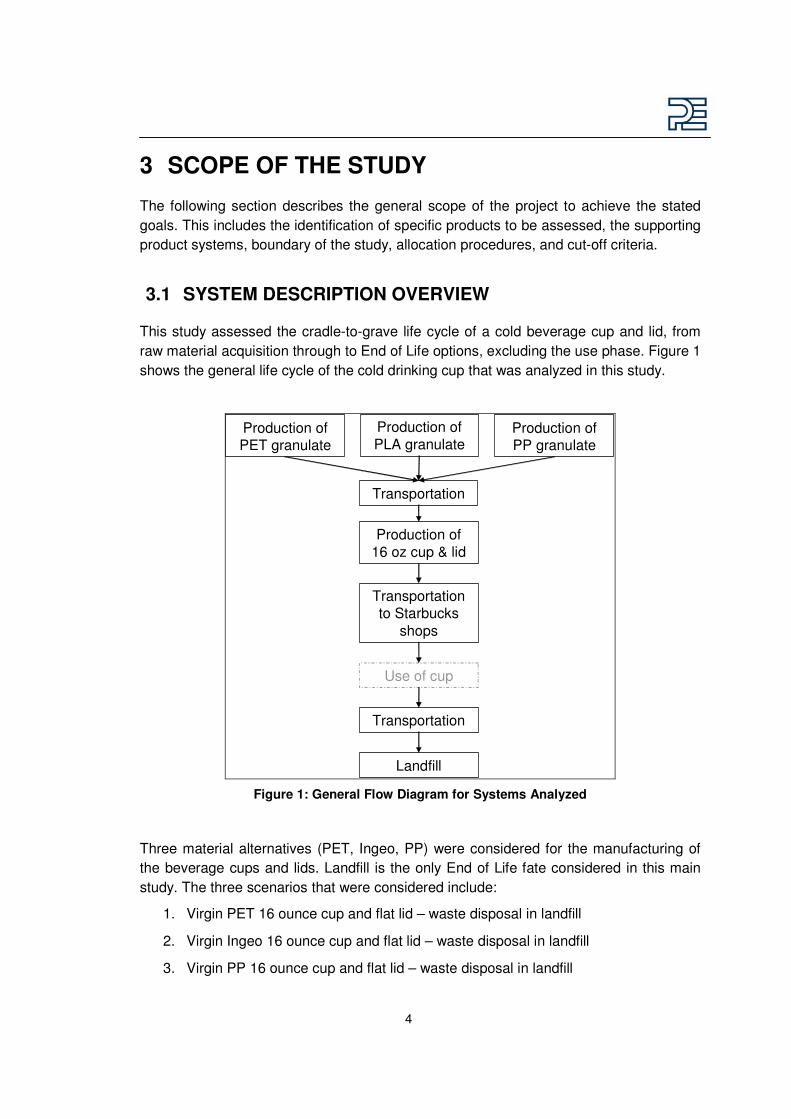
This study assessed the cradle-to-grave life cycle of a cold beverage cup and lid, from
raw material acquisition through to End of Life options, excluding the use phase. Figure 1
shows the general life cycle of the cold drinking cup that was analyzed in this study.
Production of
16 oz cup & lid
Transportationto Starbucks
shops
Transportation
Use of cup
Transportation
Landfill
Production of
PLA granulateProduction ofPET granulate
Production ofPP granulate
Figure 1: General Flow Diagram for Systems Analyzed
Three material alternatives (PET, Ingeo, PP) were considered for the manufacturing of
the beverage cups and lids. Landfill is the only End of Life fate considered in this main
study. The three scenarios that were considered include:
1. Virgin PET 16 ounce cup and flat lid – waste disposal in landfill
2. Virgin Ingeo 16 ounce cup and flat lid – waste disposal in landfill
3. Virgin PP 16 ounce cup and flat lid – waste disposal in landfill
5
Managed composting is discussed as a possible End of Life fate for Ingeo in Appendix C
as an additional scenario.
Recycling of used cups as an End of Life fate has not been addressed in this study as
there is no established infrastructure throughout the US to manage recycling of PET,
PLA, and PP cups and lids2.
3.2 FUNCTIONAL UNIT
The functional unit quantifies the performance of a product system and provides a
reference unit for the completed LCA. The functional unit for this study is one 16-ounce
single use cold beverage plastic cup with flat lid. It is assumed that all plastics used meet
the quality requirements as defined by Starbucks.3
The reference flows are:
1. 16-ounce single use cold beverage PET cup with flat PET lid
2. 16-ounce single use cold beverage Ingeo cup with flat Ingeo lid
3. 16-ounce single use cold beverage PP cup with flat PP lid
Results for 1 billion pieces of 16-ounce single use cold beverage plastic cup with flat lid
are shown in Appendix C.
3.3 STUDY BOUNDARIES
The study included the cradle-to-gate analysis for raw and processed materials, energies
and fuels required in the manufacturing, and transportation and a gate-to-grave analysis
for the disposal of the 16-ounce cup and flat lids for Starbuck’s cold drinks. The
transportation of raw materials to manufacturing, the transportation of finished product to
Starbucks shops, and the transportation of product to End of Life disposal were all
included. The use of the cup and lid was assumed to be identical and therefore not
included in this study.
Table 1 summarizes what was included and excluded in this study, while the system
boundaries diagram is shown in Figure 2.
2 The authors of this study are aware of the fact that PET, PLA, and PP can theoretically be separated from waste streams
and recycled. As this is currently not common practice this scenario is not analyzed in this effort. However it is recommended to include this in an update of this study.
3 Please note that the different materials show different technical characteristics, e.g. wall strength. As it is assumed that
all materials are meeting Starbucks specifications, performance characteristics are not further discussed in this assessment.

6
Table 1: System Boundaries
Included Excluded
• Raw materials production
• Processing of materials
• Internal recycling loops of plastics during product manufacturing
• Energy production
• Transportation of raw and processed materials
• Transportation of finished product
• Product disposal
• Capital equipment and maintenance
• Overhead (heating, lighting) of manufacturing facilities when easily differentiated
• Human labor
• Transportation of materials within a facility
• Use of product
Figure 2: System Boundaries Diagram
3.3.1 TECHNOLOGY COVERAGE
In this study, site-specific data representative of current cup manufacturing technology
were collected and analyzed. Primary data were collected for currently used technology
on the production of PP and PET cups. Ingeo production was modeled according to unit
process information as provided by Ingeo™ for their operation in Blair, Nebraska4.
The Polypropylene (PP) and Polyethylenterephthalate (PET) models represent to US
situation and are based on proprietary information as well as internal knowledge at PE
4 More information can be found on NatureWorks
® web site: http://www.natureworksllc.com/our-values-and-views/life-
cycle-assessment.aspx
Productionof16 oz cup & lid
Transportationto Starbucks
shops
Transportation
Use of cup
Transportation
Landfill
Materials, Energies &
Fuels
Production ofPET, Ingeo, PP
ResourcesWaste &
Emissions
System Boundaries

7
International. Please see chapter 3.5.2.1 and 3.5.2.3 for information on main material
and energy input of PP and PET production.
When no primary data were available, either estimations provided by the involved
companies or publicly available secondary data were used and documented as such.
For other ancillary or process materials, such as the production of chemical stock, fuels
and power, average industry or country mix, profiles from the GaBi databases 2006
(GaBi 4 Software system for Life Cycle Engineering database) were utilized.
For any required material-, energy-, and utility-production the “state of the art” technology
was used.
3.3.2 GEOGRAPHIC COVERAGE
The geographical coverage of this study was 16-ounce cold beverage cups and lids
produced for Starbucks in the United States (U.S.) for use in the United States (U.S.)
The Life Cycle Inventory (LCI) data on the production of PET and PP are representative
of U.S. production only and do not include potential imports from China, Mexico, or other
countries. Ingeo was modeled according to information provided by Ingeo™ on their
operations in Blair, Nebraska.
3.3.3 TIME COVERAGE
Polymer and background data (i.e., raw materials, intermediates, fuels, electricity) were
obtained from the GaBi 4 database and are representative of the years 2000-2005.
Ingeo data provided by NatureWorks, LLC are representative of 2009 (Ingeo 2009).
Data for the conversion of polymer pellet to the cup is representative of the current
situation (2008).
3.4 SELECTION OF IMPACT ASSESSMENT CATEGORIES
A comprehensive set of environmental impact categories were investigated. Within the
standard state-of-the-practice of life cycle impact assessment this includes the following
inventory flows and environmental categories: primary energy demand (Non Renewable
Resources)5, climate change (Global Warming Potential), smog formation
(Photochemical Ozone Creation Potential), Acidification Potential, and Eutrophication
Potential. This report presents results according to the CML methodology (Centre for
Milieukunde Leiden). The Tools for Reduction and Assessment of Chemical and Other
Environmental Impacts (TRACI, developed by the US EPA) impacts are provided for one
cup in Appendix F.
5 Primary Energy Demand is not an impact but is included in this section as it is also a sum value indicating the total
amount of energy extracted from earth or based on renewable resources.
8
Primary Energy Demand, as a measure of consumption of non renewable resources and
Global Warming Potential, as a measure of radiative forcing (heat absorption) relative to
carbon dioxide (CO2) are internationally accepted (respectively by the International
Energy Agency (IEA) and the Intergovernmental Panel on Climate Change (IPCC)). As
such, these measures of impact are considered relatively the most robust among the life
cycle impact assessment categories currently available to life cycle assessment
practitioners. This is explained in further detail in Appendix A.
Primary Energy Demand and Global Warming Potential are included in the study
because of their growing importance to the global environmental and political/economic
realm. Acidification, Eutrophication, Photochemical Ozone Creation Potential/ Smog Air
are included because they reflect the environmental impacts of regulated and additional
emissions of interest by industry and the public, e.g. SO2, NOX, CO, and hydrocarbons.
Acidification and Eutrophication impacts are directly related to the agricultural context
(farming).
In 2004 a group of environmental leaders released a report, the Apeldoorn Declaration6,
describing the shortcomings of toxicity and hazard characterization within LCA. As per
this declaration, it is the position of this study that “even though LCIA can use models
and methodologies developed for Risk Assessment, LCA is designed to compare
different products and systems and not to predict the maximal risks associated with
single substances.” Human and eco-toxicology results are best suited for case- and site-
specific studies that accurately model dispersion pathways, rates, and receptor
conditions.
The topic of water consumption has become more relevant in recent years. Therefore it
has been included in the assessment knowing that it is not a typical impact category. In
agricultural contexts, the quantities of water needed may outweigh the impacts of a
different material especially in areas which may be experiencing drought conditions in
recent years. This study considers the net water consumption. This means any water
which is used for cooling and then returned to an outside source is not counted. Only the
water which is consumed and integrated into the project is counted.
3.5 DATA COLLECTION
Data collection was coordinated by PE Americas. The following primary data were
collected or estimated:
• IngeoTM production: The following data were provided on the unit process level
o Material input
o Energy consumed
o Process emissions
6 Appeldoorn [2006] - http://www.leidenuniv.nl/cml/ssp/projects/declaration_of_apeldoorn.pdf
9
o Water consumption
• Transportation:
o Inbound transportation of raw materials: distance and mode provided by
the manufacturing companies
o Transportation of cups to distribution center: information provided by
Starbucks
o Transportation distribution center to Starbucks shops: average distance
and mode estimated by PE Americas after consultation with Starbucks
• Manufacturing of cup
o Weight of cup and lid
� PET: actual weight of current cup
� Ingeo: weight based on test runs
� PP: weight based on test runs
o Material efficiency
o Electricity consumption
All other data were from the GaBi databases or public data sources.
3.5.1 LIMITATIONS OF DATA
The results of this study are only applicable to the defined scenarios. Any adjustment of
the study boundaries or processes may change the results.
3.5.2 PRODUCTION PHASE
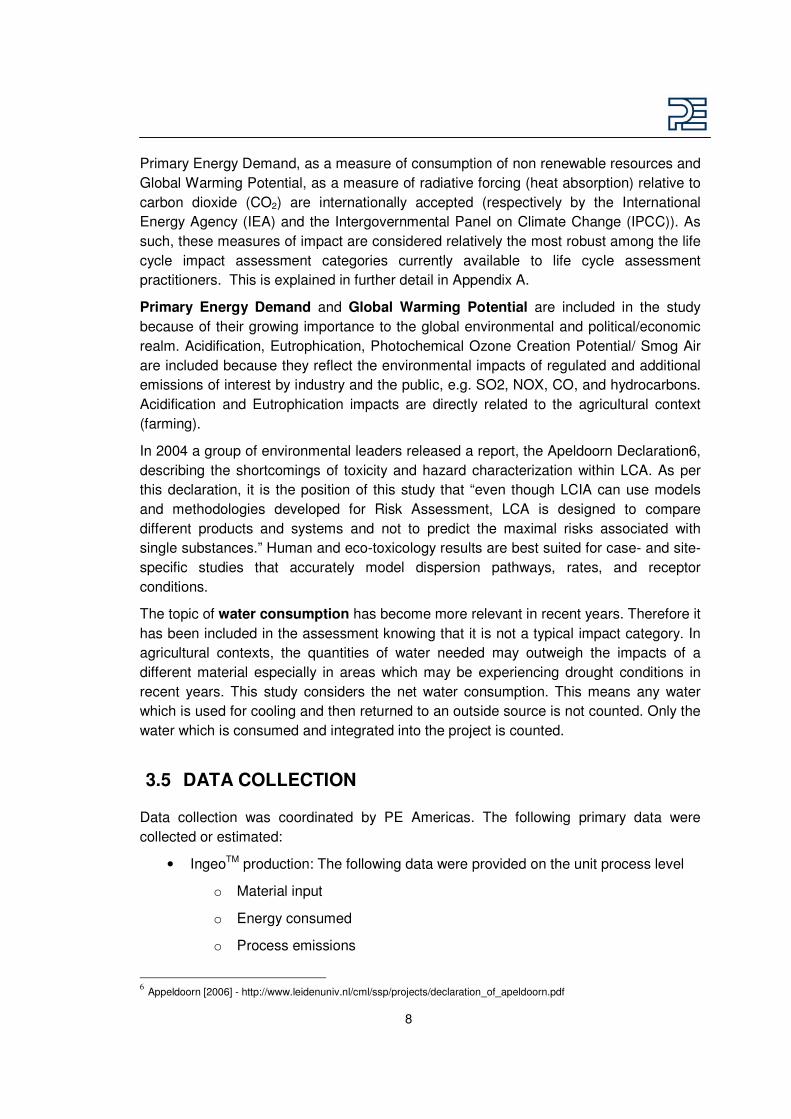
3.5.2.1 PET Granulate
The LCI inventory dataset for PET Granulate (Polyethylene terephthalate) production
was modeled using data from the GaBi databases 2006 and represents the U.S.
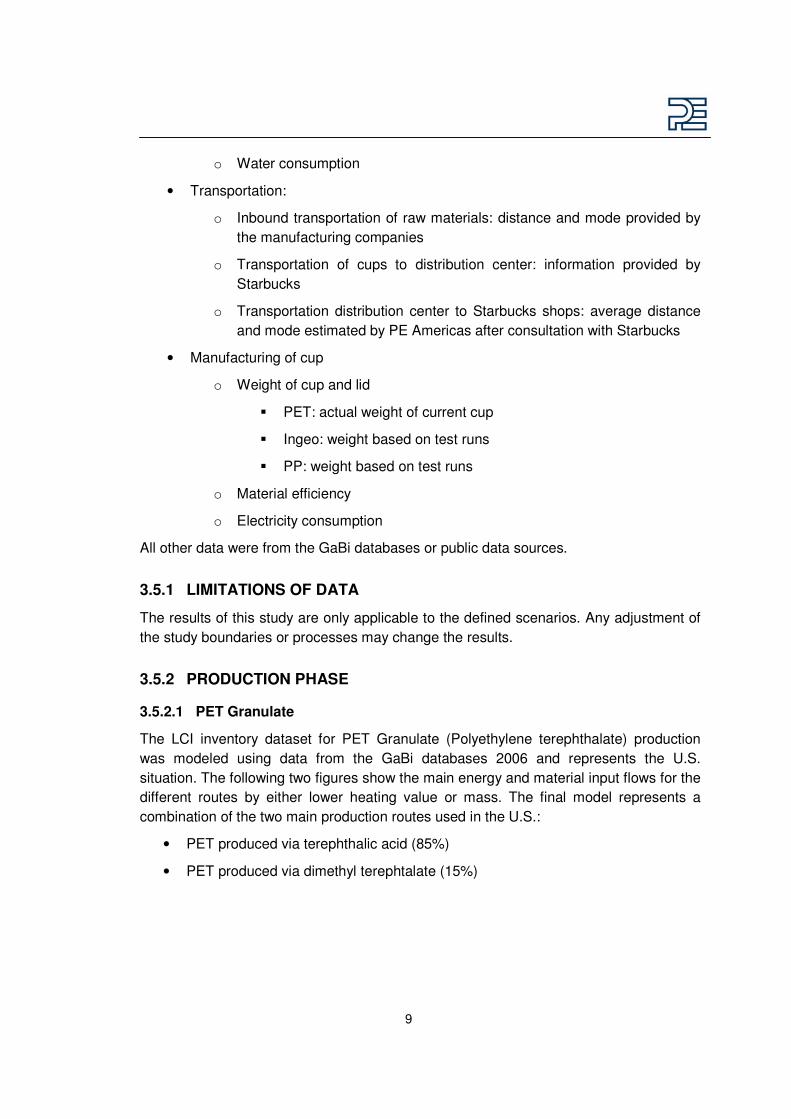
situation. The following two figures show the main energy and material input flows for the
different routes by either lower heating value or mass. The final model represents a
combination of the two main production routes used in the U.S.:
• PET produced via terephthalic acid (85%)
• PET produced via dimethyl terephtalate (15%)
10
Figure 3: PET via DMT production model
Figure 4: PET via terephthalic acid and ethylene glycol production model
The background datasets for energy and fuels (including steam) are also representative
of U.S. boundary conditions and are taken from the GaBi databases 2006. Additional
materials needed to run the process are considered but not shown due to confidentiality
and intellectual property reasons in the screenshot. In sum they contribute less than 5%
to the considered impact categories

11
3.5.2.2 Ingeo Granulate
Polylacide (PLA/Ingeo) is a thermoplastic polymer derived from bio-based materials such
as corn. Data used in this study were provided by Ingeo™ in a disaggregated way, and
represented the energies and auxiliaries/process materials needed for the Ingeo
production in addition to the process emissions related to the production process.
Figure 5: Process Flow Diagram for Manufacturing of NatureWorks Ingeo Resin7
7 Figure 1 from Erwin T.H. Vink, David A. Glassner, Jeffrey J. Kolstad, Robert J. Wooley, Ryan P. O’Connor “The eco-
profiles for current and near-future NatureWorks® polylactide (PLA) production” (Spring 2007). More information can be found on NatureWorks® web site: http://www.natureworksllc.com/our-values-and-views/life-cycle-assessment.aspx
12
In Figure 5, the general process flow diagram for Ingeo™ biopolymer is shown. Unit
process data provided include production of:
• Corn (harvesting, drying and transport),
• Dextrose,
• Lactic acid,
• Lactide, and
• Polylactide
Ingeo biopolymer has been modeled based on the unit process information as provided
by NatureWorks® and environmental profiles from the GaBi databases 2006 for energy
and background materials for US boundary conditions. This approach was chosen to
ensure that consistent energy and background materials profiles were used for all
materials assessed in this study.
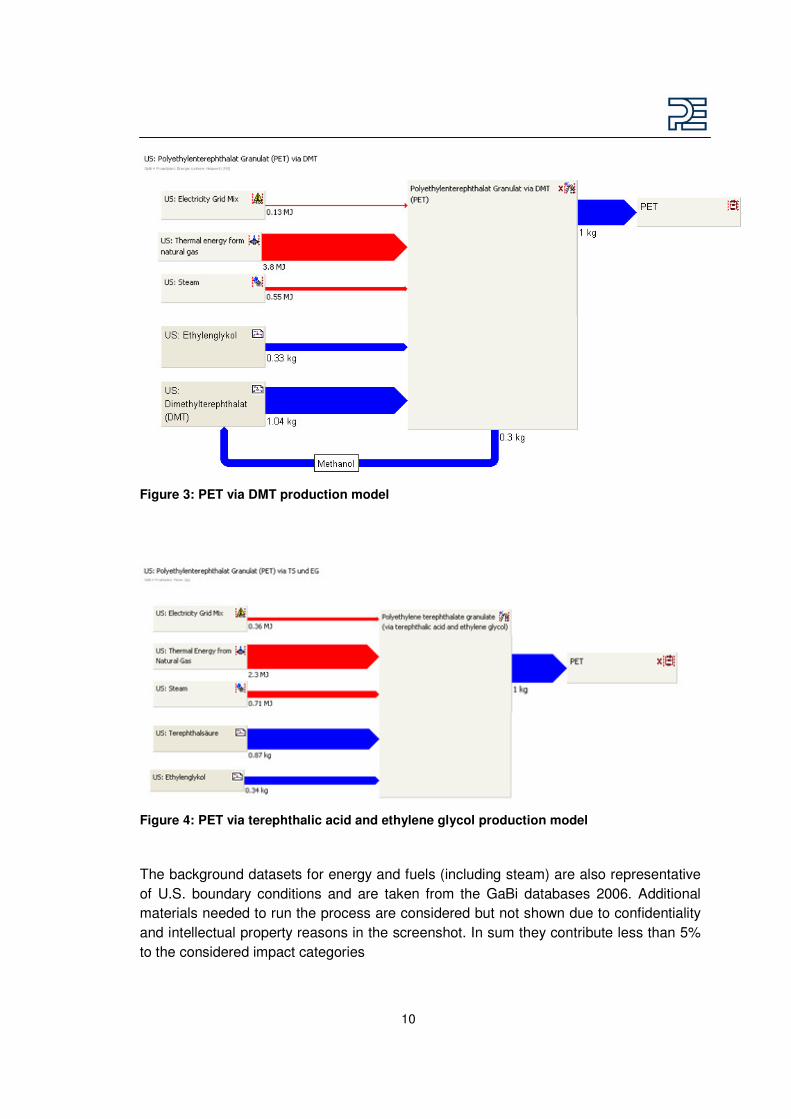
3.5.2.3 PP Granulate
The LCI data set for PP granulate was modeled using data from the GaBi databases
2006 and represents the U.S. situation. In Figure 6 and Figure 7, the input flows into the
process are shown either as lower heating value or mass. Additional materials like
nitrogen, hydrogen, sodium hydroxide as well as the catalysts which are needed to run
the process are considered but not shown due to confidentiality and intellectual property
reasons in the screenshot. In sum they contribute less than 5% to the considered impact
categories.
Figure 6: Polypropylene Granulate Production Model
13
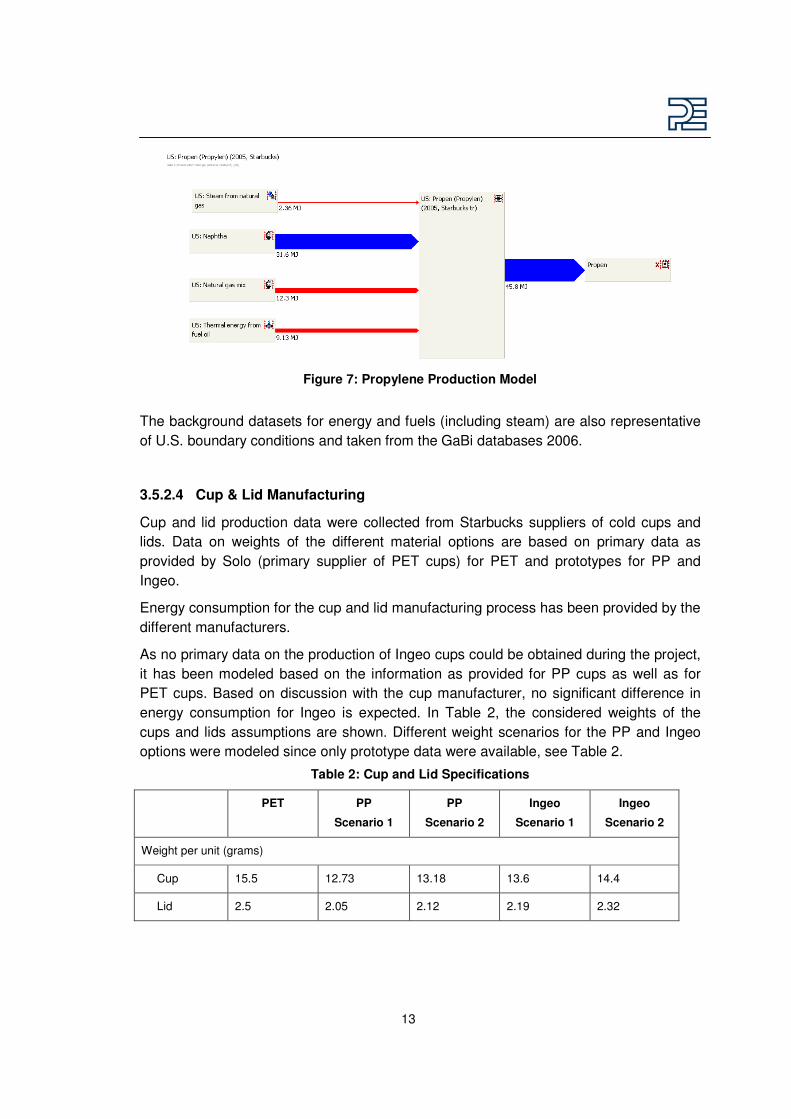
Figure 7: Propylene Production Model
The background datasets for energy and fuels (including steam) are also representative
of U.S. boundary conditions and taken from the GaBi databases 2006.
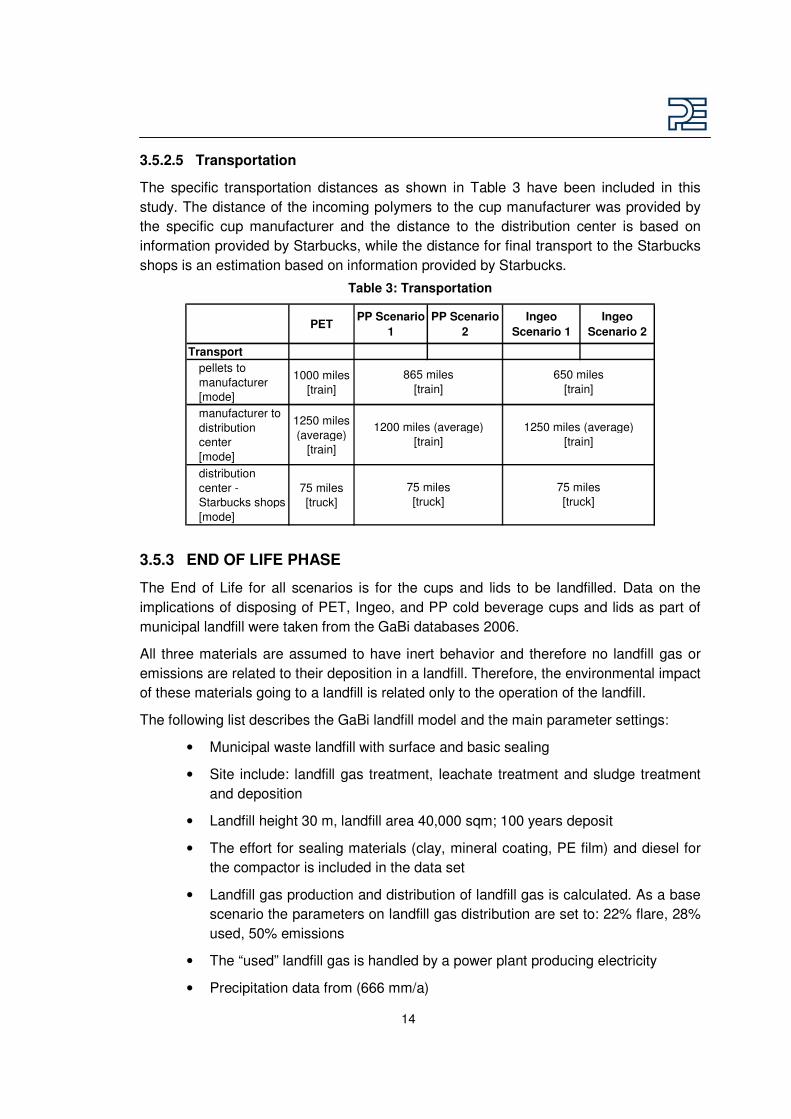
3.5.2.4 Cup & Lid Manufacturing
Cup and lid production data were collected from Starbucks suppliers of cold cups and
lids. Data on weights of the different material options are based on primary data as
provided by Solo (primary supplier of PET cups) for PET and prototypes for PP and
Ingeo.
Energy consumption for the cup and lid manufacturing process has been provided by the
different manufacturers.
As no primary data on the production of Ingeo cups could be obtained during the project,
it has been modeled based on the information as provided for PP cups as well as for
PET cups. Based on discussion with the cup manufacturer, no significant difference in
energy consumption for Ingeo is expected. In Table 2, the considered weights of the
cups and lids assumptions are shown. Different weight scenarios for the PP and Ingeo
options were modeled since only prototype data were available, see Table 2.
Table 2: Cup and Lid Specifications
PET PP
Scenario 1
PP
Scenario 2
Ingeo
Scenario 1
Ingeo
Scenario 2
Weight per unit (grams)
Cup 15.5 12.73 13.18 13.6 14.4
Lid 2.5 2.05 2.12 2.19 2.32
14
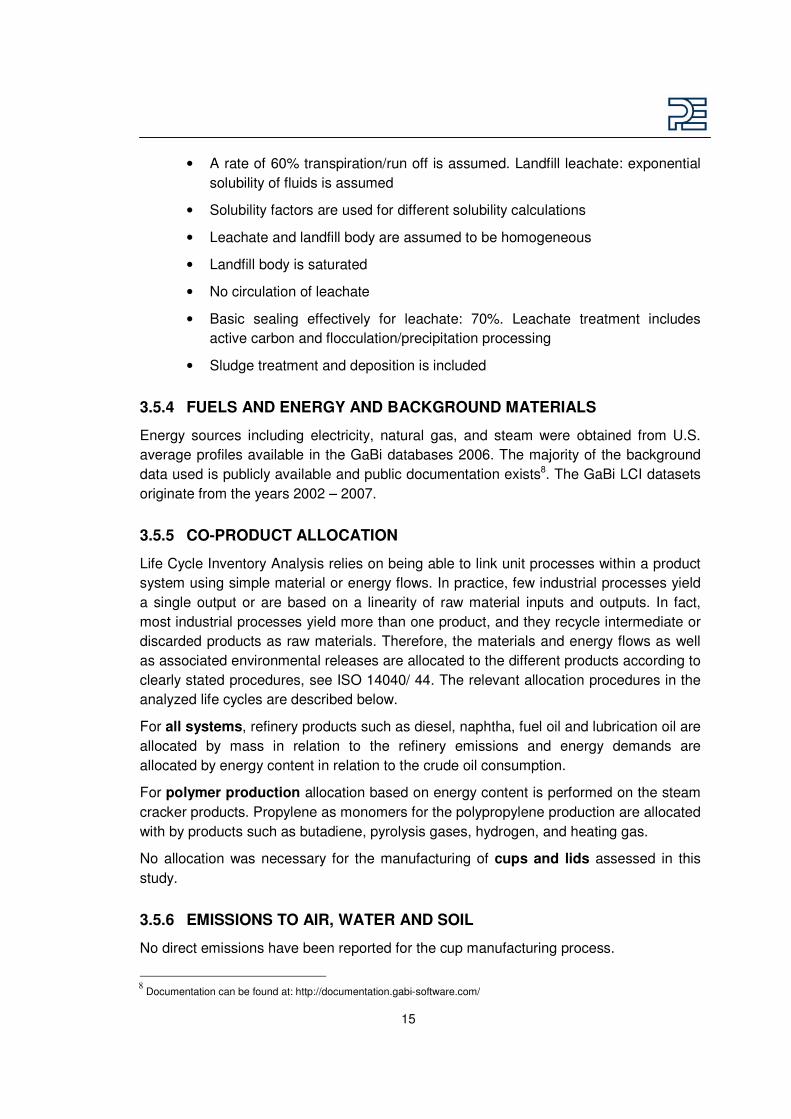
3.5.2.5 Transportation
The specific transportation distances as shown in Table 3 have been included in this
study. The distance of the incoming polymers to the cup manufacturer was provided by
the specific cup manufacturer and the distance to the distribution center is based on
information provided by Starbucks, while the distance for final transport to the Starbucks
shops is an estimation based on information provided by Starbucks.
Table 3: Transportation
PETPP Scenario
1
PP Scenario
2
Ingeo
Scenario 1
Ingeo
Scenario 2
Transport
pellets to
manufacturer
[mode]
1000 miles
[train]
manufacturer to
distribution
center
[mode]
1250 miles
(average)
[train]
distribution
center -
Starbucks shops
[mode]
75 miles
[truck]
865 miles
[train]
650 miles
[train]
1200 miles (average)
[train]
1250 miles (average)
[train]
75 miles
[truck]
75 miles
[truck]
3.5.3 END OF LIFE PHASE
The End of Life for all scenarios is for the cups and lids to be landfilled. Data on the
implications of disposing of PET, Ingeo, and PP cold beverage cups and lids as part of
municipal landfill were taken from the GaBi databases 2006.
All three materials are assumed to have inert behavior and therefore no landfill gas or
emissions are related to their deposition in a landfill. Therefore, the environmental impact
of these materials going to a landfill is related only to the operation of the landfill.
The following list describes the GaBi landfill model and the main parameter settings:
• Municipal waste landfill with surface and basic sealing
• Site include: landfill gas treatment, leachate treatment and sludge treatment
and deposition
• Landfill height 30 m, landfill area 40,000 sqm; 100 years deposit
• The effort for sealing materials (clay, mineral coating, PE film) and diesel for
the compactor is included in the data set
• Landfill gas production and distribution of landfill gas is calculated. As a base
scenario the parameters on landfill gas distribution are set to: 22% flare, 28%
used, 50% emissions
• The “used” landfill gas is handled by a power plant producing electricity
• Precipitation data from (666 mm/a)
15
• A rate of 60% transpiration/run off is assumed. Landfill leachate: exponential
solubility of fluids is assumed
• Solubility factors are used for different solubility calculations
• Leachate and landfill body are assumed to be homogeneous
• Landfill body is saturated
• No circulation of leachate
• Basic sealing effectively for leachate: 70%. Leachate treatment includes
active carbon and flocculation/precipitation processing
• Sludge treatment and deposition is included
3.5.4 FUELS AND ENERGY AND BACKGROUND MATERIALS
Energy sources including electricity, natural gas, and steam were obtained from U.S.
average profiles available in the GaBi databases 2006. The majority of the background
data used is publicly available and public documentation exists8. The GaBi LCI datasets
originate from the years 2002 – 2007.
3.5.5 CO-PRODUCT ALLOCATION
Life Cycle Inventory Analysis relies on being able to link unit processes within a product
system using simple material or energy flows. In practice, few industrial processes yield
a single output or are based on a linearity of raw material inputs and outputs. In fact,
most industrial processes yield more than one product, and they recycle intermediate or
discarded products as raw materials. Therefore, the materials and energy flows as well
as associated environmental releases are allocated to the different products according to
clearly stated procedures, see ISO 14040/ 44. The relevant allocation procedures in the
analyzed life cycles are described below.
For all systems, refinery products such as diesel, naphtha, fuel oil and lubrication oil are
allocated by mass in relation to the refinery emissions and energy demands are
allocated by energy content in relation to the crude oil consumption.
For polymer production allocation based on energy content is performed on the steam
cracker products. Propylene as monomers for the polypropylene production are allocated
with by products such as butadiene, pyrolysis gases, hydrogen, and heating gas.
No allocation was necessary for the manufacturing of cups and lids assessed in this
study.
3.5.6 EMISSIONS TO AIR, WATER AND SOIL
No direct emissions have been reported for the cup manufacturing process.
8 Documentation can be found at: http://documentation.gabi-software.com/
16
Direct process emissions data associated with Ingeo production were determined by
primary technical contacts familiar with the specific operations.
Data for all upstream materials and electricity and energy carriers were obtained from
the GaBi 4 Software databases.
Downstream emissions associated with distribution of the finished product were
determined by capturing the logistical operations.
No emissions during the use phase of the cup were anticipated and therefore this life
cycle phase was not assessed in this study.
End of Life emissions were determined by municipal waste operations data associated
with landfill for inert materials.
3.5.7 CUT-OFF CRITERIA
The cut-off criteria for the study include or exclude materials, energy and emissions flows
as follows:
• Mass – If a flow is less than 2% of the cumulative mass of the model it may be
excluded, providing its environmental relevance is not a concern.
• Energy – If a flow is less than 2% of the cumulative energy of the model it may be
excluded, providing its environmental relevance is not a concern.
• Environmental relevance – If a flow meets the above criteria for exclusion, yet is
thought to potentially have a significant environmental impact, it will be included.
All material flows which leave the system (emissions) and whose environmental
impact is over 2% of the whole impact of an impact category that has been
considered in the assessment, must be covered.
The sum of the excluded material flows must not exceed 5% of mass, energy or
environmental relevance.
3.5.8 DATA QUALITY
Overall the data quality is considered good. Data quality is judged by its precision
(measured, calculated or estimated), completeness (e.g. are there unreported
emissions?), consistency (degree of uniformity of the methodology applied on a study
serving as a data source) and representativeness (geographical, time period,
technology). To cover these requirements and to ensure reliable results, first-hand
industry data in combination with consistent, background LCA information from the
GaBi LCI database. This background information from the GaBi LCI database is widely
distributed and used with the GaBi 4 Software throughout numerous industries, research
institutions, universities, etc. The data sets have been used in LCA-models worldwide for
several years in industrial and scientific applications for internal as well as critically
reviewed studies. In the process of providing these datasets, they have been cross-
checked with other databases and experience values from industry and science.
17
Precision and completeness
• Precision: Manufacture of the cups and lids is based on information provided by
different cup manufacturers and PLA is modeled based on primary information
provided by the owner of the technology (NatureWorks LLC). No better precision
is attainable in this project. PP, PET as well as all upstream data is consistently
derived from the GaBi professional data base with the documented precision to
ensure consistency of boundary conditions.
• Completeness: All relevant, specific processes for the different options are
considered and modeled to represent each specific situation. Any background
processes are taken from the GaBi databases (see GaBi 4 documentation).
Consistency and reproducibility
• Consistency: To ensure consistency, only primary data of the same level of
detail and background data from the GaBi databases 2006 are used. While
building the model, cross-checks concerning the plausibility of mass and energy
flows are continuously conducted. The primary data provided by the technology
representatives was checked and recalculated by PE several times. No
inconsistencies were found.
• Reproducibility: The reproducibility is given for internal use since the owners of
the technology provided the data and the models are stored and available in the
GaBi database. Sub-systems are modeled by ´state of art´ technology using data
from publicly available and internationally used databases. Full reproducibility will
not be available for external audiences due to confidentiality agreements.
Representativeness
• Time related coverage:
- Cup and lid manufacturing: actual production data for 2007
- PLA: 2005 and 2009
- PP, PET and upstream data: 2002 to 2007
• Geographical coverage:
United States of America
• Technological coverage:
- The PET and PP models represent the US situation of PP and PET
production in the United States
- PLA represents the specific technology used by NatureWorks LLC.
- Manufacturing of cups and lids is based on primary information
provided by suppliers. It is representative for cup and lid
manufacturing. The information has been cross checked and
averaged with literature data. It has to be noted that the efficiency and

18
energy consumption may differ from literature and between suppliers.
The manufacturing models for the different materials are mainly based
on information provided by the same suppliers to ensure that the
same efficiency is considered.
3.6 SOFTWARE AND DATABASES
This LCA used the internationally recognized software system GaBi 4 for life cycle
engineering for simulations and calculations. GaBi 4 was jointly developed by LBP
(former IKP), University of Stuttgart, and PE International.
GaBi 4 is a tool for analyzing the environmental impacts of the operations as well as to
calculate mass and energy balances. GaBi 4 is also used to create emission profiles of
the operations, namely:
• to identify the process in the chain with the highest environmental impact
• for visualizing energy and mass flows by using Sankey diagrams
• for calculating Life Cycle Inventories (LCI) of the products
• for characterizing the LCI into environmental impacts
The GaBi 4 software includes an extensive database of upstream environmental data
regarding the production of materials, transports and energy supply.
The databases of GaBi 4 contain over 150 person years of data collection and compiling.
LCA data of over 1,000 different chemical process chains are available within GaBi.
Quality - Consistency – Relevancy – Continuity have been the main drivers in the GaBi 4
database. Close cooperation with many different industries across the life-cycle is the
essential element that guarantees usability and coverage, including: energy supply
chains and resources (such as oil, gas, coal, etc.) according to the country specific
situation; in any important resource mining area as well as end-energy supply processes
(such as power plants and refineries) in their country specific operation modes (adapted
to new standards); and all major and many other specialty production processes in the
fields of chemistry, plastics, metals, non-ferrous metals and precious metals (adapted to
current technology standards).
3.7 QUALITY ASSURANCE
An internal assurance review was performed by PEA staff members who were not
involved in conducting the work contained within this study.

19
3.8 CRITICAL REVIEW
According to the ISO 14040 series standards that define the LCA methodology, a
comparative assertion study requires a third-party critical review. The critical review
panel for this study consisted of both technical and non-technical (peer review) members
who were agreed upon by Starbucks, Ingeo™ and PEA.
3.8.1 PANEL
The technical panel included:
� Panel Chair: Dr. Joyce Cooper – Associate Professor, Department of Mechanical Engineering, Design for Environment Laboratory, University of Washington;
� Dr. Rob Anex – Associate Professor, Department of Agriculture and Biosystems Engineering, Iowa State University;
� Bryan Lembke – Director of Sustainability, several subsidiary brands of PepsiCo Beverages and Foods, Executive Committee Member of Sustainable Packaging Coalition.
The peer review panel included:
� Martha Stevenson – Project Manager, GreenBlue;
� Eric Brody – Principal, Shift Advantage, www.shiftadvantage.com

20
4 DESCRIPTION OF SCENARIOS
Within this chapter the different scenarios analyzed are described. This chapter
combines the technical parameters as described in earlier chapters.
As shown in Table 4, for Ingeo and PP two different weight scenarios have been
modeled and analyzed for each material. In addition to the different weight scenarios for
Ingeo, four different cup production scenarios for Ingeo have been assessed during this
study. The polymer production was based on technologies for 2009 using a regional
electricity mix at the plant (West North Central).
Table 4: Technical Parameters of Scenarios
PET PP Ingeo
Scenario 1 Scenario 2 Scenario 1 Scenario 2
weight per unit (grams)
cup 15.5 12.73 13.18 13.6 14.4
lid 2.5 2.05 2.12 2.19 2.32
Transport (miles)
pellets to manufacturer [mode]
1000 miles [train]
865 miles [train]
650 miles [train]
manufacturer to distribution center [mode]
1250 miles (average)
[train]
1200 miles (average) [train]
1250 miles (average) [train]
distribution center - Starbucks shops [mode]
75 miles [truck]
75 miles [truck]
75 miles [truck]
Manufacturing
energy consumption
consumption provided by
manufacturer
consumption provided by manufacturer
2 scenarios: PET: per unit (PET numbers) PP: per mass with consumption per kg as provided by PP cup provider
material data source
GaBi LCI database
(US) GaBi LCI database (US)
Ingeo 2005, Ingeo 2009, Ingeo Target: NatureWorks
specific and GaBi 4 LCI background information
(energies/chemicals)
End of Life
Landfill inert inert inert
21
5 ENVIRONMENTAL RESULTS
The following chapter shows the comparative results as well as the relevance of the
different life cycle stages. The results are analyzed and discussed.
Please note that all PLA numbers are based on NatureWorks LLC information and are
only valid for Ingeo™ PLA.
5.1 SCENARIO DESCRIPTIONS
These scenarios examine the different material options and weights. A total of 7 different
scenarios were considered and assessed in the main sections of the report.
Please note that the different scenarios are described according to the following logic:
“material” (“cup weight”/ “lid weight) “production technology”
Material:
PET, Ingeo 2009, PP
Production technology:
In case of PET and PP, specific information on the energy consumption was available.
For Ingeo, no specific data has been available and, therefore, Ingeo has been modeled
based on the information as provided for PP and PET.
prod PP = energy consumption for PP
prod PET = energy consumption for PET
As no information on the production of Ingeo cups and lids has been available, two
manufacturing scenarios have been modeled for Ingeo.
1. prod PET
This scenario is based on the information as provided for PET.
2. prod PP
This scenario is based on the information as provided for PP.
Additional scenarios for Ingeo 2005 and Ingeo Target are presented in Appendix B.
Please note that Ingeo 2009 is an improved version of Ingeo 2005 while Ingeo Target
represents the efficiencies NatureWorks® expects to reach in the future.

22
5.2 LIFE CYCLE IMPACT ASSESSMENT RESULTS
5.2.1 PRIMARY ENERGY DEMAND - NON RENEWABLE RESSOURCES
�
���
�
���
�
���
����������AB�C�DE�F������
�B��FB����AB����A�F�������BA�A�F��A�BA���EBDA��� ��������
�� ABCDE�F������� AB�����BF�DC�� ���C��DFCB��� AB�����BF������F� ��F�B���
Figure 8: Primary Energy Demand
Figure 8 shows that the Primary Energy Demand from non renewable resources (fossil
energy) is dominated by the production of the various polymers and the manufacturing of
cups and lids. In addition, the different scenarios for cup weight for Ingeo and PP shows
a slight influence on the material share of these scenarios. Figure 8 also indicates that
the PET has the largest primary energy demands – non renewable resources. While the
PP cups have a lower primary energy demand than the PET, the Ingeo scenarios have
the lowest primary energy demands of all the scenarios.
23
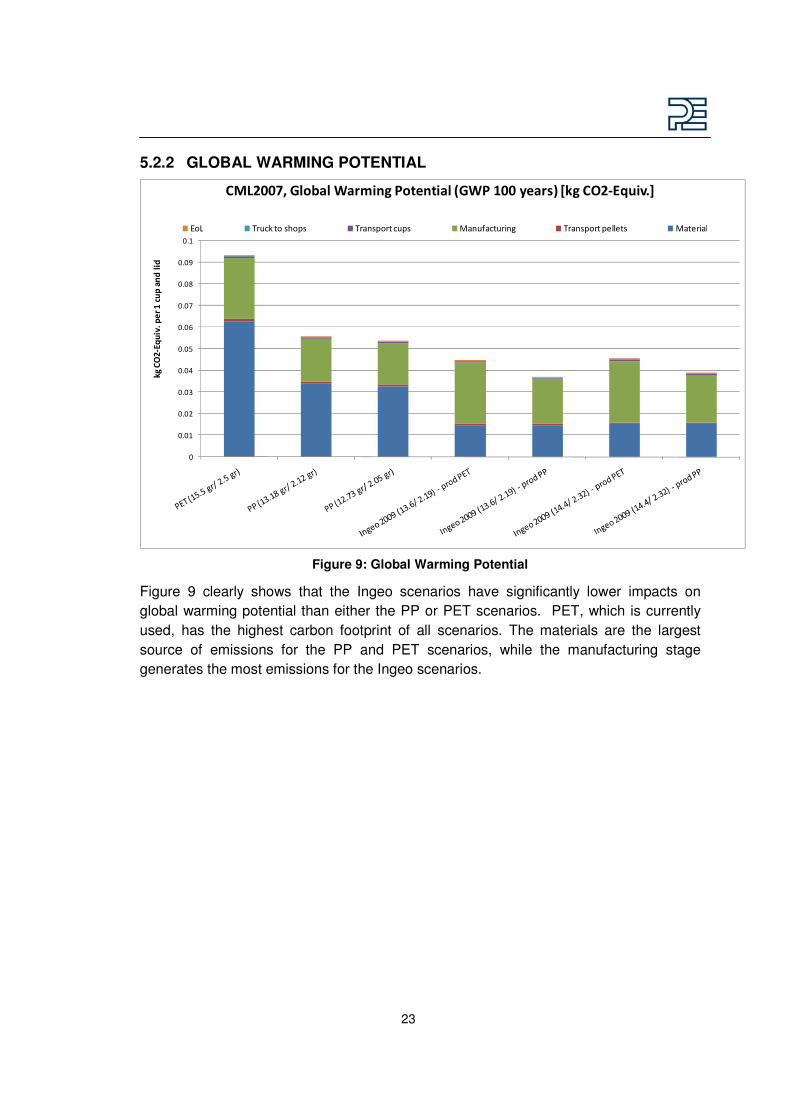
5.2.2 GLOBAL WARMING POTENTIAL
�
����
����
����
����
����
����
����
����
���
���
��� !"��#E�$%�AB�C�DE�F������
��"&&'(�)���F��*FB�������+A�+�F��,)*��C&&��AFB�-����� !"��#E�$%�
�� ABCDE�F������� AB�����BF�DC�� ���C��DFCB��� AB�����BF������F� ��F�B���
Figure 9: Global Warming Potential
Figure 9 clearly shows that the Ingeo scenarios have significantly lower impacts on
global warming potential than either the PP or PET scenarios. PET, which is currently
used, has the highest carbon footprint of all scenarios. The materials are the largest
source of emissions for the PP and PET scenarios, while the manufacturing stage
generates the most emissions for the Ingeo scenarios.
24
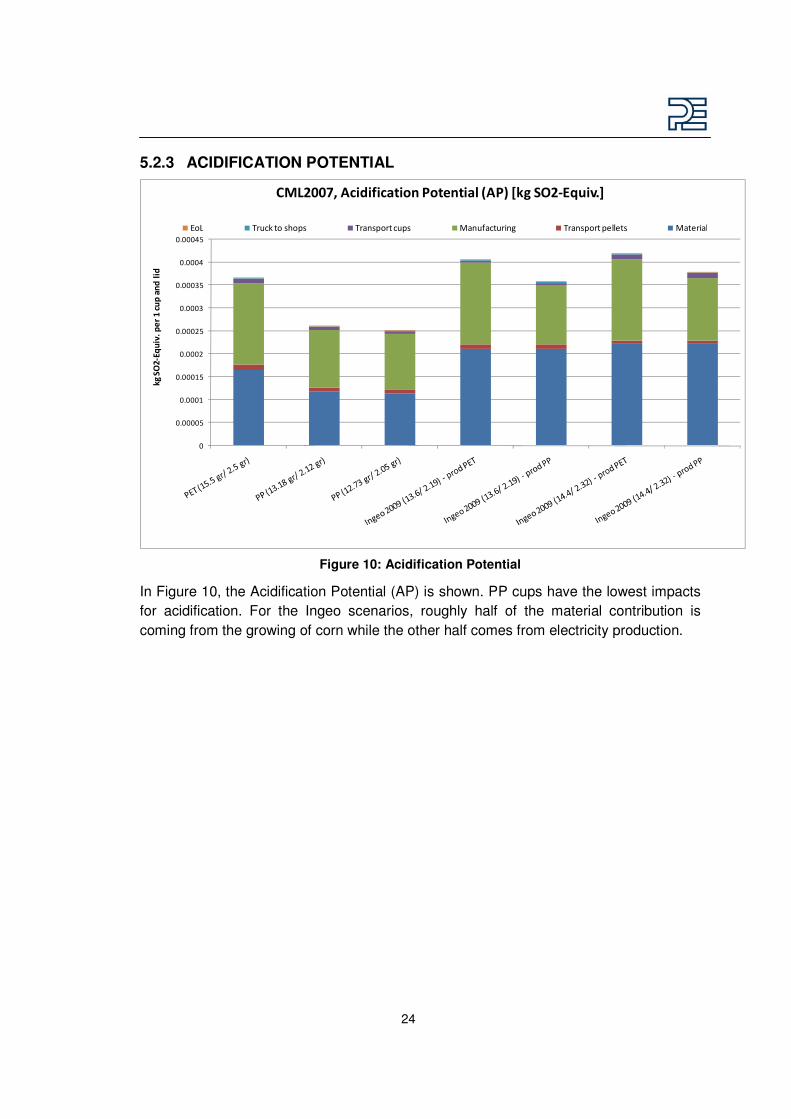
5.2.3 ACIDIFICATION POTENTIAL
�
�������
������
�������
������
�������
������
�������
������
�������
���.!"��#E�$%�AB�C�DE�F������
��"&&'(�/D���0�DF+������+A�+�F��,/�-�����.!"��#E�$%�
�� ABCDE�F������� AB�����BF�DC�� ���C��DFCB��� AB�����BF������F� ��F�B���
Figure 10: Acidification Potential
In Figure 10, the Acidification Potential (AP) is shown. PP cups have the lowest impacts
for acidification. For the Ingeo scenarios, roughly half of the material contribution is
coming from the growing of corn while the other half comes from electricity production.
25
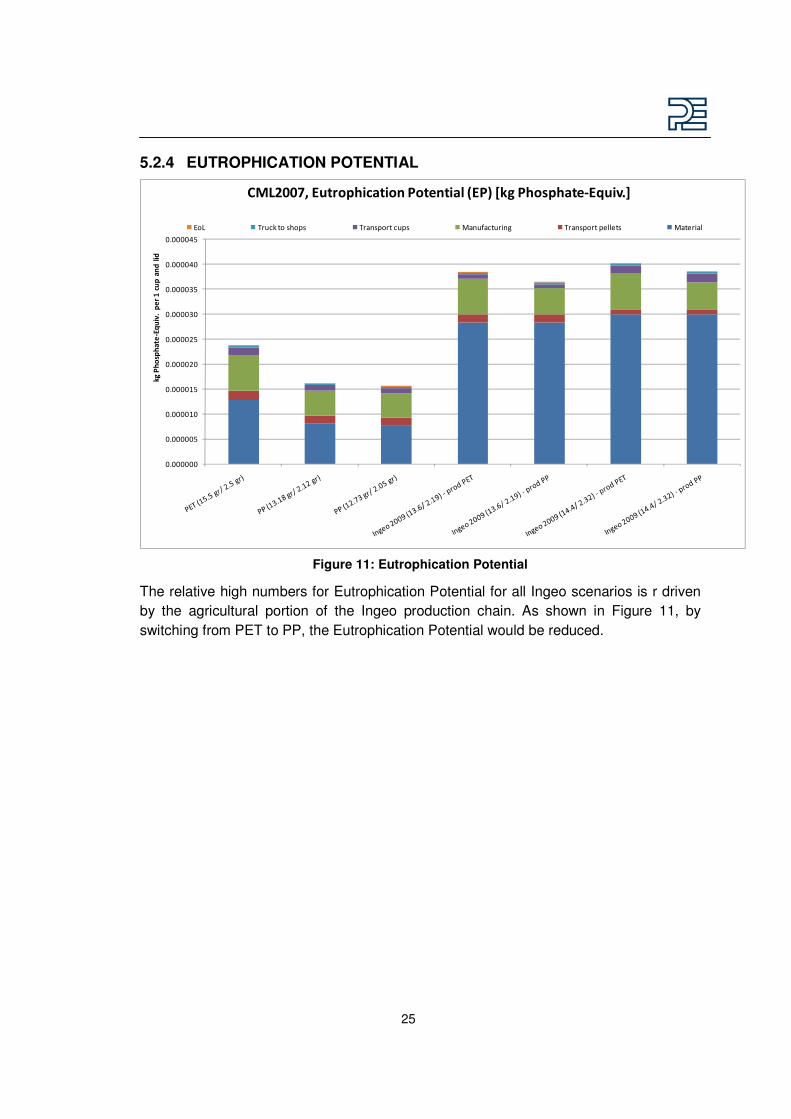
5.2.4 EUTROPHICATION POTENTIAL
��������
��������
��������
��������
��������
��������
��������
��������
��������
��������
����1��1F+A��#E�$%�AB�C�DE�F������
��"&&'(��E+B�1�DF+������+A�+�F��,��-������1��1F+A��#E�$%�
�� ABCDE�F������� AB�����BF�DC�� ���C��DFCB��� AB�����BF������F� ��F�B���
Figure 11: Eutrophication Potential
The relative high numbers for Eutrophication Potential for all Ingeo scenarios is r driven
by the agricultural portion of the Ingeo production chain. As shown in Figure 11, by
switching from PET to PP, the Eutrophication Potential would be reduced.
26
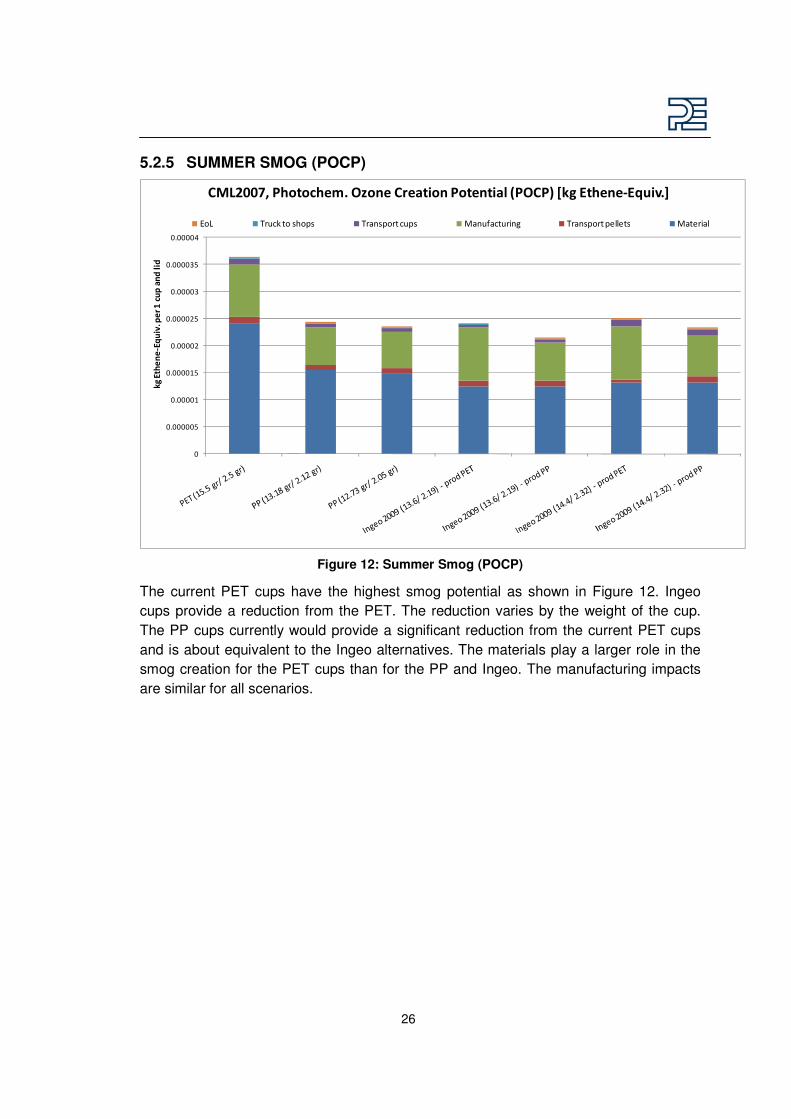
5.2.5 SUMMER SMOG (POCP)
�
��������
�������
��������
�������
��������
�������
��������
�������
����+1A�A��#E�$%�AB�C�DE�F������
��"&&'(��1�+�D1A�%�!2��A� BAF+������+A�+�F��,�! �-������+1A�A��#E�$%�
�� ABCDE�F������� AB�����BF�DC�� ���C��DFCB��� AB�����BF������F� ��F�B���
Figure 12: Summer Smog (POCP)
The current PET cups have the highest smog potential as shown in Figure 12. Ingeo
cups provide a reduction from the PET. The reduction varies by the weight of the cup.
The PP cups currently would provide a significant reduction from the current PET cups
and is about equivalent to the Ingeo alternatives. The materials play a larger role in the
smog creation for the PET cups than for the PP and Ingeo. The manufacturing impacts
are similar for all scenarios.
27
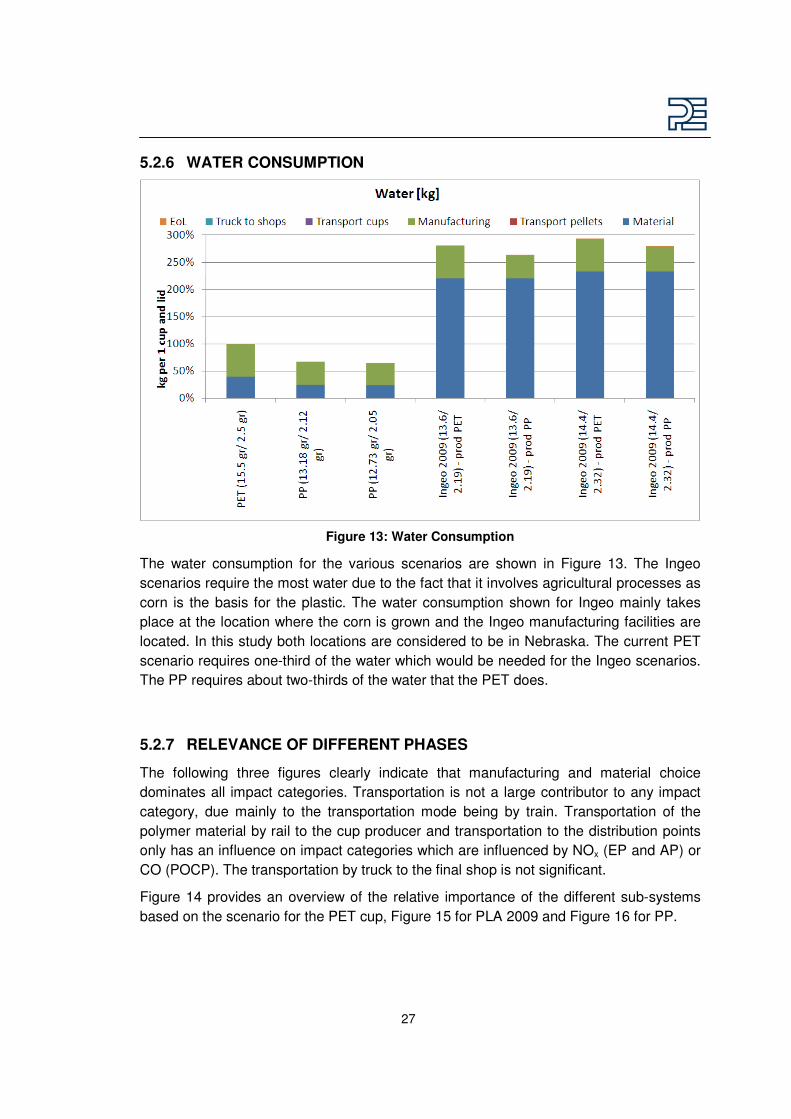
5.2.6 WATER CONSUMPTION
Figure 13: Water Consumption
The water consumption for the various scenarios are shown in Figure 13. The Ingeo
scenarios require the most water due to the fact that it involves agricultural processes as
corn is the basis for the plastic. The water consumption shown for Ingeo mainly takes
place at the location where the corn is grown and the Ingeo manufacturing facilities are
located. In this study both locations are considered to be in Nebraska. The current PET
scenario requires one-third of the water which would be needed for the Ingeo scenarios.
The PP requires about two-thirds of the water that the PET does.
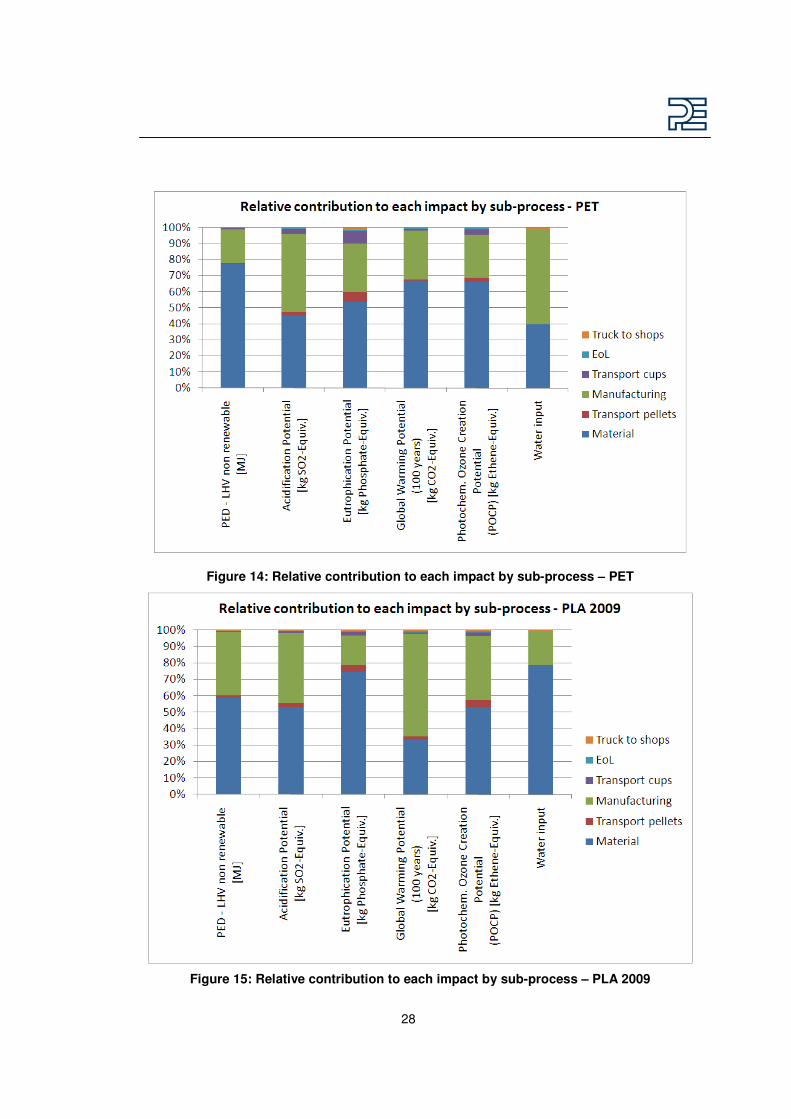
5.2.7 RELEVANCE OF DIFFERENT PHASES
The following three figures clearly indicate that manufacturing and material choice
dominates all impact categories. Transportation is not a large contributor to any impact
category, due mainly to the transportation mode being by train. Transportation of the
polymer material by rail to the cup producer and transportation to the distribution points
only has an influence on impact categories which are influenced by NOx (EP and AP) or
CO (POCP). The transportation by truck to the final shop is not significant.
Figure 14 provides an overview of the relative importance of the different sub-systems
based on the scenario for the PET cup, Figure 15 for PLA 2009 and Figure 16 for PP.
28
Figure 14: Relative contribution to each impact by sub-process – PET
Figure 15: Relative contribution to each impact by sub-process – PLA 2009

29
Figure 16: Relative contribution to each impact by sub-process – PLA 2009
5.2.8 OVERALL FINDINGS
The environmental performance of the current Starbucks 16-ounce cold drinking cup and
lid made from PET and potential alternative material options, Ingeo and PP, have been
assessed.
The conclusions are based on the data and results shown in the previous chapters.
It has to be stated that the Ingeo numbers are based on NatureWorks LLC information
and are only valid for Ingeo™ PLA. The results may vary for other PLA production
technologies.
The assessment of the different scenarios resulted in the following findings:
� The different weight scenarios for cup and lid weight for PP and Ingeo considered
in the study show
o small influence on the environmental footprint related to the material
share of Ingeo respective PP scenarios, and
o the influence on transportation by train is negligible.
� Manufacturing show significant contribution for all scenarios.
� Ingeo 2009 shows large improvement on all impact scenarios considered due to
improvements and more efficient production process of Ingeo, but not a large
difference between the two types of scenarios
30
� PP shows better environmental performance than PET for all considered
categories of interest
� Ingeo and PP show lower numbers for all scenarios for primary energy demand
(PED) from non renewable resources, GWP and POCP than PET
� Final weight of cups and lids are an influential parameter. The contribution of the
environmental impact of the cup is mainly influenced by the material of choice
and weight as the efforts for manufacturing are within the same ballpark for all
three materials and transportation via train is not important.
� Transportation via train, polymer pellets and cup/lids to distribution center, is not
significant and not influential for the material selection.
� Transportation via truck to shops is not significant
� The impacts associated with landfill can be neglected. All three materials are
considered to be inert in landfill operations. It is assumed that all three materials
do not degrade in conventional landfill operations.

31
6 CONCLUSIONS & RECOMMENDATIONS
Starbucks should consider the environmental performance results based on the analysis
of this study when choosing between the alternatives. The decision must consider the
study boundary conditions and assumptions, including the assumptions that
transportation is mainly done by train and that all materials have inert behavior should
they be disposed in a landfill operation. Differences in product performance assumptions
should also be taken into consideration when formulating a conclusion.
When focusing on GWP (consumption of fossil energy sources and summer smog), both
of the alternative material options considered in this study (Ingeo and PP) show
significant potential to reduce the environmental impact of cold drinking cups over the
current use of PET.
Switching to Ingeo 2009 as a material of choice would reduce PED, GWP, and in most
cases the Smog Potential when compared to switching to PP in the considered boundary
conditions.
Transportation via train does not contribute significantly to the environmental
performance. Therefore a focus on transport via train over transport via truck should be
made for future considerations when expanding the market.
Recommendations:
As it is expected that the infrastructure for recycling used polymer drinking cups will
mature in the future, recycling of used cups should be added as a scenario to determine
the potentials and risks associated with closed loop recycling.
32
Appendix A. LIFE CYCLE IMPACT ASSESSMENT CATEGORIES
Primary energy consumption
Primary Energy Demand is often difficult to determine due to the various types of energy
sources. Primary Energy Demand is the quantity of energy directly withdrawn from the
hydrosphere, atmosphere or geosphere or energy source without any anthropogenic
change. For fossil fuels and uranium, this would be the amount of resource withdrawn
expressed in its energy equivalent (i.e. the energy content of the raw material). For
renewable resources, the energy-characterized amount of biomass consumed would be
described. For hydropower, it would be based on the amount of energy that is gained
from the change in the potential energy of the water (i.e. from the height difference). As
aggregated values, the following primary energies are designated:
The total “Primary energy consumption non renewable”, given in MJ, essentially
characterizes the gain from the energy sources natural gas, crude oil, lignite, coal and
uranium. Natural gas and crude oil will be used both for energy production and as
material constituents e.g. in plastics. Coal will primarily be used for energy production.
Uranium will only be used for electricity production in nuclear power stations.
The total “Primary energy consumption renewable”, given in MJ, is generally
accounted separately and comprises hydropower, wind power, solar energy and
biomass.
It is important that the end energy (e.g. 1 kWh of electricity) and the primary energy used
are not miscalculated with each other; otherwise the efficiency for production or supply of
the end energy will not be accounted for.
The energy content of the manufactured products will be considered as feedstock energy
content. It will be characterized by the net calorific value of the product. It represents the
still usable energy content.
Global Warming Potential (GWP)
The mechanism of the greenhouse effect can be observed on a small scale, as the name
suggests, in a greenhouse. These effects are also occurring on a global scale. The
short-wave radiation from the sun comes into contact with the earth’s surface and is
partly absorbed (leading to direct warming) and partly reflected as infrared radiation. The
reflected part is absorbed by so-called greenhouse gases in the troposphere and is re-
radiated in all directions, including back to earth. This results in a warming effect at the
earth’s surface.
In addition to the natural mechanism, the greenhouse effect is enhanced by human
activities. Greenhouse gases that are considered to be caused, or increased,
anthropogenically are, for example, carbon dioxide, methane and CFCs. Figure 17
shows the main processes of the anthropogenic greenhouse effect. An analysis of the
greenhouse effect should consider the possible long term global effects.
33
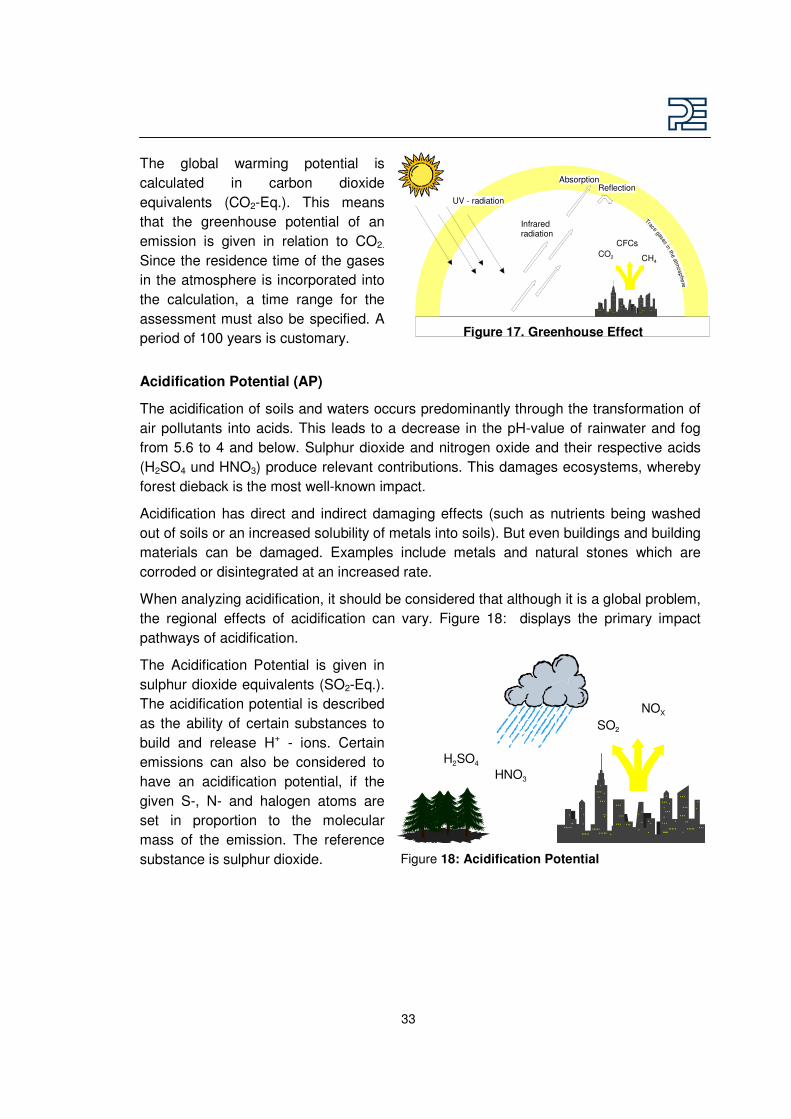
The global warming potential is
calculated in carbon dioxide
equivalents (CO2-Eq.). This means
that the greenhouse potential of an
emission is given in relation to CO2.
Since the residence time of the gases
in the atmosphere is incorporated into
the calculation, a time range for the
assessment must also be specified. A
period of 100 years is customary.
CO2 CH4
CFCs
UV - radiation
AbsorptionReflection
Infraredradiation
Trace gases in th
e a
tmosphe
re
Figure 17. Greenhouse Effect
Acidification Potential (AP)
The acidification of soils and waters occurs predominantly through the transformation of
air pollutants into acids. This leads to a decrease in the pH-value of rainwater and fog
from 5.6 to 4 and below. Sulphur dioxide and nitrogen oxide and their respective acids
(H2SO4 und HNO3) produce relevant contributions. This damages ecosystems, whereby
forest dieback is the most well-known impact.
Acidification has direct and indirect damaging effects (such as nutrients being washed
out of soils or an increased solubility of metals into soils). But even buildings and building
materials can be damaged. Examples include metals and natural stones which are
corroded or disintegrated at an increased rate.
When analyzing acidification, it should be considered that although it is a global problem,
the regional effects of acidification can vary. Figure 18: displays the primary impact
pathways of acidification.
The Acidification Potential is given in
sulphur dioxide equivalents (SO2-Eq.).
The acidification potential is described
as the ability of certain substances to
build and release H+ - ions. Certain
emissions can also be considered to
have an acidification potential, if the
given S-, N- and halogen atoms are
set in proportion to the molecular
mass of the emission. The reference
substance is sulphur dioxide.
SO2
NOX
H2SO44
HNO3
Figure 18: Acidification Potential
34
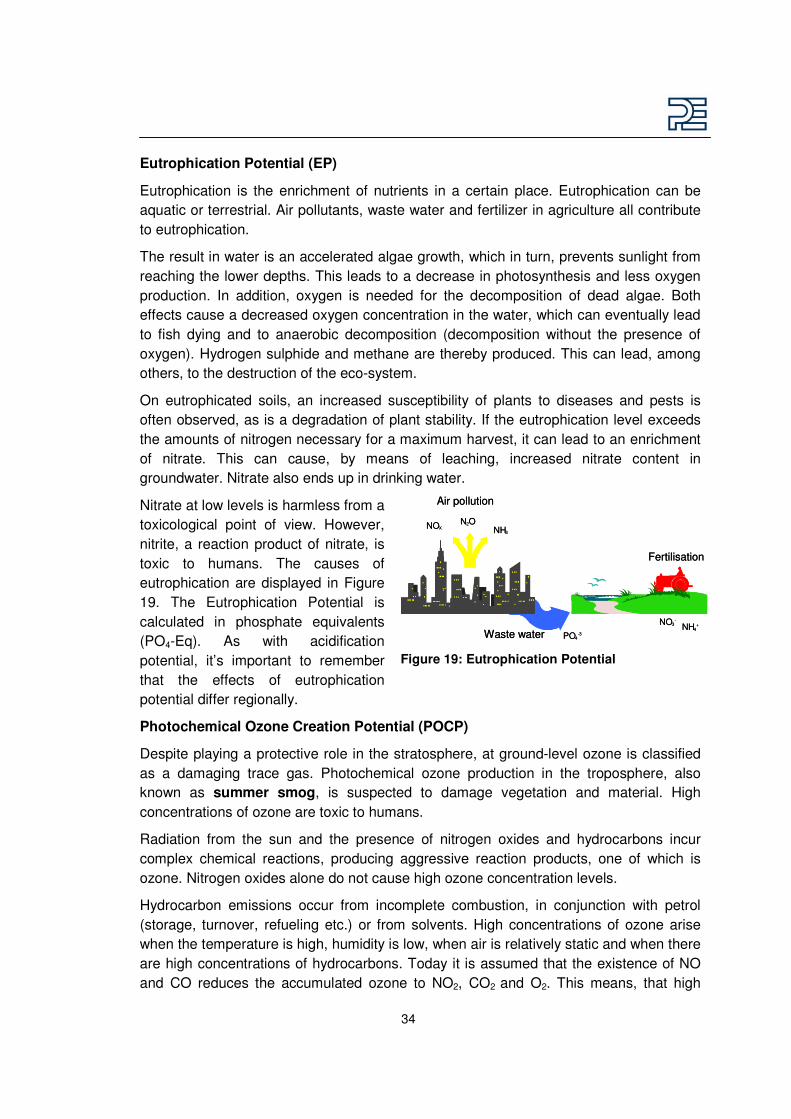
Eutrophication Potential (EP)
Eutrophication is the enrichment of nutrients in a certain place. Eutrophication can be
aquatic or terrestrial. Air pollutants, waste water and fertilizer in agriculture all contribute
to eutrophication.
The result in water is an accelerated algae growth, which in turn, prevents sunlight from
reaching the lower depths. This leads to a decrease in photosynthesis and less oxygen
production. In addition, oxygen is needed for the decomposition of dead algae. Both
effects cause a decreased oxygen concentration in the water, which can eventually lead
to fish dying and to anaerobic decomposition (decomposition without the presence of
oxygen). Hydrogen sulphide and methane are thereby produced. This can lead, among
others, to the destruction of the eco-system.
On eutrophicated soils, an increased susceptibility of plants to diseases and pests is
often observed, as is a degradation of plant stability. If the eutrophication level exceeds
the amounts of nitrogen necessary for a maximum harvest, it can lead to an enrichment
of nitrate. This can cause, by means of leaching, increased nitrate content in
groundwater. Nitrate also ends up in drinking water.
Nitrate at low levels is harmless from a
toxicological point of view. However,
nitrite, a reaction product of nitrate, is
toxic to humans. The causes of
eutrophication are displayed in Figure
19. The Eutrophication Potential is
calculated in phosphate equivalents
(PO4-Eq). As with acidification
potential, it’s important to remember
that the effects of eutrophication
potential differ regionally.
Waste water
Air pollution
Fertilisation
PO4-3
NO3-
NH4+
NOXN2O
NH3
Waste water
Air pollution
Fertilisation
PO4-3
NO3-
NH4+
NOXN2O
NH3
Figure 19: Eutrophication Potential
Photochemical Ozone Creation Potential (POCP)
Despite playing a protective role in the stratosphere, at ground-level ozone is classified
as a damaging trace gas. Photochemical ozone production in the troposphere, also
known as summer smog, is suspected to damage vegetation and material. High
concentrations of ozone are toxic to humans.
Radiation from the sun and the presence of nitrogen oxides and hydrocarbons incur
complex chemical reactions, producing aggressive reaction products, one of which is
ozone. Nitrogen oxides alone do not cause high ozone concentration levels.
Hydrocarbon emissions occur from incomplete combustion, in conjunction with petrol
(storage, turnover, refueling etc.) or from solvents. High concentrations of ozone arise
when the temperature is high, humidity is low, when air is relatively static and when there
are high concentrations of hydrocarbons. Today it is assumed that the existence of NO
and CO reduces the accumulated ozone to NO2, CO2 and O2. This means, that high
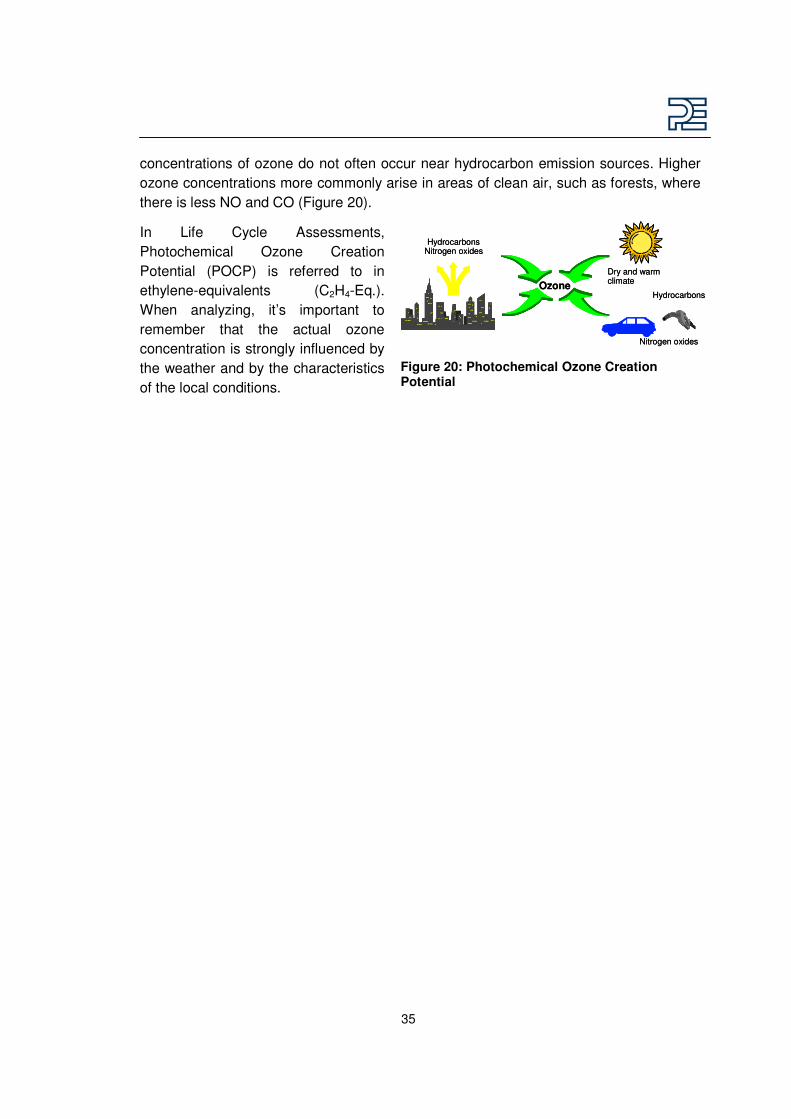
35
concentrations of ozone do not often occur near hydrocarbon emission sources. Higher
ozone concentrations more commonly arise in areas of clean air, such as forests, where
there is less NO and CO (Figure 20).
In Life Cycle Assessments,
Photochemical Ozone Creation
Potential (POCP) is referred to in
ethylene-equivalents (C2H4-Eq.).
When analyzing, it’s important to
remember that the actual ozone
concentration is strongly influenced by
the weather and by the characteristics
of the local conditions.
HydrocarbonsNitrogen oxides
Dry and warmclimate
Hydrocarbons
Nitrogen oxides
Ozone
HydrocarbonsNitrogen oxides
Dry and warmclimate
Hydrocarbons
Nitrogen oxides
Ozone
Figure 20: Photochemical Ozone Creation Potential
36
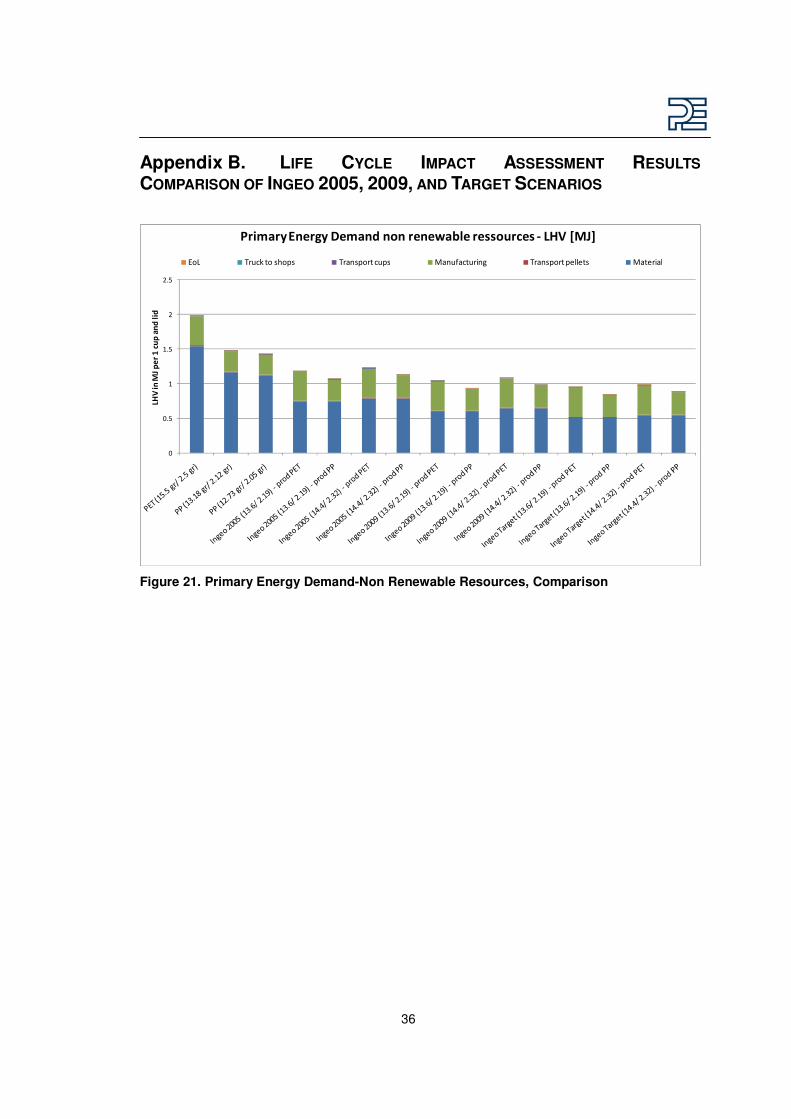
Appendix B. LIFE CYCLE IMPACT ASSESSMENT RESULTS
COMPARISON OF INGEO 2005, 2009, AND TARGET SCENARIOS
�
���
�
���
�
���
����������AB�C�DE�F������
�B��FB����AB����A�F�������BA�A�F��A�BA���EBDA��� ��������
�� ABCDE�F������� AB�����BF�DC�� ���C��DFCB��� AB�����BF������F� ��F�B���
Figure 21. Primary Energy Demand-Non Renewable Resources, Comparison

37
�
����
����
����
����
����
����
����
����
���
���
��� !"��#E�$%�AB�C�DE�F������
��"&&'(�)���F��*FB�������+A�+�F��,)*��C&&��AFB�-����� !"��#E�$%�
�� ABCDE�F������� AB�����BF�DC�� ���C��DFCB��� AB�����BF������F� ��F�B���
Figure 22. Global Warming Potential, Comparison
�
�������
������
�������
������
�������
������
�������
������
�������
������
���.!"��#E�$%�AB�C�DE�F������
��"&&'(�/D���0�DF+������+A�+�F��,/�-�����.!"��#E�$%�
�� ABCDE�F������� AB�����BF�DC�� ���C��DFCB��� AB�����BF������F� ��F�B���
Figure 23. Acidification Potential, Comparison
38
��������
��������
��������
��������
��������
��������
��������
��������
��������
��������
��������
����1��1F+A��#E�$%�AB�C�DE�F������
��"&&'(��E+B�1�DF+������+A�+�F��,��-������1��1F+A��#E�$%�
�� ABCDE�F������� AB�����BF�DC�� ���C��DFCB��� AB�����BF������F� ��F�B���
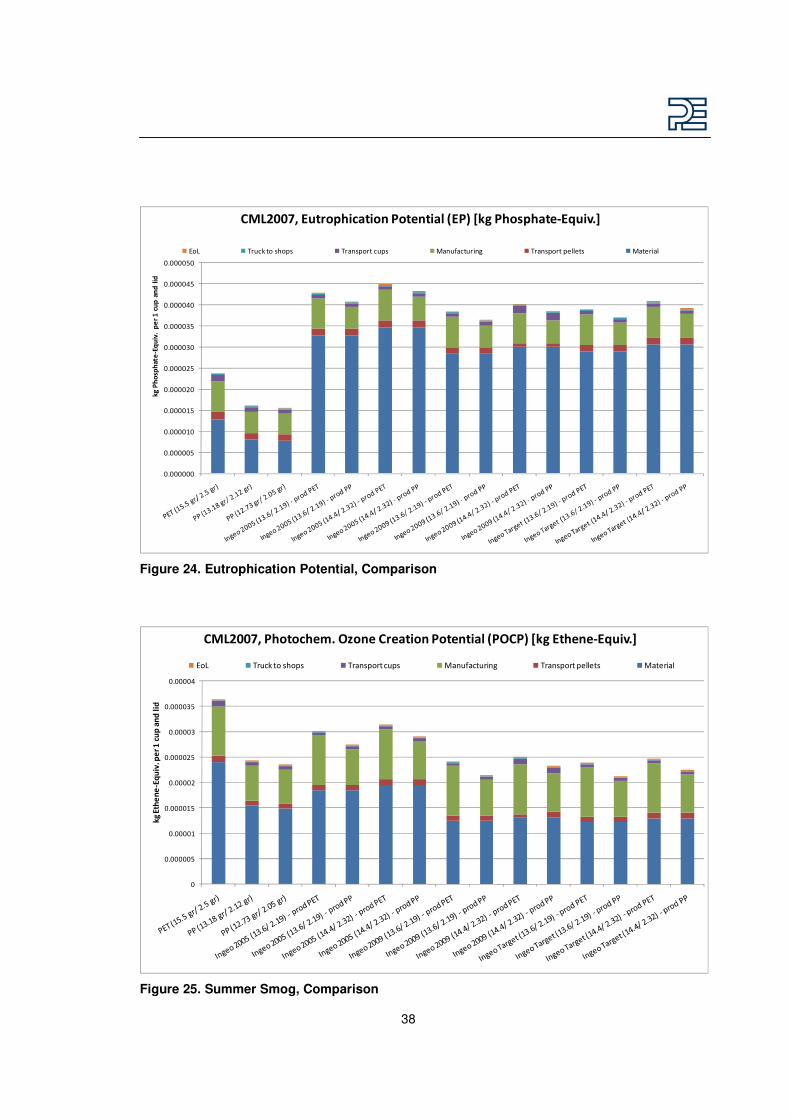
Figure 24. Eutrophication Potential, Comparison
�
��������
�������
��������
�������
��������
�������
��������
�������
����+1A�A��#E�$%�AB�C�DE�F������
��"&&'(��1�+�D1A�%�!2��A� BAF+������+A�+�F��,�! �-������+1A�A��#E�$%�
�� ABCDE�F������� AB�����BF�DC�� ���C��DFCB��� AB�����BF������F� ��F�B���
Figure 25. Summer Smog, Comparison
39
!���
�
���
���
���
���
���
���
���
���AB�C�DE�F������
*F+AB� ���E�+��������
�� ABCDE�F������� AB�����BF�DC�� ���C��DFCB��� AB�����BF������F� ��F�B���
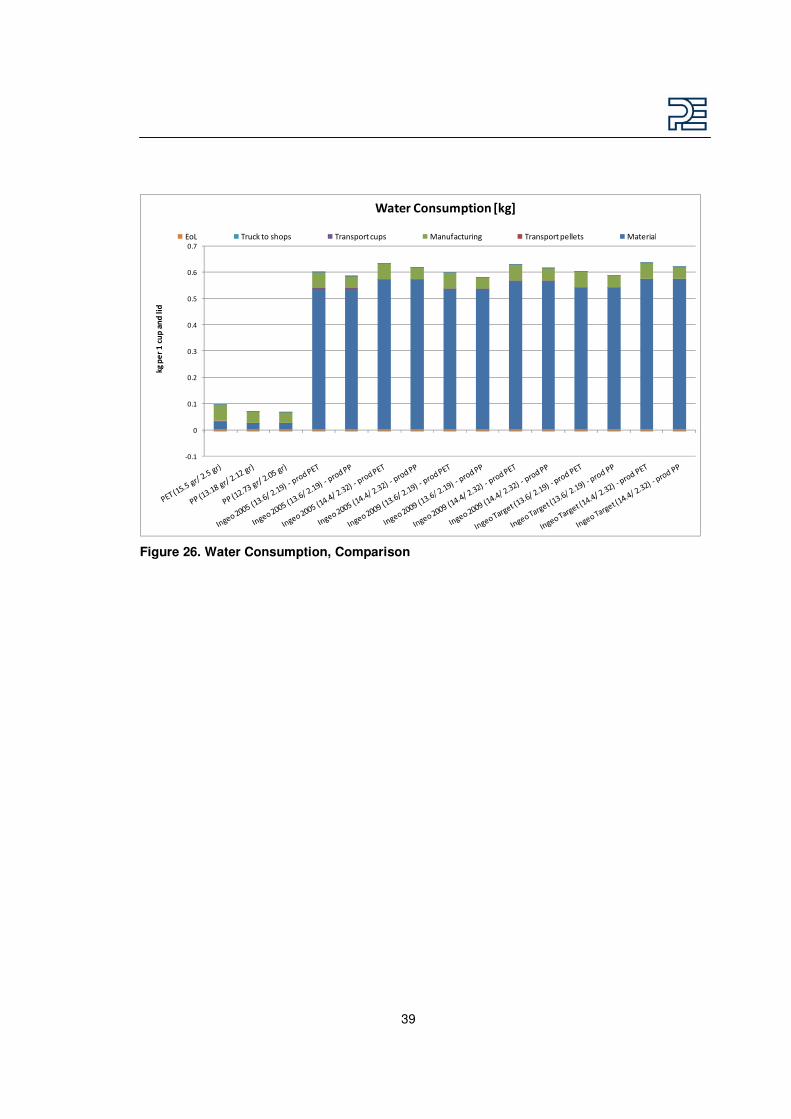
Figure 26. Water Consumption, Comparison
40
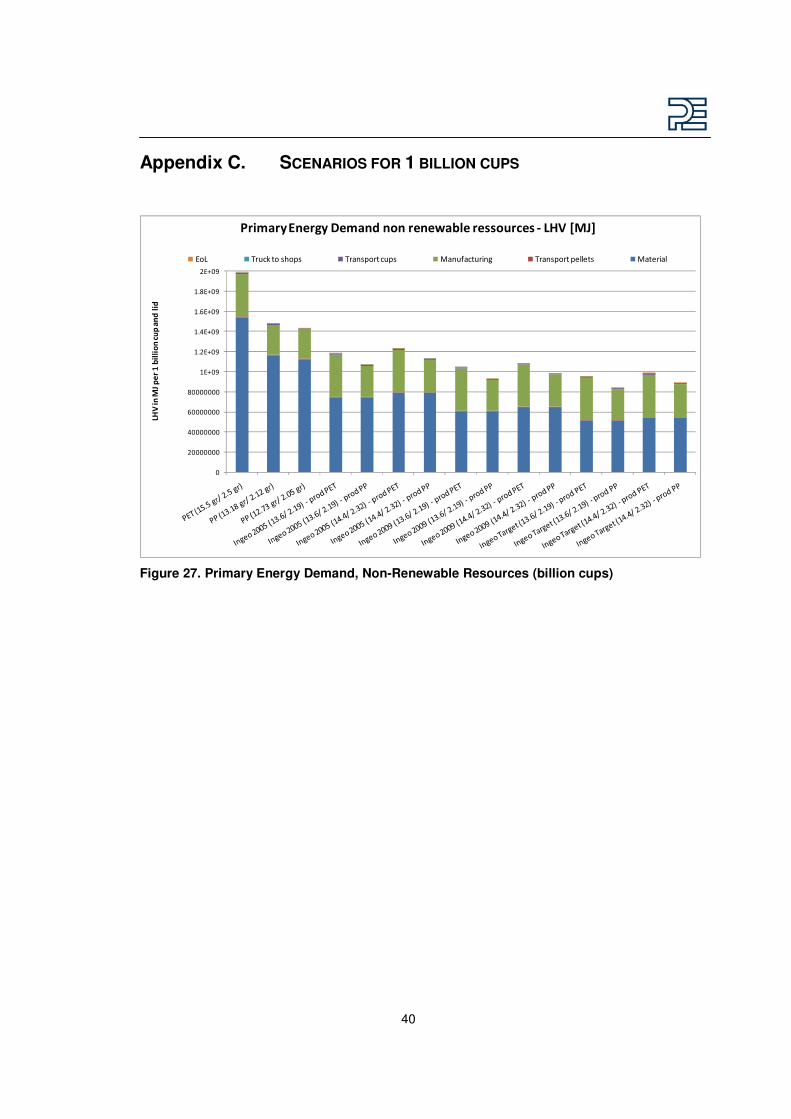
Appendix C. SCENARIOS FOR 1 BILLION CUPS
�
��������
��������
��������
��������
��"�
����"�
����"�
����"�
����"�
��"�
����������AB�C���������DE�F������
�B��FB����AB����A�F�������BA�A�F��A�BA���EBDA��� ��������
�� ABCDE�F������� AB�����BF�DC�� ���C��DFCB��� AB�����BF������F� ��F�B���
Figure 27. Primary Energy Demand, Non-Renewable Resources (billion cups)
41
�
��������
��������
��������
��������
��������
��������
��������
��������
�������
��������
��� !"��#E�$%�AB�C���������DE�F������
��"&&'(�)���F��*FB�������+A�+�F��,)*��C&&��AFB�-����� !"��#E�$%�
�� ABCDE�F������� AB�����BF�DC�� ���C��DFCB��� AB�����BF������F� ��F�B���
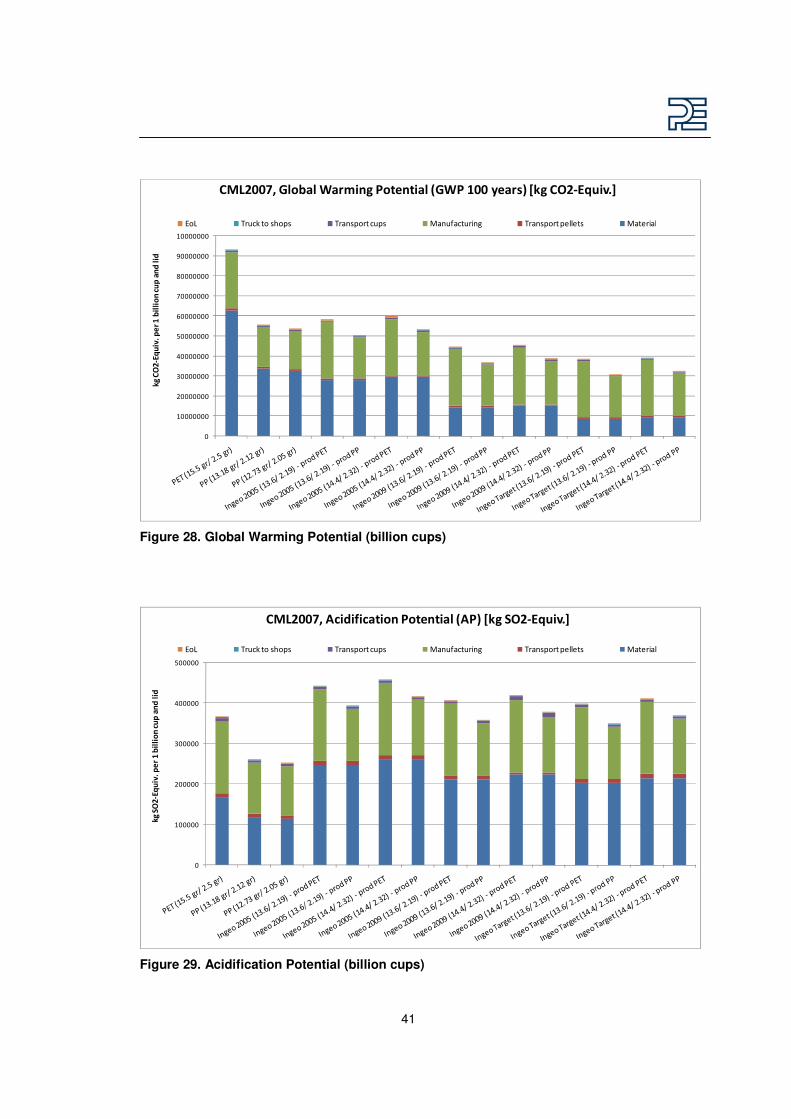
Figure 28. Global Warming Potential (billion cups)
�
������
������
������
������
������
���.!"��#E�$%�AB�C���������DE�F������
��"&&'(�/D���0�DF+������+A�+�F��,/�-�����.!"��#E�$%�
�� ABCDE�F������� AB�����BF�DC�� ���C��DFCB��� AB�����BF������F� ��F�B���
Figure 29. Acidification Potential (billion cups)

42
Eutrophication Potential
�
�����
�����
�����
�����
�����
����1��1F+A��#E�$%�AB�C���������DE�F������
��"&&'(��E+B�1�DF+������+A�+�F��,��-������1��1F+A��#E�$%�
�� ABCDE�F������� AB�����BF�DC�� ���C��DFCB��� AB�����BF������F� ��F�B���
Figure 30. Eutrophication Potential (billion cups)
�
����
�����
�����
�����
�����
�����
�����
�����
����+1A�A��#E�$%�AB�C���������DE�F������
��"&&'(��1�+�D1A�%�!2��A� BAF+������+A�+�F��,�! �-������+1A�A��#E�$%�
�� ABCDE�F������� AB�����BF�DC�� ���C��DFCB��� AB�����BF������F� ��F�B���
Figure 31. Ozone Creation Potential (billion cups)
43
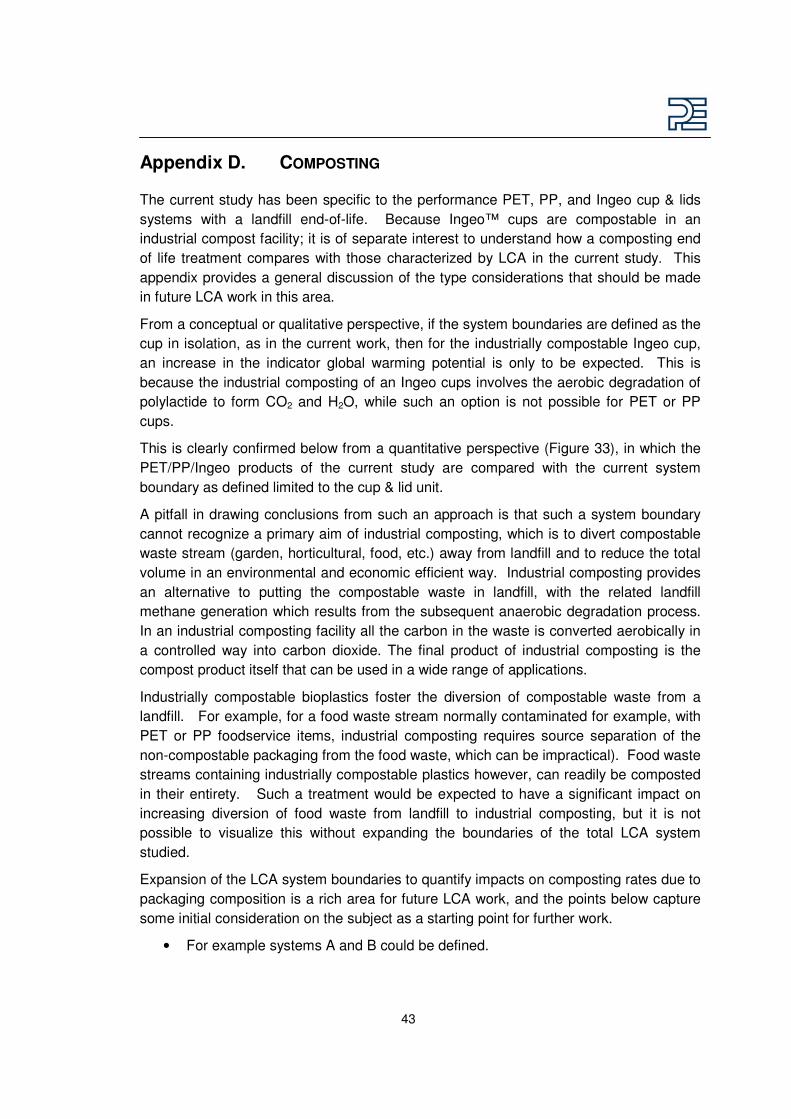
Appendix D. COMPOSTING
The current study has been specific to the performance PET, PP, and Ingeo cup & lids
systems with a landfill end-of-life. Because Ingeo™ cups are compostable in an
industrial compost facility; it is of separate interest to understand how a composting end
of life treatment compares with those characterized by LCA in the current study. This
appendix provides a general discussion of the type considerations that should be made
in future LCA work in this area.
From a conceptual or qualitative perspective, if the system boundaries are defined as the
cup in isolation, as in the current work, then for the industrially compostable Ingeo cup,
an increase in the indicator global warming potential is only to be expected. This is
because the industrial composting of an Ingeo cups involves the aerobic degradation of
polylactide to form CO2 and H2O, while such an option is not possible for PET or PP
cups.
This is clearly confirmed below from a quantitative perspective (Figure 33), in which the
PET/PP/Ingeo products of the current study are compared with the current system
boundary as defined limited to the cup & lid unit.
A pitfall in drawing conclusions from such an approach is that such a system boundary
cannot recognize a primary aim of industrial composting, which is to divert compostable
waste stream (garden, horticultural, food, etc.) away from landfill and to reduce the total
volume in an environmental and economic efficient way. Industrial composting provides
an alternative to putting the compostable waste in landfill, with the related landfill
methane generation which results from the subsequent anaerobic degradation process.
In an industrial composting facility all the carbon in the waste is converted aerobically in
a controlled way into carbon dioxide. The final product of industrial composting is the
compost product itself that can be used in a wide range of applications.
Industrially compostable bioplastics foster the diversion of compostable waste from a
landfill. For example, for a food waste stream normally contaminated for example, with
PET or PP foodservice items, industrial composting requires source separation of the
non-compostable packaging from the food waste, which can be impractical). Food waste
streams containing industrially compostable plastics however, can readily be composted
in their entirety. Such a treatment would be expected to have a significant impact on
increasing diversion of food waste from landfill to industrial composting, but it is not
possible to visualize this without expanding the boundaries of the total LCA system
studied.
Expansion of the LCA system boundaries to quantify impacts on composting rates due to
packaging composition is a rich area for future LCA work, and the points below capture
some initial consideration on the subject as a starting point for further work.
• For example systems A and B could be defined.

44
o System A consisting of PET/PP clamshell packaging mixed with food
waste which go to landfill. The food waste part is easily degradable and
can generate methane, its fate depending on landfill design and
operation.
o System B consists of industrially compostable clamshell packaging mixed
with the same food waste which go to composting. Now the industrial
compostable cups and the food waste are both converted into CO2 and
compost.
• Under the assumption that System B would increase diversion of food wastes
from landfill to industrial composting, the system boundary should be such that
there is a rigorous accounting of any environmental impacts associated with the
application of finished compost. These could include for example:
o Maintenance of soil fertility by increasing the soil carbon content and
improving the soil structure
o Reduced soil erosion and runoff emissions
o Weed suppression and reduces herbicide requirements
o Reduced irrigation requirement via compost use in landscaping (bicycle
paths and parks, etc)
o Improved water infiltration and water retention resulting in a better and
longer accessibility of plants to nutrients (potentially increased fertilizer
effectiveness and reduced fertilizer need)
• In some markets, an alternative for compost is peat, and therefore a credit could
be given for the avoided peat production.
Quantitative treatment with system boundary limited to the cup & lid:
As an illustration of the considerations above, the influence of industrially composting
Ingeo on the environmental performance of 16-ounce cold drinking cups and lids made
from Ingeo has been quantified based on the system boundary of the current study.
Industrial composting is included based on a study commissioned by NatureWorks on
composting systems as applied in Germany, see process flow diagram Figure 32.
Information on the following unit processes will be provided for composting:
- Processing/ conditioning (mainly crushing),
- Industrial composting and
- After industrial composting (the final process in the composting).
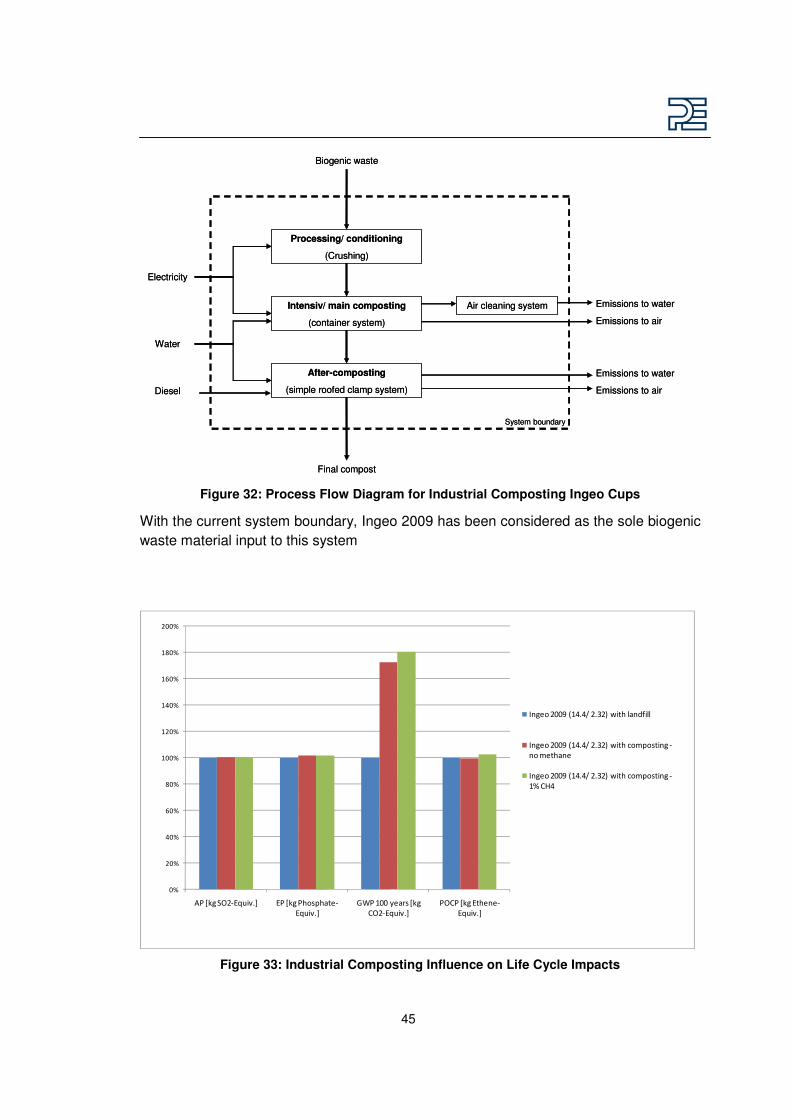
45
Intensiv/ main composting
(container system)
Processing/ conditioning
(Crushing)
After-composting
(simple roofed clamp system)
Air cleaning system
Biogenic waste
Final compost
Electricity
Water
Diesel
Emissions to water
Emissions to air
Emissions to water
Emissions to air
System boundary
Intensiv/ main composting
(container system)
Processing/ conditioning
(Crushing)
After-composting
(simple roofed clamp system)
Air cleaning system
Biogenic waste
Final compost
Electricity
Water
Diesel
Emissions to water
Emissions to air
Emissions to water
Emissions to air
System boundary
Figure 32: Process Flow Diagram for Industrial Composting Ingeo Cups
With the current system boundary, Ingeo 2009 has been considered as the sole biogenic
waste material input to this system
�#
��#
��#
��#
��#
���#
���#
���#
���#
���#
���#
$%�&E��'(�!�)C�*�+ �%�&E��%������F�!
�)C�*�+
,-%�����.��B��&E��
/(�!�)C�*�+
%(/%�&E���F����!
�)C�*�+
0�������� �1����2�����3�4�F�����5����
0�������� �1����2�����3�4�F��D�6���F����!
���6�F����
0�������� �1����2�����3�4�F��D�6���F����!
�#�/7�
Figure 33: Industrial Composting Influence on Life Cycle Impacts
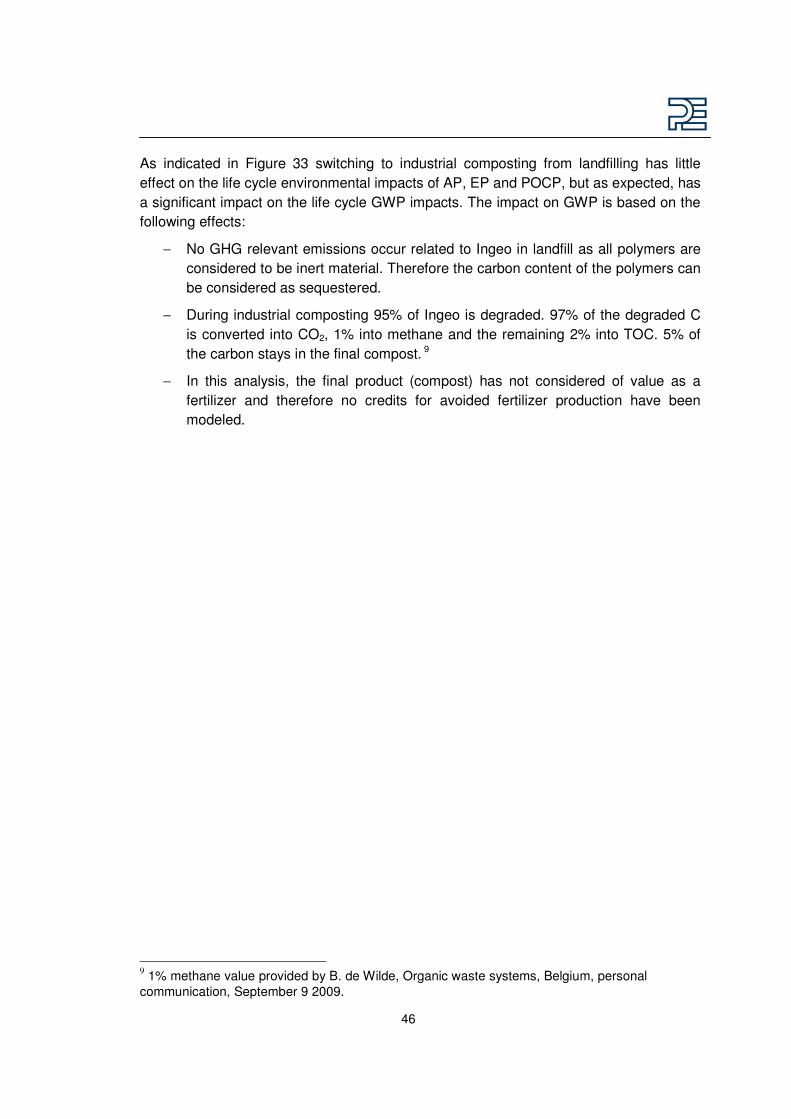
46
As indicated in Figure 33 switching to industrial composting from landfilling has little
effect on the life cycle environmental impacts of AP, EP and POCP, but as expected, has
a significant impact on the life cycle GWP impacts. The impact on GWP is based on the
following effects:
− No GHG relevant emissions occur related to Ingeo in landfill as all polymers are
considered to be inert material. Therefore the carbon content of the polymers can
be considered as sequestered.
− During industrial composting 95% of Ingeo is degraded. 97% of the degraded C
is converted into CO2, 1% into methane and the remaining 2% into TOC. 5% of
the carbon stays in the final compost. 9
− In this analysis, the final product (compost) has not considered of value as a
fertilizer and therefore no credits for avoided fertilizer production have been
modeled.
9 1% methane value provided by B. de Wilde, Organic waste systems, Belgium, personal
communication, September 9 2009.

47
Appendix E. COMPARISON OF INGEO 2009 SCENARIOS WITH
COMPOSTING TO PET AND PP
Figure 34: Comparison of Life Cycles across Impacts
Figure 34 shows the relative comparison of the impacts when focusing in the Ingeo
2009, PET and PP scenarios. The current scenario of the use of PET is set to 100% and
all other scenarios are being compared to it. The PET and PP scenarios are assumed to
be landfilled; the Ingeo 2009 scenarios are assumed to be industrially composted with
assumptions around TOC, CH4 etc., as described above.
As seen in the figure, Ingeo 2009 with industrial composting has lower impacts than PET
for Global Warming Potential, Smog Creation, and Primary Non Renewable Energy
Demand. The reduction in Global Warming Potential is caused by the lower Primary
Non Renewable Energy Demand and the take up of carbon dioxide during corn growing
which is finally harnessed into the Ingeo polymer backbone.
Compared to PET, Ingeo 2009 has equivalent emissions for Acidification Potential and
much higher releases for Eutrophication Potential.

48
PP has lower impacts than the PET for all categories expect for the Primary Energy
Demand. The Global Warming Potential is lower than that of the Ingeo even though the
Primary Energy Demand is higher due to the fact that the PP is assumed to be in an inert
landfill while the Ingeo is industrially composted and therefore releasing its carbon
content.
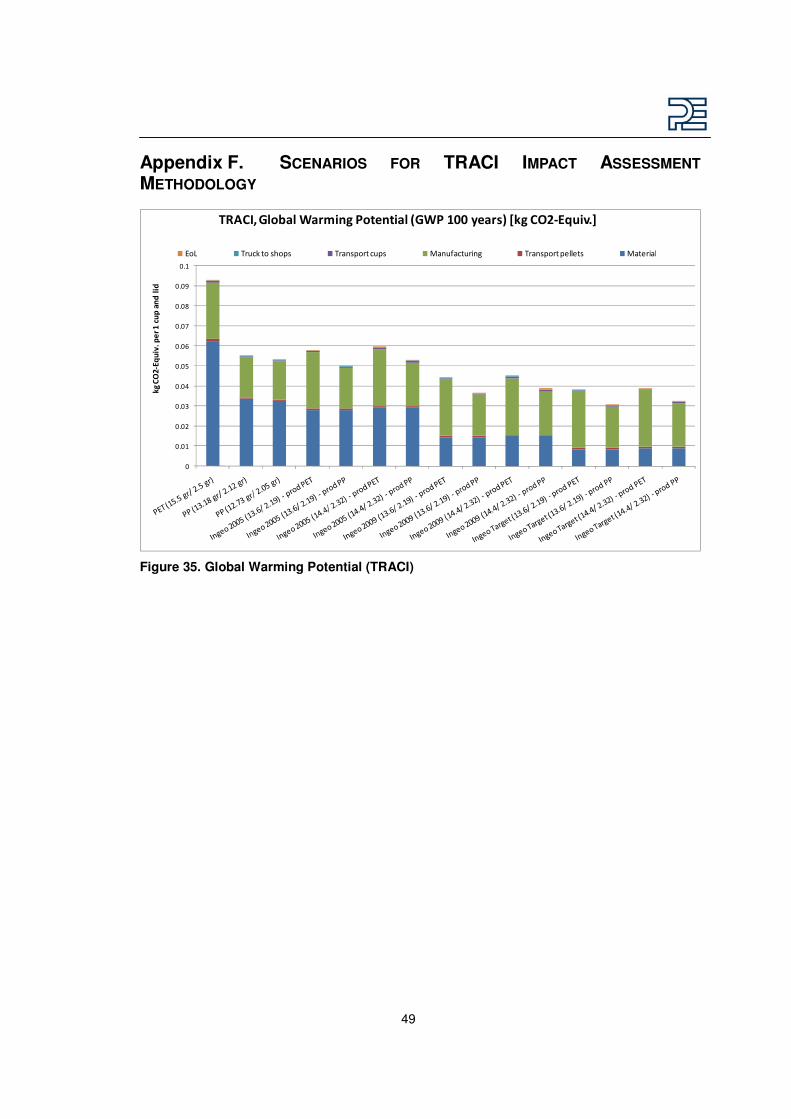
49
Appendix F. SCENARIOS FOR TRACI IMPACT ASSESSMENT
METHODOLOGY
�
����
����
����
����
����
����
����
����
���
���
��� !"��#E�$%�AB�C�DE�F������
34/ 5(�)���F��*FB�������+A�+�F��,)*��C&&��AFB�-����� !"��#E�$%�
�� ABCDE�F������� AB�����BF�DC�� ���C��DFCB��� AB�����BF������F� ��F�B���
Figure 35. Global Warming Potential (TRACI)
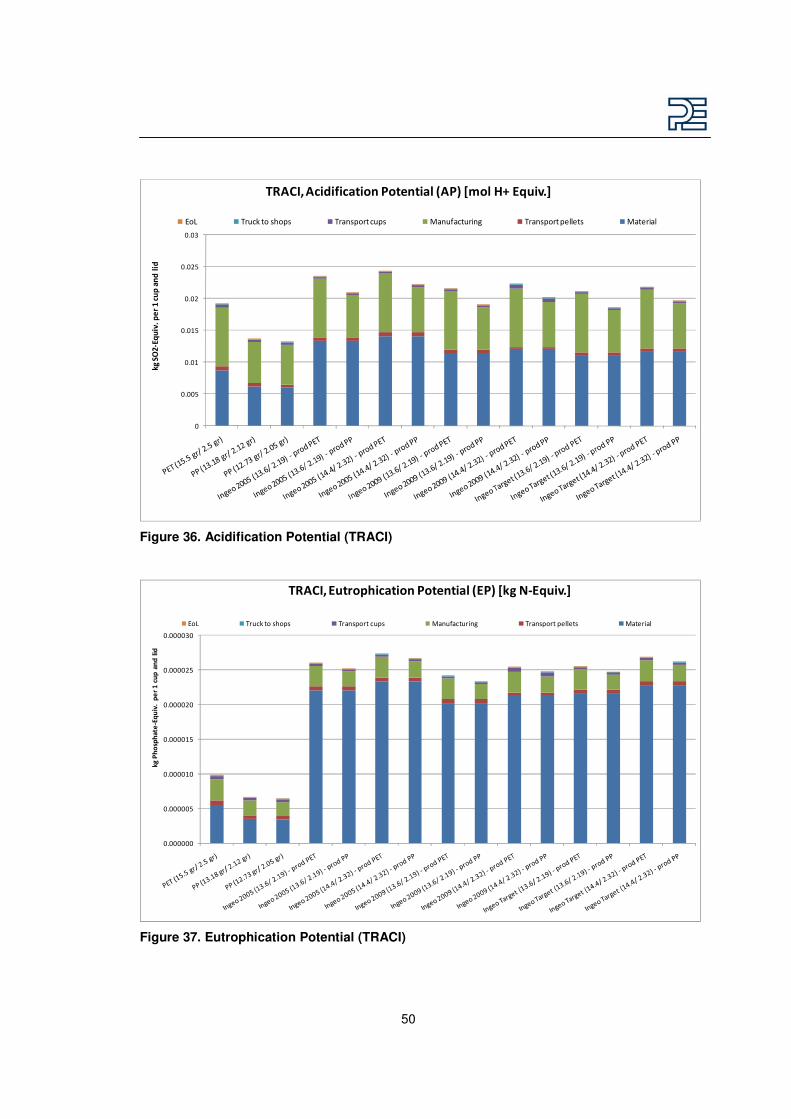
50
�
�����
����
�����
����
�����
����
���.!"��#E�$%�AB�C�DE�F������
34/ 5(�/D���0�DF+������+A�+�F��,/�-�������6��#E�$%�
�� ABCDE�F������� AB�����BF�DC�� ���C��DFCB��� AB�����BF������F� ��F�B���
Figure 36. Acidification Potential (TRACI)
��������
��������
��������
��������
��������
��������
��������
����1��1F+A��#E�$%�AB�C�DE�F������
34/ 5(��E+B�1�DF+������+A�+�F��,��-�����7��#E�$%�
�� ABCDE�F������� AB�����BF�DC�� ���C��DFCB��� AB�����BF������F� ��F�B���
Figure 37. Eutrophication Potential (TRACI)

51
�
��!�
��!�
��!�
��!�
��!�
��!�
����+1A�A��#E�$%�AB�C�DE�F������
34/ 5(�.���� BAF+������+A�+�F������7!8��#E�$%�
�� ABCDE�F������� AB�����BF�DC�� ���C��DFCB��� AB�����BF������F� ��F�B���
Figure 38. Smog Creation Potential (TRACI)
52
REFERENCES
CML An operational guide to the ISO-standards (Guinée et al.) Centre for Milieukunde
(CML), Leiden 2001.
Composting Giegrich, J.;Kroger, K.; Vogt, R.; Mohler, S. Waste Management Routes for PS, PET and PLA in Germany. Heidelberg, March 2000, updated March 2002.
GaBi Software GaBi software and data base for Life Cycle Engineering, PE International GmbH www gabi-software.com
ISO 2006a ISO 14040:2006, Environmental management - Life cycle assessment - Principles and framework, International Organization for Standardization (ISO), Geneva
ISO 2006b ISO 14044:2006, Environmental management - Life cycle assessment - Requirements and guidelines, International Organization for Standardization (ISO), Geneva. Available at www iso.ch
TRACI Bare et al., TRACI: the Tool for the Reduction and Assessment of Chemical and
Other Environmental Impacts JIE, MIT Press, 2002.
Vink 2007 Erwin T.H. Vink, David A. Glassner, Jeffrey J. Kolstad, Robert J. Wooley, Ryan P.
O’Connor “The eco-profiles for current and near-future NatureWorks® polylactide
(PLA) production” (Spring 2007). More information can be found on
NatureWorks® web site: http://www.natureworksllc.com/our-values-and-
views/life-cycle-assessment.aspx

53
CRITICAL REVIEW STATEMENT
Review Team┺ Comparative LCA of )ngeol biopolymer┸ PET┸ and PP Drinking Cups Joyce Cooper┸ University of Washington ゅcooperjshu┻washington┻eduょ Robert Anex┸ )owa State University ゅrpanexhiastate┻eduょ Eric Brody┸ Shift Advantage ゅeric┻brodyhshiftadvantage┻comょ Bryan Lembke┸ The Quaker Oats Company ゅbryanelembkehquakeroats┻comょ Martha Stevenson┸ GreenBlue ゅmartha┻j┻stevensonhgmail┻comょ March 8, 2010 RE: Review of Comparative Life Cycle Assessment Ingeo™ biopolymer, PET, and PP Drinking Cups for Starbucks Coffee Company (Seattle, WA) & NatureWorks LLC by PE Americas (Boston, MA)
Having reviewed Comparative Life Cycle Assessment Ingeo™ biopolymer, PET, and PP Drinking Cups prepared for the Starbucks Coffee Company and NatureWorks by PE Americas, we find that the methodology, the documentation, and the process used are in accordance with the ISO 14040 requirements and provide results ready for public dissemination. This conclusion is the result of a review process which began in August 2008. The review process was iterative, in which the review team was provided preliminary documentation for comment, the review team met (by conference call) with PE Americas staff to discuss the methodology and underlying data, and PE Americas staff in turn responded, resulting in the final LCA documentation. Issues resolved included an update of the PLA production technology data, the consideration and treatment of offsets, and the use of PP as a comparative system.
Please feel free to contact our team with any questions.
Best Regards,
Joyce Cooper, University of Washington ([email protected]) on behalf of the team which also includes Robert Anex, Iowa State University ([email protected]) Eric Brody, Shift Advantage ([email protected]) Bryan Lembke, The Quaker Oats Company ([email protected]) Martha Stevenson, GreenBlue ([email protected])