comparative assessment of genotyping methods for ... · box-pcr fingerprinting can be considered a...
TRANSCRIPT

JOURNAL OF CLINICAL MICROBIOLOGY, Sept. 2002, p. 3300–3307 Vol. 40, No. 90095-1137/02/$04.00�0 DOI: 10.1128/JCM.40.9.3300–3307.2002Copyright © 2002, American Society for Microbiology. All Rights Reserved.
Comparative Assessment of Genotyping Methods for EpidemiologicStudy of Burkholderia cepacia Genomovar III
Tom Coenye, Theodore Spilker, Alissa Martin, and John J. LiPuma*Department of Pediatrics and Communicable Diseases, University of Michigan Medical School,
Ann Arbor, Michigan 48109-0646
Received 15 May 2002/Returned for modification 21 June 2002/Accepted 30 June 2002
We analyzed a collection of 97 well-characterized Burkholderia cepacia genomovar III isolates to evaluatemultiple genomic typing systems, including pulsed-field gel electrophoresis (PFGE), BOX-PCR fingerprintingand random amplified polymorphic DNA (RAPD) typing. The typeability, reproducibility, and discriminatorypower of these techniques were evaluated, and the results were compared to each other and to data obtainedin previous studies by using multilocus restriction typing (MLRT). All methods showed excellent typeability.PFGE with SpeI was more reproducible than RAPD and BOX-PCR fingerprinting. The discriminatory powerof the methods was variable, with PFGE and RAPD typing having a higher index of discrimination thanBOX-PCR fingerprinting. In general, the results obtained by PFGE, BOX-PCR fingerprinting, and MLRT werein good agreement. Our data indicate that different genomic-based methods can be used to type B. cepaciagenomovar III isolates depending on the situation and the epidemiologic question being addressed. PFGE andRAPD fingerprinting are best suited to addressing small-scale studies (i.e., local epidemiology), whereasBOX-PCR fingerprinting is more appropriate for large-scale studies (i.e., global epidemiology). In this regard,BOX-PCR fingerprinting can be considered a rapid and easy alternative to MLRT.
Cystic fibrosis (CF) is the most common hereditary diseasein Caucasian populations. Clinical manifestations of CF resultfrom a disturbance in electrolyte transport that primarily af-fects the respiratory and digestive systems. The CF lung isparticularly susceptible to infection with a variety of opportu-nistic bacteria (9, 14), and exacerbations of chronic infectioncause significant morbidity and mortality (36). Among the bac-terial species capable of causing infection in CF are thosebelonging to the Burkholderia cepacia complex, which is cur-rently comprised of nine closely related genomic species orgenomovars (11, 21, 45). Recent work has demonstrated thatthe majority of infected CF patients harbor either B. cepaciagenomovar III or Burkholderia multivorans (genomovar II) (1,25, 38). Furthermore, limited data suggest that B. cepaciagenomovar III (or perhaps certain specific strains within geno-movar III) may be relatively more virulent than other speciesin this complex (3, 12, 19).
The broad-spectrum antimicrobial resistance, absence of avaccine, and virulence of certain strains have made preventionof B. cepacia complex infection an important goal in CF patientcare (21, 22). However, much still remains unknown regardingthe epidemiology of infection in CF. A number of previousstudies have demonstrated transmission of B. cepacia complexstrains between persons with CF (for reviews, see references15, 16, 21, and 22). More recent studies indicate that thenatural environment is also a likely reservoir for acquisition ofB. cepacia complex strains (4, 24). Better risk assessment ofpotential sources of infection and the development of optimalinfection control policies rely on a more complete understand-
ing of the molecular epidemiology of B. cepacia complex in-fection in CF.
A number of methods have been used to establish relation-ships between B. cepacia complex isolates, including pheno-typic assays, such as serotyping, antimicrobial susceptibilitytyping, bacteriocin typing, and biotyping (33, 34). In recentyears, phenotypic methods have been largely replaced by ge-notypic methods, including macrorestriction digestion of chro-mosomal DNA followed by pulsed-field gel electrophoresis(PFGE) and various PCR-based fingerprinting techniques (2,31, 43, 44, 48). Among these, PFGE is generally considered the“gold standard” in bacteriological typing (2, 31, 40), and anumber of studies have applied PFGE in studies assessing B.cepacia complex epidemiology (1, 7, 10, 37, 46). PCR-basedfingerprinting with short random primers (31, 32, 42) or prim-ers directed against repetitive sequences in the bacterial ge-nome (31, 35, 42, 48) are also increasingly being used for typingB. cepacia complex organisms (5, 7, 26, 28–30, 37). Recently,we introduced multilocus restriction typing (MLRT) as yetanother method for genotyping B. cepacia complex (10). InMLRT, genomic diversity is indexed through restriction frag-ment length polymorphism analysis of several housekeepinggenes. MLRT is particularly well suited to studies analyzing B.cepacia complex isolates collected in large-scale epidemiologicstudies (10).
In the present study, we compared results obtained withPFGE and repetitive sequence PCR by using a BOX A1Rprimer (BOX-PCR fingerprinting) for a set of 97 epidemiolog-ically well-characterized B. cepacia genomovar III isolates. Asubset of these 97 isolates was also analyzed by using randomamplified polymorphic DNA (RAPD) typing. Typeability, re-producibility, and discriminatory power of all techniques werecompared to each other and to MLRT data obtained in pre-vious studies.
* Corresponding author. Mailing address: Department of Pediatricsand Communicable Diseases, 8323 MSRB III, Box 0646, 1150 W. Med.Center Dr., Ann Arbor, MI 48109-0646. Phone: (734) 936-9767. Fax:(734) 764-4279. E-mail: [email protected].
3300

MATERIALS AND METHODS
Bacterial strains, growth conditions, and species identification. Isolates wereobtained from the B. cepacia Research Laboratory and Repository (University ofMichigan, Ann Arbor, Mich.) (Table 1) and had been identified as B. cepaciagenomovar III by using ribosomal DNA (rDNA)- and recA-based PCR assays, aspreviously described (23, 27). Approximately two-thirds (n � 66) were recoveredfrom CF sputum culture from persons receiving care in 23 CF treatment centersthroughout North America; the rest of the isolates were recovered from soil. Allhad been typed previously by one or more genotyping methods, including PFGEor MLRT (10). Several clusters of isolates from patients receiving care in thesame geographic region were included in this set. Isolates from frozen stockswere grown aerobically on Mueller-Hinton broth (Becton Dickinson) supple-mented with 2.2% (wt/vol) agar and incubated overnight at 32°C.
Macrorestriction digest and pulsed field gel electrophoresis. Single bacterialcolonies were removed from an agar plate, suspended in 1 ml of SE buffer (75mM NaCl, 25 mM EDTA [pH 7.4]), pelleted by centrifugation at 4,300 � g for3 min, washed 3 times in 1 ml of SE buffer, and resuspended in 0.5 ml of SEbuffer. The optical density at 620 nm was adjusted to approximately 1.0. Twohundred microliters of the cell suspension was homogenized with 200 �l of 2%low-melting-temperature agarose (Sigma, St Louis, Mo.) in 0.5� TBE buffer (45mM Tris-borate, 1 mM EDTA) and poured into a plug mold. After 15 min at4°C, agarose plugs were placed in 10 ml of PEN buffer (1.0% N-lauryl sarcosine,500 mM EDTA [pH 9.6]) containing 1 mg of protease ml�1. After incubation at37°C in a rocking incubator for 12 to 18 h, plugs were washed four times for 1 hper wash with 1� TE buffer (10 mM Tris-HCl, 1 mM EDTA [pH 8.0]). Two-millimeter-wide plug sections were cut and incubated for 4 h with 5 U of SpeI(Promega, Madison, Wis.) in 115 �l of digestion buffer. DNA fragments wereseparated in 1% PFGE-certified agarose (Bio-Rad, Hercules, Calif.) by using aCHEF DRIII system (Bio-Rad). Plugs containing digested DNA of B. cepaciastrain AU2725 were included on each gel to allow intra- and intergel normal-ization. A current of 5.0 V/cm was applied for 25 h, with pulse times of 30 to 70 s(linear ramping). Gels were stained with ethidium bromide and visualized withUV illumination. Gel images were digitized using a GelDoc2000 gel analyzer(Bio-Rad) and stored as TIF files. Digitized images were converted, normalizedwith the reference lanes (containing DNA from strain AU2725), and analyzed byusing Molecular Analyst Fingerprinting Plus software (Bio-Rad). The rollingdisk background subtraction method was applied, and similarity matrices ofdensitometric curves of the gel tracks (the first 16% and last 7.5% of data pointswere excluded from the analysis) were calculated by using Pearson’s product-moment correlation coefficient. Cluster analyses of similarity matrices were per-formed by the unweighted pair group method with arithmetic averages (UP-GMA).
BOX-PCR fingerprinting. DNA from each isolate was prepared by heatingone colony at 95°C for 15 min in 20 �l of lysis buffer containing 0.25% (wt/vol)sodium dodecyl sulfate (SDS) and 0.05 M NaOH. Following lysis, 180 �l ofdistilled water was added, and the DNA solutions were stored at 4°C. Rep-PCRtyping with a BOX-A1R primer (5�-CTACGGCAAGGCGACGCTGACG-3�)(BOX-PCR fingerprinting) was carried out as described previously (35). Briefly,2 �l of DNA solution was mixed with 2 U of Taq polymerase (Gibco BRL,Gaithersburg, Md.), 1.25 �l of 25 mM (each) of deoxynucleotide triphosphate(Gibco BRL), 2.5 �l of dimethyl sulfoxide (DMSO), 0.4 �l of bovine serumalbumin (20 mg ml�1) (Promega), 5 �l of 5� Gitschier buffer and 1 �l of primer(0.3 �g �l�1) in a final volume of 25 �l. Amplification was carried out with aPTC-100 programmable thermal cycler (MJ Research, Incline Village, Nev.).After initial denaturation for 2 min at 95°C, 35 amplification cycles were com-pleted, each consisting of 3 s at 94°C, 30 s at 92°C, 1 min at 50°C, and 8 min at65°C. A final extension of 8 min at 65°C was applied. PCR products wereseparated on 25-cm-long 1.5% agarose gels in 0.5� TBE buffer (60 mA for 4 hat room temperature). A 1-kb molecular weight marker (Gibco) was used mul-tiple times on each gel to allow normalization. Following staining with ethidiumbromide and visualization by UV illumination, gels were analyzed as describedabove for PFGE (the first 12.5% and last 8.5% of data points were excluded fromthe analysis).
RAPD typing. DNA was prepared as described above for BOX-PCR. RAPDfingerprinting was performed with primer RAPD-270 (5�-TGCGCGCGGG-3�)as described previously (7, 28). Briefly, 2 �l of DNA solution was mixed with 1U of Taq polymerase (Gibco BRL, Gaithersburg, Md.), 2.5 �l of 2.5 mM (each)deoxynucleotide triphosphates (Gibco BRL), 0.7 �l of bovine serum albumin (20mg ml�1) (Promega), 2.5 �l of 10� buffer (100 mM Tris-HCl [pH 8.0], 0.5 MKCl, 30 mM MgCl2, 1.0% gelatin), and 0.4 �l of primer (100 pmol �l�1) in a finalvolume of 25 �l. Amplification was carried out with a RapidCycler programma-ble thermal cycler (Idaho Tech, Idaho Falls, Idaho). The first four amplification
cycles were each for 1 min at 94°C, 1 min at 36°C, and 2.5 min at 72°C. Thefollowing 29 cycles were 30 s at 94°C, 30 s at 36°C, and 75 s at 72°C. A finalextension of 2 min at 72°C was applied. Numerical analysis was performed asdescribed above for PFGE (the first 15.75% of data points were excluded fromthe analysis).
Statistical analyses. Two-tailed unpaired t tests were used to compare repro-ducibility among replicate assays within a given typing method and were calcu-lated by using GraphPad Prism 3.00 (GraphPad Software, San Diego, Calif.).Discriminatory index (DI) is the probability that two isolates randomly chosenfrom a population of unrelated isolates will be distinguished by a given typingmethod within the confines of a specific cutoff value. DI is determined by thenumber and relative frequencies of the different types defined by a given methodand is calculated by using Simpson’s index of diversity (17) as follows:
DI � 1 � 1/[N�N � 1�]�nj (nj � 1)
where N is the total number of isolates and nj is the number of isolates belongingto the jth type. The cophenetic correlation coefficient is the product-momentcorrelation between all original matrix similarities and all corresponding simi-larity values derived from the resulting dendrogram. As such, it provides ameasure of whether or not a matrix can be faithfully represented as a bifurcatingtree. Cophenetic correlation coefficients of the UPGMA dendrograms producedby using each typing method were calculated by using Molecular Analyst soft-ware.
RESULTS
PFGE typing. An illustration of PFGE patterns is shown inFig 1. Reproducibility was checked by preparing agarose-em-bedded DNA from 15 isolates two or more times. Similaritycoefficients between these replicates ranged between 90.7 and97.6% (mean standard deviation, 93.84% 2.34%). Amongthe 97 isolates studied, 10 clusters could be delineated (desig-nated P1 to P10) by using a cutoff value of 65% similarity, while22 isolates occupied separate positions in the dendrogram (Fig.2 and Table 1). Isolates belonging to the same cluster did notdiffer by more than six bands, although in general, isolatesbelonging to different clusters differed by more than six bands(data not shown). The DI for PFGE by using a 65% similaritycutoff value was 0.920. The cophenetic correlation coefficientof the UPGMA dendrogram was 79.7%.
BOX-PCR fingerprinting. An illustration of BOX-PCR pat-terns is shown in Fig. 1. Reproducibility was assessed by ob-taining a pattern from 15 isolates two or more times. Similarityindices between these replicates ranged between 83.6 and97.2% (mean standard deviation, 90.27% 3.88%). Byusing a cutoff value of 70% similarity, eight clusters could bedelineated (designated B1 to B8), while 13 isolates occupiedseparate positions in the dendrogram (Fig. 2 and Table 1). TheDI of BOX-PCR fingerprinting with a 70% similarity cutoffvalue was 0.821. The cophenetic correlation coefficient of thedendrogram was 96.3%.
RAPD typing. From the same set of 97 isolates analyzed byPFGE and BOX-PCR, a subset of 31 isolates (recovered fromCF patients receiving care in four different treatment centersin the same U.S. state) was further investigated by using RAPDtyping. An illustration of RAPD typing is shown in Fig. 1.Reproducibility was assessed by obtaining a pattern from sixisolates two times. Similarity indices between these replicatesranged from 71.0 to 97.4% (mean standard deviation,83.88% 10.39%). With a cutoff value of 80% similarity, threeclusters could be delineated (designated R1 to R3), while sixisolates occupied separate positions in the dendrogram (Fig. 3
VOL. 40, 2002 TYPING METHODS FOR B. CEPACIA GENOMOVAR III 3301
and Table 2). The DI for RAPD typing with an 80% similaritycutoff value was 0.738.
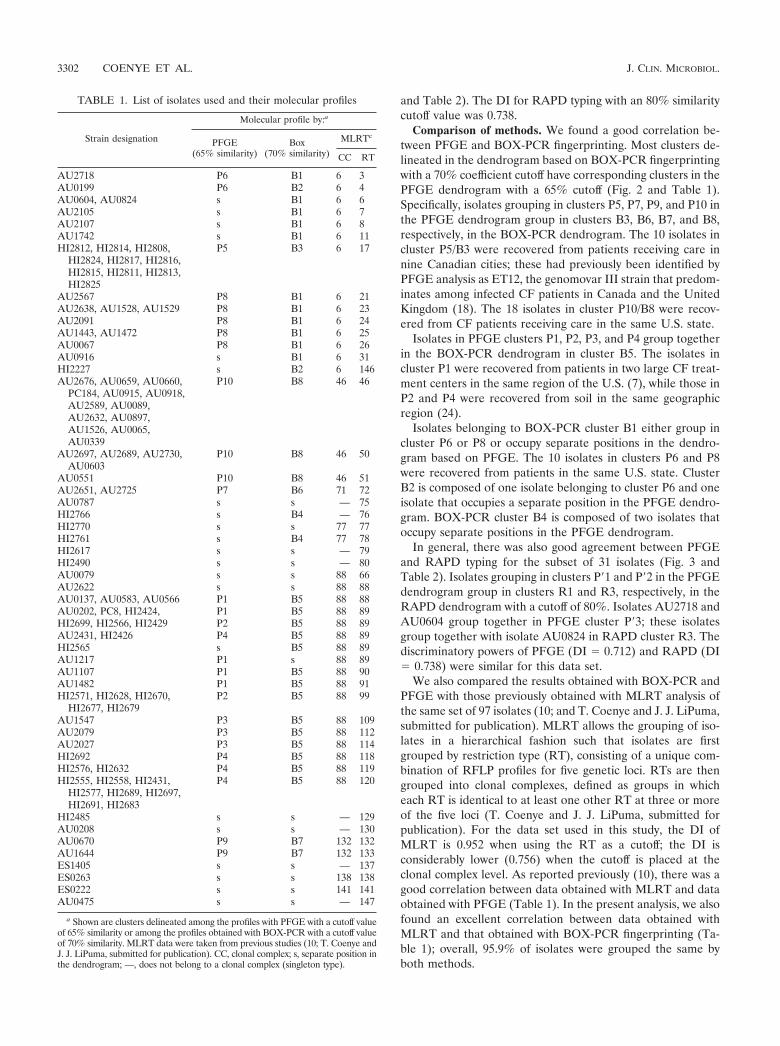
Comparison of methods. We found a good correlation be-tween PFGE and BOX-PCR fingerprinting. Most clusters de-lineated in the dendrogram based on BOX-PCR fingerprintingwith a 70% coefficient cutoff have corresponding clusters in thePFGE dendrogram with a 65% cutoff (Fig. 2 and Table 1).Specifically, isolates grouping in clusters P5, P7, P9, and P10 inthe PFGE dendrogram group in clusters B3, B6, B7, and B8,respectively, in the BOX-PCR dendrogram. The 10 isolates incluster P5/B3 were recovered from patients receiving care innine Canadian cities; these had previously been identified byPFGE analysis as ET12, the genomovar III strain that predom-inates among infected CF patients in Canada and the UnitedKingdom (18). The 18 isolates in cluster P10/B8 were recov-ered from CF patients receiving care in the same U.S. state.
Isolates in PFGE clusters P1, P2, P3, and P4 group togetherin the BOX-PCR dendrogram in cluster B5. The isolates incluster P1 were recovered from patients in two large CF treat-ment centers in the same region of the U.S. (7), while those inP2 and P4 were recovered from soil in the same geographicregion (24).
Isolates belonging to BOX-PCR cluster B1 either group incluster P6 or P8 or occupy separate positions in the dendro-gram based on PFGE. The 10 isolates in clusters P6 and P8were recovered from patients in the same U.S. state. ClusterB2 is composed of one isolate belonging to cluster P6 and oneisolate that occupies a separate position in the PFGE dendro-gram. BOX-PCR cluster B4 is composed of two isolates thatoccupy separate positions in the PFGE dendrogram.
In general, there was also good agreement between PFGEand RAPD typing for the subset of 31 isolates (Fig. 3 andTable 2). Isolates grouping in clusters P�1 and P�2 in the PFGEdendrogram group in clusters R1 and R3, respectively, in theRAPD dendrogram with a cutoff of 80%. Isolates AU2718 andAU0604 group together in PFGE cluster P�3; these isolatesgroup together with isolate AU0824 in RAPD cluster R3. Thediscriminatory powers of PFGE (DI � 0.712) and RAPD (DI� 0.738) were similar for this data set.
We also compared the results obtained with BOX-PCR andPFGE with those previously obtained with MLRT analysis ofthe same set of 97 isolates (10; and T. Coenye and J. J. LiPuma,submitted for publication). MLRT allows the grouping of iso-lates in a hierarchical fashion such that isolates are firstgrouped by restriction type (RT), consisting of a unique com-bination of RFLP profiles for five genetic loci. RTs are thengrouped into clonal complexes, defined as groups in whicheach RT is identical to at least one other RT at three or moreof the five loci (T. Coenye and J. J. LiPuma, submitted forpublication). For the data set used in this study, the DI ofMLRT is 0.952 when using the RT as a cutoff; the DI isconsiderably lower (0.756) when the cutoff is placed at theclonal complex level. As reported previously (10), there was agood correlation between data obtained with MLRT and dataobtained with PFGE (Table 1). In the present analysis, we alsofound an excellent correlation between data obtained withMLRT and that obtained with BOX-PCR fingerprinting (Ta-ble 1); overall, 95.9% of isolates were grouped the same byboth methods.
TABLE 1. List of isolates used and their molecular profiles
Strain designation
Molecular profile by:a
PFGE(65% similarity)
Box(70% similarity)
MLRTc
CC RT
AU2718 P6 B1 6 3AU0199 P6 B2 6 4AU0604, AU0824 s B1 6 6AU2105 s B1 6 7AU2107 s B1 6 8AU1742 s B1 6 11HI2812, HI2814, HI2808,
HI2824, HI2817, HI2816,HI2815, HI2811, HI2813,HI2825
P5 B3 6 17
AU2567 P8 B1 6 21AU2638, AU1528, AU1529 P8 B1 6 23AU2091 P8 B1 6 24AU1443, AU1472 P8 B1 6 25AU0067 P8 B1 6 26AU0916 s B1 6 31HI2227 s B2 6 146AU2676, AU0659, AU0660,
PC184, AU0915, AU0918,AU2589, AU0089,AU2632, AU0897,AU1526, AU0065,AU0339
P10 B8 46 46
AU2697, AU2689, AU2730,AU0603
P10 B8 46 50
AU0551 P10 B8 46 51AU2651, AU2725 P7 B6 71 72AU0787 s s — 75HI2766 s B4 — 76HI2770 s s 77 77HI2761 s B4 77 78HI2617 s s — 79HI2490 s s — 80AU0079 s s 88 66AU2622 s s 88 88AU0137, AU0583, AU0566 P1 B5 88 88AU0202, PC8, HI2424, P1 B5 88 89HI2699, HI2566, HI2429 P2 B5 88 89AU2431, HI2426 P4 B5 88 89HI2565 s B5 88 89AU1217 P1 s 88 89AU1107 P1 B5 88 90AU1482 P1 B5 88 91HI2571, HI2628, HI2670,
HI2677, HI2679P2 B5 88 99
AU1547 P3 B5 88 109AU2079 P3 B5 88 112AU2027 P3 B5 88 114HI2692 P4 B5 88 118HI2576, HI2632 P4 B5 88 119HI2555, HI2558, HI2431,
HI2577, HI2689, HI2697,HI2691, HI2683
P4 B5 88 120
HI2485 s s — 129AU0208 s s — 130AU0670 P9 B7 132 132AU1644 P9 B7 132 133ES1405 s s — 137ES0263 s s 138 138ES0222 s s 141 141AU0475 s s — 147
a Shown are clusters delineated among the profiles with PFGE with a cutoff valueof 65% similarity or among the profiles obtained with BOX-PCR with a cutoff valueof 70% similarity. MLRT data were taken from previous studies (10; T. Coenye andJ. J. LiPuma, submitted for publication). CC, clonal complex; s, separate position inthe dendrogram; —, does not belong to a clonal complex (singleton type).
3302 COENYE ET AL. J. CLIN. MICROBIOL.

DISCUSSION
Previous studies regarding the molecular epidemiology ofinfection due to B. cepacia complex species have employed avariety of genotyping methods, including ribotyping, PFGE,RAPD, ERIC-PCR, and BOX-PCR fingerprinting (5, 7, 10,24, 26, 28, 29, 30, 37, 46). Among these methods, PFGE andRAPD have emerged as the most widely used in recent studies;however, few studies have compared different genotypingmethods in a systematic way. Bingen et al. (5) concluded thatRAPD was less discriminative than PFGE for the study ofbacteria in the B. cepacia complex. In contrast, Liu et al. (26)showed that these methods had comparable discriminatorypower, but noted that PFGE was considerably more reproduc-ible. These investigators also concluded that ERIC-PCRshould be considered a valid and reproducible alternative toPFGE. However, in both studies, relatively small sets of B.cepacia complex isolates were evaluated in the comparison ofthese methods. In a more recent study, we explored the use ofMLRT as an alternative genotyping method and showed a
strong correlation between PFGE and MLRT in an analysis ofa larger set of B. cepacia genomovar III isolates (10). In thepresent study, we sought to expand these findings to includeother commonly used PCR-based methods, including BOX-PCR and RAPD typing. We also wished to more specificallyidentify the strengths and weaknesses of these methods fortyping B. cepacia genomovar III, to compare these results withMLRT, and to determine which methods are best suited foraddressing questions in the settings of local and global epide-miology.
Several criteria have been used in evaluating bacterial geno-typing methods, including typeability, reproducibility, discrim-inatory power, and ease of interpretation (2, 20, 31). Typeabil-ity describes the ability of a given method to provide a readableresult for each isolate analyzed (2, 6). All isolates included inthis study were typeable by each method used. In previouswork, we have noted that a small fraction of B. cepacia complexisolates are refractory to PFGE typing, presumably due to thepresence of high DNase activity (data not shown).
FIG. 1. Illustration of genotyping methods with representative B. cepacia complex genomovar III isolates. PFGE, BOX-PCR, RAPD gels, andUPGMA dendrograms were produced as described in the text. Scale bars indicate percent similarity.
VOL. 40, 2002 TYPING METHODS FOR B. CEPACIA GENOMOVAR III 3303

FIG. 2. Dendrograms derived from the UPGMA linkage of correlation coefficients between the PFGE patterns (left) and BOX-PCR patterns(right). Clusters were delineated with a 65% similarity cutoff for PFGE and a 70% similarity cutoff level for BOX-PCR, as indicated by the heavyvertical lines. Corresponding clusters are indicated by connecting arrows. (Solid, dashed, or dotted lines are included for ease of interpretationonly.)
3304 COENYE ET AL. J. CLIN. MICROBIOL.

Reproducibility measures the ability of a technique to yieldthe same result when replicate assays are performed on thesame isolate (2). In this study, we found that PFGE was sig-nificantly more reproducible than BOX-PCR and RAPD typ-ing (P 0.05). The reproducibility values of PFGE were alsoin a significantly narrower range than those of BOX-PCR (P 0.05) and RAPD (P 0.0001). The high reproducibility ofPFGE is in agreement with findings of most previous studies(2, 5, 31, 37, 40). In contrast, previous studies have providedconflicting data regarding the reproducibility of RAPD typing
(2, 5, 26, 28, 31, 32, 37, 41, 42). Excellent reproducibility wasreported by Mahenthiralingam et al. (28) and Segonds et al.(37), while significant day-to-day variation in RAPD patternsobtained from the same B. cepacia complex isolate was notedby Bingen et al. (5) and Liu et al. (26). In our study, wesimilarly found the reproducibility of RAPD profiles to berather low. Reproducibility of BOX-PCR fingerprinting wasintermediate between that of PFGE and RAPD; moreover, thevalues we obtained were generally in agreement with thosereported by others (8, 35).
Discriminatory power defines the ability of a typing methodto distinguish different strains. This may be expressed as anindex that measures the probability that two unrelated strainswill be placed into different groups. Discriminatory power ismost conveniently calculated by using Simpson’s index of di-versity (DI), which takes into account the number of typesdefined by the method and the relative frequencies of thesetypes (2, 17). A DI value of �0.90 has been considered ade-quate in previous assessments of genotyping methods (13, 17,39, 47). In our study, only PFGE (with DI � 0.920, with thisdata set and a 65% similarity coefficient cutoff) would meet thisstringent criterion. However, higher discriminatory power doesnot necessarily always result in a more accurate representationof epidemiologic relatedness. While this may be true in thesetting of outbreak epidemiology, in which very high discrim-inatory power is needed to trace patient-to-patient transmis-sion or nosocomial outbreaks, methods based on such a highDI may very well be less suitable for the analysis of largepopulations of organisms collected over extended periods oftime. This is illustrated by the results previously obtained byusing MLRT analysis of this same set of B. cepacia genomovarIII isolates. Important relationships among isolates grouped at
FIG. 3. Dendrograms derived from the UPGMA linkage of correlation coefficients between the PFGE patterns (left) and RAPD patterns(right). Clusters were delineated with 65 and 80% similarity cutoff values for PFGE and RAPD, respectively, as indicated by the heavy vertical lines.
TABLE 2. Subset of isolates investigated by RAPD typing
Strain designation
Molecular profile bya:
PFGE(65% similarity)
RAPD(80% similarity)
AU2567, AU2638, AU1528,AU1529, AU2091,AU1443, AU1472,AU0067
P�1 R1
AU2676, AU0659, AU0660,AU2697, AU0551,PC184, AU0915,AU0089, AU0603,AU2632, AU0897,AU1526, AU2730,AU0065, AU0339
P�2 R3
AU2718, AU0604 P�3 R2AU0824 s R2AU2105, AU2107, AU1742,
AU0670, AU0916s s
a Shown are clusters delineated among the profiles obtained with PFGE witha cutoff value of 65% similarity or among the profiles obtained with RAPD witha cutoff value of 80% similarity. s, separate position in the dendrogram.
VOL. 40, 2002 TYPING METHODS FOR B. CEPACIA GENOMOVAR III 3305
the clonal complex level (i.e., employing a significantly lowerDI) are not apparent based on PFGE analysis. In this regard,MLRT provides greater utility in allowing meaningful analysisof relationships among isolates collected both in larger andsmaller scale (both temporal and spatial) studies (10). Fromthis perspective, it is important to note that, in this study, theDI of BOX-PCR fingerprinting with a 70% similarity cutoff(DI � 0.821) is intermediate between the DIs of MLRT anal-ysis according to either RT (DI � 0.952) or clonal complex (DI� 0.756)-level cutoffs. Of course, the discriminatory power ofany given typing method is determined by the data set and bythe cutoff values used. The cutoff values used in this study werebased on (i) the available epidemiologic data (i.e., geographiclocation and previously determined epidemiological relation-ships), (ii) the reproducibility of the methods, and (iii) thecophenetic correlation coefficient. It is possible that with otherdata sets, these similarity coefficient cutoff values may need tobe adjusted to better accommodate these variables.
A final criterion to consider in assessment of typing methodsis ease of performance. This includes not only performance ofthe assay, but also interpretation of the resulting data. PFGE iswithout doubt the more laborious and time-consuming tech-nique among those examined. In contrast to PCR-based meth-ods, PFGE requires a much longer time to perform (4 dayswith the protocol described above) and more specializedequipment (2, 31). BOX-PCR and RAPD fingerprinting aresignificantly less cumbersome; results can be obtained within 1working day. MLRT occupies an intermediate position in thisregard.
Whereas consensus guidelines for interpreting DNA restric-tion patterns generated by PFGE have been published (40),comparable criteria for interpretation of RAPD and BOX-PCR patterns are not available. However, the PFGE interpre-tative criteria were intended to be used only as an aid in thevisual examination of small sets of isolates related to putativeoutbreaks of disease. These criteria are impractical and quitelimited for analyzing larger sets of isolates where multiplepairwise comparisons are required. Indeed, for all the geno-typing methods under consideration, visual comparison oflarge number of complex fingerprint patterns is not only time-consuming but also highly subjective. The use of equipment todigitize patterns and software to perform numerical analysis ofthese patterns are necessary for studies involving typing of asignificant number of isolates.
The data presented in this study indicate that there arestrengths and weaknesses among the various genotyping meth-ods that have been used to investigate the epidemiology of B.cepacia genomovar III. Which technique is chosen for a givenstudy depends not only on the preferences of the investigatorsand the resources available, but most importantly on the spe-cific epidemiologic question being addressed. Our data indi-cate that the reproducibility of RAPD typing is not sufficient toallow reliable comparisons across large numbers of assays inlarge-scale studies. This relatively poor reproducibility alsolimits the portability of results between laboratories. On theother hand, RAPD analysis is well suited to smaller-scale stud-ies, such as investigation of a hospital outbreak, in which alimited number of samples is collected within a narrow timeframe. In this setting, PFGE would be a more reproducible andportable, but also more time-consuming and expensive alter-
native. For more global epidemiological questions, involvinglarger number of isolates collected over a longer time frame,both MLRT and BOX-PCR fingerprinting might be consid-ered the methods of choice. While data derived from MLRTcan be used for population structure analysis (10), BOX-PCRfingerprinting has the advantage of being a more rapid and lessexpensive method.
ACKNOWLEDGMENTS
This work was supported by a grant from the Cystic Fibrosis Foun-dation (United States) (to J.J.L.). T.C. is supported by the Caroll HaasResearch Fund in Cystic Fibrosis.
REFERENCES
1. Agodi, A., E. Mahenthiralingam, M. Barchitta, V. Giannino, A. Sciacca, andS. Stefani. 2001. Burkholderia cepacia complex infection in Italian patientswith cystic fibrosis: prevalence, epidemiology, and genomovar status. J. Clin.Microbiol. 39:2891–2896.
2. Arbeit, R. D. 1995. Laboratory procedures for the epidemiologic analysis ofmicroorganisms, p 190–208. In P. R. Murray, E. J. Baron, M. A. Pfaller, F. C.Tenover, and R. H. Yolken (ed.), Manual of clinical microbiology, 6th ed.ASM Press, Washington, D.C.
3. Aris, R. M., J. C. Routh, J. J. LiPuma, D. G. Heath, and P. H. Gilligan. 2001.Lung transplantation for cystic fibrosis patients with Burkholderia cepaciacomplex: survival linked to genomovar type. Am. J. Respir. Crit. Care Med.164:2102–2106.
4. Balandreau, J., V. Viallard, B. Cournoyer, T. Coenye, S. Laevens, and P.Vandamme. 2001. Burkholderia cepacia genomovar III is a common plant-associated bacterium. Appl. Env. Microbiol. 67:982–985.
5. Bingen, E. H., M. Weber, J. Derelle, N. Brahimi, N. Y. Lambert-Zechovsky,M. Vidailhet, J. Navarro, and J. Elion. 1993. Arbitrarily primed polymerasechain reaction as a rapid method to differentiate crossed from independentPseudomonas cepacia infections in cystic fibrosis patients. J. Clin. Microbiol.31:2589–2593.
6. Burucoa, C., V. Lhomme, and J. L. Fauchere. 1999. Performance criteria ofDNA fingerprinting methods for typing of Helicobacter pylori isolates: exper-imental results and meta-analysis. J. Clin. Microbiol. 37:4071–4080.
7. Chen, J. S., K. A. Witzmann, T. Spilker, R. J. Fink, and J. J. LiPuma. 2001.Endemicity and inter-city spread of Burkholderia cepacia genomovar III incystic fibrosis. J. Pediatr. 139:643–649.
8. Cho, J.-C., and J. M. Tiedje. 2000. Biogeography and degree of endemicityof fluorescent Pseudomonas strains in soil. Appl. Environ. Microbiol. 66:5448–5456.
9. Coenye, T., J. Goris, T. Spilker, P. Vandamme, and J. J. LiPuma. 2002.Characterization of unusual bacteria isolated from respiratory secretions ofcystic fibrosis patients and description of Inquilinus limosus gen. nov., sp. nov.J. Clin. Microbiol. 40:2062–2069.
10. Coenye, T., and J. J. LiPuma. 2002. Multilocus restriction typing, a novel toolfor studying global epidemiology of Burkholderia cepacia complex infectionin cystic fibrosis. J. Infect. Dis. 185:1454–1462.
11. Coenye, T., P. Vandamme, J. R. W. Govan, and J. J. LiPuma. 2001. Taxon-omy and identification of the Burkholderia cepacia complex. J. Clin. Micro-biol. 39:3427–3436.
12. De Soyza, A., A. McDowell, L. Archer, J. H. Dark, S. J. Elborn, E. Ma-henthiralingam, K. Gould, and P. A. Corris. 2001. Burkholderia cepaciacomplex genomovars and pulmonary transplantation outcomes in patientswith cystic fibrosis. Lancet 358:1780–1781.
13. Dillon, J.-A., M. Rahman, and K.-H. Yeung. 1993. Discriminatory power oftyping schemes based on Simpson’s index of diversity for Neisseria gonor-rhoeae. J. Clin. Microbiol. 31:2831–2833.
14. Gilligan, P. H. 1991. Microbiology of airway disease in patients with cysticfibrosis. Clin. Microbiol. Rev. 4:35–51.
15. Govan, J. R. W., and V. Deretic. 1996. Microbial pathogenesis in cysticfibrosis: mucoid Pseudomonas aeruginosa and Burkholderia cepacia. Micro-biol. Rev. 60:539–574.
16. Govan, J. R. W., J. E. Hughes, and P. Vandamme. 1996. Burkholderia cepa-cia: medical, taxonomic and ecological issues. J. Med. Microbiol. 45:395–407.
17. Hunter, P. R., and M. A. Gaston. 1988. Numerical index of the discrimina-tory ability of typing systems: an application of Simpson’s index of diversity.J. Clin. Microbiol. 26:2465–2466.
18. Johnson, W. M., S. D. Tyler, and K. R. Rozee. 1994. Linkage analysis ofgeographical and clinical clusters in Pseudomonas cepacia infections by mul-tilocus enzyme electrophoresis and ribotyping. J. Clin. Microbiol. 32:924–930.
19. Ledson, M. J., M. J. Gallagher, M. Jackson, C. A. Hart, and M. J. Walshaw.2002. Outcome of Burkholderia cepacia colonisation in an adult cystic fibrosiscentre. Thorax 57:142–145.
3306 COENYE ET AL. J. CLIN. MICROBIOL.

20. LiPuma, J. J. 1998. Molecular tools for epidemiologic study of infectiousdiseases. Pediatr Infect. Dis J 17:667–675.
21. LiPuma, J. J. 1998. Burkholderia cepacia: management issues and new in-sights. Clin. Chest. Med. 19:473–486.
22. LiPuma, J. J. 1998. Burkholderia cepacia epidemiology and pathogenesis:implications for infection control. Cur. Opin. Pulm. Med. 4:337–441.
23. LiPuma, J. J., B. J. Dulaney, J. D. McMenamin, P. W. Whitby, T. L. Stull, T.Coenye, and P. Vandamme. 1999. Development of rRNA-based PCR assaysfor identification of Burkholderia cepacia complex isolates recovered fromcystic fibrosis patients. J. Clin. Microbiol. 37:3167–3170.
24. LiPuma, J. J., T. Spilker, T. Coenye, and C. F. Gonzalez. 2002. An epidemicBurkholderia cepacia complex strain identified in soil. Lancet 359:2002–2003.
25. LiPuma, J. J., T. Spilker, L. H. Gill, P. W. Campbell III, L. Liu, and E.Mahenthiralingam. 2001. Disproportionate distribution of Burkholderia ce-pacia complex species and transmissibility markers in cystic fibrosis. Am. J.Respir. Crit. Care Med. 164:92–96.
26. Liu, P. Y.-F., Z.-Y. Dhi, Y.-J. Lau, B.-S. Hu, J.-M. Shyr, W.-S. Tsai, Y.-H. Lin,and C.-Y. Tseng. 1995. Comparison of different PCR approaches for char-acterization of Burkholderia (Pseudomonas) cepacia isolates. J. Clin. Micro-biol. 33:3304–3307.
27. Mahenthiralingam, E., J. Bischof, S. K. Byrne, C. Radomski, J. E. Davies, Y.Av-Gay, and P. Vandamme. 2000. DNA-based diagnostic approaches for theidentification of Burkholderia cepacia complex, Burkholderia vietnamiensis,Burkholderia multivorans, Burkholderia stabilis, and Burkholderia cepaciagenomovars I and III. J. Clin. Microbiol. 38:3165–3173.
28. Mahenthiralingham, E., M. E. Campbell, D. A. Henry, and D. P. Speert.1996. Epidemiology of Burkholderia cepacia infection in patients with cysticfibrosis: analysis by randomly amplified polymorphic DNA fingerprinting.J. Clin. Microbiol. 34:2914–2920.
29. Miyawaki, H., J. Fujita, K. Takigawa, K. Negayama, Y. Yamagishi, Y.Yamaji, K. Ouchi, T. Nakazawa, K. Kawanishi, and J. Takahara. 1995.Investigation of nosocomial respiratory infection due to Pseudomonas cepa-cia by arbitrarily primed polymerase chain reaction. Diagn. Microbiol. Infect.Dis. 23:77–83.
30. Okazaki, M., T. Watanabe, K. Morita, Y. Higurashi, K. Araki, N. Shukuya,S. Baba, N. Watanabe, T. Egami, N. Furuya, M. Kanamori, S. Shimazaki,and H. Uchimura. 1999. Molecular epidemiological investigation using arandomly amplified polymorphic DNA assay of Burkholderia cepacia isolatesfrom nosocomial outbreaks. J. Clin. Microbiol. 37:3809–3814.
31. Olive, D. M., and P. Bean. 1999. Principles and applications of methods forDNA-based typing of microbial organisms. J. Clin. Microbiol. 37:1661–1669.
32. Power, E. G. 1996. RAPD typing in microbiology—a technical review. J.Hosp. Infect. 34:247–265.
33. Rabkin, C. S., W. R. Jarvis, R. L. Anderson, J. Govan, J. Klinger, J. LiPuma,W. J. Martone, H. Monteil, C. Richard, S. Shigeta, A. Sosa, T. Stull, J.Swenson, and D. Woods. 1989. Pseudomonas cepacia typing systems: collab-orative study to assess their potential in epidemiologic investigations. Rev.Infect. Dis. 11:600–607.
34. Rabkin, C. S., W. R. Jarvis, and W. J. Martone. 1987. Current status ofPseudomonas cepacia typing systems. Eur. J. Epidemiol. 3:343–346.
35. Rademaker, J. L. W., F. J. Louws, and F. J. de Bruijn. 1998. Characterisationof the diversity of ecologically important microbes by rep-PCR fingerprint-ing, p 1–26. In A. D. L. Akkermans, J. D. van Elsas, and F. J. de Bruijn (ed.),Molecular microbial ecology manual, supplement 3. Kluwer Academic Pub-lishers, Dordrecht, The Netherlands.
36. Rosenstein, B. J., and P. L. Zeitlin. 1998. Cystic fibrosis. Lancet 351:277–282.37. Segonds, C., E. Bingen, G. Couetdic, S. Mathy, N. Brahimy, N. Marty, P.
Plesiat, Y. Michel-Briand, and G. Chabanon. 1997. Genotypic analysis ofBurkholderia cepacia isolates from 13 French cystic fibrosis centers. J. Clin.Microbiol. 35:2055–2060.
38. Speert, D. P., D. Henry, P. Vandamme, M. Corey, and E. Mahenthiralingam.2002. Epidemiology of Burkholderia cepacia complex in patients with cysticfibrosis, Canada. Emerg. Infect. Dis. 8:181–187.
39. Struelens, M. J., and European Study Group on Epidemiological Markers,European Society for Clinical Microbiology and Infectious Diseases. 1996.Consensus guidelines for appropriate use and evaluation of epidemiologicaltyping systems. Clin. Microbiol. Infect. 2:2–11.
40. Tenover, F. C., R. D. Arbeit, R. V. Goering, P. A. Mickelsen, B. E. Murray,D. H. Persing, and B. Swaminathan. 1995. Interpreting chromosomal DNArestriction patterns produced by pulsed-field gel electrophoresis: criteria forbacterial strain typing. J. Clin. Microbiol. 33:2233–2239.
41. Tyler, K. D., G. Wang, S. D. Tyler, and W. M. Johnson. 1997. Factorsaffecting reliability and reproducibility of amplification-based DNA finger-printing of representative bacterial pathogens. J. Clin. Microbiol. 35:339–346.
42. van Belkum, A. 1994. DNA fingerprinting of medically important microor-ganisms by use of PCR. Clin. Microbiol. Rev. 7:174–184.
43. van Belkum, A., M. Sluijter, R. de Groot, H. Verbrugh, and P. W. Hermans.1996. Novel BOX repeat PCR assay for high-resolution typing of Strepto-coccus pneumoniae strains. J. Clin. Microbiol. 34:1176–1179.
44. van Belkum, A., M. Struelens, A. de Visser, H. Verbrugh, and M. Tibayrenc.2001. Role of genomic typing in taxonomy, evolutionary genetics, and mi-crobial epidemiology. Clin. Microbiol. Rev. 14:547–560.
45. Vandamme, P., D. Henry, T. Coenye, S. Nzula, M. Vancanneyt, J. J. LiPuma,D. P. Speert, J. R. W. Govan, and E. Mahenthiralingam. 2002. Burkholderiaanthina sp. nov. and Burkholderia pyrrocinia, two additional Burkholderiacepacia complex bacteria, may confound test results of new molecular diag-nostic tools. FEMS Immunol. Med. Microbiol. 33:143–149.
46. Vandamme, P., E. Mahenthiralingam, B. Holmes, T. Coenye, B. Hoste, P. DeVos, D. Henry, and D. P. Speert. 2000. Identification and population struc-ture of Burkholderia stabilis sp. nov. (formerly Burkholderia cepacia genomo-var IV). J. Clin. Microbiol. 38:1042–1047.
47. Van Looveren, M., C. A. Ison, M. Ieven, P. Vandamme, I. M. Martin, K.Vermeulen, A. Renton, and H. Goossens. 1999. Evaluation of discriminatorypower of typing methods for Neisseria gonorrhoeae. J. Clin. Microbiol. 37:2183–2188.
48. Versalovic, J., T. Koeuth, and J. R. Lupski. 1991. Distribution of repetitiveDNA sequences in eubacteria and application to fingerprinting of bacterialgenomes. Nucleic Acids Res. 25:6823–6831.
VOL. 40, 2002 TYPING METHODS FOR B. CEPACIA GENOMOVAR III 3307