community - the public transportation crisis
DESCRIPTION
ÂTRANSCRIPT

STRANDED AT THE STATIONTHE IMPACT OF THE FINANCIAL CRISIS IN PUBLIC TRANSPORTATION
AUGUST 2009

ST
RA
ND
ED
AT T
HE
STAT
ION
1
Demand for public transportation is at a historic high for the Unit-ed States. In 2008, Americans took 10.7 billion trips on public transportation, the highest since 1956—the year the Interstate Highway System was approved.1 Since 1995, transit ridership has been growing at nearly triple the
rate of the population and almost twice as fast as the number of miles driven. In 2008, transit ridership rose four percent, while the total number of miles driven fell by 3.6 percent.2
Communities across the country have tried to respond to this demand by planning for new rail lines, launching commuter bus and train services, and expanding bus routes into areas never before served by transit. Rail and rapid bus lines, in turn, have attracted new homes, businesses and offices. These trends are almost universally regarded as positive for local communities, for metro areas and for the nation as a whole.
The benefits, certainly, are numerous. They accrue to people from all walks of life: Older Americans (and there are more every day) rely on public transit to remain active and engaged, rather than stranded at home. As gas prices rise along with freeway congestion, drivers are switch-ing to public transportation to save money and frustration. Low-income workers and their fami-lies depend on transit to reach jobs and daily necessities.
Businesses also benefit, gaining greater access to workers who themselves have more reliable commutes. Fewer commuters clogging the highways can mean more efficient goods movement, as well as cleaner air. Property values in neighborhoods close to quality transit service have held steady or improved, even in this real estate depression, providing a boon to owners and local governments alike. The nation as a whole benefits from reduced reliance on oil imported from volatile parts of the world, with less of our national income sent abroad. And the planet benefits from reduced carbon emissions: More than 30 state climate change action plans call for substan-tially increased public transportation. The new Administration understands these benefits, too.
INTRODUCTION

2
ST
RA
ND
ED
AT
TH
E S
TAT
ION
The President, his Secretary of Transportation and other officials regularly point to the benefits that public transportation produces for the economy, the environment, and community health. In addition, building and operating transit could be a source of rapid job creation in an economy where jobs are desperately needed.
With both the demand and the pay-off so high, now would seem to be the time to build on this success and expand transit options, yet the opposite is happening. State and local budget cuts have put public transit agencies everywhere under tremendous pressure, forcing them to eliminate service, raise fares and lay off workers. While the depth of the funding crisis is the result of the unusually severe economic downturn, the cuts to this essential service underscore a basic truth: The funding base for building and operating public transportation is insufficient and vul-nerable.
Financial support from states and localities is important, but they cannot do it on their own. As with all transportation systems in the U.S. – whether highways, airports, or transit -- federal policy and funding determine whether any given mode reaches its potential. Currently, the fed-eral government devotes 82 cents of every transportation dollar to roads and 18 percent to public transportation. Federal policy requires local taxpayers to match each federal dollar for public transportation with a dollar of their own, while requiring only a quarter match for roads. The federal government provides formula funding to localities, but does not give them the flexibility to spend it as needs dictate; rather, it requires them to spend on equipment and construction, even if the pressing need is for money to preserve services in an economic downturn.
Existing federal policy is out of date and out of touch with today’s realities. Even if Congress were to act today to change policy to enable the preservation of existing service in this economy – and it should – the resources needed to meet rising demand are simply not there. It is encour-aging, then, that leaders in the U.S. House have put forward ideas to provide greater flexibility, fairness, and funding in the next six-year transportation law. It is our hope that this report, which provides a national snapshot of the pain being felt by transit riders across the country, will help serve as a catalyst for building a system that realizes the myriad benefits outlined above and cre-ates a robust, resilient transportation network that works for all Americans.

3
Fundamentally, public transportation is a means to provide mobility—it ensures access to jobs, schools and services for all members of our society, and serves to reduce traffic congestion. But it also im-proves the quality of our lives in ways that may be less obvious. Pub-lic investment in transit is a catalyst for private investment and eco-nomic growth. The more we invest in transit, the safer and healthier we all become. And if we are to prevent climate change, transit will have to play an essential role.
Following is a brief summary of some of the benefits of public trans-portation. More information about the advantages of transit can be found on the web sites of Transportation for America and the Ameri-can Public Transportation Association.3
MOBILITY BENEFITS Public transportation ensures mobility for all, including the tens of millions of Americans without access to a car.
As the nearly 80 million members of the Baby Boom generation become older and less able to drive, transit will only become more essential to the basic mobility of our citizens. In addition to “fixed-route” services, transit operators also provide “paratransit” services, or door-to-door van services available by reservation to those unable to use conventional transit because of a disability. Many transit agencies also operate in rural and suburban areas where seniors and persons with dis-abilities must travel farther to access services, making walking impractical and taxi rides prohibi-tively expensive. According to one study, by 2025 one in five Americans will be over the age of 65 –with one-fifth of those seniors unable to drive.4 Transit will, for more of us than ever before, be a necessary component of individual freedom.
Transit also benefits owners of cars. With increases in the price of gasoline, more Americans be-gan to look in earnest for an alternative to driving their cars. In the third quarter of 2008, transit ridership increased 6.5 percent over the prior year, while vehicle miles traveled, or VMT, declined 4.6 percent.5 While volatile energy prices may have initially encouraged some to try transit, transit ridership continued to climb even as gas prices eventually fell back down.
How much of an impact does transit have on congestion? According to the Texas Transporta-tion Institute’s most recent Mobility Report, in 2007 traffic delays cost residents of the 439 largest urban areas in the U.S. 4.2 billion hours—but transit reduced delays by 610 million hours, or 15 percent.6 The value of the additional travel delay and fuel that would have been consumed if there were no public transportation service would be an additional $13.7 billion. Of course, buses get stuck in traffic, too. But, since transit riders don’t have to drive, they can spend their time in traffic working, reading, or just relaxing. Transit doesn’t just reduce congestion; it also offers an alternative to congestion.
THE VALUE OF
PUBLIC TRANSIT
ST
RA
ND
ED
AT T
HE
STAT
ION

4
ST
RA
ND
ED
AT
TH
E S
TAT
ION
ECONOMIC AND EQUITY BENEFITS Public transportation costs money to operate—but it can save households and businesses thousands of dollars a year. It also generates profits, jobs, tax revenue, new development and rede-velopment, and it enhances land values and economic competitiveness.
Indeed, transit is one of the best investments we can make in difficult economic times. Ac-cording to one study, every dollar invested in transit generates six dollars’ worth of economic activity.7 Every $10 million invested in transit operations, the same study found, can be expected to result in approximately 570 jobs and $32 million in sales for businesses.
Moreover, as of 2006, transit agencies employed 369,000 Americans, a population greater than that of St. Louis, Pittsburgh or Tampa. The average annual salary for these employees was approximately $57,000,8 and positions in transit operations and maintenance are blue-collar, green jobs that cannot be outsourced. So, too, are construction jobs generated by building new transit lines and stations, vehicles, and maintenance facilities.
Transit can also save families a great deal of money. One recent study found that, by avoiding auto-related costs such as fuel, parking, payments, insurance, and repair, the average American household can save close to $8,700 per year, or $724 per month,9 through transit use. This figure is unsurprising when you consider that the average annual cost to own and operate a car, accord-ing to the American Automobile Association, is nearly $10,000.10 The Center for Neighborhood Technology, meanwhile, has found that families living in “location efficient” areas where public transit is available spend as little as 15 percent of their household incomes on transportation—or about half as much as transportation can cost families in “inefficient” locations without transit.11
The savings made possible by transit are especially important to Americans in low-income households, many of whom are forced to drive by a lack of transit options. As of 2005, 73 per-cent of households below the federal poverty line had a car,12 and on average, working families making between $20,000 and $50,000 spend close to 30 percent of their household incomes on transportation—more than they spend on housing.13 Using Bureau of Labor Statistics data from 2003, however, researcher Todd Litman has found that low-income households without a car spend a significantly smaller percentage of their income on transportation than households with a car—several times smaller for households earning less than $30,000 a year.14 Of course, poor families can always save money by buying cheaper cars; but then cheaper cars are less reliable, so repair costs are higher, and workers can lose their jobs if their cars suddenly become unavailable and no transit alternative exists.
Public transportation connecting low-income communities to jobs, then, is a necessity. It is essential to provide affordable and reliable access to employment opportunities for low-income workers. But transit also benefits regional economies, as businesses profit from a larger labor pool. Public transportation access is essential to ensuring that regional economies are equitable, fair, and benefit all of their citizens.
HEALTH AND SAFETY BENEFITS By removing millions of cars from American roads, public transit improves the personal health and safety of all Americans. It reduces air pollution, promotes individual fitness, and prevents auto crashes.
Nationwide, annual medical costs related to pollution caused by transportation are estimated at between $40 billion and $64 billion.15 Public transportation, however, produces much less pol-lution than driving. On a per-passenger-mile basis, transit has been found to produce 95 percent less carbon monoxide (CO) than private vehicles, 90 percent fewer volatile organic compounds (VOCs), and about half as much carbon dioxide (CO2) and nitrogen oxide (NOx).16

5
Several recent studies have also documented a link between transit use, walking, and reduced obesity. One widely cited study, for example, noted that transit use is associated with an addi-tional 8.3 minutes per day of walking, enough to burn between 25.7 and 39 calories. Given that another study found that additional expenditure of 100 calories per day could stop the increase in obesity in 90 percent of the population, the study concluded that walking associated with transit could cut obesity-related medical costs by $5,500 per person.17
Transit use also improves public safety by reducing vehicle crashes, which are the leading cause of death for Americans between the ages of five and 34. More than 40,000 Americans are killed annually in car crashes,18 costing a total of $164 billion.19 The National Safety Council, however, has found that riding a bus is 25 times safer than being in a car.20
ENVIRONMENTAL AND ENERGY SECURITY BENEFITS Finally, public transit significantly reduces greenhouse gas emissions and dependence on foreign oil, both by directly reducing vehicle miles traveled as well as by supporting denser, more sustainable patterns of development. This, in turn, increases the cost-effectiveness of transit, resulting in a virtuous cycle. By supporting alternatives to suburban “sprawl,” transit also reduces other environmental impacts, including loss of prime farmland, declining water quality, and harmful emissions.
The transportation sector accounts for one-third of America’s carbon emissions, and as vehicle miles traveled have increased, so have emissions.21 Altogether, American vehicles burn fuel at a rate of 6,300 gallons per second, helping to make the U.S. the world’s leading producer of carbon emissions.22 Transit, however, reduces vehicle miles traveled by 102.2 billion miles per year—meaning that without transit, America’s contribution to global warming would be much greater.23 A 2002 study found that transit saves Americans more than 855 million gallons of gasoline a year, or 45 million barrels of oil—equal to about one month’s worth of imports from Saudi Ara-bia or three months of the fuel needed to heat, cool and supply electricity to all of the homes in America.24
ST
RA
ND
ED
AT T
HE
STAT
ION

6
ST
RA
ND
ED
AT
TH
E S
TAT
ION
As transit ridership has grown in recent years, the face of public transportation has changed. It is becoming the face of America, with people who choose it for as many reasons as there are trips. New riders have come from a variety of sources. Volatile gas prices have driven many car commuters to switch to transit, but even more riders have been lured by the provision of new services: Commuter trains and buses, new light rail lines, and even the return of streetcars in several cities. Homes and jobs have clustered around new and existing lines, making it easier to live and work near transit. Newer riders choose public transportation for many reasons: To save money on car ownership or have a more reliable commute, to act on their environmental values, and to relax or be productive during their commutes.
Of course, a substantial number of riders use transit because the alternative is to be stranded. These are older Americans whose eyesight, reflexes, or budgets no longer permit them to drive cars. They are young adolescents getting to school or their first jobs. And they are low-income families, dispropor-tionately African-American and Hispanic, who can-not afford to own and operate one or more cars.
Ensuring mobility for these Americans is im-portant to all of us. Among our nation’s core values is the promise that everyone should have access to opportunity and jobs, to be able to support them-selves and be contributing members of the community. We believe everyone, including our older citizens and those with disabilities, should be able to live full and productive lives whether or not they are able to drive a car.
Naturally, fare increases and service cuts will have the greatest impact on people who have few other options for travel to work, school, and health services.
The majority of transit passengers remain, on average, somewhat poorer than other Ameri-cans. One in five have incomes below $15,000, and nearly two-thirds earn less than $50,000. About one-third do not own a car, and more than half take a bus or train because a car is not available for the trip.25 Minorities and recent immigrants in particular depend on affordable and reliable transit services to reach everyday destinations, such as jobs, education and health care. African-Americans and Hispanics comprise a majority of the country’s transit users, including
62 percent of bus and light rail riders, 35 percent of subway and heavy rail riders, and 29 percent of commuter rail riders.26
These riders may be more significantly affected by changes in services than other groups because they have fewer transporta-tion options available for their daily mobility. African-Ameri-cans are almost six times as likely as whites to take their trips by transit (5.3 percent vs. 0.9 percent) and Hispanics about three times more than whites (2.4 percent vs. 0.9 percent).27
All Occupied Units 8.5%
Below Poverty Level 26.6%
African-American 20.2%
65 or older 15.6%
Hispanic 11.9%
Source: U.S. Department of Housing and Urban Development and U.S. Department of Commerce, U.S. Census Bureau, American Housing Survey for the United States, H150 (via U.S. Bureau of Transportation Statistics, Transportation Statistics Annual Report, 2006).
FIGURE 1 PERCENTAGES OF HOUSEHOLDS WITHOUT A VEHICLE (2005)
WHO IS AFFECTED BY
TRANSIT CUTS?

7
Low-income riders are particularly vulnerable to increases in a basic, single-ride fare, as they disproportionately pay these fares rather than invest in the monthly passes typically used by ev-eryday commuters. For these riders, an increase in a transit provider’s “cash fare” from, say, $1.50 to $2 per ride can quickly add up.
Riders that depend on transit as their only means of transportation are also vulnerable to service cuts because they are likely to rely on “lifeline” services that are often less cost-effective for transit operators to provide, but ensure basic mobility connecting low-income communities to jobs, to schools, and to social services. Lifeline services are bus routes, which generally have higher labor costs than rail lines. These routes also operate at “off-peak” times throughout the day, in the evening and on weekends, when ridership is more spread out. When transit agencies look to make cuts, they often try to affect the fewest riders. While this makes sense from one perspective, it also tends to be transit-dependent riders who are hurt the most by service cuts.
Eliminating lifeline services doesn’t just impact riders of those routes. Because paratransit service—vans for those unable to use regular fixed-route transit—must legally be provided in the same general area as fixed routes whenever those routes are in operation, cutting a fixed route either in full or in part (during certain times of day) can mean eliminating the only mobility op-tion for many seniors and persons with disabilities.
41% are white, 33% are African-American, 14 percent are Latino, 6% are Asian/Pacific Islander,
and 7% are multi-ethnic.
59% are between the ages of 25 and 54, compared to 44% of all Americans.
55% are women.
72% are employed and 11% are students.
The median household income of transit riders in 2004 was $39,000, compared to $44,400 for all
Americans.
Source: American Public Transportation Association, A Profile of Public Transportation Passenger Demographics and Travel Characteristics, 2007.
FIGURE 2 DEMOGRAPHICS OF TRANSIT RIDERS
ST
RA
ND
ED
AT T
HE
STAT
ION

8
ST
RA
ND
ED
AT
TH
E S
TAT
ION
Call it a tale of two commuters. In March, reporter Rick Karr of PBS’s The NewsHour with Jim Lehrer28 profiled two users of WestCAT,29 a transit system in the San Francisco Bay Area suburbs. One, John Hillman, was a “choice rider,” or someone who could drive but nonetheless chooses to take transit; the other, Juan Medina, was transit-dependent. As part of their commutes to San Francisco—Hillman to a job at the University of California, San Francisco, and Medina to evening classes at City College of San Francisco—both relied on local WestCAT buses to take them from their suburban homes to a regional rail (BART) station for their commute into San Francisco.
Last October, in response to a budget deficit driven by high fuel prices and uncertainty about the future of California state funding for transit, the WestCAT board cut service and raised its cash fare from $1.50 to $1.75.30 These measures weren’t enough. In February, as the state elimi-nated support for transit operations in response to a $41 billion deficit,31 the board approved a second round of cuts, including a reduction in evening frequencies on the buses used by Hillman and Medina from 30 minutes to 40 minutes.32
Hillman told Karr that might be enough to drive him away. “I’m part of a trend,” he ex-plained. “My wife and I got rid of one of our automobiles about 18 months ago. We wanted to do it as an experiment. And I think it’s going to continue indefinitely, as long as there’s a transit system still in place.”
Hillman said taking transit saved him money, and “I find it less stressful.” Still, he continued, “(I)f they were to go to 40 minutes, that would not be good enough. That would make me go out and buy a car.” And if fares were raised any further? “You know, if it were to go up to, say, $3 or $4 a trip, then it just really isn’t worthwhile anymore.”
Medina, meanwhile, was spared the worst—initially, WestCAT had proposed to stop run-ning his bus at 9 p.m. “My options would be either a cab, cab ride. And aside from that, maybe a bicycle,” explained the former construction worker, who is studying to be an emergency medical technician. “That’s if it’s not raining, you know, so it’s pretty limited, you know, for a person that doesn’t drive.
“There’s a lot of people that their schedules aren’t, you know, a 9 to 5,” he continued. “You know, they get off work late or they take night classes or what have you. And, you know, we’re still as much a vital part of the workforce.”
WestCAT’s second round of cuts only amounted to about five percent of its total service,33 but that was on top of the cuts just a few months earlier. “The additional cuts are the serious ones that actually do change the nature of our system,” General Manager Charley Anderson said at a board meeting. Added Mark DeSaulnier, the California state senator for the district served by WestCAT: “You take that one connection on WestCAT away, and he not only doesn’t get on WestCAT, he doesn’t get on Muni (in San Francisco), that whole continuum goes away and he’s back in that car fighting for a parking space in one of the most congested metropolitan areas in the United States.”
Unfortunately, Hillman and Medina are far from alone among American transit riders, as the situation that WestCAT finds itself in is typical. According to a recent survey by the American Public Transportation Association, state, regional and local funding for more than 80 percent of
WHAT IS HAPPENING TO
PUBLIC TRANSIT?

ST
RA
ND
ED
AT T
HE
STAT
ION
9
U.S. transit systems has remained flat or has fallen lately, and nearly 90 percent of those systems have had to raise fares or cut service. Nearly half have done both.34 The remainder of this chapter consists of lists, maps, and case studies attempting to put into further perspective the financial challenges faced by U.S. transit operators.
First are two lists summarizing research into projected deficits, as well as fare increases. These lists include only the 25 largest transit operators in America, although those agencies account for about two-thirds of all transit ridership in the U.S. The first list shows, as a percentage of current operating budgets, the maximum deficits that were projected this year. For a number of reasons, these figures should be viewed as approximate.35
FIGURE 3 TOP 10 PROJECTED DEFICITS AS A PERCENTAGE OF OPERATING BUDGET
1. MARTA (Atlanta) 18%
2. Muni (San Francisco) 17%
3. MTA (New York) 14%
4. CTA (Chicago) 12%
5. DART (Dallas) 12%
6. WMATA (Washington, DC) 12%
7. MBTA (Boston) 11%
8. BART (San Francisco) 8%
9. Metro Transit (Minneapolis/St. Paul) 8%
10. TriMet (Portland, OR) 7%
The next list ranks increases in the “base” or minimum adult cash fare enacted in 2009, approved or proposed. In many cases, other fares—such as those for longer-distance trips or monthly passes—were raised at a different rate.
FIGURE 4 PERCENTAGE INCREASES IN BASE FARES
1. Muni (San Francisco) 33%
2. MBTA (Boston) 33%
3. BART (San Francisco) 17%
4. DART (Dallas) 17%
5. King County Metro (Seattle) 17%
6. RTD (Denver) 14%
7. MARTA (Atlanta) 14%
8. MTA New York City Transit (New York) 13%
9. CTA (Chicago) 13%
10. TheBus (Honolulu) 13%
11, MTA Long Island Rail Road (New York) 10%
12. MTA Metro North 10%
13. Metro (Houston) 4%
On the following pages are two maps attempting to show just how widespread the funding crisis is throughout the country, and how it has impacted transit agencies both large and small. Figure 5 identifies agencies where fare increases and service reductions have been implemented since January 1, or where they are proposed (or were proposed as of early summer); however, the map is doubtless missing some examples. Figure 6 shows increases in base cash fares—not including increases in the cost of monthly passes or other fares—and it, too, is no doubt missing

several instances. Among operators researched for this report, cash fares have increased or may be increasing this year by an average of 12 percent.
Figure 7 lists all of the operators identified in the maps and shows service cuts and percentage increases in base fares.
The final section of this chapter provides examples of the budget situations, as of this summer, of transit agencies around the country. The 21 agencies described here have a combined an-nual ridership of more than 5.8 billion total boardings. 2008 ridership figures as reported to the American Public Transportation Association are provided wherever possible; in some cases, 2007 figures from the National Transit Database are used.
ST
RA
ND
ED
AT
TH
E S
TAT
ION

FIGURE 5 2009 FARE INCREASES, SERVICE REDUCTIONS & STAFF REDUCTIONS (ENACTED & PROPOSED)
Fare Increases
Service and/or Staff Reductions
$
$
$
$
$
$$
$$
$
$$
$
$
$
$
$
$
$
$
$
$$
$ $
$
$
$
$
$
$
$$$
$$$$
$
$$$ $
$$
$
$
$
$
$
$
$
$
$
$
$
$$$
$
$
$$$$
$
$$

FIGURE 6 2009 INCREASES IN ADULT CASH FARE (ENACTED & PROPOSED)
0-10%
10-20%
20-30%
> 30%

ST
RA
ND
ED
AT T
HE
STAT
ION
13
Location and OperatorService
Cuts
% Increase in Base
Fare
Anchorage, AK (People Mover)
KIngman, AZ (Kingman Area Regional Transit)
Phoenix, AZ (City of Phoenix)
Phoenix Metro, AZ (Valley Metro) 40%
Alameda-Contra Costa Counties, CA (AC Transit)
14%
Chico, CA (Butte Regional Transit) 39%
Contra Costa County, CA (County Connection ) 14%
Contra Costa County, CA (WestCAT)
El Centro , CA (Imperial Valley Transit)
Hollister, CA (San Benito County Express)
Long Beach, CA (Long Beach Transit) 22%
Monterey, CA (Monterey-Salinas Transit) 20%
Norwalk, CA (Norwalk Transit) 20%
Orange County, CA (Orange County
Transportation Authority)20%
Riverside, CA (Riverside Transit Agency)
Sacramento, CA (Regional Transit) 13%
San Bernardino, CA (Omnitrans) 12%
San Diego, CA (Metropolitan Transit System) 13%
San Francisco, CA (San Francisco Municipal Transportation Agency)
33%
San Francisco- San Jose-Gilroy, CA (Caltrain) 2-11%
San Francisco Bay Area, CA (Bay Area Rapid Transit) 17%
San Joaquin, CA (San Joaquin Regional
Transit District)
San Jose, CA (Santa Clara Valley
Transportation Authority)14%
Location and OperatorService
Cuts
% Increase in Base
Fare
San Luis Obispo, CA (San Luis Obispo Regional Transit) Authority SLORTA)
25%
San Mateo, CA (SamTrans) 17%
Santa Barbara, CA (MTD Santa Barbara) 40%
Santa Monica, CA (Santa Monica’s Big Blue Bus)
Sonoma County, CA (Sonoma County Transit)
Stockton-San Jose, CA (Altamont Commuter Express) 9-15%
Torrance, CA (Torrance Transit) 100%
Tri-Valley region, CA (Livermore Amador Valley
Transit Authority)14%
Vallejo, CA (Vallejo Transit)
West Covina, CA (Go West –
West Covina Shuttle Bus)100%
Western Contra Costa County, CA (WestCAT)
Yolo County CA (Yolobus) 33%
Colorado Springs, CO (Mountain Metropolitan Transit)
Denver, CO (Regional
Transportation District)14%
Snowmass Village, CO (Snowmass Village Shuttle)
New Haven, CT (Greater New Haven
Transit District, Regional Rides Program)
Washington, DC (Washington Area Metropolitan
Transportation Authority)
Miami, FL (Tri-Rail - South Florida Regional
Transportation Authority)25%
Orlando, FL (LYNX - Central Florida Regional
Transportation Authority)14%
Atlanta, GA (MARTA) 14%
Augusta, GA (Augusta Public Transportation) 25%
FIGURE 7 OPERATORS ENACTING OR PROPOSING SERVICE REDUCTIONS OR FARE INCREASES IN 2009

14
ST
RA
ND
ED
AT
TH
E S
TAT
ION
Location and OperatorService
Cuts
% Increase in Base
Fare
Honolulu, HI (Honolulu Dept. of
Transportation Services— The Bus)
13%
Arlington Heights, IL (PACE Suburban Bus) 17-40%
Chicago, IL (CTA) 14%
Chicago, IL (Northeast IL Regional
Commuter Railroad Corp--Metra)
Madison County, IL (Madison County Transit) 14-50%
Gary, IN (Gary Transit)
Gary (N. Lake County), IN (Northwest
Indiana Community Action Corp)
Indianapolis, IN (IndyGo) 17%
Topeka, KS (Topeka Metropolitan
Transit) Authority)
Louisville, KY (Transit Authority of
River City/TARC)
Baton Rouge, LA (CATS - Capital Area
Transit System)
Boston, MA (Massachusetts Bay
Transportation Authority)33%
Merrimack Valley Area, MA (Merrimack Valley Regional Transportation Authority)
Baltimore, MD (Maryland Transit Administration)
Cumberland, MD (Allegany County Transit)
Montgomery County, MD (Dept of Transportation -
same as Montgomery County Ride On)
Ann Arbor, MI (Ann Arbor
Transportation Authority)25%
Berrien County, MI (Berrien County Transit) 25%
Detroit Metro Area, MI (SMART) 33%
Chaska, MN (SouthWest Transit) 9-17%
Location and OperatorService
Cuts
% Increase in Base
Fare
Marshall, MN (Marshall Area Transit)
Twin Cities, MN (Metro Transit) 29%
Kansas City, MO (Kansas City Area
Transportation Authority) (KCATA)
20%
St. Louis, MO (St. Louis Regional Transit) 14%
Jackson, MS Jackson Public Transportation
(JATRAN)
Oxford, MS (OUT -
Oxford-University Transit)100%
Great Falls, MT (Great Falls Transit District)
Charlotte, NC (Charlotte Area Transit System)
Fargo, ND/Moorhead, MN (MAT - Metro Area Transit)
Albuquerque, NM (ABQ RIDE - City of Albuquerque Transit)
Las Vegas, NV (RTC - Regional Transportation
Commission of Southern Nevada)
40%
Reno, NV (Regional Transportation
Commission)
Binghamton, NY (BC Transit) 25%
Buffalo, NY (Niagara Frontier Transportation Authority: Metrobus Metro Rail)
17%
New York City Metro, NY (Long Island Rail Road) 6%
New York City Metro, NY (LI Bus) 13%
New York City Metro, NY (Metro North) 6%
New York City Metro, NY (NYC Transit) 13%
New York City Metro, NY (Staten Island Railway) 13%
Syracuse, NY (Centro) 25%
Cincinnati, OH (Southwest Ohio Regional
Transit Authority)
Cleveland, OH (Greater Cleveland Regional
Transit Authority)

ST
RA
ND
ED
AT T
HE
STAT
ION
15
Location and OperatorService
Cuts
% Increase in Base
Fare
Mansfield, OH (Richland County Transit) 50%
Tulsa, OK (Tulsa Transit) 20%
Eugene OR (Lane County Transit District)
Portland OR (TriMet)
Salem, OR (Salem Area Mass Transit)
Providence, RI (RIPTA)
Knoxville, TN (KAT - Knoxville Area Transit) 20%
Memphis, TN (MATA - Memphis Area Transit
Authority)
Austin, TX (Capital Metropolitan
Transportation Authority)
Dallas, TX (Dallas Area Rapid Transit) 17%
El Paso, TX (Sun Metro) 25%
San Antonio, TX (VIA Metropolitan Transit) 10%
Hampton Roads, VA (Hampton Roads Transit)
Burlington, VT (Chittenden Country
Transportation Authority)
Clark County/Vancouver, WA (C-Tran) 15%
Kitsap, WA (Kitsap Transit)
Olympia, WA (Intercity Transit) 33%
Seattle, WA (King County Metro Transit) 17%
Tacoma, WA (Pierce County Transit) 17%
Madison, WI (Metro Transit) 33%
Milwaukee, WI (Milwaukee County
Transit System)14%

16
ST
RA
ND
ED
AT
TH
E S
TAT
ION
ATLANTA, GEORGIA Unlike most American transit agencies, the Metropolitan Atlanta Rapid Transit Authority (MARTA) receives very little state funding; instead, it relies almost entirely on fare revenues and sales taxes. The State of Geor-gia does, however, have control over the agency. So when the legislature this spring refused to amend a law requiring that half of MARTA’s sales tax revenue be dedicated to capital—thereby denying the agency access to $65 million in its own capital reserve account—MARTA was left with few options. A deficit that had reached close to $70 million36 had already been reduced to $24 million,37 so the agency began planning for cuts including, remarkably, elimination of all service on either one entire weekday or on weekends.38 Fortunately, a deal was struck with the Atlanta Regional Commission to exchange MARTA capital funds for $25 million in federal stimulus funding.39 Still, fare and parking fee increases and cuts to more than 40 routes were required.40
BOSTON, MASSACHUSETTSNowhere in America can commuters save more money by taking transit than in Boston: $1,053 a month, according to a recent study by the American Public Transportation Association.41 They can for now, that is. Even after the legislature increased the sales tax to raise $160 mil-lion for the Massachusetts Bay Transportation Authority42 (also known as the MBTA, or simply the T), the agency faces a deficit this year of $180 million.43 This is largely due to flat revenues from existing sales taxes, which already accounted for half of T revenue, and service on a multibillion-dollar debt including capital projects required of the T as part of the Big Dig and other projects that the state would previ-ously have funded.44 The T would prefer to close the gap by raising fares 19.5 percent, but it would be the fourth time this decade Boston transit users have been asked to dig deeper. Alternately, service could be reduced, but the cuts would be deep: evening and weekend bus service and evening and mid-day subway service would be cut by half, week-end commuter rail service would be eliminated, and close to two dozen light and commuter rail stations would be shuttered. The T has already laid off workers and frozen wages (including, for a fourth straight year, the salaries of managers).45
CAPE COD, MASSACHUSETTSIn the spring of 2008, with gas prices not yet in the $4-a-gallon range but the economy already headed toward recession, the Cape Cod Re-gional Transit Authority doubled its cash fare and eliminated monthly passes. State funding had been reduced, and riders said they would rather pay higher fares than suffer reduced service. High fuel prices over the summer actually increased ridership for a time, and a year later, ridership was down only slightly. However, fares only account for about 10 percent of CCRTA’s budget, while state assistance accounts for over two-fifths. And with the state’s fiscal situation only getting worse,CCRTA was forced to begin planning for reductions in its peak-season, summertime service.46
Annual Trips: 158,590,900
MARTA
Annual Trips: 384,735,900
MBTA
Annual Trips: 778,430
CCRTA

ST
RA
ND
ED
AT T
HE
STAT
ION
17
CHICAGO, ILLINOISIn 2008 the Chicago Transit Authority, which had long labored under strict funding formulas,47 was bailed out. Regional sales taxes were increased, and local real estate transfer taxes were increased by 40 percent.48 That deal averted a “doomsday scenario” that might have resulted in elimination of more than half of CTA’s bus routes, cash fares as high as $3.25, and 2,400 layoffs.49 But then tax revenues decreased, and on January 1 of this year CTA was forced to elimi-nate 632 positions and raise its base fare from $2 to $2.25, and its monthly fare from $75 to $86.50 That still wasn’t enough, so in May the CTA board transferred $128.6 million earmarked for station upgrades and new buses to its operating budget.51 As of March, about 19 miles of Chicago’s “L” system remained under “slow zone” restric-tions, which require trains to slow to as little as 15 miles per hour due to rusty tracks and rotting ties.52
CLEVELAND, OHIOJust as problems in the Rust Belt city of Cleveland date back decades, problems at the Greater Cleveland Regional Transit Authority are not new: between 2001 and 2006, assistance from the State of Ohio de-clined 63 percent.53 But matters have gone from bad to worse lately. As in other places, ridership was up in 2008—the sixth straight year of growth in RTA’s case.54 But in 2008, the agency had to cut ser-vice – bringing total cuts since 2001 to 17 percent55 – and raise fares (although the fare increase was labeled a “fuel surcharge”).56 And in 2009, with sales taxes plummeting, RTA has proposed to cut service again, this time by about 6 percent.57 To add insult to injury, the state has cut transit funding by another 33 percent.58 Like virtually every other transit provider forced to reduce service, RTA has tried to target its cuts so that the fewest possible riders are affected. But while “un-productive” routes may make for relatively easy targets, every one of them is someone’s ride to work, to school or the doctor, or just to see friends or family—which may explain why 2,000 Clevelanders took time out to speak up against service cuts at hearings last August.59
COLORADO SPRINGS, COLORADOWhen falling revenue from sales taxes forced Mountain Metropolitan Transit to reduce service by one-quarter this winter and spring,60 a local TV reporter noted that “transit planners say the cuts are so deep they’re now frantically working to completely rebuild the whole bus system.” Or as one of those planners, Dave Menter, put it: “We’re cut-ting into the muscle.”61 Added rider Fred McCracken: “I’m out trans-portation. ... “I’ll have to walk two or three miles to catch another bus.” In the end, nearly a third of the agency’s route were eliminated, and Mountain Metro fares have been increased twice since 2007, from $1.25 to $1.75.62
Annual Trips: 526,336,500
CTA
Annual Trips: 57,287,100
RTA
Annual Trips: 3,742,885
Mountain Metro

18
ST
RA
ND
ED
AT
TH
E S
TAT
ION
CONTRA COSTA COUNTY, CALIFORNIACounty Connection, a bus operator in the suburban San Francisco Bay Area, cut service by 23 percent this spring—but that was only the beginning. “Stimulus money will keep us out of the ditch this year, but unless manna from heaven falls we’ll have to cut again the year af-ter that,” Director of Planning Anne Muzzini explained. “This wasn’t enough. It won’t be sustainable over a 10-year period … We have multiple problems. We sucked up our reserves.”63 For transit providers in America’s largest state, home to one out of eight Americans, those “multiple problems” include a major reduction in state funding for transit operations, including elimination of the State Transit Assis-tance (STA) program, a primary source of revenue for California op-erators. Over the past two years, the state has reduced transit funding by close to $3 billion,64 and the impacts are being felt by Californians like Gabe Griffith, a legally blind County Connection rider profiled in an Oakland Tribune story. Griffith told the Tribune that the cuts would regularly force him to walk a half-mile in the dark, on a street without sidewalks. “I don’t mind walking that far,” Griffith said, “but having to walk so far on a street without sidewalks in the dark is a safety issue for me.”65
EUGENE, OREGONLike many small transit operators, Lane Transit District doesn’t count on fares for much of its revenue: instead, it relies heavily on a payroll tax, which began to decline in 2008. In mid-2008, the LTD board considered putting a property tax proposal on the November ballot, but ultimately decided against taking that measure.66 Still, the agency ended up having to cut only a fraction of its service, thanks to some creative use of federal stimulus funds: it was able to spend capital funding on maintenance of its buses, an expense that ordinarily would be found on the operational side of the ledger. Then again, the American Recovery and Reinvestment Act was a one-time event, and the agency had previously been considering a 15 percent reduction in service.67
LYON, REDWOOD, AND JACKSON COUNTIES, MINNESOTA“Doomsday” budgets presented by transit agencies often include a fare increase of 25 or 30 percent. In rural southwestern Minnesota, the cost of a monthly pass good for unlimited rides recently increased from $25 to $80. The Western Community Action, the nonprofit that operates the Community Transit program serving the City of Marshall and Lyon, Redwood and Jackson counties, receives a com-bination of federal, motor vehicle sales tax, and state general funds in a grant from the Minnesota Department of Transportation to use for operations each year. In addition, the nonprofit has also relied on a grant from the Department of Human Services to subsidize the
Annual Trips: 4,380,712
County Connection
Annual Trips: 9,913,458
LTD
Annual Trips: N/A
Community Transit

ST
RA
ND
ED
AT T
HE
STAT
ION
19
monthly passes, a grant which was terminated in 2009. Although, the organization has received a 9.85% increase in operation funds from the state, the increase did not make up for the terminated grant and the organization was forced to raise fares. The monthly passes aren’t just popular with commuters; they are also popular with the elderly, as Transportation Director Jeanette Porter told a local reporter. “Se-niors really enjoy paying an affordable flat rate,” she explained, adding that “(p)ublic transit is really a vital service.”69
MADISON, WISCONSINFaced in December with a $762,000 deficit at Metro Transit and direction from the Mayor to raise base fares from $1.50 to $2, Madison’s Transit and Parking Commission chose not to go along,70 initiating a months-long debate over whether to raise fares or cut service. Metro responded by outlining the cuts that would be nec-essary if fares weren’t raised, including a reduction in the span of Sunday service from 16 hours to 8, elimination of all holiday service, reductions to 21 routes and the lay off of five drivers.71 The agency also said a fare increase would have little impact on ridership. Oppo-nents countered with research suggesting that a 33 percent increase in fares might reduce ridership by 14 percent.72 The mayor, meanwhile, offered a plan to provide discounted passes to low-income riders. In January, in a 5-4 vote, the commission approved a compromise 25-cent increase.73 But in February, the city council overrode that decision, approving a 50-cent increase despite “several hours of fierce outcry by most of the 50 community members who attended the public hearing,” as a newspaper article described it.74 The fare in-creases, which took effect in April, may be used to fund restoration of service that had previously been cut.75
MIAMI, FLORIDASouth Florida’s Tri-Rail commuter rail system was originally intended to provide an alternative for drivers during construction on parallel freeways in the late 1980s. But eventually the system was connected to all three of the region’s major airports, and in 2007, with ridership on the rise, service was increased by 25 percent.76 The move paid off: in the third quarter of 2008, ridership was up another 33 percent over the previous year,77 and in July of 2008, the Palm Beach Post declared that “a 2007 study on future parking needs at Tri-Rail’s 18 stations is already obsolete.”78 In 2009, however, the state continued to refuse to provide a dedicated source of funding for Tri-Rail—a $2 tax on rental cars—and frustrated local governments cut funding in response. Tri-Rail already planned to raise fares 25 percent79—its first increase since 1995—and it began contemplating cutting weekday service by 40 percent and eliminating weekend service altogether. As the Post put it: “Tri-Rail is in survival mode.”80 In the end, the agency was able to delay the cuts by using capital funds for operations, but the agency’s Executive Director described that move as “bartering away our future,” and the Post added that “(b)udgetary sleight-of-hand may buy Tri-Rail another year or two.”81
Annual Trips: 13,700,700
Metro Transit
Annual Trips: 4,780,000
Tri-Rail

20
ST
RA
ND
ED
AT
TH
E S
TAT
ION
NEW JERSEYNew Jersey Transit (NJ Transit, or NJT) is the nation’s largest public transportation provider without a dedicated source of funding for operations.82 So when the State of New Jersey proposed to cut its contribution by 17 percent—or $62 million—it amounted to a major problem for the agency.83 NJT was hesitant to cut service or raise fares, having already increased fares twice since 2005.84 So it cut costs aggressively—slicing administrative spending, which was 12 percent in 2002, to just eight percent.85 It eliminated 140 positions, and implemented hiring and wage freezes.86 Unfortunately, the agency also continued a longstanding practice of transferring several hundred million dollars per year from its capital budget—a practice that the Tri-State Transportation Campaign likened to putting the agency’s operating budget “on a credit card.”87 According to the Campaign, the primary source of that funding, the state’s Transportation Trust Fund, is on course to go bankrupt in 2011.88
NEW YORK, NEW YORKClose to one-third of all trips on American transit are taken on New York City trains and buses.89 So when the Metropolitan Transporta-tion Authority board responded this spring to a deficit estimated to be as much as $1.8 billion90 (including debt service on bonds issued for capital projects) by approving a so-called “doomsday” budget, that description was not hyperbole. Among other things, the budget would have eliminated two subway and 35 bus lines; increased cash fares on the subway and buses by 25 percent, to $2.50; increased the cost of a monthly MetroCard from $81 to $103; increased fares on Long Island Railroad and Metro-North commuter rail by 23 per-cent; and laid off 1,100 employees.91 While a state “bailout” package including payroll taxes, taxi surcharges, and higher vehicle registration and license fees has allowed MTA to avoid layoffs and service cuts this year, and to reduce fare increases to about 10 percent, additional fare increases will be necessary in 2011 and in 201392 ), and the MTA Capital Program, normally a five-year plan, is only funded for two. MTA revenues from real estate transaction taxes are projected to be more than a billion dollars less this year than they were just two years ago. 93
Annual Trips: 265,605,700
New Jersey Transit
Annual Trips: 3,392,249,500
MTA

ST
RA
ND
ED
AT T
HE
STAT
ION
21
ORANGE COUNTY, CALIFORNIAOrange County’s reputation as a place defined by its love for the automobile may be rooted in reality, but the county is also home to working-class, immigrant suburbs, and with nearly 66 million board-ings on its buses in 2008,94 the Orange County Transportation Au-thority is one of the nation’s largest transit providers. Or was: starting in 2008, OCTA has gone through multiple rounds of service cuts,95 and by next spring, it plans to eliminate 22 percent of its remaining service.96 In January, fares were increased,97 and the agency plans to lay off more than 200 front-line employees, including operators and maintenance workers. Like other transit operators in California and across America, it has been hit by a “double-whammy” of radically reduced state assistance and revenue from sales taxes.98
PHILADELPHIA, PENNSYLVANIARemarkably, the Southeastern Pennsylvania Transportation Author-ity, or SEPTA, is neither reducing service nor raising fares this year. This simple fact is notable because in 2007, when other American transit agencies were expanding service, SEPTA was proposing to cut service by 20 percent and increase fares by close to 25 percent—a plan described by a spokesperson as “the start of the dismantling of pub-lic transportation” in the region.99 The state established a designated source of funding, the Pennsylvania Public Transportation Trust Fund, which relies in part on tolls from Interstate 80. The future of the fund is unclear, however, as the Federal Highway Administration has so far refused to allow tolling on I-80. This could reduce revenues by $450 million a year.100
PHOENIX, ARIZONADecember 27, 2008, was a banner day in Phoenix transit history. That was the day the Valley of the Sun opened its first light rail line.101 But just two days later, in response to declining sales tax revenues, all bus service originating in the City of Phoenix before 5 a.m. and after 10 p.m. was discontinued, and Saturday service was reduced to Sunday levels.102 Then, in July, cash fares were increased by 40 percent.103
Annual Trips: 329,863,900
SEPTA
Annual Trips: 57,305,510
Valley Metro
Annual Trips: 70,266,572
OCTA

22
ST
RA
ND
ED
AT
TH
E S
TAT
ION
RENO, NEVADAIn 2008, Reno’s Regional Transit Commission cut service by nine per-cent104 and raised base fares from $1.75 to $2.105 In November, voters refused a one-eighth percent increase in the sales tax for RTC.106 In March, the agency’s senior management took a pay cut, and down-town shuttle and inter-city express service was cut.107 And in May, another round of cuts was carried out. Paratransit fares are also being increased in stages, from $1.75 to $3. RTC is heavily dependent on sales tax revenues, which have fallen by more than 25 percent since 2006.108
SACRAMENTO, CALIFORNIANot long ago, the typical cost of a monthly pass for local transit in America was $30, $40, or perhaps $50 (long-distance commuter rail passes are typically more expensive). In Sacramento, a city that is relatively affordable by coastal standards, a monthly pass good on Regional Transit District buses and light rail now costs $100.109 (by comparison, the cost of a monthly pass in New York is now $89, and in neighboring San Francisco it will soon be $60110). Until January 1, 2009, RT passes cost $85, but “RT could not absorb an $18.3 mil-lion raid by the state of California without asking our riders to pay more,” as General Manager Mike Wiley put it. That ongoing loss of state funding has since led to another round of fare increases planned for September, including an increase in the cash fare to $2.50, and additional cuts to bus service, which was already cut in 2008.111 While a regular transit rider paying $1,200 a year in fares would still save several thousand dollars compared to the full costs of auto ownership, so-called “out-of-pocket” costs for owning a car consist primarily of gas, parking and tolls. Other costs—insurance, monthly payments, and repair—are “hidden,” and often aren’t taken into account when calculating personal commute costs. The result: even when choice rid-ers could continue to save thousands of dollars by taking transit rather than driving, fare increases are often enough to drive them away.
ST. LOUIS, MISSOURINew York City’s budget deficit may have been much larger, but nowhere have the cuts experienced by transit riders in recent months been so dramatic as in St. Louis. In November, voters narrowly reject-ed additional funding for the Metro system. As a result, all service to 2,300 of Metro’s 9,000 bus stops was suspended;112 in all, 44 percent of bus service and 32 percent of light rail service was eliminated—cuts that the agency estimated would reduce annual ridership by 9.5 million.113 The agency also laid off nearly one-quarter of its staff, raised fares, and eliminated a fare-free zone in Downtown St. Louis.114 Ironically, in 2008 ridership on Metro buses grew by almost nine percent,115 one of the nation’s largest gains. Like other transit agencies reducing service, Metro cut its least “productive” routes, or those that
Annual Trips: 32,261,658
RT
Annual Trips: 55,949,100
Metro
Annual Trips: 9,331,900
RTC
ST
RA
ND
ED
AT T
HE
STAT
ION
23
are least cost-effective to operate. But even the least-productive route is still somebody’s lifeline. “To be saddled, to be imprisoned, that is what it is going to feel like,” Metro rider Stuart Falk told CNN’s John King when asked to describe the impact Metro cuts would have on him. “It is going to feel like being punished for something we didn’t do.”116 On August 3, using a federal grant and a one-time, emergency appropriation from the state, Metro was able to restore about one-third of the service that had been cut, including service to 2,000 of the 2,300 discontinued stops.117
TACOMA, WASHINGTONIn 2008, ridership at Pierce Transit grew 11 percent.118 Toward the end of the year, with revenue from sales taxes, which account for most of the agency’s budget,119 in something of a free fall, the agency elimi-nated more than 50 positions. On January 1, 2009, it raised fares. Finally, on July 12, it cut service by five percent.120 “We’ve never expe-rienced this kind of (revenue) decline in the history of Pierce Transit,” Chief Executive Lynne Griffith told a reporter in the spring. “We are doing everything we can to find ways to cut costs without impacting the public.” Or as Kelly Hayden, the agency’s director of planning, told another reporter: “It’s the perfect storm. ... The demand is up, but the resources to pay for it are going down.”
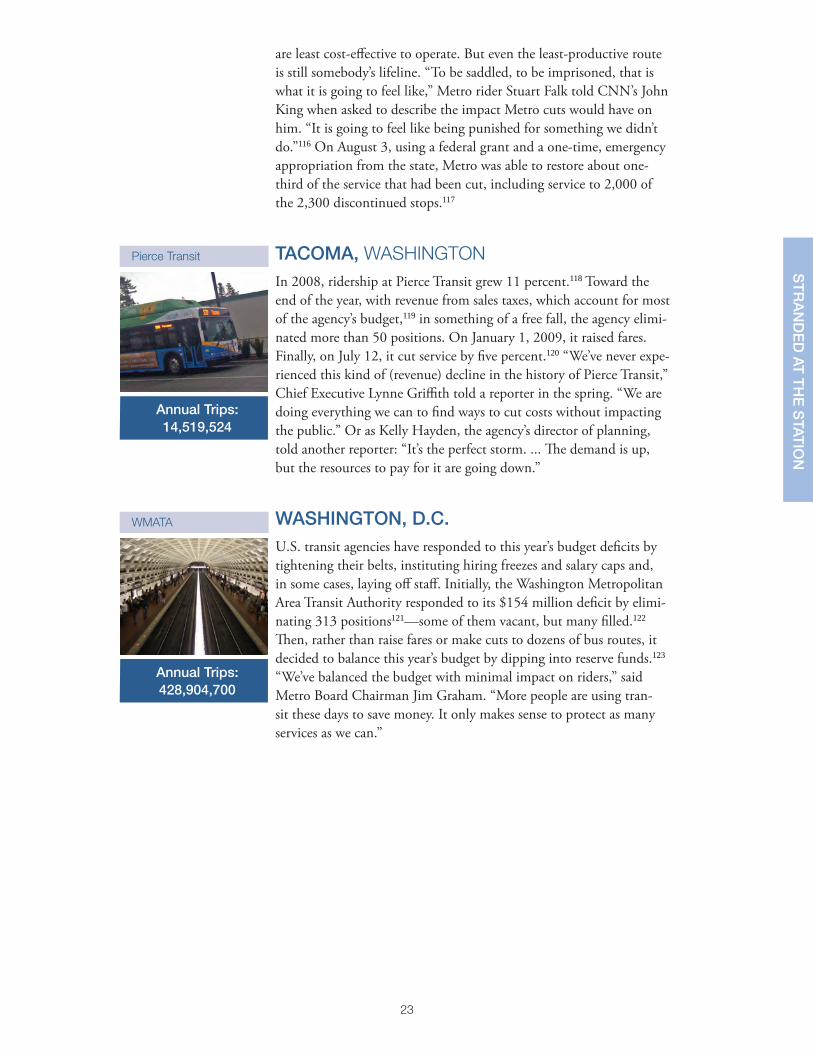
WASHINGTON, D.C.U.S. transit agencies have responded to this year’s budget deficits by tightening their belts, instituting hiring freezes and salary caps and, in some cases, laying off staff. Initially, the Washington Metropolitan Area Transit Authority responded to its $154 million deficit by elimi-nating 313 positions121—some of them vacant, but many filled.122 Then, rather than raise fares or make cuts to dozens of bus routes, it decided to balance this year’s budget by dipping into reserve funds.123 “We’ve balanced the budget with minimal impact on riders,” said Metro Board Chairman Jim Graham. “More people are using tran-sit these days to save money. It only makes sense to protect as many services as we can.”
Annual Trips: 14,519,524
Pierce Transit
Annual Trips: 428,904,700
WMATA

24
ST
RA
ND
ED
AT
TH
E S
TAT
ION
As these stories clearly show, public trans-portation agencies are doing everything they can to avoid imposing draconian impacts on the riders who rely on them. Already lean in most cases, they are slimming down further through innovative cost savings and taking all prudent measures to weather the cur-rent, prolonged storm. These essential ser-vice providers are no longer merely cutting “fat” – if there was much, if any, to cut – but
are eliminating lifeline services and raising fares for people who can ill afford it, especially now.
State and local governments and their taxpayers understand that they are the first line of sup-port. Some are stepping up to fill the budget gaps. But states, in particular, can do more to put their transit systems on a stable footing by providing more money, but also by giving agencies greater flexibility in allocating their resources and in tapping new sources of revenue.
The federal government should also play a role in the solution to this problem by providing greater flexibility, fairness, and funding in the next six-year transportation law. Increased federal support for transit and the flexibility to use transit resources more efficiently is critical if we are to realize the mobility, economic, health, and environmental benefits that transit provides. It is our hope that this report, which provides a national snapshot of the pain being felt by transit rid-ers across the country, will help serve as a catalyst for building a system that realizes the myriad benefits outlined above and creates a robust, resilient transportation network that works for all Americans.
CONCLUSION

ST
RA
ND
ED
AT T
HE
STAT
ION
25
1 American Public Transportation Association, “10.7 Billion Trips Taken On Public Transportation In 2008,” News Release, March 9, 2009.
2 American Public Transportation Association, “10.7 Billion Trips Taken On Public Transportation In 2008,” News Release, March 9, 2009.
3 http://www.t4america.org and http://www.apta.com
4 Bailey, Linda, Americans: Stranded without Options, Surface Transportation Policy Project, 2004.
5 American Public Transportation Association, “Public Transportation Ridership Surges As Gas Prices De-cline,” News Release, December 8, 2009.
6 Schrank, David and Lomax, Tim, The 2009 Urban Mobility Report, Texas Transportation Institute, 2009.
7 Cambridge Systematics, Inc. with Glen Weisbrod Associates, Inc., Public Transportation and the Na-tion’s Economy: A Quantitative Analysis of Public Transportation’s Economic Impact. Washington, D.C., 1999
8 American Public Transportation Association, 2008 Public Transportation Fact Book, 2009.
9 American Public Transportation Association, “More Than $8,600 Saved Annually by Individuals Who Seek to ‘Ride Out’ the Rough Economy by Riding Public Transportation,” News Release, May 6, 2009.
10 American Automobile Association, Your Driving Costs, 2007 Edition, 2007.
11 Center for Neighborhood Technology “Housing and Transportation Affordability Index” website, http://htaindex.cnt.org/.
12 U.S. Bureau of Transportation Statistics, Transporta-tion Statistics Annual Report, 2006.
13 Center for Housing Policy, A Heavy Load: The Com-bined Housing and Transportation Burdens of Work-ing Families, 2006.
14 Litman, Todd, Evaluating Transportation Equity, Vic-toria Transport Policy Institute, 2007.
15 Federal Highway Administration, Addendum to the 1997 Federal Highway Cost Allocation Study Final Report, 2000.
16 Shapiro, Robert J., Hassett, Kevin A., and Arnold, Frank S., Conserving Energy and Preserving the Environment, American Public Transportation Asso-ciation, 2002.
17 Edwards, Ryan D., Public Transit, Walking, and Health: Assessing the Magnitudes, Queens College, City University of New York, 2007.
18 National Highway Traffic Safety Administration, “Fa-tality Analysis Report Systems (FARS) Encyclopedia” website, http://www-fars.nhtsa.dot.gov.
19 American Automobile Association, Crashes vs. Con-gestion: What’s the Cost to Society? 2008.
20 National Safety Council, Injury Facts, 2007 Edition, 2007.
21 United States Environmental Protection Agency.
22 United Nations Intergovernmental Panel on Climate Change, Climate Change 2007: Synthesis Report, 2007.
23 ICF International, The Broader Connection Between Public Transportation, Energy Conservation and Greenhouse Gas Reduction, 2008.
24 Shapiro, Robert J., Hassett, Kevin A., and Arnold, Frank S., Conserving Energy and Preserving the Environment, American Public Transportation Asso-ciation, 2002.
25 American Public Transportation Association, A Pro-file of Public Transportation Passenger Demograph-ics and Travel Characteristics, 2007
26 Pucher, John, and Renne, John, L., Socioeconom-ics of Urban Travel: Evidence from the 2001 NHTS, Transportation Quarterly, 2003.
27 Pucher, John, and Renne, John, L., Socioeconom-ics of Urban Travel: Evidence from the 2001 NHTS, Transportation Quarterly, 2003.
28 http://www.pbs.org/newshour/bb/business/jan-june09/transit_03-09.html
29 http://westcat.org
30 City of Hercules, “WestCAT to release new schedule with route and fare changes,” News Release, Sept. 22, 2008.
31 San Diego Metropolitan Transit System, “Actions to Address California Budget Cuts for Transit” web-page, http://www.sdmts.com/Marketing/Californi-aBudgetThreatensTransit.asp.
32 City of Hercules, “New WestCAT Bus Schedules, New Hercules Transit Center – Spring 2009,” News Release, March 13, 2009.
33 Oakland Tribune, “WestCAT to cut service but main-tain fares,” March 24, 2009.
34 American Public Transportation Association, “Chal-lenge of State and Local Funding Constraints on Transit Systems: Effects on Service, Fares, Employ-ment and Ridership” Survey, June 2009.
35 First, deficits are a “moving target,” as revenue projections are often revised and adjustments are made over the course of the budgetary process. Second, some transit operators are also larger mul-timodal transportation agencies, so budgets include some non-transit costs. Third, “operating” budgets for some agencies include debt service on bonds issued for capital projects. Fourth, research was based largely on readily available information, such as newspaper accounts.
ENDNOTES

26
ST
RA
ND
ED
AT
TH
E S
TAT
ION
36 Creative Loafing, “2009 Georgia General Assembly struggles with budget, gridlock,” Jan. 19, 2009.
37 Atlanta Business Chronicle, “MARTA board asks governor for special session,” April 6, 2009.
38 Atlanta Journal-Constitution, “MARTA may cut ser-vice one day a week, chief says,” March 24, 2009.
39 Metropolitan Atlanta Rapid Transit Authority, “Atlanta Regional Commission Approves Reallocation of $25 Million of Federal Stimulus Funds to MARTA,” News Release, May 27, 2009.
40 Creative Loafing, “MARTA service cuts start August 15,” Aug. 7, 2009.
41 American Public Transportation Association, “More Than $8,600 Saved Annually by Individuals Who Seek to ‘Ride Out’ the Rough Economy by Riding Public Transportation,” News Release, May 6, 2009.
42 The Enterprise (Brockton, Mass.), “After getting $160 million from sales tax, MBTA proposes fare increase,” July 9, 2009.
43 Boston Globe, “Getting the T back on track,” July 11, 2009
44 Massachusetts Bay Transportation Authority, “Your Service, Your Choice,” Promotional Material, 2009.
45 Boston Globe, “Aloisi promises a better MBTA,” Aug. 8, 2009.
46 Telephone interview with Joseph Potzka, CCRTA Administrator, May 14, 2009.
47 Chicago Weekly, “Doomsday: The CTA’s decades-long death throes,” Nov. 14, 2007.
48 Chicago Tribune, “City Council boosts real estate transfer tax, want vets to get free rides,” Feb. 6, 2008.
49 Chicago Tribune, “Mass-transit ‘doomsday’ looms yet again,” Feb. 16, 2009.
50 Chicago Tribune, “CTA board approves fare raises,” Nov. 14, 2008.
51 CTA Tattler, “CTA avoids fare hikes by using capital funds to balance budget,” May 18, 2009.
52 Chicago Tribune, “CTA slow zones: More CTA trains are going slower than last year,” March 19, 2009.
53 Greater Cleveland Regional Transit Authority, “Inside RTA” newsletter, October 2006.
54 Greater Cleveland Regional Transit Authority, “RTA ridership up for record sixth straight year,” News Release, Jan. 13, 2009.
55 E-mail from Joseph Calabrese, GCRTA CEO/GM, Apr. 22, 2009.
56 Cleveland Plain Dealer, “Regional Transit Authority fares to go up Oct. 27,” Oct. 14, 2008.
57 Progressive Railroading, “Greater Cleveland RTA might cut service, but sidestep fare hike,” July 20, 2009.
58 Lakewood Sun Post, “RTA cuts threaten Circulator,” July 23, 2009
59 Salon.com, “Who says Americans won’t ride mass transit?” Oct. 23, 2008.
60 Colorado Springs Independent, “In the clutches,” April 9, 2009.
61 KRDO-TV, “Route Cuts on the Way for City Buses,” Feb. 24, 2009.
62 City of Colorado Springs, Memorandum from Ronald Mitchell, Public Works Director, and Sherry Ritenour, Transit Services Division Manager, Nov. 27, 2007.
63 Telephone interview with Anne Muzzini, County Con-nection Director of Planning, Apr. 29, 2009.
64 SF.Streetsblog.org, “Advocates Launch Effort to Restore State Transit Funding,” Feb. 20, 2009.
65 Oakland Tribune, “Service cuts proposed for County Connection buses,” Nov. 14, 2008.
66 The Register Guard (Eugene, Ore.), “LTD stays on its route,” Aug. 1, 2008.
67 E-mail from Andy Vobora, LTD Director of Service Planning, Accessibility, and Marketing, Apr. 24, 2009.
68 Star Tribune (Minneapolis, Minn.), “Backed into a budget corner, bus systems to tap reserves,” July 19, 2009.
69 The Independent (Marshall, Minn.), “Economy hinders plans for area transit programs,” Jan. 10, 2009.
70 The Daily Cardinal (University of Wisconsin-Mad-ison), “City commission votes against Madison Metro fare increase,” Dec. 10, 2008.
71 Madison Metro Transit, Memorandum from Chuck Kamp, General Transit Manager, Jan. 7, 2009
72 The Daily Page (Madison, Wisc.), “This is the wrong time to make public transit more expensive,” Feb. 19, 2009.
73 The Capital Times (Madison, Wisc.), “Bus fare in-crease of 25 cents approved,” Jan. 14, 2009.
74 The Badger Herald (University of Wisconsin-Madi-son), “Council raises bus fare to $2,” Feb. 25, 2009.
75 Wisconsin State Journal, “Metro Transit may use added revenue to increase service,” May 12, 2009.
76 South Florida Regional Transportation Authority, “Tri-Rail Inaugurates Additional Train Service June 4,” News Release, May 30, 2007.
77 South Florida Regional Transportation Authority, “Tri-Rail Continues to be National Leader in Ridership Growth,” News Release, Dec. 9, 2008.

ST
RA
ND
ED
AT T
HE
STAT
ION
27
78 Palm Beach Post, “Tri-Rail parking worsens as rider-ship rises,” June 27, 2008.
79 South Florida Regional Transportation Authority, “Tri-Rail to Increase Fares as of June 1,” News Release, April 30, 2009.
80 Palm Beach Post, “Tri-Rail’s hopes for emergency state money are dashed,” May 5, 2009
81 Palm Beach Post, “Buying a ticket to oblivion,” July 5, 2009
82 Tri-State Transportation Campaign “Mobilizing the Region” blog, “Along Among Big Transit Agencies, NJ Transit Lacks Dedicated Operating Funds,” July 17, 2009.
83 The Star-Ledger (Newark, N.J.), “NJ Transit loses $62M in Corzine’s budget,” April 9, 2009.
84 WCBS-TV, “N.J. Transit Fare Increase to Begin Fri-day,” May 30, 2007.
85 New Jersey Transit, “NJ Transit Adopts FY 2009 Operating, Capital Budgets,” News Release, July 9, 2008.
86 The Star-Ledger (Newark, N.J.), “No fare hike for NJ Transit this year,” April 28, 2009.
87 Tri-State Transportation Campaign “Mobilizing the Region” blog, “Trenton Forcing NJ Transit to Rob Peter to Pay Paul,” April 28, 2009.
88 Tri-State Transportation Campaign “Mobilizing the Region” blog, “NJ Transit Keeps the Fare Steady – For Now,” April 29, 2009.
89 American Public Transportation Association, Quar-terly Transit Ridership Reports, Fourth Quarter, 2008
90 The New York Times, “As Revenue Falls, M.T.A.’s Deficit Could Rise by $650 Million,” Feb. 23, 2009.
91 WINS-AM Radio, “MTA Green Lights Doomsday Budget; Fares Rise from $2 to $2.50,” March 25, 2009
92 Newsday (New York, N.Y.), “MTA bailout deal reached,” May 5, 2009.
93 Metropolitan Transportation Authority, “MTA 2010 Preliminary Budget – July Financial Plan 2010-2013 Presentation to the Board,” Presentation, 2009.
94 American Public Transportation Association, Quar-terly Transit Ridership Reports, Fourth Quarter, 2008
95 Orange County Register, “County transit slashes bus service, cuts 400 jobs,” March 23, 2009.
96 Orange County Register, “Big chunk of bus service to be cut in March,” July 13, 2009.
97 Orange County Register, “Bus fares rise today,” Jan. 5, 2009.
98 Orange County Transportation Authority, “Budget Crisis Communications” webpage, http://www.octa.net/buscrisis.aspx.
99 The Daily Pennsylvanian (University of Pennsylvania), “SEPTA budget nearing big crisis,” May 31, 2007.
100 Pittsburgh Post-Gazette, “I-80 toll proposal nears critical time,” July 31, 2009.
101 The Arizona Republic, “Today’s light-rail system opening marks milestone for the Valley,” Dec. 27, 2008.
102 Valley Metro, “New Transit Book Details Change in Service,” News Release, Dec. 1, 2008.
103 Valley Metro, “New Fares for Bus and Rail Transit Riders on July 1,” News Release, June 1, 2009.
104 Washoe County, Nevada, Ballot Question Informa-tion, “RTC #2,” 2008.
105 KRNV-TV, “RTC Washoe raises fares, cuts services,” March 21, 2008.
106 The Nevada Sagebrush (University of Nevada, Reno), “RTC cuts change routes,” Feb. 3, 2009.
107 Reno Gazette-Journal, “RTC officials to take pay cut,” March 10, 2009
108 KRNV-TV, “RTC transit cuts coming Sunday,” May 1, 2009.
109 Sacramento Business Journal, “RT to raise fares to make up for state shortfall,” Nov. 6, 2008.
110 KPIX-TV, “SF Supervisors Approve Big Muni Fare Hike,” May 13, 2009.
111 Sacramento Regional Transit District, “RT Board ap-proves fare and service changes” webpage, http://www.sacrt.com/servicechange09.stm.
112 Bi-State Development Agency, “Metro Begins Bus Stop Cover Installation Today,” News Release, Feb. 20, 2009.
113 St. Louis Business Journal, “Metro to lay off 600, cut service,” Dec. 19, 2008.
114 Bi-State Development Agency, “New Fares, Includ-ing Discontinued Ride-Free Zone, Effective January 1, 2009,” News Release, Jan. 1, 2009.
115 American Public Transportation Association, “10.7 Billion Trips Taken On Public Transportation In 2008,” News Release, March 9, 2009.
116 CNN, “Bus route closing devastates disabled cou-ple,” March 27, 2009.
117 Bi-State Development Agency, “Metro Prepares for August 3 Restoration,” News Release, July 27, 2009.
118 Pierce Transit, “Pierce Transit Bus Ridership Fig-ures,” News Release, March 9, 2009.
119 The News Tribune (Tacoma, Wash.), “Pierce Transit mulls bus service cuts as revenue plummets,” Feb. 6, 2009.
120 Associated Press, “Pierce Transit forced to cut ser-vice,” June 30, 2009.

28
ST
RA
ND
ED
AT
TH
E S
TAT
ION
Cover image of closed bus stop from Richard Keeling
MARTAJoel Mann (Flickr)http://creativecommons.org/licenses/by-nd/2.0/
MBTArawheadrex (Flickr)http://creativecommons.org/licenses/by-sa/2.0/
Cape Codtedkerwin (Flickr)http://creativecommons.org/licenses/by/2.0/
CTAKM Photography (Flickr)http://creativecommons.org/licenses/by/2.0/
Cleveland RTANovaBus LFS (Wikipedia)http://creativecommons.org/licenses/by/3.0/
Colorado SpringsNelson\Nygaard
County ConnectionMmyslin (Wikipedia)Public Domain
Eugene LTDfunctoruser (Flickr)http://creativecommons.org/licenses/by-sa/2.0/
Madison Metro Transitrocketjim54 (Flickr)http://creativecommons.org/licenses/by/2.0/
Tri-RailCary Bass (Wikipedia)http://en.wikipedia.org/wiki/GNU_Free_Documentation_License
New Jersey TransitChristopher & AmyCate (Flickr)http://creativecommons.org/licenses/by-nd/2.0/
NYCMTAEdgar Zuniga Jr. (Flickr)http://creativecommons.org/licenses/by-nd/2.0/
OCTAMatthew Jude Brown (Wikipedia)http://creativecommons.org/licenses/by-sa/3.0/
SEPTAjpmueller99 (Flickr)http://creativecommons.org/licenses/by/2.0/
Valley MetroMsr69er (Wikipedia)Public Domain
RenoParaflyer (Flickr)http://creativecommons.org/licenses/by-nd/2.0/
Sacramento RTpaulkimo9 (Flickr)http://creativecommons.org/licenses/by/2.0/
St. Louis MetroMatthew Black (Wikipedia)http://creativecommons.org/licenses/by-sa/2.0/
Pierce Transitragglesoft (Flickr)http://creativecommons.org/licenses/by-sa/2.0/deed.en
WMATAMr. T in DChttp://creativecommons.org/licenses/by-nd/2.0/
Page 20rakastajatar (Flickr)http://creativecommons.org/licenses/by-nd/2.0/
Back CoverSeattle Municipal Archives (Flickr)http://creativecommons.org/licenses/by/2.0/
PHOTO CREDITS
121 Washington Metropolitan Area Transit Authority, “Metro LunchTalk Online” chat with General Man-ager John Catoe, May 1, 2009.
122 Washington Examiner, “Metro issues about 40 pink slips; more to come,” Feb. 27, 2009.
123 Washington Metropolitan Area Transit Authority, “Few bus service cuts for Metro riders,” News Re-lease, April 30, 2009.

STRANDED AT THE STATIONREPORT