community group member survey: using the results
TRANSCRIPT

August 1998
G3658-9
University of Wisconsin-ExtensionCooperative Extension
Madison, Wisconsin
Community Group MemberSurvey: Using the Results

Funding for the development and production of these materials was provided through anInnovative Program Grant. The work team included Mary Ellen Bell, Susan Futterer, MaryGruenewald, Karen Hintz, Mary Fran Lepeska, Ann McLean, Peggy Nordgren, Pat Rychter,
and Ellen Taylor-Powell.
These materials grew out of an effort dating to late 1996 when Mary Fran Lepeska and AnnMcLean, co-chairs of the Community Partnership sub-committee, within the Parent Supportand Community Partnerships Theme Group in Family Living, initiated a process for collectingdata that would tell a statewide stsory about the impact of Family Living’s work withcommunity groups. During the spring of 1997, a work team developed a survey instrumentthat was pilot tested at eight sites. The instrument was revised and instructions developed forwidespread distribution and use of the Community Group Member Survey by October 1997. Atthat time, assistance was requested through the Dean’s Innovative Program Grants initiative todevelop materials that would assist users of the survey to interpret their survey data andcommunicate their results with a variety of stakeholders. This compilation of materials is theresult.
An EEO/Affirmative Action employer, University of Wisconsin-Extension provides equalopportunities in employment and programming, including Title IX and ADA requirements.Requests for reasonable accommodation for disabilities or limitations should be made prior tothe date of the program or activity for which it is needed. Publications are available inalternative formats upon request. Please make such requests as early as possible by contactingyour county Extension office so proper arrangements can be made.
This document and other resources on evaluation and collaboratives may be found on the website of the Program Development and Evaluation Unit of the University of Wisconsin-Extension-Cooperative Extension at http://www.uwex.edu/ces/pdande/
Program Development and Evaluation Family Living Programs613 Extension Building 637 Extension Building432 N. Lake Street 432 N. Lake StreetMadison, WI 53706-1498 Madison, WI 53706-1498

CONTENTS
Background
Section 1: Using Survey Results within the Community Group
Overview
Report: Using Survey Results within the Community Group
Survey instrument
Section 2: Using Survey Results with External Audiences
Overview
Tip Sheets
1. Developing a public information campaign2. Sending clear and consistent message3. Working with the media4. Targeting audiences and anticipating questions
Samples
1. Short report2. Press releases (2)3. Impact statement4. Grant request
Section 3: Presentation Materials
Charts
PowerPoint Display
Artwork

Background
During 1997 a group of family living educators of UW-Extension-Cooperative Extensionrecognized the need to design a survey instrument to assess the work being done by communitygroups around the state. Extension educators found themselves increasingly involved inpartnerships searching for ways to help solve problems facing families and communities. Muchtime and effort was going into community group work. Those involved wanted a way todocument their achievements, communicate their progress and help ensure that the groups wouldachieve their visions.
Consequently, the Cooperative Extension educators designed a survey instrument for communitygroup members to use in assessing their progress and outcomes. They used the growing researchon community-based initiatives and their own experiences to determine the most significantquestions to include in the survey. The instrument was pilot tested in eight counties with 9community groups. Suggested modifications were made. The instrument is one, of a variety ofdata collection procedures, for evaluating progress and outcomes.
Beginning in early 1998, interested community groups began using the survey. Group memberscomplete the questionnaire and data are analyzed. But appropriate interpretation and use ofsurvey data are critical if the assessment process is to be of benefit. This manual is to help groupsunderstand and interpret their data. It is to help groups use their results internally to improvegroup performance and externally to communicate their work and promote the group amongothers.
The results of the survey have a variety of uses:
A. Internally within the group
• To identify strengths, aspects or achievements to celebrate• To identify areas needing attention or improvement• To help clarify issues and/or build consensus• To provide direction, inform group decision making
B. Externally with others
• To promote the group within the community• To increase understanding of the group’s work• To communicate within one’s own agency• To use in grant applications or funding requests• To build group visibility in the community• To recruit members
For more ideas and research information related to evaluating community groups, refer toUniversity of Wisconsin-Cooperative Extension publication G3658-8, EvaluatingCollaboratives: Reaching the Potential, July 1998 available from your Wisconsin CountyExtension Office or from Cooperative Extension Publications, Rm 170, 630 W. Mifflin St.,Madison, Wisconsin 53703. Phone 608-262-3346. http://www.uwex.edu/ces/pdande/

SECTION 1
Using Survey Results within the Community Group
• Overview
• Report: Using Survey Resultswithin the Community Group
• Survey Questionnaire

Overview
The following report is an example only. The data are taken from several groups and do notrepresent any one group. It illustrates a comprehensive report that can be used to promotelearning and action within the group. Having the group itself engage in data interpretation andreport development builds understanding and commitment. For maximum benefit, it will beimportant to spend time with your data and the information provided in this example report.
The report is organized by survey question. Under each question, there are 4 sections:
1. Research relevant to the question2. Results, presented in graphical display. Sometimes several graphical options are
offered.3. Key findings4. Discussion questions to stimulate group discussion and action. Questions need to
be selected as appropriate to the results and the community group
How to use this report
You may wish to develop a report very similar to this one using your group's own data. Or, youmay wish to adapt this model. You can shorten this report in any number of ways. You may wishto focus on a few questions, rather than all the survey questions. You might use other charts andtables or use all frequencies rather than percentages. You might discuss a few questions over aseries of meetings. Or, a full educational program might be developed combining your surveyresults with other resources to address the learning needs of your community group.
Response Rate
Look at the response rate for your community group survey and determine the most appropriateway to talk about your survey data. Unless all members of the group completed a questionnaire,it will be unwise to generalize. Learn from the responses given but do not generalize to allmembers.

Fruit CountyHealthier Partnership
Community Group Member Survey:Results and Discussion
July 1998
“Together We Can Make A Difference”

Fruit CountyHealthier Partnership
Community Group Member Survey:Results and Discussion
Prepared by:
Andrea Apple, Family Living EducatorUniversity of Wisconsin-Cooperative Extension, Fruit County
Michael Mellon, CoordinatorUnited Way, Fruit County
Cheryl CherryParent Volunteer, Fruit County
UWEX SpecialistUniversity of Wisconsin-Cooperative Extension
Madison, Wisconsin
For further information contact:Andrea Apple, Family Living Agent
Fruit County62 Church StreetCold, WI 41230123-456-7890

Table of Contents
Executive Summary ................................................................................................. i
Purpose of survey ................................................................................................... iii
Question 1 ............................................................................................................... 1
Question 2 ............................................................................................................... 2
Question 3 ............................................................................................................... 6
Question 4 ............................................................................................................... 8
Question 5 ............................................................................................................. 11
Question 6 ............................................................................................................. 13
Question 7 ............................................................................................................. 16
Question 8 ............................................................................................................. 19
Question 9 ............................................................................................................. 20
Question 10 ........................................................................................................... 24
Question 11 ........................................................................................................... 26
Question 12 ........................................................................................................... 31
Question 13 ........................................................................................................... 32
Questions 14, 15, 16.............................................................................................. 34
References ............................................................................................................. 35

COMMUNITY GROUP MEMBER SURVEY: RESULTS AND DISCUSSION i
Executive Summary
During the spring of 1998 the Fruit County Healthier Partnership undertook a survey of itsmembers to assess how well the group is functioning and the outcomes it is achieving. Using aresearch-based survey questionnaire developed by University of Wisconsin-CooperativeExtension, the group asked all members to participate. Thirteen of fifteen members responded tothe survey. The results will be used to help improve our work and ensure that the desired impactsare achieved.
What Did We Learn
How a group functions directly affects what the group accomplishes. Many factors influence theability of the group to function effectively. The survey looked specifically at a number of factorsthat have been identified as influencing the effectiveness of community-based initiatives. Asummary of the findings follow:
• Not everyone envisions the same purpose for the group. Because having anunderstood mission that is agreed upon is so important, the group needs to clarifythe diversity in perspective that exists.
• Ten community sectors are represented in the membership, indicating that thegroup has achieved broad representation. Just over half of the members arevolunteers.
• Members have been participating in the group from 5 to 28 months. It appears thatthe group is able to recruit new members as well as maintain some stability inmembership. The average length of participation is nearly 16 months indicatingthe level of commitment that exists. Members commit an average of 20 hours amonth to group work. There is considerable range in time allocation, however,from 2-72 hours per person per month.
• All members view themselves as actively engaged and sharing in leadership of thegroup. Member involvement has increased over time as expected.
• Members rated group functioning fairly well across a variety of aspects. Highestratings were given to making inter-organizational links and developing groupprocedures. Lowest ratings were given to listening to minority views andcommunicating all views, signaling areas for attention.
• Members feel valued and comfortable in the group but several are somewhatdissatisfied with the group’s progress; again, another area for attention.
A community group may achieve a variety of outcomes. Most usually we think of outcomes asimprovements for the clientele or participants of a group-initiated program. Often, however,benefits also accrue for the individual members who work in the community group. Benefits alsomay occur for sponsoring agencies and ultimately for the community in general. Thequestionnaire asked members to think about a range of possible outcomes. Members’ responsesfollow:

COMMUNITY GROUP MEMBER SURVEY: RESULTS AND DISCUSSION ii
• All members indicate that the group has had a significant impact of them, mostnotably in terms of an increased understanding of community needs and assetsand having the sense that together they can make a difference. Members felt thelowest impact in the areas of grant writing, influencing local policies andresolving conflict within the group.
• A number of positive outcomes have resulted that benefit the community. Theseinclude• the new family resource center,• changes in the YMCA to meet youth needs,• improved community planning• networking within the community.
• The group’s work, however, is not done. Nearly all members feel the group iscontinuing to work on the priority community need, and is helping set communitydirection and build community cohesion.
Next Steps
We will continue to review the findings of the survey and discuss the implications for our groupwork. A retreat is planned for summer 1998 to fully review the results, the materials received anddecide upon an action plan.

COMMUNITY GROUP MEMBER SURVEY: RESULTS AND DISCUSSION iii
Purpose of the Survey
Healthier Partnership started in 1996 to build healthy families throughout all of Fruit County. Agroup of concerned people came together to respond to the urgent needs of families who findthemselves dealing with alcohol and drug abuse, divorce, child care, health care and disengagedyouth. Starting with a core of 5 individuals, the group has grown to include 15 membersrepresenting parents, business, health, seniors, government law enforcement, UW-Extension,social services, day care, and youth. We are dedicated to making our families stronger.
But good intentions do not always lead to desired results. The group has been working for overtwo years so there was interest in its effectiveness, efficiency and outcomes. Are memberssatisfied with the group’s progress? Is the group functioning well? Are Fruit county familiesbetter off as a result of our work? Using a research-based survey instrument developed byUniversity of Wisconsin-Cooperative Extension, the group decided to undertake an assessmentof its process, progress and outcomes. It was felt that the results of the survey would help thegroup improve its performance and provide documented evidence of results to share with others.
How the survey was conducted
All members present at the March 1998 meeting completed a questionnaire. Absent memberswere mailed the questionnaire and asked to return it. Thirteen of fifteen members completed thequestionnaire. The UW-Cooperative Extension family living educator compiled thequestionnaires and sent them to Madison for data processing. Data were analyzed using SPSS,Statistical Package for the Social Sciences, and the results returned to the group. The familyliving educator then chaired a committee that reviewed the data, interpreted the findings andprepared the following report.
Because not all members completed the questionnaire, the results reflect the opinions andperceptions of thirteen of its members.

COMMUNITY GROUP MEMBER SURVEY: RESULTS AND DISCUSSION 1
QUESTION 1 Which of the following best describes ourcommunity group?
Purpose and characteristics of community groups vary. All groups may be working towardhelping to solve a community issue or problem, but the extent to which groups share resourcesand develop a common identity differ. Some groups exist primarily to share information. Othersexist to achieve a common vision. Research tells us that group work is affected by the extent towhich group members have similar understandings of the purpose and expectations of the group(Winer and Ray, 1994; Mattessich and Monsey, 1992).
Names given to community groups distinguish them by purpose and structure. They might beknown as:
• Networks: Members interact primarily for the purpose of exchanging information andcommunication.
• Partnerships: Members provide helpful resources to support each others’ interests andgoals. There is some joint planning and activity, but resources are separate.
• Coalitions: Members work together on goals that are complementary. There iscoordination and some sharing of resources.
• Collaboration: Members share (or are working toward) a common vision that linksdiverse interests. Actions are jointly created and resources, authority and decisionmaking are controlled in the group.
The list above suggests a continuum—from less sharing to more sharing, from networking tocollaboration. Not all groups need to function as a collaborative. Sometimes, they need only toexchange information and communicate. What is important is that members understand thepurpose of the group. It is important to have goals and objectives that are clear to all membersand which can be realistically achieved. Groups in which members understand and agree upontheir mission and purpose will function more effectively than groups that do not.
ResultsMembers' description of group type
Coalition
31%
Partnership
15%
Network
0%
Collaborative54%

COMMUNITY GROUP MEMBER SURVEY: RESULTS AND DISCUSSION 2
Key Findings
• Just over half (54%) of the members who responded to this survey viewthemselves as sharing (or working toward) a common vision where the groupmight be called a collaborative.
• Almost a third (31%) of the respondents view themselves as havingcomplementary goals where the group might be called a coalition.
• A diversity in perspective exists.
Discussion Questions
1. Review the response options listed in Question 1. What do these options mean tomembers? How did members interpret these words?
2. Do the results indicate that members understand the group’s purpose differently ordid members merely interpret the words differently?
3. What is the reason for the way members responded?
4. What do the key findings tell us about our community group?
5. Based on our group’s mission and purpose, what type of community group do wewant to be, now and in the future?
Note: Use this question to facilitate discussion and common understanding of thegroup’s purpose

COMMUNITY GROUP MEMBER SURVEY: RESULTS AND DISCUSSION 3
QUESTION 2 Who do you primarily represent as a memberof this group?
Community groups often work on complex problems affecting families, youth, or the elderly.These problems do not affect just one individual or one family. Nor can they be resolved by oneindividual or one group. A basic feature of collaborative work is the power that comes byworking together, across diverse perspectives.
Research tells us that community-based initiatives are more effective when all key perspectivesare represented. Who members represent and the diversity within the group affects groupfunctioning, access to resources and outcomes. The number of community sectors representedaffects the number of activities completed and resource mobilization (Kegler, 1995). Anindividual may represent several interest groups. Or, they may be connected to (influenced by orinfluence) interests and resources outside the group itself. Likewise, it is possible to be involvedor have one’s interests represented without being a member of the group. Not all stakeholders areable or willing to participate as group members. The most important matter is that all voices areheard through a conscious and systematic process.
Because groups evolve and develop, membership does not remain static. Certain interests andexpertise may be more pertinent at certain times. Individuals can bring key perspectives orexpertise when needed through short-term assignments or as members of ad hoc committees ortask forces.
The response to this question gives a portrait of the group’s composition at the time of thesurvey. It indicates the scope of representation and whether some professions or interests areunder-represented. Because some members may represent more than one interest—parent as wellas a health professional, for example—who the member is actually speaking for may need to beclarified. The member’s affiliation and allegiance is likely to influence his or her responses toother questions in the survey.

COMMUNITY GROUP MEMBER SURVEY: RESULTS AND DISCUSSION 4
Results
Group composition
% of members
0% 5% 10% 15% 20% 25%
3 members
2 members
1 member
1 member
1 member
1 member
1 member
1 member
1 member
1 memberYouth
Senior Citizen
Public Social Services
Private Non-Profit Social Services
Mental Health
Law Enforcement
Elected Official
Business
Day care/Child Care/Head Start
Health/Medical 23%
15%
8%
8%
8%
8%
8%
8%
8%
8%
Key Findings
• Ten different groups or interests are represented by the responding members.
• Highest representation is from the health sector.
Discussion Questions
1. What is the issue or concern the group is working on? Who is affected or has astake in the issue? Is the current representation appropriate?
2. Whose voices are being heard through our members?
3. Who is under-represented or not represented?
4. Is our current membership appropriate?
5. Are key stakeholders being involved in other ways…through focus groups,committee work, or other means?

COMMUNITY GROUP MEMBER SURVEY: RESULTS AND DISCUSSION 5
6. Do members link to key influentials or important nonrepresented individuals orgroups?
7. Resource acquisition is a major concern for community groups. Does ourmembership have the ability to access needed resources?

COMMUNITY GROUP MEMBER SURVEY: RESULTS AND DISCUSSION 6
QUESTION 3 How long have you participated in thiscommunity group?
Length of participation affects group success and accomplishments. Effective groups havemembers who have been a part of the group for varying lengths of time. New members withfresh energy and perspectives are blended with longer-term members who provide continuity andstability to the group.
Successful groups usually have a system for recruiting and retiring members. Groups need toplan for the inevitable loss of involvement by group members. Creating a smooth transition forbringing new members on board, as well as acknowledging the efforts of those previouslyinvolved, are important to reach the highest possible level of group success. Community groupsmay want to consider where they are in terms of trust and relationship building as they bring newpeople to the group. Stability within a group can be an asset in achieving goals, especially whencombined with a broad level of involvement throughout the community.
Community problem solving is a long-term process. Commitment to the group work is essential.Developing commitment may take time, depending upon how familiar the members are witheach other, their experience in previous group work, the purpose of the group and the readinessof the community to embrace the initiative. Newly formed groups often need time to achieve alevel of trust among members and develop operational procedures before they can accomplishthe goals they may desire in the community.
Groups often have a structure for involving people on a short-term basis to accomplish a specifictask or meet a special need. Typically, such members are not considered a part of the core group.Depending upon how this survey was conducted, such members may or may not have completedthe questionnaire.

COMMUNITY GROUP MEMBER SURVEY: RESULTS AND DISCUSSION 7
ResultsLength of participation
0 - 6 months15%
7 -12 months23%
13 - 18 months23%
> 18 months39%
Average 15.8 months
Range 5 - 28 months
As you look at your results, newly formed groups will not have the same variation in length ofparticipation as older groups. How long has your community group existed?
Key Findings
• Variation in length of participation is evident. The group includes members whoare relatively new to the group as well as several who have been with the groupover 18 months.
• Stability in the group is evident. Five of the members who responded to thesurvey have been with the group more than 18 months.
• Average length of participation in the group is 15.8 months.
Discussion Questions
1. What factors have influenced the length of participation in the community group?
2. Do we have a good mix in length of participation among members?
3. What are our expectations about length of commitment to this group?
4. Do we have a process for bringing in new members and training them?
5. Do we have a process for retiring members; for celebrating the efforts of members leavingthe group?
6. How does the length of member participation in the group relate to possible group successin accomplishing goals?

COMMUNITY GROUP MEMBER SURVEY: RESULTS AND DISCUSSION 8
QUESTION 4 What kind of roles have you played in thepast 12 months and before then in the community group?
To function successfully, community groups need people who serve in a variety of roles. Theexact number and types of roles will depend upon the purpose and size of the group. Typicalroles involve attending and participating at meetings, working on committees, implementingactivities, working for the group outside of meetings and a variety of leadership roles (see itemslisted in question 4). Community patterns and norms often influence the roles played byindividual members. However, member involvement affects group success. Groups with manyhighly involved members tend to accomplish more. Peak group performance is most likely tooccur when all members are actively engaged and feel responsible for group success. This isoften linked to a group structure which includes committees or work groups that allows people toparticipate and work to get done. The practice of breaking into work groups to accomplish tasksrather then meeting exclusively as a full group has been found to affect the number of activitiescompleted, implementation of action plans and resource mobilization (Kegler, 1995).
The roles individual members play often change over time or according to need. Memberinvolvement depends upon the special expertise and knowledge he or she brings to the group.Successful groups recognize and use member strengths and abilities. They also help membersassume and retire roles that are most appropriate. Groups may benefit by examining trends inmember involvement to determine if desired changes are occurring.
Depending upon the purpose and size of the group, a number of leadership roles may exist. Notall members will want or need to share in leadership responsibilities. However, many communitygroups are experimenting with innovative ways to share leadership in an effort to sustaincommitment and energize group work. Groups may be examined to see to what extent theypermit or encourage members to assume different roles and participate in leadership of the group.

COMMUNITY GROUP MEMBER SURVEY: RESULTS AND DISCUSSION 9
ResultsChart 1: Roles played at meetings during last twelve months
Percent of members
0 10% 20% 30% 40% 50% 60% 70% 80% 90% 100%
Chair/co-chair the entiregroup
Chair/lead a committee orsubgroup
Direct implementation of aparticular program
Organize activities otherthan meetings
Work for community groupoutside of meetings
Serve as officer other thanchair
Serve as committeemember
Talk at meetings
Attend meetings regularly
54%
62%
62%
85%
92%
92%
92%
92%12 members
12 members
12 members
12 members
11 members
8 members
8 members
7 members
0%
Chart 2: Comparison of roles over time
Percent of members
0 10% 20% 30% 40% 50% 60% 70% 80% 90% 100%
Chair/co-chair the entiregroup
Chair/lead a committeeor subgroup
Organize activities otherthan meetings
Direct implementation ofa particular program
Work for communitygroup outside of
Serve as officer otherthan chair
Serve as committeemember
Talk at meeting
Attend meetingsregularly
54%
62%
62%
85%
92%
92%
92%
92%
39%
54%
31%
39%
31%
54%
54%
Past 12 months Before Then
0%0%
0%

COMMUNITY GROUP MEMBER SURVEY: RESULTS AND DISCUSSION 10
Key Findings
Chart 1: Roles played at meetings during past 12 months
• Data indicates that none of the 12 members who responded to this survey servesas chair.
• All 12 respondents see themselves as being actively involved in meetings, havingserved on committees, and as chairs of committees.
Chart 2: Comparison of roles over time
• By comparing the two time periods, we see an increase in individual membersroles over time for every role.
• The greatest change in roles has been the numbers of people serving as committeemembers.
Discussion Questions
1. How may the level of member involvement affect group accomplishment?
2. Are members playing roles not listed here?
3. Are members assuming different roles over time as the group might expect?
4. Do these findings indicate that members are actively engaged? Is this what we’dhope to see?
5. Is the group using member strengths and capabilities effectively?

COMMUNITY GROUP MEMBER SURVEY: RESULTS AND DISCUSSION 11
QUESTION 5 Which of the following best describes yourcurrent situation as a participant in this community group?
Members of community groups may be unpaid or paid, serving as a volunteer or as part of theirprofessional responsibilities. Some groups may hire a consultant to coordinate the group’s workor to provide specialized, short-term assistance, but such externals usually are not groupmembers. In some cases, volunteers receive a stipend for their participation. Whether membersare unpaid or paid—volunteer or professional—influences how much time, resources andmotivation they give to group work.
In some cases, membership may be totally voluntary – a group of concerned residents initiates acollaborative in response to a local issue and determines its direction and outcomes. We mightcall this model a ‘grassroots initiative’. In other cases, a group of professionals may cometogether in order to work more effectively and share resources. We might call this a ‘professionalmodel’ of community group work, where the professionals direct the action. This is similar to the‘social planning model’ in the social welfare literature where professionals plan on behalf of thepublic (Room, 1990). Some grants require collaboration among agencies and communityresidents so the result is a ‘mixed model’. Neither one model or the other is more successful.Success depends upon the purpose of the group and the working relationships it develops.Research does indicate that a personal, vested interest is necessary for collaborative success,regardless if members are volunteers or salaried.
Your results show the makeup of your group at one point in time. Experience indicates thatmembers feel more comfortable in groups where there are people like themselves. This may beparticularly the case for volunteers in a group composed largely of professionals. The makeup ofthe group, however, depends upon group purpose, strategy, and situation.

COMMUNITY GROUP MEMBER SURVEY: RESULTS AND DISCUSSION 12
Results
Participant status
Volunteer62%
Regular Salary38%
Key Findings
• There is a mix of volunteers and salaried members.
• More than half of the members responding to this survey are volunteers.
Discussion Questions
1. Is this the mix of participants that suits our group’s purpose?
2. Does the ratio of volunteers to salaried members make any difference in the waywe communicate and work together?

COMMUNITY GROUP MEMBER SURVEY: RESULTS AND DISCUSSION 13
QUESTION 6 How many hours in an average month haveyou given to community group work?
Many things are involved for a community group to succeed. The list in question 6 presents sometypical activities of a group. Your group may include these or other activities depending uponyour purpose, scope and what you hope to accomplish. How members allocate their time withinthe group, which activities are taking the most time, and the total amount of time being spent ongroup work are aspects to monitor in order to ensure that all members are engaged in useful workthat will achieve the group’s objectives.
Community group work takes time and commitment. Often, others do not appreciate orunderstand the amount of time it takes to build and maintain successful community initiatives.Yet, it is important to ensure that time is being spent on productive and meaningful activities.Sometimes groups spend a lot of time in regular group meetings but get little accomplished. It isalso important to ensure that time and effort is shared and not the responsibility of a few. Thiscreates ownership, builds everyone capacities, and shares the work load. The level of activitywithin your group and commitment of members, as measured by hours contributed, may beaspects to celebrate and communicate to others when you are promoting your work.
Results
Hours per month spent on group activities (13 members)
Percent of respondentsActivity 0 hrs 1-3
hrs4-6hrs
7-9hrs
10-12hrs
>12hrs
Regular community group meetings 69% 8% 23%Subcommittee work outside meetings 23% 54% 8% 15%Group sponsored activities outside
meetings85% 15%
Preparation for meetings or activities 31% 54% 8% 8%Administration, paperwork 77% 8% 8% 8%Networking and communicating 31% 46% 8% 8% 8%Facilitating group processes 77% 15% 8%Teaching subject matter 100%Fund raising including grant raising 100%
Range 2- 72 hours per person per month

COMMUNITY GROUP MEMBER SURVEY: RESULTS AND DISCUSSION 14
Hours per month spent on group activities
% of members
0% 20% 40% 60% 80% 100%
Teaching subjectmatter
Fund raisingincluding grant
Group-sponsoredactivities outside
Administration/paperwork
Facilitating groupprocesses
Preparation formeetings or activities
Networking &communicating
Subcommittee workoutside meetings
Regular communitygroup meetings
> 12 hrs
10-12 hrs
7-9 hrs
4-6 hrs
1-3 hrs
0 hrs
69%
23%
31%
31%
77% 15%
15%
77%
85%
100%
100%
54%
46%
54%
8%
8%
8%
8%
8%
8%8%
8% 8%
8%
8%
23%
15%
Average = 20 hrsRange = 2 - 72 hrs
Key Findings
• Members responding to this survey are spending, on average, 20 hours a month ongroup work. This ranges from two hours a person to 72 hours a person spent ongroup work.
• A few members appear to be spending considerable time in group work.
• None of these members are involved in teaching subject matter or fund raising.
Discussion Questions
1. What are our members doing and how much is each giving?
2. Are there other activities, not listed here, that members are doing?
3. Are these findings what we would expect? Would we expect to see our membersallocating their time in this manner?
4. Did we all define these activities in the same way? (facilitate discussion aboutwhat the listed activities entail and if members perceived them in the same way)

COMMUNITY GROUP MEMBER SURVEY: RESULTS AND DISCUSSION 15
5. Do these findings suggest a good use of our time?
6. Is there a correlation between time spent and outcomes? (cross reference toquestion 11)

COMMUNITY GROUP MEMBER SURVEY: RESULTS AND DISCUSSION 16
QUESTION 7 To what extent did the community grouphave an impact on you?
Participation in a community group may influence members personal knowledge, beliefs orskills. While self development is not the primary purpose of most community groups, whenmembers grow and develop new skills and abilities, the community is enriched. In some types ofcommunity development practice, the enhancement of group members is a primary outcome ofthe community process itself, not just an unintended consequence. When community membersimprove their understanding of the community, their ability to problem solve, mobilizeresources, work with diverse interests, etc., they often apply or transfer the new knowledge andabilities to other situations, building ‘social capital’. Research and experience tells us that socialcapital—the communal relationships, values and capacities that hold society together—is thefoundation of sustainable community development.
Members need to be aware of this opportunity for personal growth as a result of participating in acommunity group and its potential role in building healthy communities. Among other things, itcan be used as a “recruitment tool” in attracting new members to the group and garnering publicsupport. Where members do not feel the group work is having an impact on their knowledge,skills and abilities, training and other support might be considered.

COMMUNITY GROUP MEMBER SURVEY: RESULTS AND DISCUSSION 17
ResultsGroup impact on members
Level of impact
0 1 2 3 4 5
Skills to influence local policies
Ability to resolve group conflict
Ability to write grants and/orgenerate progress
Leadership ability
Ability to evaluate progress & results
Ability to design & implement action plans
Ability to communicate effectively in a group
Ability to work with others
Ability to conduct a needs/asset assessment
Ability to help solve community problems
Understanding ofothers' perspectives
Understanding ofgroup processes
Ability to help agroup achieve its goal
Knowledge of ways torespond to community issues
Knowledge of resourcesavailable in the community
Sense that together wecan make a difference
Understanding of community needs & assets
2.7
2.9
3.2
3.3
3.3
3.4
3.4
3.5
3.5
3.5
3.5
3.7
3.8
3.9
3.9
4.2
4.4
No impact High impact

COMMUNITY GROUP MEMBER SURVEY: RESULTS AND DISCUSSION 18
Key Findings
• Members responding to this survey indicate that the group has had an average (3) to aboveaverage (4) impact on them.
• The highest impacts are in the areas of understanding of community needs and assets andhaving a sense that together individuals can make a difference.
• The lowest impacts are in grant writing, influencing local policies and resolving conflictwithin the group.
Discussion Questions
1. Are there any of the skills and abilities identified above that we should try to increase in ourmembers?
2. What can we do as a community group to increase the personal growth and development ofour members?
3. Are we as members gaining other benefits from participating in this group?
4. How are we using this knowledge and skills in other aspects of our lives; in other work inthe community?
Note: When discussing this question, record the specific benefits that members cite – in theirown words – of how the group has benefited them individually. Such comments and narrativesmay be used in later communications.
COMMUNITY GROUP MEMBER SURVEY: RESULTS AND DISCUSSION 19
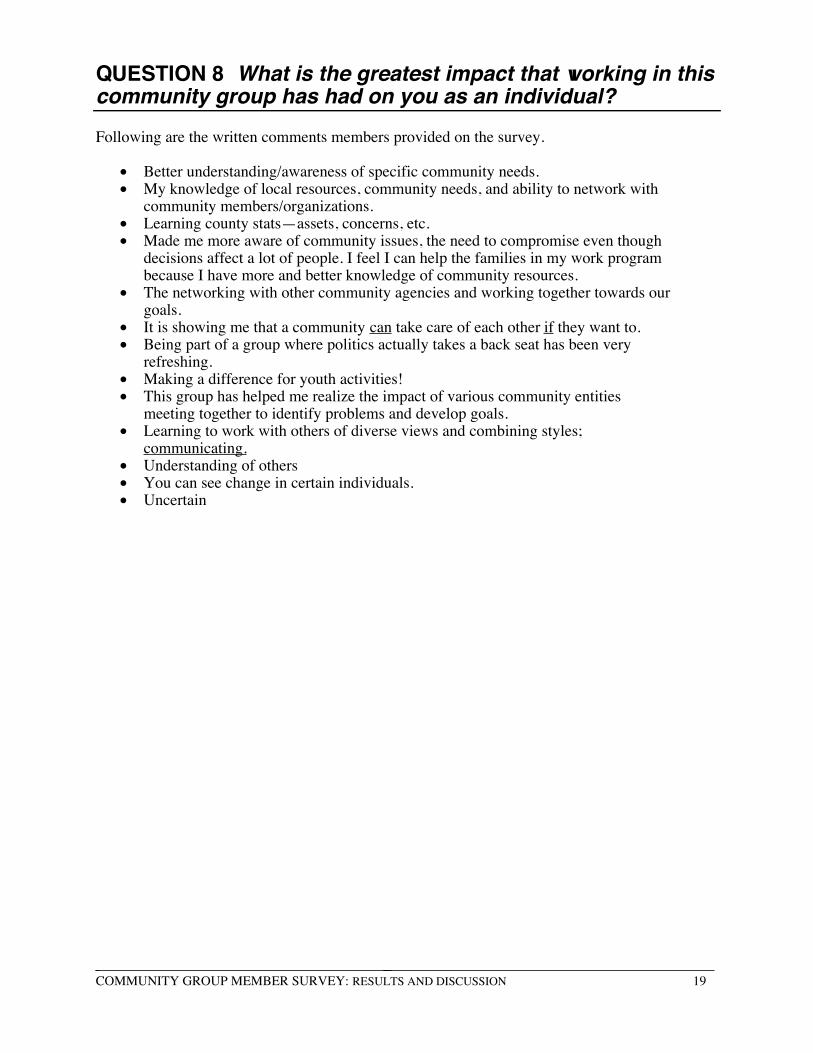
QUESTION 8 What is the greatest impact that working in thiscommunity group has had on you as an individual?
Following are the written comments members provided on the survey.
• Better understanding/awareness of specific community needs.• My knowledge of local resources, community needs, and ability to network with
community members/organizations.• Learning county stats—assets, concerns, etc.• Made me more aware of community issues, the need to compromise even though
decisions affect a lot of people. I feel I can help the families in my work programbecause I have more and better knowledge of community resources.
• The networking with other community agencies and working together towards ourgoals.
• It is showing me that a community can take care of each other if they want to.• Being part of a group where politics actually takes a back seat has been very
refreshing.• Making a difference for youth activities!• This group has helped me realize the impact of various community entities
meeting together to identify problems and develop goals.• Learning to work with others of diverse views and combining styles;
communicating.• Understanding of others• You can see change in certain individuals.• Uncertain

COMMUNITY GROUP MEMBER SURVEY: RESULTS AND DISCUSSION 20
QUESTION 9: How effectively does our group function?
What a group accomplishes depends upon how well the group functions. “Functioning” includesmany factors such as developing direction and procedures, ensuring effective leadership,listening to minority views, involving volunteers, carrying out action plans, securing resources.Research indicates that collaboratives evolve and move through loose chronological phases(Florin, Mitchell & Stevenson, 1993). These may be summarized as Phase I: Form and Focus;Phase II: Organize and Act; and Phase III: Achieve and Transform (Taylor-Powell, Rossing andGeran, 1998).
In each phase, there is a series of tasks that appear important to ensure effective functioning.These tasks, as listed in question 9, are arranged according to the phases of collaborativedevelopment. This order implies a more orderly, linear movement from one phase to the nextthan usually occurs in reality. But, it is useful for thinking about critical tasks and helping thegroup move forward. Groups often work on activities across the three phases simultaneously.The important thing is to make sure you have not neglected an important early task. (For more onphases of collaborative development, see Florin, Mitchell & Stevenson, 1993; Winer and Ray,1994; Taylor-Powell, Rossing and Geran, 1998).
The 26 items represent tasks that are considered critical for successful group work. In theory,newly formed groups would rate highest in the first tasks, and later tasks would not yet be soimportant. An older group would be expected to be carrying out tasks further along thecontinuum. If such a group has been meeting for a while and does not rate high on some of thesetasks, it may need help. Results of this question should show member perceptions of how wellthe group functions, signaling areas to celebrate and those needing greater attention. It isimportant to note that developmental phases generally apply to community groups which areworking as collaboratives, not to groups which do not need to achieve consensus or a commonvision.

COMMUNITY GROUP MEMBER SURVEY: RESULTS AND DISCUSSION 21
ResultsChart 1. Effectiveness of Group Functioning by Phase
0 10.5 1.5 2.5 3.5 4.52 3 4 5
Sustain efforts
Evaluate to assure results
Communicate achievement
Use members' resouces
Provide training for members
Orient new members
Celebrate progress
Gain support from others
Retire & add new members
Resolve conflictCommunicate with
external consituencies
Make decisions accepted by all
Facilitate compromise
Involve volunteers
Carry out planned actions
Conduct meetings that meet goals
Get resources that reach goals
Provide effective leadership
Make inter-organizational links
Communicate views of all
Do effective planning
Develop group procedures
Build a clear mission
Listen to minority views
3.9
3.9
4.1
3.4
4.2
3.7
3.5
3.5
4.2
4
3.8
3.9
4.1
4.3
3.6
3.9
4.2
4.5
4.4
4.2
3.9
4.5
4.4
4.2
3.5
4.2Bring together parties
Create understanding & trust
Phase 1:Form &
Function
Phase 2:Organize
& Act
Phase 3:Achieve &Transform
Level of effectivenessLow High

COMMUNITY GROUP MEMBER SURVEY: RESULTS AND DISCUSSION 22
Chart 2: Effectiveness of Group Functioning from Highest to Lowest
0 10.5 1.5 2.5 3.5 4.52 3 4 5
Develop group procedures 4.5
Level of effectivenessLow High
Provide training for members 3.4
Orient new members 3.5
Retire & add new members 3.5
Listen to minority views 3.5
Involve volunteers 3.6
Celebrate progress 3.7
Resolve conflict 3.8
Sustain efforts 3.9
Communicate achievement 3.9
Facilitate compromise 3.9
Get resources that reach goals 3.9
Communicate views of all 3.9
Communicate with external consituencies 4
Evaluate to assure results 4.1
Make decisions accepted by all 4.1
Use members' resouces 4.2
Gain support from others 4.2
Conduct meetings that meet goals 4.2
Do effective planning 4.2
4.2Create understanding & trust
4.2Bring together parties
Carry out planned actions 4.3
Provide effective leadership 4.4
Build a clear mission 4.4
Make inter-organizational links 4.5

COMMUNITY GROUP MEMBER SURVEY: RESULTS AND DISCUSSION 23
Key Findings
Chart 1: Effectiveness of Group Functioning by Phase
• The group is attending to tasks across all phases, illustrating the dynamic natureof group work and interrelationships of tasks.
• The highest level of achievement shows up in the important early phase and thetasks that deal with forming and setting focus. This might indicate that the grouphas a sound foundation.
• Lowest ratings, within Phase 1, were given to listening to minority views andcommunicating all views.
Chart 2: Effectiveness of Group Functioning from Highest to Lowest
• The range of response is from 4.5 to 3.2 on a 5-point scale, signaling areas ofgreater satisfaction and those perhaps needing attention.
• What are our real strengths and weaknesses?
• Members rated the group highest in making inter-organizational links anddeveloping group procedures.
• Lowest ratings were in terms of orienting new members and training members.
Discussion Questions1. What factors may have influenced members perceptions about group functioning?
2. Are there any surprises in these results?
3. How might the purpose of our group influence the way the group functions?
4. Are there other ways in which our group is functioning really well? Not very
well?
5. Are there some areas we need to pay attention to? Which ones? What should we
do?
6. How should we do this—what are our action steps? Who will be responsible for
what? What are our timelines?

COMMUNITY GROUP MEMBER SURVEY: RESULTS AND DISCUSSION 24
QUESTION 10 Members’ satisfaction with the group
Building mutual respect, understanding and trust among members is crucial. Whether membersfeel valued, accepted and comfortable in the group affects their participation, and, ultimately,group outcomes.
According to research (Winer and Ray, 1994) the following are key components in developingand enhancing trust:
1. Choosing a neutral convener who is supportive and flexible with good organizing andinterpersonal skills.
2. Holding effective meetings that build relationships, provide valuable information, and leadto making important decisions.
3. Involving everyone in the meetings by attending to planning, process, people andpaperwork.
4. Disclosing individual and organizational self-interests.
It is important to periodically assess how members feel about the group—levels of interactions,trust and satisfaction.
Results
Members' perceptions of the group: average ratings
Average Response
0 0.5 1 1.5 2 2.5 3 3.5 4 4.5 5
My viewpoint is heard
Low High
I am viewed as avalued member
I feel comfortable in the group
I am satisfiedwith progress
4.3
4.3
4.2
3.1

COMMUNITY GROUP MEMBER SURVEY: RESULTS AND DISCUSSION 25
Members perceptions of the group (13 members)
Infrequently Sometimes All the time Ave.1 2 3 4 5
My viewpoint is heard 0% 0% 15% 38% 46% 4.3
I am viewed as a valued member 0% 0% 8% 54% 38% 4.3
I feel comfortable in the group 0% 0% 15% 46% 38% 4.2
I am satisfied with group's progress 8% 31% 38% 31% 0% 3.1
Key Findings
Percent of respondents who said “most or all of the time”:
1. My viewpoint is heard 85%
2. I am viewed as a valued member 92%
3. I feel comfortable in the group 85%
4. I am satisfied with the groups progress 31%
Discussion Questions
1. Are we satisfied with these findings?
2. What is the reason(s) for different responses among members?
3. Are some members feeling less valued, less satisfied than others? Possible
reasons?
4. What can we/should we do about this?
5. How can we better develop and enhance trust?
6. What could we do differently to increase member satisfaction with our progress?

COMMUNITY GROUP MEMBER SURVEY: RESULTS AND DISCUSSION 26
QUESTION 11 What impact has the community grouphad on others?
The purpose of community groups is to help improve family and community situations. Despitehow well they function or the level of satisfaction individual members feel, community groupswill be judged by the outcomes they achieve. Outcomes are likely to be different for each groupdepending upon the group’s mission, purpose and functioning. The research on collaborativegroups has identified a variety of outcomes that can result from group action. These may beclustered as outcomes that pertain to
1. involvement of people in addressing community issues in new ways2. improved planning3. capacity building of community members4. changes in resource use5. improved delivery of services or programs6. public policy changes7. improved overall community conditions
The list above corresponds to the items listed in question 11. It suggests an order becauseoutcomes often emerge in sequence over time. More immediate outcomes such as theinvolvement of people and changes in planning structures may occur (or need to occur) beforelonger-term outcomes are achieved such as changes in policies or improvements in overallcommunity conditions. The level of outcome varies by group. There is no standard or bestoutcome that indicates group success. Unintended or unexpected outcomes (positive and/ornegative) may occur. Likewise, outcomes may occur for individuals, for families and groups, foragencies, for systems and/or for communities. Often, groups find it useful to monitor andcelebrate achievements as they occur, but keeping attuned to the final outcome(s) for which theyare striving.
Results
Remember that the impact the group is having depends upon the age of the group, the nature ofthe issue or problem it is addressing, and how well the group is functioning.

COMMUNITY GROUP MEMBER SURVEY: RESULTS AND DISCUSSION 27
Impact of group on others% of respondents
Not Plan to Working Has beenLikely work on on done
INVOLVEMENTPeople are now working together on this community issue 0% 0% 62% 38%More residents are actively involved in this issue 0% 31% 54% 15%Different, “new faces,” are involved 8% 23% 62% 8%New group(s) have been formed to address the need/issue 15% 15% 23% 46%All key stakeholders and interests represented 0 15% 38% 46%Consumers/clients/beneficiaries are involved 0 8% 62% 31%Community wide awareness of issue has increased 0 5% 62% 23%There is greater public support for the issue 0 23% 38% 38%
PLANNINGCommunity planning is more systematic and comprehensive 0 0 38% 62%Results of community planning are used to
determine priorities and allocate resources 0 8% 23% 69%Planning results are shared among community groups 0 23% 23% 54%Planning has led to better targeting of
services and programs 0 15% 23% 62%
CAPACITIESIndividuals’ knowledge and skill have been increased 0 8% 69% 23%People are better equipped to work collectively on
community issues 0 8% 69% 23%Individuals have developed skills transferable to
other situations 0 8% 62% 31%People are optimistic—there is the feeling that
together we can make a difference 0 0 38% 62%Our community group has become incorporated 9% 27% 36% 27%New/improved networks and relationships have been built
among groups, agencies, businesses 0 8% 23% 69%Organizations are working together more
on community issues 8% 0 46% 46%
RESOURCESResources are shared among groups/organizations 0 8% 62% 31%Existing resources have been realigned or modified 0 8% 50% 42%Grants have been written 0 33% 33% 33%There is increased funding/grants in the community 0 17% 58% 17%We are able to influence budget/funding decisions 0 27% 45% 27%
SERVICES AND PROGRAMSServices and programs have been improved 0 15% 62% 23%New services have been created 0 15% 54% 31%Service delivery system has been redesigned 8% 15% 62% 8%Service delivery is more efficient 8% 8% 69% 15%Services/programs are more affordable 0 23% 62% 15%Services/programs are more available 0 31% 46% 23%Accessibility to services and programs has been improved 0 8% 69% 23%Underserved groups have increased their use of services 0 31% 62% 8%There is less duplication 0 8% 69% 23%
continued

COMMUNITY GROUP MEMBER SURVEY: RESULTS AND DISCUSSION 28
Impact of group on others (continued)% of respondents
Not Plan to Working Has beenLikely work on on done
POLICIESPolicies, rules or laws have been evaluated 9% 27% 45% 18%Policies, rules or laws have been changed 18% 45% 36% 0New policies, rules or laws have been implemented 0 64% 36% 0
CONDITIONSPeople are better off in our community 0 8% 69% 23%There is increased sense of community 0 8% 54% 38%People share a common direction for our community 0 0 83% 17%People have an increased sense of community 0 0 69% 31%People have been encouraged to have a voice and to use it 0 0 85% 15%The need that gave rise to our group has been resolved 0 0 92% 8%
Status of group outcomes by major dimension
% o
f m
emb
ers
0%
10%
20%
30%
40%
50%
60%
70%
80%
Involvement
Not Likely
Planning Capacities Resources Services &programs
Policies Conditions
3%0%
2% 0% 2%
8%
0%
16%
12%
8%
17% 17%
38%
2%
50%
27%
48%46%
62%
33%
76%
31%
62%
40%
28%
19%
5%
21%
Plan to Work On Working On Has Been Done
COMMUNITY GROUP MEMBER SURVEY: RESULTS AND DISCUSSION 29
Key Findings
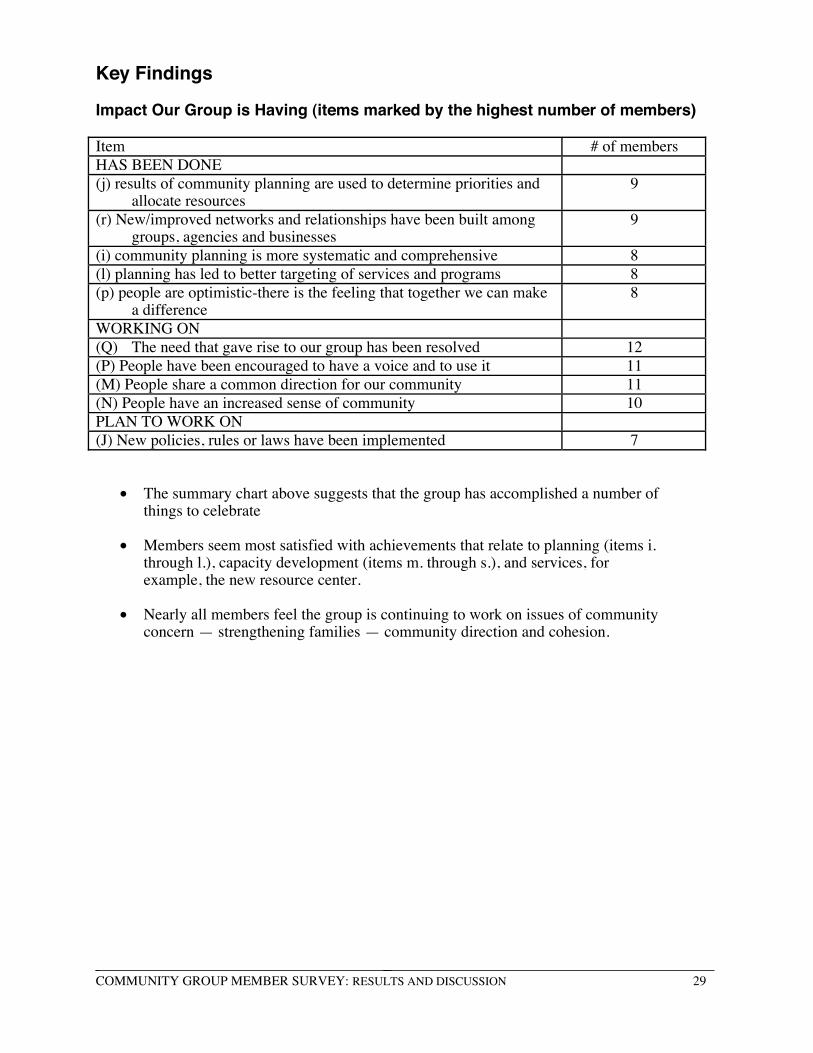
Impact Our Group is Having (items marked by the highest number of members)
Item # of membersHAS BEEN DONE(j) results of community planning are used to determine priorities and
allocate resources9
(r) New/improved networks and relationships have been built amonggroups, agencies and businesses
9
(i) community planning is more systematic and comprehensive 8(l) planning has led to better targeting of services and programs 8(p) people are optimistic-there is the feeling that together we can make
a difference8
WORKING ON(Q) The need that gave rise to our group has been resolved 12(P) People have been encouraged to have a voice and to use it 11(M) People share a common direction for our community 11(N) People have an increased sense of community 10PLAN TO WORK ON(J) New policies, rules or laws have been implemented 7
• The summary chart above suggests that the group has accomplished a number ofthings to celebrate
• Members seem most satisfied with achievements that relate to planning (items i.through l.), capacity development (items m. through s.), and services, forexample, the new resource center.
• Nearly all members feel the group is continuing to work on issues of communityconcern — strengthening families — community direction and cohesion.

COMMUNITY GROUP MEMBER SURVEY: RESULTS AND DISCUSSION 30
Discussion
1. How do members interpret the data presented in Table: Impact of Group on Others? Whatdo members see in this table? Where differences in members responses exist, why is thisso? For example, 15% of the respondents said that it is ‘not likely’ that ‘new group(s) havebeen formed to address the need/issue,’ but 46% feel that this has been accomplished. Whatis the reason(s) for this discrepancy? [Use this question to air perceptions about the groupand its accomplishments. This can help facilitate understanding and consensus aboutexpected impacts.]
2. Are there other achievements the group has attained that aren’t listed here?
3. Which of all the listed items (refer to full chart) are ones that the group most needs tofocus on?
4. Are there any negative or unintended consequences that have occurred as a result of thegroup’s work?
5. How have we (or have we) celebrated our achievements?
We’ve noted our achievements. Now, what are some specific examples of these:
Results of planning have been used to ___________________________________
__________________________________________________________________
These new networks/relationships have been established: ____________________
__________________________________________________________________
Planning has led to a better targeting of___________________________________
__________________________________________________________________
Conditions in Fruit County are improving because _________________________
__________________________________________________________________
__________________________________________________________________

COMMUNITY GROUP MEMBER SURVEY: RESULTS AND DISCUSSION 31
QUESTION 12 What do you think is the greatest impact thatthis community group has had on the community to date?
Following are the members’ written comments, grouped by heading.
Services and programsResource centerThe biggest impact is the new family resource center.The YMCA being changed to give teens more of their wants.Youth programming expanding. Increased communicationImplementation of youth activities, family resource center, and housing committee
Planning and capacitiesNetworking of agencies together for the common goal of improving services for
families.Actually putting into motion plans for improvements that really need to be done.It is truly looking long and hard at family preservation.Much more awareness of the status of such issues as housing, child care, adolescent
programs and a growing cooperation in building programs to meet the needs.Housing committee is growing in strength and coordination. Identified issues tobe dealt with.
Careful assessment of community needs and good planning for more accessible,family-oriented services which leads to less duplication
ResourcesMore resources are being offered to the community

COMMUNITY GROUP MEMBER SURVEY: RESULTS AND DISCUSSION 32
QUESTION 13 Extent to which the group has benefited thecommunity
This question provides a general sense of the extent to which group members feel the group hasbenefited the community to date. Community groups are usually initiated in an effort “to help” or“make something better.” The extent to which members feel the group’s work has actuallyresulted in benefits for the community is important for sustaining member involvement andcommunity support. Newer groups or groups that are dealing with large, complex problems maynot see benefits accruing in the short-term. The age of the group, its history in working as agroup, its purpose, and community context help determine when community benefits may beexpected to occur.
Members’ perception of benefits is one, readily available indicator of actual impact. To verify theperceptions of the members, your group may wish to ask others in the community to what extentand how the community group has benefited the community. When doing so, try to be assystematic as possible in asking a diversity of people in an objective manner .
Results
Extent of Community Benefit
0% 10% 20% 30% 40% 50% 60%
No benefit
Little benefit
Moderate
benefit
Much benefit
8%
8%
31%
53%
% of members
7
4
1
1

COMMUNITY GROUP MEMBER SURVEY: RESULTS AND DISCUSSION 33
Key Findings
• Most of our members feel that the group has had “moderate” to “much benefit.”
• This suggests considerable satisfaction with the impact we have had.
Discussion Questions
1. How does response to this question relate to question # 11 about members’ feelings andperceptions of group progress?
2. What are some specific examples of the way in which our group has benefited thecommunity ______________________________________________________________
________________________________________________________________________
________________________________________________________________________
________________________________________________________________________

COMMUNITY GROUP MEMBER SURVEY: RESULTS AND DISCUSSION 34
QUESTION 14 In your opinion, what could be done toimprove the group's effectiveness?
Following are selected comments representing the full range of remarks fromgroup members:
• "More small group work outside the main committee meetings."• "Start thinking about how we will attract new members."• "Actually implement programs that have been planned."• "Continue as we are."• "More publicity of our work. Very few people in the community
know about us."• "Allocate resources for hiring a full-time coordinator."
QUESTION 15 What do you think has been Extension's majorcontribution to this group thus far?
Following are selected comments representing the full range of remarks fromgroup members.
• "Support for programs"• "Serving as chair - organization and skills"• "Providing research-based information"• "Organization — getting things going and keeping things going"• "Good quality data on community needs"
QUESTION 16 What do you think Extension could contributeto the group in the future?
Following are selected comments representing the full range of remarks fromgroup members:
• "More of the same"• "Revisit progress"• "Assistance in evaluation"• "Continued objectivity and leadership"

COMMUNITY GROUP MEMBER SURVEY: RESULTS AND DISCUSSION 35
References Cited in Report
Florin, P., Mitchell, R., & Stevenson, J. (1993). Identifying training and technical assistanceneeds in community coalitions: A developmental approach. Health Education Research, 8(3),417-432.
Kegler, M. (1995). Community coalitions for tobacco control: Factors influencingimplementation. Ph.D. dissertation, University of North Carolina, Chapel Hill.
Mattesich, P., & Monsey, B. (1992). Collaboration: What makes it work? A review of theliterature on factors influencing successful collaboration. St. Paul, MN: Amherst H. WilderFoundation.
Room, R. (1990). Community action and alcohol problems: The demonstration project as anunstable mixture. Research, Action, and the Community: Experiences in the prevention ofalcohol and other drug problems. OSAP Prevention Monograph-4. U.S. Department of Healthand Human Services. Office of Substance Abuse Prevention. Rockville, MD.
Taylor-Powell, E., Rossing, B., & Geran, J. (1998). Evaluating collaboratives: Reaching thepotential. University of Wisconsin-Extension-Cooperative Extension, Madison, WI.
Winer, M., & Ray, K. (1994). Collaboration handbook: Creating, sustaining, and enjoying thejourney. St. Paul, MN: Amherst H. Wilder Foundation.

University of Wisconsin-Extension 1Cooperative Extension, 9-97
Code # __________
COMMUNITY GROUP MEMBER SURVEY
I. BACKGROUND (Following is completed by Extension Agent)
A. Name of community group: _______________________________ County: ________________________
B. Date group initiated: _____(Month)______(Year)
C. Primary focus/purpose of community group (Check ONE):
_____ a) Alcohol, tobacco, other drugs
_____ b) Teen pregnancy
_____ c) Housing
_____ d) HIV/AIDS
_____ e) Child abuse and neglect
_____ f) Day care
_____ g) Early childhood education
_____ h) Health
_____ i) Nutrition/hunger
_____ j) Eating disorders
_____ k) Learning disabilities
_____ l) Run away youth
_____ m) Juvenile justice/delinquency
_____ n) School truancy/drop out
_____ o) Prevention networks/programs
_____ p) Aging
_____ q) Parenting (or parent education)
_____ r) Family violence
_____ s) Family support
_____ t) Other (please name)_________________
D. Name of program (Check ONE if appropriate):
_____ a) Youth Futures
_____ b) Teen Assessment Project (TAP)
_____ c) School Age Child Care
_____ d) Employee Child Care
_____ e) School Readiness
_____ f) Family Preservation and Support
_____ g) Goals 2000 (DPI)
_____ h) Community Health Assessment (APEX)
_____ i) Child Care Coordinators (4 C’s)
_____ j) Choices
_____ k) Alliance for a Drug-Free Wisconsin
_____ l) W2
_____ m) Other (please name)________________
_____ n) No program name
E. Date survey distributed: _____(Day)_____(Month)_____(Year)

University of Wisconsin-Extension 2Cooperative Extension, 9-97
II. Member Involvement in the Community Group
1. Which of the following best describes your community group (check ONE):
____ a) Members interact primarily for the purpose of exchanging information and communication.
____ b) Members provide helpful resources to support each others interests and goals; there is some joint
planning and activity, but resources are separate.
____ c) Members work together on goals that are complementary; there is coordination and some sharing
of resources.
_____ d) Members share (or are working toward) a common vision that links diverse interests; actions are
jointly created and resources, and authority and decision making are controlled in the group.
2. Who do you primarily represent as a member of this group (check ONE):
_____ a) Business
_____ b) Law enforcement
_____ c) Justice system
_____ d) Elected official
_____ e) Health/medical
_____ f) Mental health
_____ g) Day care/child care/Head Start
_____ h) School, PreK-12
_____ i) Higher education
_____ j) Youth
_____ k) Parent
_____ l) Concerned citizen
_____ m) Senior citizen
_____ n) Extension
_____ o) Religious organization
Social Services Organization:
_____ p) Public
_____ q) Tribal
_____ r) Private, non-profit
_____ s) Private, for profit
_____ t) Other _____________
3. How long have you participated in this community group?______ YEARS______ MONTHS
4. What kind of roles have you played in the past 12 months and before then in the community group? (Circle
YES or NO in each column for each item.)
Past 12 Months Before Thena) Attend meetings regularly YES NO YES NO
b) Talk at meetings (make comments, express ideas, etc.) YES NO YES NO
c) Serve as a member of a committee YES NO YES NO
d) Work for the community group outside of meetings YES NO YES NO
e) Help organize activities (other than meetings) YES NO YES NO
f) Direct the implementation of a particular program YES NO YES NO
g) Chair/lead a committee or sub-group YES NO YES NO
h) Service as an officer other than chair (e.g., treasurer,secretary)
YES NO YES NO
i) Chair/co-chair the entire group YES NO YES NO

University of Wisconsin-Extension 3Cooperative Extension, 9-97
5. Which of the following best describes your current situation as a participant in this community group
(check ONE):
_____ a) I am a volunteer
_____ b) I receive a salary, paid with regular salary dollars from my agency.
_____ c) I receive a salary, part of which comes from special/additional funds designated for the group's work.
_____ d) I am a paid consultant.
_____ e) Other_______________
6. During the past 12 months about how many hours, in an average month, have you given to the community
group carrying out the following activities (including face-to-face and phone contacts). Please fill in the number
of hours for each activity.
_____ a) hours for regular community group meetings
_____ b) hours for subcommittee work outside of meetings
_____ c) hours for group sponsored activities outside of meetings
_____ d) hours for preparation for meetings or activities
_____ e) hours for administration, paperwork
_____ f) hours for networking and communicating outside of meetings
_____ g) hours in facilitating group process
_____ h) hours in teaching subject matter
_____ i) hours in fund raising, including grant writing
_____ j) Other activities not mentioned above. Please list______________________________________
End of Part II. Survey continues at top of page 4.

University of Wisconsin-Extension 4Cooperative Extension, 9-97
III. IMPACT OF GROUP ON MEMBERS
7. Your participation in this community group may have influenced your personal knowledge, beliefs or skills.Please indicate this group’s IMPACT ON YOU by rating each item below on a scale from 1 (low impact) to 5(high impact). Circle the number which best describes your position. If you are uncertain about any of theseeffects, or if it is too early to assess the group’s particular impact on you, please circle U. If the item does notapply to your group, and probably never will, circle N/A in the last column.
To what extent did the community group have an IMPACT ON YOU in terms of...
IMPACTLOW HIGH Uncertain N/A
a ) My understanding of community needs and assets.... 1 2 3 4 5 U N/A
b) My knowledge of resources available in the
community..................................................................................... 1 2 3 4 5 U N/A
c) My sense that together we can make a difference.... 1 2 3 4 5 U N/A
d) My knowledge of ways to respond to community
issues................................................................................................ 1 2 3 4 5 U N/A
e) My ability to conduct a needs/asset assessment........ 1 2 3 4 5 U N/A
f) My ability to design and implement action plans...... 1 2 3 4 5 U N/A
g) My ability to evaluate progress and results................... 1 2 3 4 5 U N/A
h) My ability to write grants and/or generate resources 1 2 3 4 5 U N/A
i) My understanding of others' perspectives....................... 1 2 3 4 5 U N/A
j) My ability to work with others............................................. 1 2 3 4 5 U N/A
k) My understanding of group processes............................... 1 2 3 4 5 U N/A
l) My ability to communicate effectively in a group.... 1 2 3 4 5 U N/A
m) My ability to help resolve group conflict ....................... 1 2 3 4 5 U N/A
n) My ability to help a group achieve its goals ................ 1 2 3 4 5 U N/A
o) My leadership ability ............................................................... 1 2 3 4 5 U N/A
p) My skills to influence local policies ................................ 1 2 3 4 5 U N/A
q) My ability to help solve community problems............ 1 2 3 4 5 U N/A
r) Other (please specify)______________________________________________________________________
_____________________________________________________________________________________________
8. What is the greatest impact that working in this community group has had on YOU as an individual?
_____________________________________________________________________________________________
_____________________________________________________________________________________________
_____________________________________________________________________________________________

University of Wisconsin-Extension 5Cooperative Extension, 9-97
IV. GROUP FUNCTIONING
9. What a group accomplishes is often dependent upon how the group functions. Think about the way your groupworks and how effective you think the group is in the following ways. Please rate each item from 1 [low] to 5[high] by circling the number which best describes your position. Circle U if you are uncertain or can’t answer.
Effectiveness of group in Low Moderate High Uncertain
a) Bringing together parties with an interest in the issue............................................ 1 2 3 4 5 U
b) Listening to minority views.................................................................................................. 1 2 3 4 5 U
c) Creating mutual respect, understanding and trust within the group.................. 1 2 3 4 5 U
d) Building a clear mission (members know where the group is headed).......... 1 2 3 4 5 U
e) Developing group operating procedures (setting up subcommittees,
rules, structures) ...................................................................................................................... 1 2 3 4 5 U
f) Communicating the interests and views of all parties ............................................ 1 2 3 4 5 U
g) Doing effective planning (assess needs/assets, set goals, develop plan ...... 1 2 3 4 5 U
h) Providing effective leadership ........................................................................................... 1 2 3 4 5 U
i) Making inter-organizational linkages.............................................................................. 1 2 3 4 5 U
j) Conducting meetings that accomplish what is necessary..................................... 1 2 3 4 5 U
k) Securing adequate resources so group can do its work........................................... 1 2 3 4 5 U
l) Involving volunteers................................................................................................................. 1 2 3 4 5 U
m) Carrying out planned actions............................................................................................... 1 2 3 4 5 U
n) Making decisions accepted by all parties..................................................................... 1 2 3 4 5 U
o) Facilitating compromise when needed to further progress.................................... 1 2 3 4 5 U
p) Resolving conflict within group......................................................................................... 1 2 3 4 5 U
q) Communicating with external constituencies............................................................. 1 2 3 4 5 U
r) Gaining support from other organizations...................................................................... 1 2 3 4 5 U
s) Retiring and adding new members ................................................................................... 1 2 3 4 5 U
t) Orienting new members ......................................................................................................... 1 2 3 4 5 U
u) Celebrating progress ................................................................................................................ 1 2 3 4 5 U
v) Identifying and using members’ resources.................................................................... 1 2 3 4 5 U
w) Providing for training of members as appropriate...................................................... 1 2 3 4 5 U
x) Reviewing, reflecting, and evaluating to assure progress and results ............. 1 2 3 4 5 U
y) Communicating progress and achievement.................................................................. 1 2 3 4 5 U
z) Developing capacity to sustain efforts .......................................................................... 1 2 3 4 5 U

University of Wisconsin-Extension 6Cooperative Extension, 9-97
10. Please indicate your perceptions about the group as follows, using a 5-point scale from “Infrequently” (1) to “Allthe time” (5). Circle the number which best describes your position.
All theInfrequently Sometimes Time
a ) My viewpoint is heard............................................................................................... 1 2 3 4 5
b) I am viewed as a valued member........................................................................ 1 2 3 4 5
c.) I feel comfortable in the group.............................................................................. 1 2 3 4 5
d) I am satisfied with the group’s progress............................................................ 1 2 3 4 5
V. IMPACT OF GROUP ON OTHERS
11. Listed below are various results that community groups achieve that affect individuals, families, agenciesand the community in general. They may or may not be relevant to your community group depending upon thepurpose of your group and how long you have been together. For each item, Circle 1 if this is something that isnot likely to be accomplished; circle 2 if this is something the group plans to work on in the future; circle 3 if thegroup is currently working on this ; and circle 4 if your group has accomplished this already. Circle N/A if this issomething that does not apply to your group.
As a result of our group... Not Plan to Working Has been Doesn'tlikely Work On On Done Apply
Involvement of People:
a ) People are now working together on this community issue............... 1 2 3 4 N/A
b) More residents are actively involved in this issue................................. 1 2 3 4 N/A
c) Different, new faces , are involved.............................................................. 1 2 3 4 N/A
d) New group(s) have formed to address the need/issue.......................... 1 2 3 4 N/A
e) All key stakeholders and interests are represented................................ 1 2 3 4 N/A
f) Consumers/clients/beneficiaries are involved.......................................... 1 2 3 4 N/A
g) Community-wide awareness of the issue has increased...................... 1 2 3 4 N/A
h) There is greater public support for the issue............................................. 1 2 3 4 N/A
Planning:
i) Community planning is more systematic and comprehensive ........ 1 2 3 4 N/A
j) Results of community planning are used to determine
priorities and allocate resources .................................................................... 1 2 3 4 N/A
k) Planning results are shared among community groups........................... 1 2 3 4 N/A
l) Planning has led to better targeting of services and programs......... 1 2 3 4 N/A
Capacities:
m) Individuals’ knowledge and skills have been increased...................... 1 2 3 4 N/A
n) People are better equipped to work collectively on community
issues............................................................................................................................ 1 2 3 4 N/A
o) Individuals have developed skills transferable to other situations... 1 2 3 4 N/A
p) People are optimistic there is the feeling that together we can
make a difference.................................................................................................. 1 2 3 4 N/A
q) Our community group has become incorporated..................................... 1 2 3 4 N/A
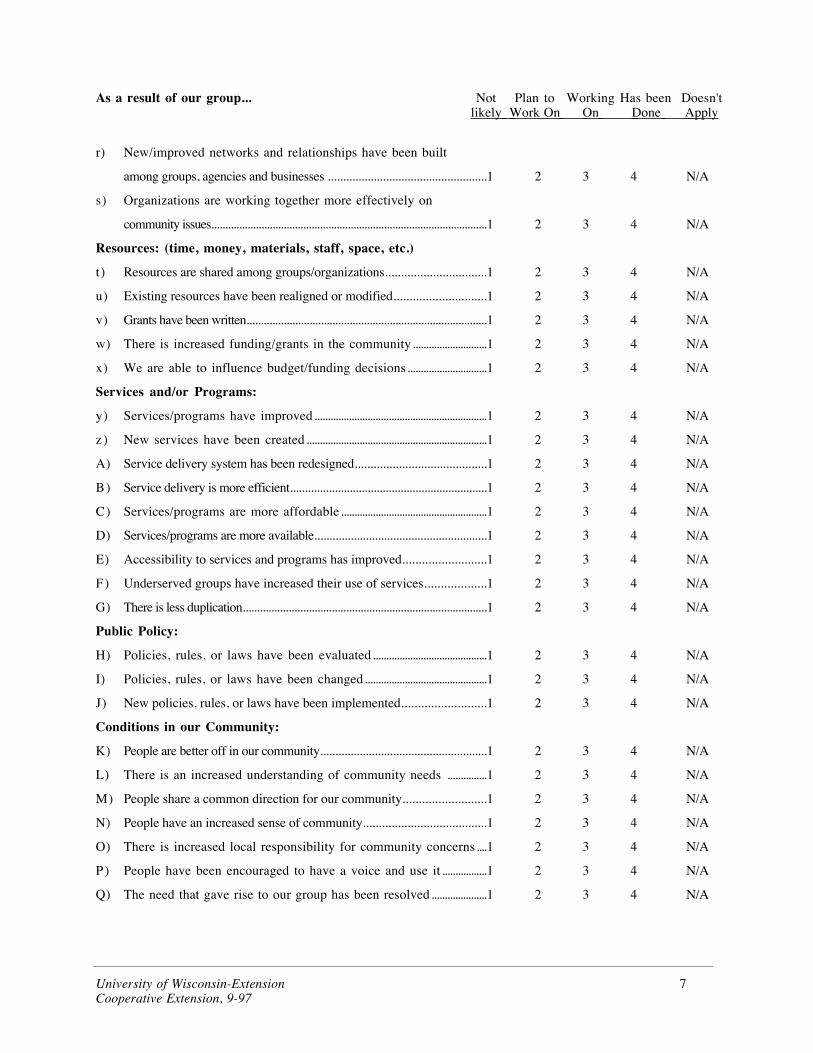
University of Wisconsin-Extension 7Cooperative Extension, 9-97
As a result of our group... Not Plan to Working Has been Doesn'tlikely Work On On Done Apply
r) New/improved networks and relationships have been built
among groups, agencies and businesses .................................................... 1 2 3 4 N/A
s) Organizations are working together more effectively on
community issues................................................................................................... 1 2 3 4 N/A
Resources: (time, money, materials, staff, space, etc.)
t) Resources are shared among groups/organizations................................ 1 2 3 4 N/A
u) Existing resources have been realigned or modified............................. 1 2 3 4 N/A
v) Grants have been written.................................................................................... 1 2 3 4 N/A
w) There is increased funding/grants in the community............................ 1 2 3 4 N/A
x) We are able to influence budget/funding decisions.............................. 1 2 3 4 N/A
Services and/or Programs:
y) Services/programs have improved................................................................. 1 2 3 4 N/A
z) New services have been created.................................................................... 1 2 3 4 N/A
A) Service delivery system has been redesigned.......................................... 1 2 3 4 N/A
B) Service delivery is more efficient.................................................................. 1 2 3 4 N/A
C) Services/programs are more affordable....................................................... 1 2 3 4 N/A
D) Services/programs are more available......................................................... 1 2 3 4 N/A
E) Accessibility to services and programs has improved.......................... 1 2 3 4 N/A
F) Underserved groups have increased their use of services................... 1 2 3 4 N/A
G) There is less duplication..................................................................................... 1 2 3 4 N/A
Public Policy:
H) Policies, rules, or laws have been evaluated........................................... 1 2 3 4 N/A
I) Policies, rules, or laws have been changed.............................................. 1 2 3 4 N/A
J) New policies, rules, or laws have been implemented.......................... 1 2 3 4 N/A
Conditions in our Community:
K) People are better off in our community....................................................... 1 2 3 4 N/A
L) There is an increased understanding of community needs ............... 1 2 3 4 N/A
M) People share a common direction for our community.......................... 1 2 3 4 N/A
N) People have an increased sense of community....................................... 1 2 3 4 N/A
O) There is increased local responsibility for community concerns.... 1 2 3 4 N/A
P) People have been encouraged to have a voice and use it ................. 1 2 3 4 N/A
Q) The need that gave rise to our group has been resolved..................... 1 2 3 4 N/A

University of Wisconsin-Extension 8Cooperative Extension, 9-97
12. What do you think is the greatest impact that this community group has had on the community to date?
13. Please indicate the extent to which you think the group has benefited your community (check ONE): _____ a) No benefit yet _____ b) Little benefit
_____ c) Moderate level of benefit _____ d) Much benefit
14. In your opinion, what could be done to improve the group’s effectiveness?
15. What do you think has been Extension’s major contribution to this group thus far?
16. What do you think Extension could contribute to the group in the future?
Thank you for contributing to this evaluation.

SECTION 2
Using Survey Results with External Audiences
• Overview
• Tip Sheets1. Developing a public information campaign2. Sending clear and consistent message3. Working with the media4. Targeting audiences and anticipating questions
• Samples1. Short report2. Press releases (2)3. Impact statement4. Grant request

Overview
External audiences - public and private agencies, the media, local opinion and policymakers, government officials, media, the general public – need to hear how the work ofyour community group may affect and benefit them. Their interests will be different fromthose of the members of your group. The following materials are designed to help youcommunicate about the results of your survey with people other than the members of thegroup.
Tip Sheets
1. Developing a public information campaign – a process for creating an overallstrategy for communicating both the results of your survey and the outcomes ofyour work.
2. Sending clear and consistent messages – key messages to stress in yourcommunications, a critical component of a communications plan.
3. Working with the media – points for working successfully with reporters, editorsand news directors, your main link to the general public audience.
4. Targeting audiences and anticipating questions – a guide for understanding withwhom you are communicating and designing communications that respond to theirinterests and answer their questions. This is another critical component of acommunications plan.
Samples
1. Short report – a model of a short report for external stakeholders such as the countycommittee or funding agency. The Executive Summary (Section 1) might alsoserve as a short report. Or, you might select just a few charts and selected remarksto form a short report.
2. Press releases – two models of press releases: (1) highlights the group’s outcomesand (2) features the value of collaboration
3. Impact statement – a format for sharing the impact of the group’s work in a briefand readable style
4. Grant request – potential funding sources are yet another external audience withparticular information needs. Think about how to present your results in a way thatwill generate needed resources.

USING SURVEY RESULTS WITH EXTERNAL AUDIENCES 1University of Wisconsin - Cooperative Extension, 1998
Tip Sheet 1
Developing a Public Information Campaign
The goal of a public information campaign is to raise public awareness about a project,event or issue through an organized set of activities to spread the word. Some publicinformation campaigns work strictly through mass media. Others target audiencesindividually, using a variety of marketing strategies. But in all campaigns, the message isrepeated over a period of time. A public information campaign about your communitygroup probably will use both mass media and targeted messages for specific audiences. Acampaign usually includes a series of steps.
Target the Audience
Few messages are so general that they apply to everyone. When you target your audience,you target the message and the best way to deliver it. Audience identification is more thansimply making a list of audience groups. Targeting the audience also involves definingaudience characteristics and thinking about how people in this audience prefer to receiveinformation. For example, if your target audience is locally elected officials, should youcommunicate through newspaper articles? A personal letter or phone call? A formal report?Some combination of these?
Make a Plan
Set goals for your public information campaign. The goal for an information campaignabout a community group might be to increase awareness of the community group’sbenefits to the community. Decide what you’ll do to reach that goal. You may decide to doseveral activities - write news releases, hold a news conference, schedule a series ofpersonal meetings with influential people, create a newsletter. You also need to determinehow you will measure progress toward this goal.
Stick to the Message
If you had to write in one sentence what you want people to remember when the campaignis over, what would that message be? Some possible messages about community groupsinclude:
• Our group accomplished more than we could have done by working individually
• When we collaborate, we profit from each other’s strengths. This makes ourprograms more effective and useful.
• When we collaborate, we avoid duplication of effort. This makes our programsmore efficient.

USING SURVEY RESULTS WITH EXTERNAL AUDIENCES 2University of Wisconsin - Cooperative Extension, 1998
• Families and communities reap the greatest benefits when we work together towarda common goal.
• Working as a community group builds community among the partners. It alsobuilds individual and group skills, knowledge and leadership.
You may develop other messages to fit your community group.
Budget Time and Money for the Campaign
Project how much the campaign will cost in terms of both time and money. Develop atimeline and budget, assign tasks, and set deadlines.
Select your Tools
In a public information campaign, your tools include mass media, interviews, newsconferences, direct mail, promotional materials, presentations, paid advertising and others.Some are more appropriate to your message and target audience. Decide what tools areright for the job. If you decide to use a logo, a slogan or a name, remember to use itconsistently and often.
Evaluate
After the campaign, assess your results. Did you reach your goal? Did you disseminateyour message points? Did people hear the message? What was the feedback? Was the timeand money well spent? What did you learn?

USING SURVEY RESULTS WITH EXTERNAL AUDIENCES 3University of Wisconsin - Cooperative Extension, 1998
Tip Sheet 2
Sending Clear and Consistent Message
Developing clear message points and using them frequently and consistently is a key to asuccessful external communications strategy. Message points should be repeated often.They make effective sound bites, headlines and news leads. They are quick answers to giveif a community leader asks how the group is doing.
Messages that are repeated consistently frequently are messages that are remembered.
The following message points might be used to communicate about yourcommunitygroup.
• Our group accomplished more than we could have done by working individually
• When we collaborate, we profit from each other’s strengths. This makes ourprograms more effective and useful.
• When we collaborate, we avoid duplication of effort. This makes our programsmore efficient.
• Families and communities reap the greatest benefits when we work together towarda common goal.
• Working as a community group builds community among the partners. It alsobuilds individual and group skills, knowledge and leadership.
You may want to develop other message points that fit your own community group and itsprojects. For example, if your group is working with many volunteers, “Volunteers canmake the difference” might be a key message. As you think about your message points,consider these questions.
• What do you want people to remember about the community group?
• What findings from the survey make a message point that will increase thevisibility and credibility of your work?
• Don’t confuse frequent repetition of message points with being redundant.Repetition makes sure your message gets heard and remembered.

USING SURVEY RESULTS WITH EXTERNAL AUDIENCES 4University of Wisconsin - Cooperative Extension, 1998
conflict,prominence,proximity,impact,timeliness,surprise,interestingpeople orevents,somethingnew, trendsand survey,somethinguseful for aparticularaudience,evidence, solidfacts, experts,diversity
Tip Sheet 3
Working with the Media
You’ll probably want to get information about your community group and its work intothe newspaper and on radio and TV news programs. To do this, you’ll need to take a hardlook at your work to discover a news angle – something to attract the interest of newspaperreporters and editor and radio or TN news director.
What makes news? Search Institute’s “Assets Magazine”offered the list at the right. Other such lists have includedmoney, taxes, health, sex, prominent people, crime, thingsthat happen locally, the future.
Here’s how to convince reporters and editors that yourcommunity group has a newsworthy story to tell.
• Tell them about results and outcomes of your project.For example, show how your work saves tax dollars,improves family life, helps local schools or publicinstitutions or results in some other benefit to peoplein your community.
• Show them how your project is helping solve a localproblem or address an important local issue.
• Use lots of local names of participants or partners. Showhow important people in the community are involved.
• Point out how your group work is new or different(working in new ways, with new partners).
• Tell how the group responded rapidly to an emergency.• Show how the community group has involved under-represented
voices.
Here are some pointers for getting your story told in the media.• Invite the media to attend special events or activities. Point out possible photo
opportunities.• Use the tips in Tip Sheet 1 to develop a strategic plan for your media work.• Decide how you will approach reporters, editors and news directors. Will you
prepare a news release? Will you arrange for reporters to visit sites and interviewcommunity group members and people who have benefited from your work? Willyou hold a news conference? One or more of these techniques may fit best withyour effort.
• During an interview, or in your news release, use the message points to telegraphimportant ideas about your group and your project.
• Invite someone from the media to be part of your community group.• Keep communicating. One article in the newspaper is nice, but a series of articles
and news broadcasts over time will make your story stick in people’s minds.

USING SURVEY RESULTS WITH EXTERNAL AUDIENCES 5University of Wisconsin - Cooperative Extension, 1998
Tip Sheet 4
Targeting Audiences and Anticipating Questions
The Community Group Member Survey offers a “teachable moment” – an opportunity totalk about the benefits of working together in communities to support families.
This tip sheet can guide group discussions as you develop a communications plan. Itprovides ideas about how to communicate the outcomes of your community group. Itoffers a list of potential audiences you will try to reach. It can help you anticipate questionsthat may come up – from reporters or stakeholders – and find answers to those questionsin advance.
An effective communications plan usually includes writing message points, identifyingtarget audiences, and anticipating questions.
Audiences
Targeting your audiences means knowing who they are and what they are likely to knowabout your group and your project. Potential target audiences include:
• County supervisors or extension education committee members• State/local public agencies (social services agencies, for example)• Nonprofit agencies and organizations (hospitals, churches, United Way, for
example)• For-profit agencies or businesses (banks or local merchants)• Civic groups (Rotary Club, “Friends of…” organizations)• Participants of the community group’s projects• Group member’s own agency or supervisor• Funders• General public• Local media
Questions
You can make your communications more effective by anticipating the questions varioustarget audiences might raise. Some likely questions about a community group project arelisted below. You can anticipate these questions and develop answers as a group inadvance.
1. Why are members spending so much time with this effort?2. Who is involved and what do they think? What is the makeup of the community
group? Are members paid professionals or volunteers? How long have membersbeen involved?
3. What has been each member’s role in the group?

USING SURVEY RESULTS WITH EXTERNAL AUDIENCES 6University of Wisconsin - Cooperative Extension, 1998
4. Why should we devote time and resources to this partnership? What’s in it for us?Is this a good use of the member’s time?
5. What has the group accomplished?6. What is the group working on now?7. What has been the group’s greatest accomplishment? Most difficult struggle?8. We are being asked to work collaboratively all the time. What have you learned
from your experiences that might help us in the future? What has this communitygroup meant to its members?
9. Who is the community group serving?10. What has been the impact of this group on the community? Organizations?
Individuals? Businesses? Children and families?11. How are conditions in the county improving as a result of your work?12. How can our agency/business/organization benefit from the group’s work? Is thre
an economic benefit for the agency/company, employees and families?13. How can community groups benefit the local economy?14. Why should we stay involved with the group’s efforts?
Answers to these questions will arise from discussion among the community groupmembers. Consult the results of your community group member survey and the TipSheets. Helpful information may be found in the research articles referenced in the fullreport found in Section 1.

Fruit CountyHealthier Partnership
Group Member SurveyJuly 1998
Results from 13 of 15 members; 87% response rate
Purpose of survey• Document impact of community group• Assess functioning of the group• Provide feedback to members to improve group performance
Andrea Apple, Family Living Educator, UW-Extension-Fruit CountyMichael Mellon, Coordinator, United Way, Fruit County
Cheryl Cherry, Parent Volunteer, Fruit CountyUWEX Specialist, UW-Extension, Madison

COMMUNITY GROUP MEMBER SURVEY: SHORT REPORT 1
Healthier Partnership started in 1996 with the mission of building healthier families throughoutFruit County. Starting with a core of 5 individuals, the group now includes 15 members. Toassess its progress and achievements and to provide information for improving its work, thegroup initiated an evaluation developed by UW-Extension in early 1998. The following reportsummarizes the results of the group member survey. The group is using these results to setdirection for the next year.
Chart 1 shows the interests represented by the thirteen members who completed this survey.Key perspectives pertinent to improving family welfare in Fruit County are represented.Research indicates that the number of community sectors represented affects the number ofactivities community groups are able to complete and their resource mobilization. HealthierPartnership will continue to seek broad-based participation.
Chart 1. Group composition
% of members
0% 5% 10% 15% 20% 25%
3 members
2 members
1 member
1 member
1 member
1 member
1 member
1 member
1 member
1 memberYouth
Senior Citizen
Public Social Services
Private Non-Profit Social Services
Mental Health
Law Enforcement
Elected Official
Business
Day care/Child Care/Head Start
Health/Medical 23%
15%
8%
8%
8%
8%
8%
8%
8%
8%
Chart 2 shows that the length of time members have been participating in the group varies. Itappears that the group has been successful in recruiting new members as well as sustaining somestability. The average length of participation is nearly 16 months indicating the level ofcommitment that exists.

COMMUNITY GROUP MEMBER SURVEY: SHORT REPORT 2
Chart 2. Length of participation
0 - 6 months15%
7 -12 months23%
13 - 18 months23%
> 18 months39%
Average 15.8 months
Range 5 - 28 months
The 13 members who participated in this survey see themselves as actively involved in thegroup’s work. Many share in its leadership (Chart 3). Groups with many highly engagedmembers tend to accomplish more. The group will continue to pay attention to memberinvolvement, the special abilities and interests that each member brings to the group and need forchanges.
Chart 3: Roles played at meeting during last twelve months
Percent of members
0 10% 20% 30% 40% 50% 60% 70% 80% 90% 100%
Chair/co-chair the entiregroup
Chair/lead a committee orsubgroup
Direct implementation of aparticular program
Organize activities otherthan meetings
Work for community groupoutside of meetings
Serve as officer other thanchair
Serve as committeemember
Talk at meetings
Attend meetings regularly
54%
62%
62%
85%
92%
92%
92%
92%12 members
12 members
12 members
12 members
11 members
8 members
8 members
7 members
0%

COMMUNITY GROUP MEMBER SURVEY: SHORT REPORT 3
More than half of the members are volunteers (Chart 4). Such a mix is often typical ofcommunity-based initiatives.
Chart 4. Participant status
Volunteer62%
Regular Salary38%
Many things are involved for a community group to succeed. The list in chart 5 presents sometypical activities of a group and shows how the members of Healthier Partnership spend theirtime. Members are spending on average 20 hours a month on group work. There is considerablerange in time allocation from 2-72 hours per person per month. Members do not need to teachgiven our group purpose and activities but the group will initiate fund raising in early 1999. Thegroup will continue to monitor time investment to ensure that members are sharing in the workand spending their time on the most important priorities.
Chart 5. Hours per month spent on group activities
Percent of members
Activity 0 hrs 1-3hrs
4-6hrs
7-9hrs
10-12hrs
>12hrs
Regular community group meetings 69% 8% 23%Subcommittee work outside meetings 23% 54% 8% 15%Group sponsored activities outside
meetings85% 15%
Preparation for meetings or activities 31% 54% 8% 8%Administration, paperwork 77% 8% 8% 8%Networking and communicating 31% 46% 8% 8% 8%Facilitating group processes 77% 15% 8%Teaching subject matter 100%Fund raising including grant raising 100%
Range 2- 72 hours per person per month

COMMUNITY GROUP MEMBER SURVEY: SHORT REPORT 4
Participation in a community group influences members’ personal knowledge, beliefs and skills.While self development is not the primary purpose of Healthier Partnership, when membersgrow and develop new skills and abilities, the community is enriched. These skills can betransferred to other situations. Chart 6 indicates that the group work is having an average (3) toabove average (4) impact on them. Members have gained the most in terms of understandingcommunity needs and assets and having a sense that together we can make a difference.
Chart 6. Group impact on members
Level of impact
0 1 2 3 4 5
Skills to influence local policies
Ability to resolve group conflict
Ability to write grants and/orgenerate progress
Leadership ability
Ability to evaluate progress & results
Ability to design & implement action plans
Ability to communicate effectively in a group
Ability to work with others
Ability to conduct a needs/asset assessment
Ability to help solve community problems
Understanding ofothers' perspectives
Understanding ofgroup processes
Ability to help agroup achieve its goal
Knowledge of ways torespond to community issues
Knowledge of resourcesavailable in the community
Sense that together wecan make a difference
Understanding of community needs & assets
2.7
2.9
3.2
3.3
3.3
3.4
3.4
3.5
3.5
3.5
3.5
3.7
3.8
3.9
3.9
4.2
4.4
No impact High impact
A few selected comments from the members include:• Better understanding/awareness of specific community needs.• Made me more aware of community issues, the need to compromise even though
decisions affect a lot of people. I feel I can help the families in my work programbecause I have more and better knowledge of community resources.
• It is showing me that a community can take care of each other if they want to.• This group has helped me realize the impact of various community entities
meeting together to identify problems and develop goals.• Learning to work with others of diverse views and combining styles;
communicating.

COMMUNITY GROUP MEMBER SURVEY: SHORT REPORT 5
Chart 7. shows how effectively the group is functioning. This is important since what a groupaccomplishes depends upon how well the group functions. Research indicates that communitygroups evolve and move through loose chronological phases. In each phase, there is a series oftasks that appear important to ensure effective functioning. The 26 tasks listed in Chart 7 areconsidered critical for successful group work. Members rated group functioning fairly wellacross all these aspects. The results do indicate some areas to celebrate and others that may needattention.
Chart 7. Effectiveness of Group Functioning by Phase:
0 10.5 1.5 2.5 3.5 4.52 3 4 5
Sustain efforts
Evaluate to assure results
Communicate achievement
Use members' resouces
Provide training for members
Orient new members
Celebrate progress
Gain support from others
Retire & add new members
Resolve conflictCommunicate with
external consituencies
Make decisions accepted by all
Facilitate compromise
Involve volunteers
Carry out planned actions
Conduct meetings that meet goals
Get resources that reach goals
Provide effective leadership
Make inter-organizational links
Communicate views of all
Do effective planning
Develop group procedures
Build a clear mission
Listen to minority views
3.9
3.9
4.1
3.4
4.2
3.7
3.5
3.5
4.2
4
3.8
3.9
4.1
4.3
3.6
3.9
4.2
4.5
4.4
4.2
3.9
4.5
4.4
4.2
3.5
4.2Bring together parties
Create understanding & trust
Phase 1:Form &
Function
Phase 2:Organize
& Act
Phase 3:Achieve &Transform
Level of effectivenessLow High
Mutual respect, understanding and trust among members in community groups is crucial for thegroup to achieve its objectives. Results from this survey, as seen in Chart 8, indicate that mostmembers feel valued and comfortable in the group but member satisfaction with overall progressis lower.

COMMUNITY GROUP MEMBER SURVEY: SHORT REPORT 6
Chart 8. Members satisfaction with the group
Infrequently Sometimes All the time Ave.1 2 3 4 5
My viewpoint is heard 0% 0% 15% 38% 46% 4.3
I am viewed as a valued member 0% 0% 8% 54% 38% 4.3
I feel comfortable in the group 0% 0% 15% 46% 38% 4.2
I am satisfied with group’s progress 8% 31% 38% 31% 0% 3.1
The items in Chart 9 represent outcomes which research has found can result from group action.The survey questionnaire included numerous aspects under each one of these areas. Membersrecorded greatest levels of achievement relative to improved planning, service delivery andchanges in attitudes reflecting the feeling that “together we can make a difference”. Specificaccomplishments include
• The new family resource center• Changes in the YMCA to meet youth needs• Improved community planning• Networking with the community
The group’s work, however, is not done. Nearly all members feel that effort must continue tohelp ensure the health of all Fruit County families.
Chart 9. Status of group outcomes by major dimension
% o
f m
emb
ers
0%
10%
20%
30%
40%
50%
60%
70%
80%
Involvement
Not Likely
Planning Capacities Resources Services &programs
Policies Conditions
3%0%
2% 0% 2%
8%
0%
16%
12%
8%
17% 17%
38%
2%
50%
27%
48%46%
62%
33%
76%
31%
62%
40%
28%
19%
5%
21%
Plan to Work On Working On Has Been Done

COMMUNITY GROUP MEMBER SURVEY: SHORT REPORT 7
Members’ written comments include the following:• The biggest impact is the new family resource center.• The YMCA being changed to give teens more of their wants.• Youth programming expanding. Increased communication• Implementation of youth activities, family resource center, and housing
committee• Careful assessment of community needs and good planning for more accessible,
family-oriented services which leads to less duplication
Community groups are usually initiated in an effort “to help” or “make something better.” Theextent to which members feel the group’s work has actually resulted in benefits for thecommunity is important for sustaining member involvement and community support. As seen inChart 10, the majority of the responding members of Healthier Partnership report that the groupis achieving much benefit. The group will seek input from others in the community regardingtheir perspectives on the benefits being gained from the Healthier Partnership.
Chart 10. Extent of Community Benefit
0% 10% 20% 30% 40% 50% 60%
No benefit
Little benefit
Moderate
benefit
Much benefit
8%
8%
31%
53%
% of members
7
4
1
1

SECTION 3
Presentation Materials
• Charts - all the charts and tables found in the Excel template file.
• PowerPoint Display - individual overheads of the text and data fromthe full report (Section 1). This presentation has been formatted inMicrosoft PowerPoint by Pat Rychter so represents data from PortageCounty.
• Art Work - the ‘working together’ art work that can be sized to meetyour various communication needs

Charts

Instructions for Using Excel Template to Create Graphs
Following are examples of all the charts that can be produced by using the Excel file. Thedata are from another county, so your graphs may look very different once your data havebeen entered into the template.
Using the templateThe template file is organized as a workbook containing several worksheets. Eachworksheet in the file in intended to hold data from one survey question. Some questionsmay have more than one graph, so there may be several graphs per worksheet.
Most of the special instructions for creating each graph are included as notes on eachworksheet page. Each page has an empty table in which to enter your data. The graphs willalso be empty until you start entering data.
Data entry: In general, data can be entered as is from the SPSS tables using the “ValidPercent” column.1 Questions 7, 9 and 10 report averages rather than percents, so somemanual calculation is required before data can be entered in the table. Also, questions 3and 6 require averages and ranges be calculated and manually entered into text boxes oneach graph.
Text boxes: Graphs for questions 3 and 6 have “add-on” text boxes to report range andaverage data. These boxes must be selected and edited to enter your data.2 Text boxes maybe created and added to the bars for questions 2, 4 and 13 to add additional information renumber of members or percents.
Printing: Graphs may look very different in normal and print preview modes, usually dueto placement of text boxes. Always check to see how a graph will print before printing assome adjustment of text boxes may be necessary.
Technical supportContact Carol Hermann at 608/222-2974 with any questions you may have. Her email [email protected].
1 If the percent figures you are entering are showing up in the graph multiplied by 100, enter them asdecimals rather than whole numbers. For example, if you enter 3.8 in the table (for 3.8%) and itgraphs as 380%, enter .038 instead).2 The box for question 6 occasionally seems to disappear from “normal” view, but shows up in“preview” mode and prints. Instructions on how to select that box are included in that worksheetpage.

PowerPoint Presentation

1
1
��� ��� �� ��
���� �����
2
� �� � ��� �����
◗ �� �������� ������ ����� � ������������� ��������
◗ �� �������� ��� ���������������� � ����������
3
������ ��� ���
◗�� ���� ����� �� ��
������ � �� ������� �
◗�� ������ ��������
���� ��� � �������
����� 4
���� ������
◗ �� ������� ��� ���������� ��� �������
◗ �� ����� �������� ����� �� ��������� ����
5
���� ������
◗ �� ���������� �������� �� �����
◗ �� �� �� � ��������������� � ����� �������
6
���� ������
◗�� ����� ���� ��������
�� ��� ��������
◗�� ������� �������

2
7
�������� � �� �
�� ��� ��������� ����
��� ����� ����
��������� ����
8
��������
◗������� ������
������� ���
�������� ����������
�� ����������
9
�����������
◗������� ������ ��
���� ����� ������
�� ������� ���
������ �� �� ������10
����������
◗ ������� ���� ������� � �� � �������������
◗ ���� � ���� ��� �� ������� ��� �� ���������
11
�������������
◗ ������� ����� ���
����
◗ ������� �� ���������� �� ����������������� �� ������������ �� �������� ���� �����
12
◗������ ��� �� � �
��� � �� ����� �
��� ��������
�� ���� � � �� ��
������ �� ������ ���

3
13
◗ ��� ��� ������ ��� ����� ��� �� ���� ����� �������������������
◗ ����� ��� ���������������� ���������� �� ������ ��� ������
M e mbe rs ' de sc ript io n of group ty pe( 10 re s po n de n t s )
C ollabora tive50%
N etw ork0%
P artne rship 10%
C oalition40%
15
�������� � ��
� ��� ���������
��������� �� ������� �� ����
������16
◗�������� ����� � ����
���� ��������
� � �� ��� ��� ���
������ �� ���� ��� ����������� ��� ���
������������
17
◗�� �������
��������� ��� ���
� ���� �� � �� � ���
��� ������� ���
���� � ��� ������ �
������� ���
������ 18
◗��� ����� �
���� �� ������
����������� ������� ���
����� � ��� � � ���������� ���
������ �� � ��� �
�������� � !"�
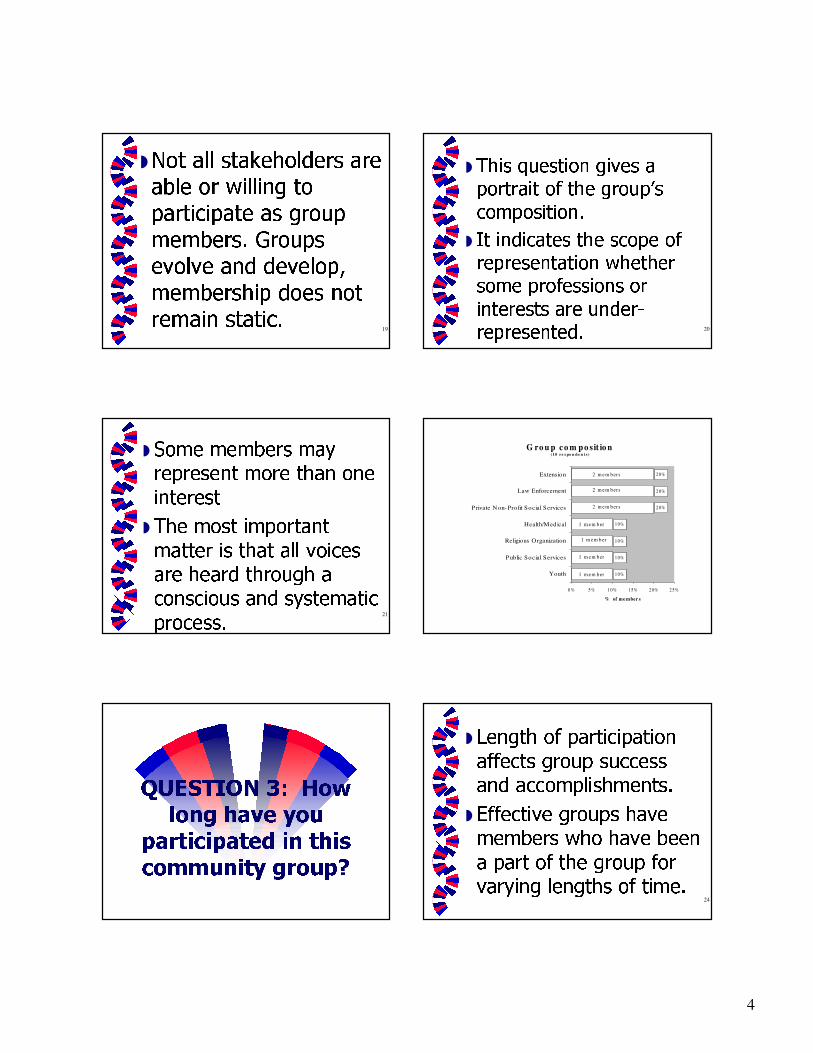
4
19
◗��� ��� ���������� ��
���� � � �� �� ��
��� � ���� �� ����
������� �����
������ �� �������
������� � ��� ���
��� � ���� ��20
◗ ���� ������� ���� � ������� �� ��� ��� ��
��� �������
◗ �� �������� ��� ��� � ���� ��������� ����������� ��������� ��
�������� ��� ������� ��������
21
◗ ���� ������� ���������� ���� ��� �� ������
◗ ��� ���� ������������ � ���� ��� �� ������ ����� ������� ����� ��� �� �������� ��������
G ro u p c o m p o sit io n( 10 re s po n d e n t s )
1 0%
1 0%
1 0%
1 0%
2 0%
2 0%
2 0%
0 % 5 % 1 0% 1 5% 2 0% 2 5%
Youth
Public Social Services
Religious O rganization
Health/Medical
Private N on-Profit Social Services
Law Enforcement
Extension
% of me mber s
2 m em bers
1 m em ber
1 m em ber
1 m em ber
1 m em ber
2 m em bers
2 m em bers
23
�������� � ��
��� ���� ���
������������ �� ����
��������� ������24
◗ ������ �� ��������������� ���� ���� �� ������� ����� �
◗ ��������� ���� �������� ��� ��� ���� �� �� ��� ���� ������� ������ �� �����

5
25
◗ ���������� ���� ������� ��� � ������ ��
���������� ��� ��������
��������
◗ ���� ���� � ��� ��
� � ���������� ��� ����������� �� ���
�������� 26
◗ ��������� ���� ��� ��� �� ������� ������� �� �� ���� �� ������� ���������� ���������� ���� ���� �� ������ ��� ����
27
◗ ��������� ����� � ������ �� �� ����� ����������� ����� ����������� ��� � ��������� �� �������������������� �������������
28
◗ ��������� ������������ �� � ��������������
◗ ���������� �� ������ �� �� ���������
◗ ��������� ������������� ���� �����
Length of participation(10 respondents)
0 -12 mos40%
13 - 24 mos40%
25 - 36 mos10%
> 36 mos10%
Average 21.4 monthsRange 9 - 37 months
30
�������� � �� ���� �� ����� ����
��� ������ �� ��
��� �� ��� �� ���
������ ��� �� ��
������ � !����"

6
31
◗ �� �������� ������������ ����� ������ ����� ��� ��� �� ������� �� ����
◗ �� ���� �� �� ������� �� ��� �������� ������ ��� ��� ���� ������
32
◗ �� ����� ������� ������ � ���� ������ ����� ���� �� ��������� ����
◗ � �� ����� �������� ����� �������
33
◗������ ��� ��
��� ��������
����� ���� ��
�������� ����
34
◗ ���� ����� ��������� ���� � ���� �� ����� ����
��� ����� ��� ��� ����������� ��� ���
������� ��� �� �������������
35
◗�������� ��� ��
���� � ������� �
�� � �� ���� ����
� ������ ��� ������ �
��������� ��������
36
◗ ����� �������� ����� ���� ����� ����� ��� ���� � ��� ���� �������
◗ �������� � ��� �������� �� ������� �� ������ �����������

7
R o les p laye d a t m ee tings d uring past 12 m o nths( 10 re s po n de n t s )
1 0%
3 0%
4 0%
4 0%
7 0%
9 0%
1 00 %
1 00 %
0 %
0 % 2 0% 4 0% 6 0% 8 0% 1 00 % 1 20 %
Cha ir/co-ch air t he ent ire gro up
Serve as off icer o t her t han ch air
Direc t im ple men t ation o f a p art icular pro gra m
Cha ir/lead a co m mitt ee or subgroup
Organ ize act ivities ot he r t h an me etings
Serve as co mm it t ee m em ber
W ork fo r co mm un it y gro up out side ofm eet in gs
T alk at me etings
At t end m eet ings regularly
P e r ce n t o f m e m be rs
1 0 m em bers
1 0 m em bers
9 m em bers
7 m em bers
4 m em bers
3 m em bers
4 m em bers
1
Comparison of roles over time(Past 12 months - 10 re spondents; Before then - 6 responde nts)
40%
0%
100%
100%
70%
10%
90%
30%
40%
0%
100%
33%
50%
67%
17%
100%
100%
67%
0% 20% 40% 60% 80% 100% 120%
Chair/co-chair t he entire group
Chair/lead a committee or subgroup
Organize act ivities other than meetings
Direct implementation of a particular program
Work for community group outside of meetings
Serve as officer other than chair
Serve as committee member
Talk at meeting
Attend meet ings regularly
Perce nt of members
Before Then
Past 12 months
39
�������� � �� �
�� ��� ��������� ����
��� ����� ����
������� �������� �� �
��������� �� ����
������� ����40
◗������� �� ������
����� �� �� ����
�� ����� ������ �� �
������� �� �� ���� ��
����� �����������
����������������
41
◗������� ������� ���
�� ���� � ������� ��
� � ���� � ���� �
� ���� ��� �� ����
����� �������� � �
������ ���� ��� �
���� ����42
◗� ����� �� ������
���� � ��� �� � �
��������� �� ��
������ � � �����
���� �� �����
� � ��� ��� ��
�� �����

8
43
���������� ��������
◗������������ ��
��� ��� ��� �� �����
� ���� ���
����� ���� ��� �����
����������44
����������� ���
◗������������ ����� � �
������
45
����� �����
◗ ������� ��� ��� �� �������� �� ���� �� �����
◗ �� ��� ����� ������� ������� �� ��� ������� ������� �������������� ������
46
�� ������� ���
�� ����� �� ��������
◗�������� ���� �����
���� � ������ � ������
������ � ��������
��� �� ��������
�������
47
���������� �������
◗������� ���� ����
��������� � ������
����� ���� ��� ������
���� ���������
Participant status(10 respondents)
Re g ul a r Sa l a r y
7 0 %
Vo l un te e r
3 0 %

9
49
�������� � ��
��� ����� �� ��
������� ���� ����
��� ����� ��
�� ����� �����
�����50
◗���� ������ �
���� �� �� �
��������� ���� ��
�����
◗��������� ���� ���
���� ��� ���
���������
51
◗������� �����
���� � �� �� ��� ��
�� � ���� ������
��� �� ���
������ �����52
◗ �� �� �������� ��
��� ���� ��� ������� �� ���� ��� ���
�� �������� ��� �� �
���
53
������
�������� ���
◗���� ������� �������
◗ ����� ���������
����������
◗������ ��� �����54
��������� ��
����� ���� �
������
◗����� �� ����� ���
�� � ��� ��
� ����� �� �������
� ����� ����������
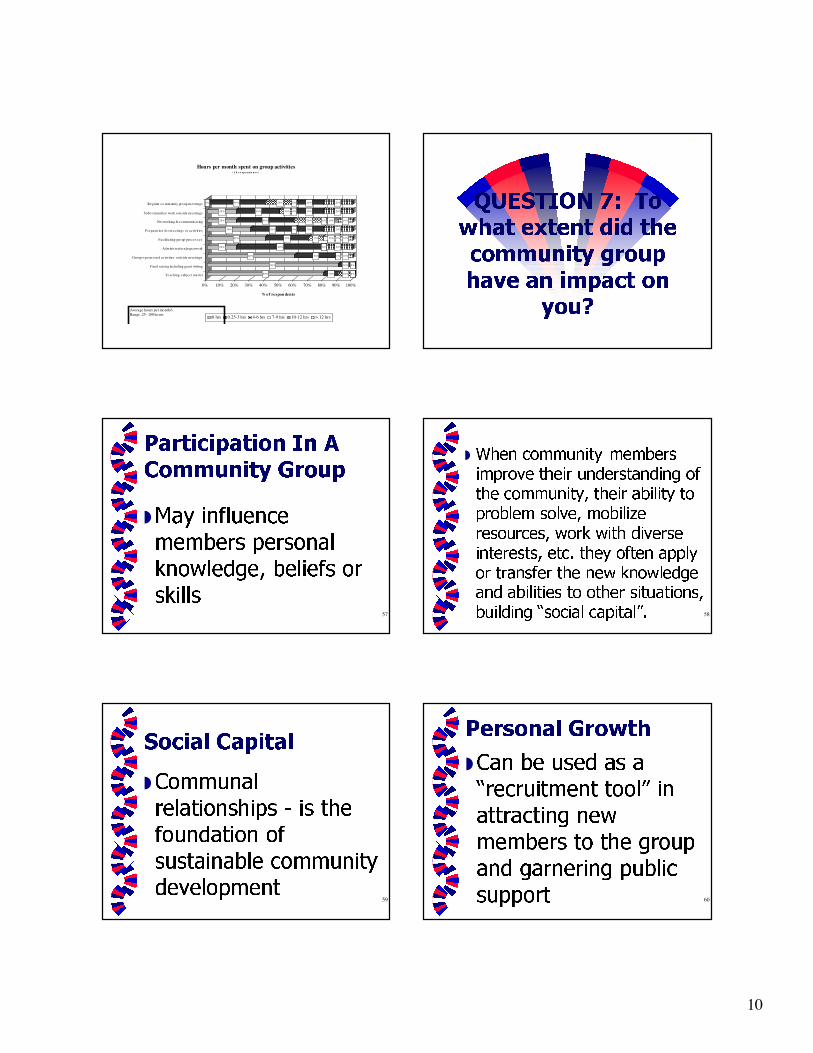
10
80% 10% 1 0 % 0 %0 %0 %
90% 1 0 % 0 %0 %0 %0 %
60% 30% 0%0%0% 1 0 %
20% 60% 0%0%0% 20%
40% 30% 10% 10% 0% 1 0 %
30% 30% 0%0% 20% 20%
20% 40% 20% 0% 10% 1 0 %
20% 30% 10% 0% 20% 20%
0% 40% 20% 0% 20% 20%
0% 10% 20% 30% 40% 50% 60% 70% 80% 90% 100%
% of respon dents
Teaching s ubject matter
Fund ra is ing including grant writing
Gro up-s po ns o red activities o uts ide m eetings
Adm inis tra tio n/paperwo rk
Facilita ting gro up pro ces s es
P reparatio n fo r m eetings o r activities
Netwo rking & co mm unicating
Subco m mittee wo rk o uts ide m eetings
Regular co mm unity gro up m eetings
Hours per month spent on group activities( 1 0 r e sp o n d e n t s )
0 hrs 0.25-3 hrs 4-6 hrs 7-9 hrs 10-12 hrs > 12 hrs
Average hours per month 6Range .25 - 100 hours
56
�������� � �
�� � ������ ��� ���
�������� ����
� �� � ��� �� �����
57
����������� ��
��������� ����
◗��� ��������
���� ��� ����
���������� ������ ��
���� 58
◗ ���� ������� �������������� ��� �� ����� ��� ��� ��������� ��� ������ �������� ������ ������������������ ���� �� �������������� ��� �� ���� ������� ������� � ��� ������ ���� �������� � ��� ������������� ��� ������� ��������
59
������ �������
◗��������
����������� � �� ��
�� ������� ��
� ��������� ���� ����
����������60
�������� ����
◗��� �� ���� �� �
������������ �� ��
��������� ���
������� � ��� ���
��� ������� �����
������

11
Grou p im pact on m e m be rs
2 .4
3
3 .1
3 .2
3 .2
3 .3
3 .5
3 .5
3 .5
3 .5
3 .6
3 .6
3 .7
3 .7
3 .7
3 .7
3 .8
0 0 .5 1 1 .5 2 2 .5 3 3 .5 4
A bil it y t o wri t e gra n t s an d/o r gen e ra t e p ro gre ss
A bil it y t o co n duc t a n e eds /a sse t a sse ssm e n t
A bil it y t o de s ign & im p le m e n t a ct io n p l an s
A bil it y t o re so lv e gr o up co n f lic t
K n o wle dge o f r eso ur c es a v a ila ble i n c om m un it y
A bil it y t o ev a lua t e p r o gr ess & re sul t s
A bil it y t o co m m un ica t e ef fe c t iv ely in a gr o up
U n der st a n ding of gr oup p r o ce sse s
A bil it y t o he lp a gro up a ch iev e i t s go al
U n der st a n ding of c o m m un it y n e eds & asse t s
Sk ill s t o in flue n c e lo c al p o li ci e s
U n der st a n ding of o t h er s' p e rsp ec t iv es
L e ade rsh ip a bil it y
A bil it y t o he lp so lve co m m un i ty p r o blem s
A bil it y t o wor k wi th o t h er s
K n o wle dge o f wa y s t o r e sp o n d to co m m un i ty i ssues
Sen se t h a t t o ge th e r we ca n m ak e a di ff er e nc e
L o w L e v e l o f i m p a c t H ig h
62
�������� � ��
�� ���� �� �� � ���
����� ������������� � �����
����� �� ������ ���� ��� ���� ��� �����
�������
63
������������ ����� �
◗ ���������� ������� ��������
◗ ������� ����������� �����
◗ ��������� �� ������������ 64
������������ ������
◗ ��������� �������
◗ � ���� ��� ����� �� ��
◗ ������ �����
65
◗�������� ������� ��
����� ������� ������
�� ���� ������
����� �������������
������66
◗ � �� ������ � ����
� �� ������� ���� ��
���� � ����� ����
������

12
67
◗������� �� ��� ������
������ ��� ������
���������� �� �� ���
��� ����� ���������
������� ����� ��
��������� ��� �����
������ �������
���������
68
�������� �
�� ���� ������������
���� ��� �����
69
◗ �������� ����� �� ����
����������� �� ����
���� ������ �� ������
◗ ������ ������ ����
������ ��� ��� ��
��������� �� ��� ���
������ ���� ���� ����
�� ��� ���������70
��� ��������� �
���� ����� ���
��������� ����
◗ �������� � ����� �������
��� ���� ���������� ���
������������ ������
◗ ���� ���� ��� ������� ��
���� ������������
71
��� ��������� �
���� ����� ���
��������� ����
◗ ��������� ������� �� ��������
◗ �� ��� ��� ���������� ���
������������� ���������
3.4
3.7
3.9
3.5
3.3
3.7
3.3
3.6
2.9
3.9
0 0.5 1 1.5 2 2.5 3 3.5 4 4.5 5
Low Level of effectiveness High
Conduct meetings that meet goals
Make inter-organizational links
Provide effective leadership
Do effective planning
Communicate views of all
Develop group procedures
Build a clear mission
Create understanding & trust
Listen to minority views
Bring together parties
Effectiveness of group functioning by phase: form & focus

13
3.2
4
4.2
3
3.3
3.8
3.6
3.5
3.6
3.8
4
3.5
3.8
0 0.5 1 1.5 2 2.5 3 3.5 4 4.5 5
Low Level of effectiveness High
Provide training for members
Celebrate progress
Retire & add new members
Communicate with external constituencies
Facilit ate compromise
Carry out planned act ions
Get resources to reach goals
Effectiveness of group functioning by phase: organize & act
3.4
4.1
3.5
0 0.5 1 1.5 2 2.5 3 3.5 4 4.5 5
Low Level of effectiveness High
Sustain efforts
Communicateachievement
Evaluate to assureresults
Effectiveness of group functioning by phase: achieve & transform
75
�������� �� ��
����� ��� ��
������� � �����
��� �� � �����
76
◗������� ��� �� ���
�� ���� � ����� ��
������ �� �� ������
� ��� �������� ����
�������
77
������ ��������
◗ ����������� �� ���� ���� ����� ������������� � ��� ����
◗ �� ���� ������
◗ ������ ������ ���������� ����� � 78
�������� ������
◗ ������� �� ������ ��
◗ � ����� �������� ��������� � ����� �
◗ ����� ����� �������
◗ � ����� ������� ���� ��������

14
79
�������� � �����
��� ◗ �����������
◗ ������
◗ ������
◗ ������
◗ � ����� �������������� 80
◗������ ���� ��� ��
���� �� ������� ��
��������� �������������� ���� ����� ������
����� �� ��� �����
��������� ��� �����
���� ��� ��������
Members' perceptions of the group: average ratings
4.24
4.4
3.5
0
0.5
1
1.5
2
2.5
3
3.5
4
4.5
5
M y viewp oint is heard I am viewed as a valuedmember
I feel comfortable in thegroup
I am satisfied
Ave
rage
Res
pon
se
2%
26%
59%
13%
2%
10%
57%
31%
5%
15%
34%
45%
4%6%
33%
57%
7%
19%
42%
32%
12%
30%
45%
12%
3%
13%
51%
33%
0%
10%
20%
30%
40%
50%
60%
70%
80%
Status of group outcomes by major dimension
No t likely 2% 2% 5% 4% 7% 12 % 3%
P la n to Wo rk On 26 % 10 % 15 % 6% 19 % 30 % 13 %
Wo rk ing On 59 % 57 % 34 % 33 % 42 % 45 % 51 %
Has B een Do n e 13 % 31 % 45 % 57 % 32 % 12 % 33 %
Invo lve m ent
P la nning C apa cities R es o urce sS ervic es & pro gram s
P o lic ies C o n ditio n s
83
�������� �
��� �� �� ����� ��
����� ��� � � ��� �
�� ���������84
◗��������� ���� �
������� ������� � �� ��
���� ��� � �� ����� ��� �����
� �� ��

15
85
◗ ��� ������ �� �������� ���� ��� ������ ���� �� ��������� ����� �� ������� ������ ������ � �������� ��� � ����������� ���������� ��������� ������ 86
���������� ���������� ���������� �����
◗ ��� �� �����
◗ ����� ���� � � ������
◗ �� ������
◗ ����� �� �� ����
87
◗������ ��� �� ��
�� ������ � ���
��������� � ��
�������� ������� ��
��� ������ ��� ��
��� �������� �����
��� ��������
��������
Extent of community benefit
01
7
3
0
1
2
3
4
5
6
7
8
9
10
No benefit Littlebenefit
Moderatebenefit
Muchbenefit
# of
res
pond
ents
9% 27%64%


Authors: Ellen Taylor-Powell is an evaluation specialist with the University of Wisconsin–Extension,Cooperative Extension.Issued in furtherance of Cooperative Extension work, Acts of May 8 and June 30, 1914, in cooperationwith the U.S. Department of Agriculture, University of Wisconsin–Extension, Cooperative Extension.University of Wisconsin–Extension provides equal opportunities in employment and programming,including Title IX and ADA requirements. If you need this information in an alternative format, contactthe Office of Equal Opportunity and Diversity Programs or call Extension Publishing at 608-262-2655.© 2004 by the Board of Regents of the University of Wisconsin System. Send inquiries about copyrightpermission to: Cooperative Extension Publishing Operations, 103 Extension Building, 432 N. Lake St.,Madison, WI 53706.To see more publications or to order copies of this publication, visit our web site athttp://cecommerce.uwex.edu or call toll-free: 877-WIS-PUBS (947-7827).Community Group Member Survey: Using the Results (G3658-9) RP-04/2004