communications industry report 2019
TRANSCRIPT

1 COMMUNICATIONS INDUSTRY REPORT 2019 - GHANA
COMMUNICATIONS INDUSTRY REPORT 2019
NATIONAL COMMUNICATIONS AUTHORITYREPUBLIC OF GHANA

2COMMUNICATIONS INDUSTRY REPORT 2019 - GHANA

i COMMUNICATIONS INDUSTRY REPORT 2019 - GHANA
ABOUT THE REPORT
The Communications Industry Report (CIR) highlights key developments in the communications industry of Ghana between the five year periods from 2015 to 2019. The scope of the report focuses on mobile network operators, fixed networks operators, broadband wireless access providers, infrastructure tower companies, television and radio broadcasting services regulated by the National Communications Authority.
The report provides critical statistical data for policy makers, telecom analysts, consumers, academia, investors and other stakeholders to support decision-making. It is data-centric and combines concise year-on-year analysis of the trends in the industry with substantial use of tables, graphs and figures for easy understanding. The report is the product of data received from the various licensees and other relevant stakeholders in the communications industry.
The publication of the Communications Industry Report (CIR) is consistent with the National Communications Authority’s mandate under section 26 (2)(a) of the 2008, Electronic Communications Act 775; “to publish the result of research that it carries out or that is carried out on its behalf on its website and in any other manner that it considers appropriate to bring the results to the attention of the public”.
Copyright
Unless stated otherwise, copyright in this Communications Industry Report (CIR) including content and design is owned by the National Communications Authority (NCA), Republic of Ghana.
You may make limited copies of the content contained within this CIR in accordance with the Copyright Act 2005 (Act 690) of the Republic of Ghana, including copies for research, study, criticism, review or news reporting.
Published: August 2020
Author: National Communications Authority (NCA)
The Communications Industry Report (CIR) can be downloaded from the website of the National Communications Authority at www.nca.org.gh
i

iiCOMMUNICATIONS INDUSTRY REPORT 2019 - GHANA
All enquires on the Communications Industry Report (CIR) can be sent to the: Director General Attn: Director, Research and Business Development Division National Communications AuthorityNCA Tower, No. 6 Airport CityP.O Box CT 1568, Cantonment Accra, GhanaPhone: +233 (0) 302 776 621/2771701 or +233 (0) 501451522/3Email: [email protected] [email protected]
Website: www.nca.org.gh

iii COMMUNICATIONS INDUSTRY REPORT 2019 - GHANA
TABLE OF CONTENTS
About the Report iTable of Content ii
CHAPTER ONE 1
MOBILE CELLULAR SERVICES 11.0 Introduction 21.1 Mobile Voice 21.1.1 Mobile Voice Subscriptions and Penetration Rate 21.1.2 Distribution of Prepaid and Postpaid Subscriptions 21.1.3 Net Additions 31.1.4 Mobile Voice Subscriptions per Operator 31.1.5 Total Mobile Voice Traffic in Minutes 41.1.6 Distribution of Off -net and On-net Traffic (Domestic) 41.1.7 Mobile Voice Traffic per Operator 51.1.8 Mobile Voice Traffic (International) 5
1.2 MOBILE DATA 61.2.1 Mobile Data Subscriptions and Penetration rate (%) 61.2.2 Distribution of Postpaid and Prepaid Data Subscriptions 61.2.3 Mobile data subscriptions per operator 71.2.4 Mobile Data Traffic 81.2.5 Mobile data traffic in gigabyte (GB) per operator 8
1.3 SHORT MESSAGING SERVICE (SMS) 81.3.1 Distribution of Short Messaging Service (SMS) 91.3.2 Distribution of On-net and Off-net SMS Counts 91.3.3 Total SMS Counts per Operator 9
1.4 MOBILE NUMBER PORTABILITY 10
CHAPTER TWO 11
FIXED NETWORK 112.0 Introduction 122.1 Fixed Voice 122.1.1 Fixed Voice Subscriptions and Penetration Rate (%) 122.1.2 Fixed Voice Subscriptions per Operator 122.1.3 Fixed Voice Traffic in Minutes 13 2.2 Fixed Data 132.2.1 Fixed Data Subscriptions and Penetration Rate (%) 132.2.2 Fixed Data Subscription per operator 14
CHAPTER THREE 15
BROADBAND WIRELESS ACCESS (BWA) 153.0 Introduction 163.1 BWA Subscriptions and Penetration rate (%) 163.2 BWA Subscriptions per operator and Market Share 163.3 BWA Data Traffic in Megabytes (MB) 17
CHAPTER FOUR 19
BROADCASTING 194.0 Introduction 104.1 Frequency Modulation (FM) 204.1.1 Authorised FM Radio Stations in Ghana 204.1.2 Regional Breakdown of FM Authorisation 204.1.3 Operational FM Stations 20

ivCOMMUNICATIONS INDUSTRY REPORT 2019 - GHANA
List of FiguresFigure 1.1: Mobile Voice Subscription and Penetration Rate (%) .......2Figure 1.2: Distribution of Prepaid and Postpaid Subscriptions...........3Figure 1.3: Net Additions........................................................................................3Figure 1.4: Mobile Voice Subscriptions per operator..................................4Figure 1.5: Share of Mobile voice subscriptions per operator (%)......4Figure 1.6: Mobile Voice Traffic in billions of minutes...............................4Figure 1.7: Distribution of On-net and Off-net Voice Traffic....................5Figure 1.8: Volume of Voice Traffic per Operator.........................................5Figure 1.9: Distribution of International Voice Traffic..............................6Figure 1.10: Mobile Data Subscriptions and Penetration rate (%)......6Figure 1.11: Distribution of Postpaid & Prepaid Data Subscriptions...7Figure 1.12: Mobile data subscriptions per operator.................................7Figure 1.13: Shares of mobile network operators (%).............................7Figure 1.14: Mobile Data Traffic in gigabyte (GB).......................................8Figure 1.15: Mobile data traffic in megabyte (MB) per operator..........8Figure 1.16: Distribution of On-net and Off-net Voice Traffic................9Figure 1.17: Distribution of On-net and Off-net SMS Counts.................9Figure 1.18: Share of SMS Counts per operator...........................................10Figure 1.19: Cumulative number of ports.....................................................10Figure 1.20: Net porting per operator............................................................10Figure 2.1: Fixed Voice Subscriptions and Penetration Rate (%).........12Figure 2.2: Fixed Voice Subscriptions per operator..................................12Figure 2.3: Share per operator (%).................................................................13Figure 2.4: Fixed Voice Traffic in Minutes.....................................................13Figure 2.5: Fixed Data Subscription and Penetration Rate (%)...........14Figure 2.6: Fixed Data Subscriptions per operator .................................14Figure 2.7: Share of fixed data subscription (%).......................................14
4.2 Television (TV) Broadcasting 214.2.1 Types of Operating and Non-Operating TV Stations 214.2.2 Platforms for TV Transmission 214.2.3 TV Stations in operation 224.2.4 Pay TV Services 22
CHAPTER FIVE 23
TOWER INFRASTRUCTURE 235.0 Introduction 245.1 Market Share of Tower Companies in Ghana 245.2 Total number of towers per Tower Company 245.3 Tenancy Ratio on Towers in Ghana 255.4 Greenfield and Rooftop Tower Distribution 255.5 Tenancy Ratio on Towers in Ghana 25
CHAPTER SIX 27
GLOBAL OVERVIEW OF THE COMMUNICATIONS INDUSTRY 276.1 Mobile Voice Subscriptions 286.2 Mobile Broadband Subscriptions 286.3 Fixed Voice Subscriptions 286.4 Fixed Broadband Subscriptions 296.5 Broadcasting 296.6 Tower Infrastructure 306.7 Type Approval 30

v COMMUNICATIONS INDUSTRY REPORT 2019 - GHANA
Figure 3.1: BWA Subscriptions and Penetration rate (%).....................16Figure 3.2: BWA Subscriptions per operator...............................................16Figure 3.3: Share of subscriptions (%)..........................................................17Figure 3.4: BWA Traffic in Megabytes............................................................17Figure 4.1: Distribution of Authorised FM Stations by categories in Ghana as at the end of 2019..................................................20Figure 4.2: Regional Breakdown of Authorised FM Stations................20Figure 4.3: Distribution of Types of Operational FM Stations in Ghana as at 2019.......................................................................21Figure 4.4: Types of Operating and Non-Operating TV Stations as at the end of 2019..........................................................................21Figure 4.5: Number of authorized TV stations by mode of transmission – Dec 2019......................................................22Figure 4.6: TV Stations in operation by mode of Transmission..........22Figure 5.1: Number of Towers in Ghana (2015 to 2019).......................24Figure 5.2: Number of towers per TowerCo................................................24Figure 5.3: Market Share of Tower Companies..........................................25Figure 5.4: Number of Greenfield, Rooftop, Indoor Network and Mobile Sites Towers in Ghana – 2019...............................25Figure 5.5: Tenancy Ratio of Towers in Ghana from 2015 – 2019.....26Figure 6.1: World Mobile voice subscriptions in millions.....................28Figure 6.2: World Mobile broadband subscriptions in millions..........28Figure 6.3: World Fixed Cellular Subscriptions in millions..................29Figure 6.4: World Fixed broadband subscriptions in millions.............29List of TablesTable 1: Mobile Voice Subscriptions and Penetration Rate (%) 32Table 2: Mobile Voice Subscriptions per operator 33Table 3: Distribution of Off net and On net Traffic (Domestic) 34
Table 4: Distribution of Domestic Traffic per Operator 35Table 5: Distribution of International Voice Traffic 36Table 6: Mobile Data Subscriptions and Penetration rate (%) 36Table 7: Mobile Data Subscriptions per Operator 37Table 8: Total Volume of internet data traffic in megabyte (MB) per operator 38Table 9: Distribution of Off-net and On-net SMS count 39Table 10: SMS Counts per Operator 39Table 11: Fixed Voice Subscriptions and Penetration Rate (%) 40Table 12: Fixed Voice Subscriptions per operator 40Table 13 : Fixed Voice Traffic in minutes 41Table 14: Fixed Data Subscriptions and Penetration Rate (%) 41Table 15: Fixed Data Subscriptions per operator 42Table 16: BWA Subscriptions and Penetration rate (%) 42Table 17: BWA Subscriptions per operator 43Table 18: BWA Data Traffic in Megabytes 43Table 19: Regional Distribution of Authorised FM Radio Stations in Ghana as at the end of 2019 44Table 20: Regional Distribution of Operational FM Radio Stations in Ghana as at the end of 2019 45Table 21: Types of Operating and Non-Operating TV Stations as at the end of 2019 46Table 22: PayTV Subscriptions for 2019 47Table 23: Mobile Cellular Subscription in millions 48Table 24: Fixed Telephone Subscription in millions 48Table 25: Active Mobile Broadband Subscription in millions 49Table 26: Fixed Broadband Subscription in millions 49

ACOMMUNICATIONS INDUSTRY REPORT 2019 - GHANA

1 MOBILE CELLULAR SERVICES
CHAPTER 1
MOBILE CELLULAR SERVICES
2COMMUNICATIONS INDUSTRY REPORT 2019 - GHANA
1.0 Introduction
This chapter gives an overview of the mobile voice and data subscriptions, volume of voice and data traffic for all the mobile network operators in Ghana. There are four mobile network operators in Ghana, namely Vodafone, MTN, AirtelTigo1 and Glo at the end of 2019.
1.1 Mobile Voice
This section emphasizes on voice subscription, share per operator, net additions, post-paid and pre-paid subscriptions and the volume of traffic distributed by on net and off net calls.
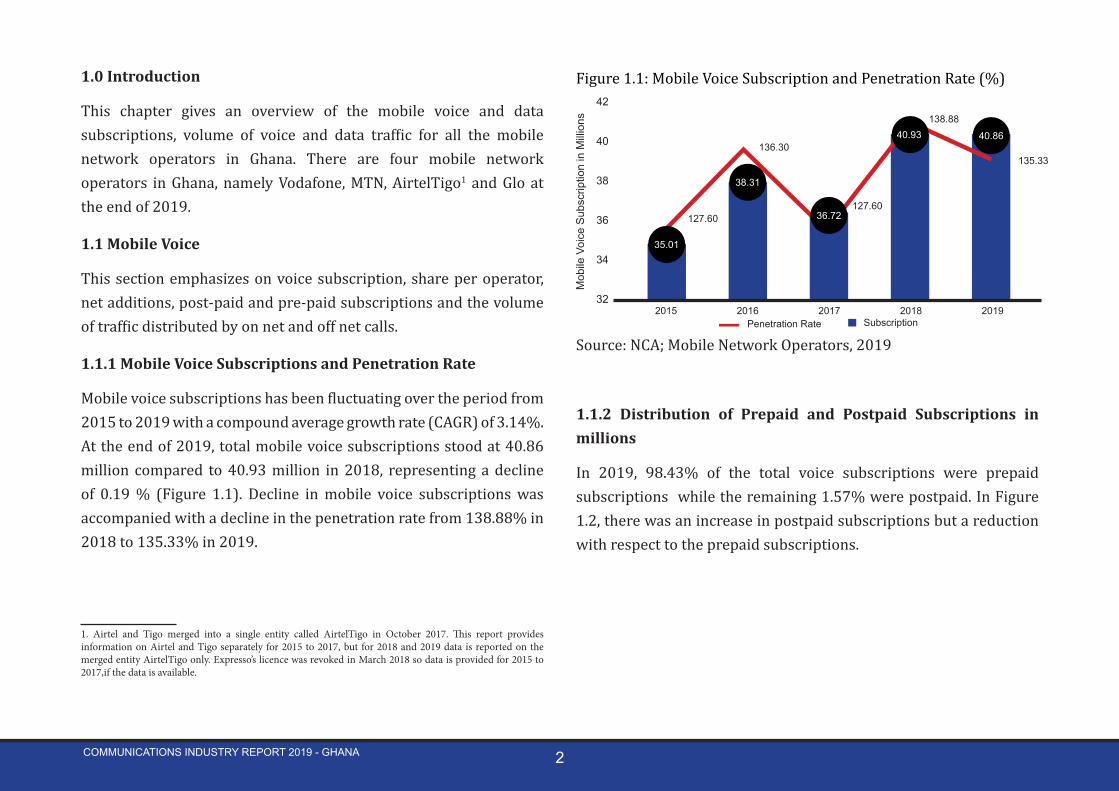
1.1.1 Mobile Voice Subscriptions and Penetration Rate
Mobile voice subscriptions has been fluctuating over the period from 2015 to 2019 with a compound average growth rate (CAGR) of 3.14%. At the end of 2019, total mobile voice subscriptions stood at 40.86 million compared to 40.93 million in 2018, representing a decline of 0.19 % (Figure 1.1). Decline in mobile voice subscriptions was accompanied with a decline in the penetration rate from 138.88% in 2018 to 135.33% in 2019.
1. Airtel and Tigo merged into a single entity called AirtelTigo in October 2017. This report provides information on Airtel and Tigo separately for 2015 to 2017, but for 2018 and 2019 data is reported on the merged entity AirtelTigo only. Expresso’s licence was revoked in March 2018 so data is provided for 2015 to 2017,if the data is available.
Figure 1.1: Mobile Voice Subscription and Penetration Rate (%)
35.01
38.31
36.72
40.93 40.86
127.60
136.30
127.60
138.88
135.33
Mob
ile V
oice
Sub
scrip
tion
in M
illion
s
42
40
38
36
34
322015 2016 2017 2018 2019
Source: NCA; Mobile Network Operators, 2019
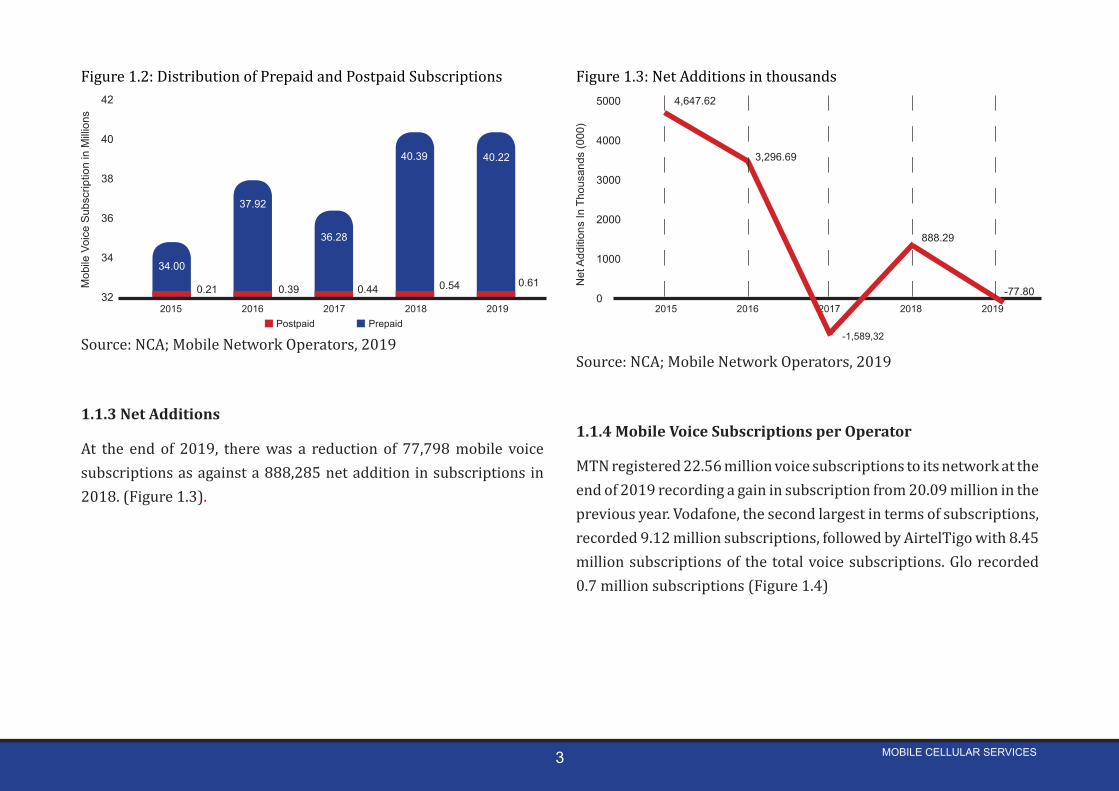
1.1.2 Distribution of Prepaid and Postpaid Subscriptions in millions
In 2019, 98.43% of the total voice subscriptions were prepaid subscriptions while the remaining 1.57% were postpaid. In Figure 1.2, there was an increase in postpaid subscriptions but a reduction with respect to the prepaid subscriptions.
Penetration Rate Subscription
3 MOBILE CELLULAR SERVICES
Figure 1.2: Distribution of Prepaid and Postpaid SubscriptionsM
obile
Voi
ce S
ubsc
riptio
n in
Milli
ons
42
40
38
36
34
322015
Postpaid Prepaid2016 2017 2018 2019
34.00
37.92
36.28
40.39 40.22
0.610.44 0.540.390.21
Source: NCA; Mobile Network Operators, 2019
1.1.3 Net Additions
At the end of 2019, there was a reduction of 77,798 mobile voice subscriptions as against a 888,285 net addition in subscriptions in 2018. (Figure 1.3).
Figure 1.3: Net Additions in thousands4,647.62
3,296.69
-1,589,32
888.29
-77.80
Net
Add
ition
s In
Tho
usan
ds (0
00)
5000
4000
3000
2000
1000
02015 2016 2017 2018 2019
Source: NCA; Mobile Network Operators, 2019
1.1.4 Mobile Voice Subscriptions per Operator
MTN registered 22.56 million voice subscriptions to its network at the end of 2019 recording a gain in subscription from 20.09 million in the previous year. Vodafone, the second largest in terms of subscriptions, recorded 9.12 million subscriptions, followed by AirtelTigo with 8.45 million subscriptions of the total voice subscriptions. Glo recorded 0.7 million subscriptions (Figure 1.4)

4COMMUNICATIONS INDUSTRY REPORT 2019 - GHANA
Figure 1.4: Mobile Voice Subscriptions per operator in millions
Source: NCA; Mobile Network Operator, 2019
In Figure 1.5 MTN was the largest mobile network operator in Ghana by subscriptions with a market share of 55.21% of the total subscriptions at the end of 2019. Vodafone was the second largest operator by subscriptions with a market share of 22.33%, followed by Airteltigo with 20.69% market share. Glo has the least subscriptions representing 1.78% of the total market share at end of 2019.
Figure 1.5: Share of Mobile voice subscriptions per operator (%)
Source: NCA; Mobile Network Operator, 2019
1.1.5 Total Mobile Voice Traffic in Minutes
From 2015 to 2019, mobile voice traffic has grown with a compound average growth rate of 13.26%. In 2019, the total volume of voice call minutes generated was 81.10 billion minutes as compared to 74.31 billion minutes in the previous year 2018. The volume of traffic shows a continuous growth over the five year period as in Figure 1.6.
Figure 1.6: Mobile Voice Traffic in billions of minutes
Source: NCA; Mobile Network Operators, 2019
1.1.6 Distribution of Off -net and On-net Traffic (Domestic)
Total off-net domestic voice traffic generated was 7.49 billion minutes representing 9.22% of the total domestic traffic (Figure 1.7). The off-net traffic has been declining since 2017 however, the on-net traffic continues to experience an increase in volume. In Figure 1.7, on-net traffic accounted for 90.78% of the total domestic traffic with 73.77 billion minutes.
4.80
4.85
16.25 19.30 17.83 20.0922.56
7.61 8.29 9.03
0.13 0.09 0.021.34
Mobil
e Voic
e Sub
scrip
tion(
000,0
00)
40
35
30
25
20
15
10
5
02015 2016 2017 2018 2019
0.70 0.63
4.59 3.99
5.34 5.22
0.74 0.73
10.29 8.45
9.81 9.12
13.09
13.07
46.4350.37 48.08
49.0855.21
21.74 21.64 24.59
0.20 0.103.910.40
Mar
ket S
hare
(%)
1009080706050403020
10
02015 2016 2017 2018 2019
1.82 1.71
12.0010.90
13.90 14.20
1.81 1.78
25.14 20.69
23.97 22.33
MTN Vodafone Tigo GloAirtel AirtelTigo Expresso
43.5250.59
61.18
74.3181.10
Mob
ile V
oice
Traffi
c in
Billio
ns o
f Minu
tes
80
70
60
50
40
30
20
10
02015 2016 2017 2018 2019
MTN Vodafone Tigo GloAirtel AirtelTigo Expresso

5 MOBILE CELLULAR SERVICES
Figure 1.7: Distribution of On-net and Off-net Voice Traffic in Billions of Minutes
Source: NCA, Mobile Network Operators, 2019
1.1.7 Mobile Voice Traffic per Operator
MTN subscriptions generated 70.52 billion minutes (86.95%) of the total voice traffic in the year 2019 with the remaining 13.05% generated by Vodafone, AirtelTigo and Glo (Figure 1.8). Vodafone subscriptions recorded a 6.68 billion minutes of voice traffic, AirtelTigo also recorded 3.95 billion minutes of voice traffic in 2019. Glo subscriptions generated 0.11 billion minutes of the voice traffic.
Figure 1.8: Volume of Voice Traffic per Operator in Billions of Minutes
Source: NCA; Mobile Network Operators, 2019
1.1.8 Mobile Voice Traffic (International)
Total International calls have been decreasing since 2015. It fell from 1.57 billion minutes in 2015 to 0.83 billion minutes in 2019. In 2019, outgoing international voice traffic decreased to 0.52 billion minutes from the previous year’s figure of 0.57 billion minutes. Incoming international voice traffic also recorded a decrease from the previous year’s figure of 0.48 billion minutes to 0.31 billion minutes in the year under review (Figure 1.9).
Dom
estic
Voi
ce T
raffi
c in
Billi
ons
of M
inut
es 80
70
60
50
40
30
20
10
02015
33.30
40.03
51.05
62.69
73.77
2016 2017 2018 2019
10.22 10.55 10.13 8.66 7.49
On-net Off-net
3.054.56
11.83
16.25 19.30
43.84
58.6370.52
23.63 31.18
11.24
0.02 0.01 0.000.43Mob
ile V
oice
Tra
ffic
in B
illion
s of
Mun
ites 80
70
60
50
40
30
20
10
02015 2016 2017 2018 2019
0.22 0.113.25 2.51
4.25
11.24
3.48
0.61 0.111.52 3.95
9.816.68
MTN Vodafone Tigo GloAirtel AirtelTigo Expresso

6COMMUNICATIONS INDUSTRY REPORT 2019 - GHANA
Figure 1.9: Distribution of International Voice Traffic in Billions of Minutes
Source: NCA, Mobile Network Operator
1.2 MOBILE DATA
This includes mobile data subscriptions and penetration rate, mobile data subscriptions per operator and volume of data generated by the operators. The information covers the four mobile network operators namely MTN, Vodafone, AirtelTigo and Glo.
1.2.1 Mobile Data Subscriptions and Penetration rate (%)
Mobile data has seen a continuous increase in subscription since 2015. Mobile data subscription has grown exponentially from 17.92
million in 2015 to 29.96 million in 2019 with a CAGR of 10.83%. In 2019, mobile data subscription grew by 11.42% from 26.93 million in the previous year to 29.96 million (Figure 1.10).
Figure 1.10: Mobile Data Subscriptions and Penetration rate (%)
Source: NCA; Mobile Network Operator, 2019
1.2.2 Distribution of Postpaid and Prepaid Data Subscriptions
Mobile data subscriptions is dominated by prepaid subscriptions as compared to postpaid subscriptions (Figure 1.11).
Inte
rnat
ional
Voice
Tra
ffic (
000,
000,
000)
2015 2016 2017 2018 2019
0.90
0.80
0.70
0.60
0.50
0.40
0.30
0.20
0.10
0.00
0.85
0.72 0.70
0.59 0.58
0.49
0.57
0.480.52
0.31
1820
32
27
30
Mob
ile D
ata
Subs
crip
tion
(000
,000
)
35
30
25
20
15
10
5
0
120
100
80
60
40
20
02015 2016 2017 2018 2019
65.7469.91
81.54
92.39100.50
Pene
tratio
n R
ate(
%)
Penetration Rate Subscription

7 MOBILE CELLULAR SERVICES
Figure 1.11: Distribution of Postpaid and Prepaid Data Subscriptions
Source: NCA; Mobile Network Operator, 2019
1.2.3 Mobile data subscriptions per operator
MTN, the largest mobile network operator in Ghana by subscription, recorded a total of 22.26 million subscriptions, followed by AirtelTigo, which recorded 4.11 million subscriptions. Vodafone’s data subscriptions stood at 3.70 million and Glo recording 269,153 data subscriptions (Figure 1.12).
Figure 1.12: Mobile data subscriptions per operator
Source: NCA, Mobile Network Operators, 2019
In terms of market share, MTN is leading with 73.37% of total mobile data subscriptions, followed by Airteltigo with a market share of 13.55% and Vodafone coming in third position with 12.20% market share. Glo completes the list with 0.89% market share. (Figure 1.13).
Figure 1.13: Shares of mobile network operators (%)
Source: NCA; Mobile Network Operator, 2019
Mob
ile D
ata
Subs
crip
tion
(000
,000
) 30
25
20
15
10
5
02015
17.9219.46
23.23
26.9329.96
2016 2017 2018 20190.11 0.18 0.24 0.30 0.38
Prepaid Postpaid
MTN Vodafone
2.88
2.733.32
13.74
16.7422.26
8.63 10.23
4.10
0.05 0.04 0.010.41Mob
ile D
ata
Subs
crip
tion
(000
,000
)
35
30
25
20
15
10
5
02015 2016 2017 2018 2019
0.28 0.242.90 2.53
2.73
3.47
2.85
0.25
6.08 4.11
4.213.11
Tigo GloAirtel AirtelTigo Expresso
0.27
MTN Vodafone Tigo GloAirtel AirtelTigo Expresso
15.16
15.97
47.8953.06 58.54 61.29
73.37
18.3917.69 17.46
0.19 0.042.330.27
Mob
ile V
oice
Mar
ket S
hare
(%)
1009080706050403020
10
02015 2016 2017 2018 2019
1.41 1.02
14.7710.79
13.88 12.14
0.93 0.89
22.31 13.55
15.4712.20

8COMMUNICATIONS INDUSTRY REPORT 2019 - GHANA
1.2.4 Mobile Data Traffic
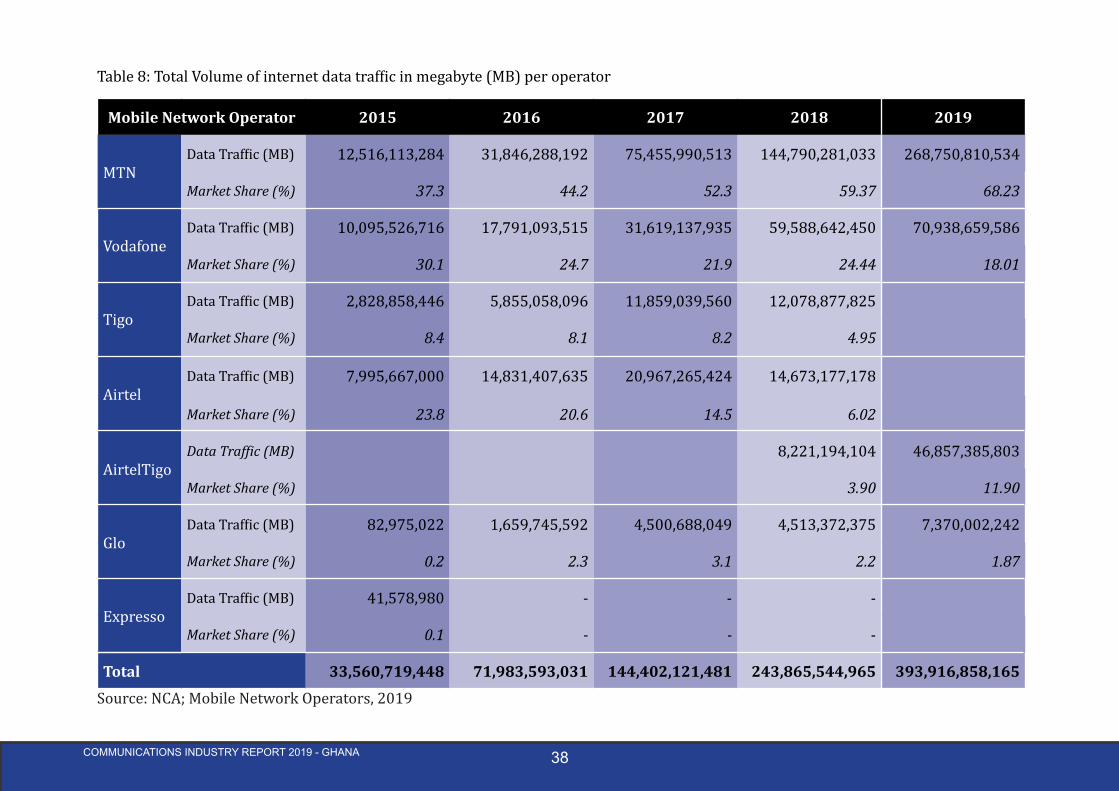
Mobile Data Traffic has experienced a continuous increase over the past five years. In 2015, total mobile data traffic generated was 32.77 million gigabytes (GB) as compared to 384.68 million gigabytes in 2019 with a CAGR of 63.65% as in Figure 2.14. Mobile Data Traffic increased from 238.15 million gigabytes in the year under review to 384.68 million gigabytes, representing a growth rate of 61.53%.
Figure 1.14: Mobile Data Traffic in Gigabyte (GB)
Source: NCA; Mobile Network Operators, 2019
1.2.5 Mobile data traffic in Gigabyte (GB) per operator
MTN generated 68.23% of the total mobile data traffic in 2019 with 262.45 million gigabytes. The second largest contributor, Vodafone,
generated 69.28 million gigabytes data which corresponds to 18.01%. AirtelTigo generated 45.76 million gigabytes representing 11.90% whilst Glo generated 7.20 million gigabytes of data accounting for 1.87% of the total data traffic generated in the year under review (Figure 1.15).
Figure 1.15: Mobile data traffic in Gigabyte (GB) per operator
Source: NCA; Mobile Network Operators, 2019
1.3 SHORT MESSAGING SERVICE (SMS)
This part of the report deals with total SMS counts, SMS per operator as well as on-net and off-net SMS. It covers the four mobile network operators MTN, Vodafone, AirtelTigo and Glo.
32.77
70.30
141.02
238.15
384.68
Tota
l Vol
ume
of D
ata
in G
igab
ytes
400
350
300
250
200
150
100
50
02015 2016 2017 2018 2019
MTN Vodafone
7.872.769.86
73.69
141.40268.45
12.22 31.10
30.88
0.04 0.010.08Mob
ile D
ata
Traffi
c in
Gig
abyt
es (0
00,0
00,0
00) 350
300
250
200
150
100
50
02015 2016 2017 2018 2019
1.62 4.4020.48
17.57
11.58
4.418.63
45.76
58.19 69.28
Tigo GloAirtel AirtelTigo Expresso
14.3311.80
14.487.20
5.72

9 MOBILE CELLULAR SERVICES
1.3.1 Distribution of Short Messaging Service (SMS)
In Figure 1.16, the total Short Messaging Service (SMS) counts at the end of 2019 was 2.75 billion, indicating an increase in SMS traffic from 2015 when it recorded 1.65 billion SMS. SMS counts increased by 7.46%, from 2.56 billion in the previous year to 2.75 billion in 2019.
Figure 1.16: Distribution of On-net and Off-net Voice Traffic in Billions of Minutes
Source: NCA; Mobile Network Operators, 2019
1.3.2 Distribution of On-net and Off-net SMS Counts
On-net SMS counts recorded a rise from 2.05 billion in 2018 to 2.37 billion in the year under review, representing a 15.51% increase. On-net SMS makes up 86.13% of the total domestic SMS generated.
Off-net SMS counts accounted for 13.87% of the generated SMS count in 2019 with 0.38 billion SMS. (Figure 1.17).
Figure 1.17: Distribution of On-net and Off-net SMS Counts
Source: NCA; Mobile Network Operators, 2019
1.3.3 Total SMS Counts per Operator
From Figure 1.18, MTN generated 50.95% (1.40 billion) of the SMS counts in 2019, with Vodafone accounting for 46.79% (1.29 billion). AirtelTigo recorded 2.13% (0.06 million) SMS counts and Glo with 0.13% (0.04 billion) of total SMS counts.
1.65 1.61
1.85
2.562.75
SMS
Cou
nt (0
00,0
00,0
00)
2.5
2.0
1.5
1.0
0.5
02015 2016 2017 2018 2019
SMS Count (000,000,000)
On-net Off-net
2019
2018
2017
2016
2015
0.0 0.5 1.0 1.5 2.0 2.5 3.0
0.38
0.51
0.50
0.41
0.43
2.37
2.05
1.32
1.20
1.22

10COMMUNICATIONS INDUSTRY REPORT 2019 - GHANA
Figure 1.18: Share of SMS Counts per operator
Source: NCA; Mobile Network Operators, 2019
1.4 Mobile Number Portability
Mobile Number Portability (MNP) is a mobile telecom service that allows mobile network subscribers to change mobile network service provider while retaining the same mobile phone number. Mobile Number Portability was introduced in Ghana in July 2011.
At the end of 2019, a total of 4.41 million mobile phone numbers have been ported in Ghana, representing 10.79% of the total mobile subscriptions. In the year 2019 alone, a total of 384,558 numbers were ported from one network to the other. (Figure 1.19).
Figure 1.19: Cumulative Number of Ports in Millions
Source: NCA; Porting XS, 2019
From Figure 1.20, comparing the port out and port in for each operator, it is observed that MTN continues to gain from the porting activity on its network. At the end of 2019, MTN gained 141,970 ports with Vodafone gaining 76,710 subscriptions. The rest of the operators lost subscriptions especially Airtel with 208,868 subscriptions in 2019.
Figure 1.20: Net porting per operator in thousands
Total
Cum
mulat
ive po
rts (0
00,00
0)
2015 2016 2017 2018 2019
5.0
4.0
3.0
2.0
1.0
0.0
2.42
3.05
3.85 4.03
4.41
2015 2016 2017 2018 2019
Net P
ortin
g (0
00)
300
200
100
0
-100
-200
-300
400
141.45
95.88
207.05
-56.59-31.33
-257.68-337.08
257.14
85.26
141.97
-35.57
-153.20
-48.17
124.79
-14.85
76.71
-39.26-5.48 -27.88
-37.87
-4.63 -5.48 -4.29
-208.87
MTN Vodafone Tigo GloAirtel AirtelTigo

11 COMMUNICATIONS INDUSTRY REPORT 2019 - GHANA
CHAPTER 2
FIXED NETWORK SERVICES

12COMMUNICATIONS INDUSTRY REPORT 2019 - GHANA
2.0 Introduction
This Chapter covers the fixed network operations in Ghana. There are three operators licenced to serve the populace with fixed network services namely Vodafone, Airtel (Now AirtelTigo) and MTN. This section however covers Vodafone and AirtelTigo only, based on data availability. MTN did not submit data as requested and the Authority is taking steps to sanction MTN in accordance with the law and the terms and conditions as stated in the license issued.
2.1 Fixed Voice
This sub-section looks at the total fixed voice subscriptions, penetration rate (%) and market share per operator as well as the total fixed voice traffic.
2.1.1 Fixed Voice Subscriptions and Penetration Rate (%)
Between the five-year period from 2015 to 2019, fixed voice subscriptions has experienced a fluctuation, recording its highest subscriptions in 2017 with a subscription of 301,551(Figure 2.1). Fixed Voice subscriptions at the end of 2019 was 288,531 indicating an increase (3.65%) from 278,379 in 2018. The penetration rate of fixed voice subscriptions keeps fluctuating between 0.90% and 1.00%. In the year 2019, the penetration rate was 0.96% as represented in Figure 3.1.
Figure 2.1: Fixed Voice Subscriptions and Penetration Rate (%)
Source: NCA; Fixed Network Operator, 2019
2.1.2 Fixed Voice Subscriptions per Operator
Vodafone subscriptions dominated the market with 280.32 thousand subscriptions. AirtelTigo ended the year with subscriptions of 8.21 thousand. Both Operators recorded an increase in subscriber base as compared to 2018 subscriptions.
Figure 2.2: Fixed Voice Subscriptions per operator in thousands
Source: NCA; Fixed Network Operator, 2019
27.56
25.15
30.16
27.84
28.85
1.00
0.90
1.05
0.940.96
Fixe
d N
etw
ork
Subs
crip
tion
(000
0)
Pene
tratio
n R
ate
(%)30
28
26
24
22
1.05
1.00
0.95
0.90
0.852015 2016 2017 2018 2019
267.16
244.30
294.92
271.73
280.32
8.216.656.647.818.41Fixe
d Vo
ice S
ubsc
riptio
n (0
00)
300
250
200
150
100
50
02015 2016 2017 2018 2019
Vodafone AirtelTigo
Penetration Rate Subscription

13 FIXED NETWORK SERVICES
Vodafone subscription represented 97.15% of the fixed voice market with AirtelTigo covering 2.85% of the market, this is illustrated in the figure below.
Figure 2.3: Share per operator (%)
Source: NCA; Fixed Network Operator, 2019
2.1.3 Fixed Voice Traffic in Minutes
Fixed voice traffic has declined from 107.91 million minutes in 2015 to 49.04 million minutes in 2019. Traffic generated from fixed voice subscriptions in 2019 was 49.04 million minutes compared to 49.28 million minutes in the previous year, representing a decline of 0.48% (Figure 2.4).
Figure 2.4: Fixed Voice Traffic in Million Minutes
Source: NCA; Fixed Network Operator, 2019
2.2 Fixed Data
This section provides information on subscription to fixed broadband services provided in the country.
2.2.1 Fixed Data Subscriptions and Penetration Rate (%)
Fixed data subscriptions fell from 58.81 thousand in 2018 to 57.39 thousand in 2019 representing a decline rate of 0.02% (Figure 2.5). From 2018 to 2019, there was a reduction of 1,415 subscriptions during that period.
107.91
79.70
57.1949.28 49.04
Fixe
d Vo
ice
Traffi
c in
min
utes
(000
,000
) 120
100
80
60
40
20
02015 2016 2017 2018 2019
96.997.1 97.8
97.6 97.2
2.82.42.22.93.1
Shar
e pe
r Ope
rato
r (%
)
100
80
60
40
20
02015 2016 2017 2018 2019
Vodafone AirtelTigo

14COMMUNICATIONS INDUSTRY REPORT 2019 - GHANA
Figure 2.5: Fixed Data Subscription and Penetration Rate (%)
Source: NCA; Fixed Network Operator, 2019
2.2.2 Fixed Data Subscription per operator
Fixed data subscription has been fluctuating over the past five years. At the end of 2019, Vodafone’s subscriber base was 56.68 thousand whilst Airtel recorded 0.72 thousand subscriptions.
Figure 2.6: Fixed Data Subscriptions per operator in thousands
Source: NCA; Fixed Network Operator, 2019
Over the five-year period (2015 - 2019), Vodafone has dominated the fixed broadband market as compared to AirtelTigo. Vodafone covered 98.75% of the market whilst AirtelTigo presented the remaining 1.25%.
Figure 2.7: Share of fixed data subscription (%)
Source: NCA; Fixed Network Operator, 2019
73.46
85.19
55.6357.22 56.68
0.721.591.181.411.63
Fixe
d D
ata
Subs
crip
tions
(000
)
80
60
40
20
02015 2016 2017 2018 2019
Vodafone AirtelTigo
97.8398.38 97.92
97.29 98.75
1.252.712.081.622.17
Shar
e pe
r Ope
rato
r (%
)
100
80
60
40
20
02015 2016 2017 2018 2019
Vodafone AirtelTigo
75.09
86.60
56.81 58.81 57.39
Fixe
d D
ata
Sub
scrip
tion
(000
)100
80
60
40
20
02015 2016 2017 2018 2019
0.30
0.20
0.10
0
Pen
etra
tion
Rat
e (%
)
0.270.31
0.20 0.20
0.19

15 COMMUNICATIONS INDUSTRY REPORT 2019 - GHANA
CHAPTER 3
BROADBAND WIRELESS ACCESS (BWA)
16COMMUNICATIONS INDUSTRY REPORT 2019 - GHANA
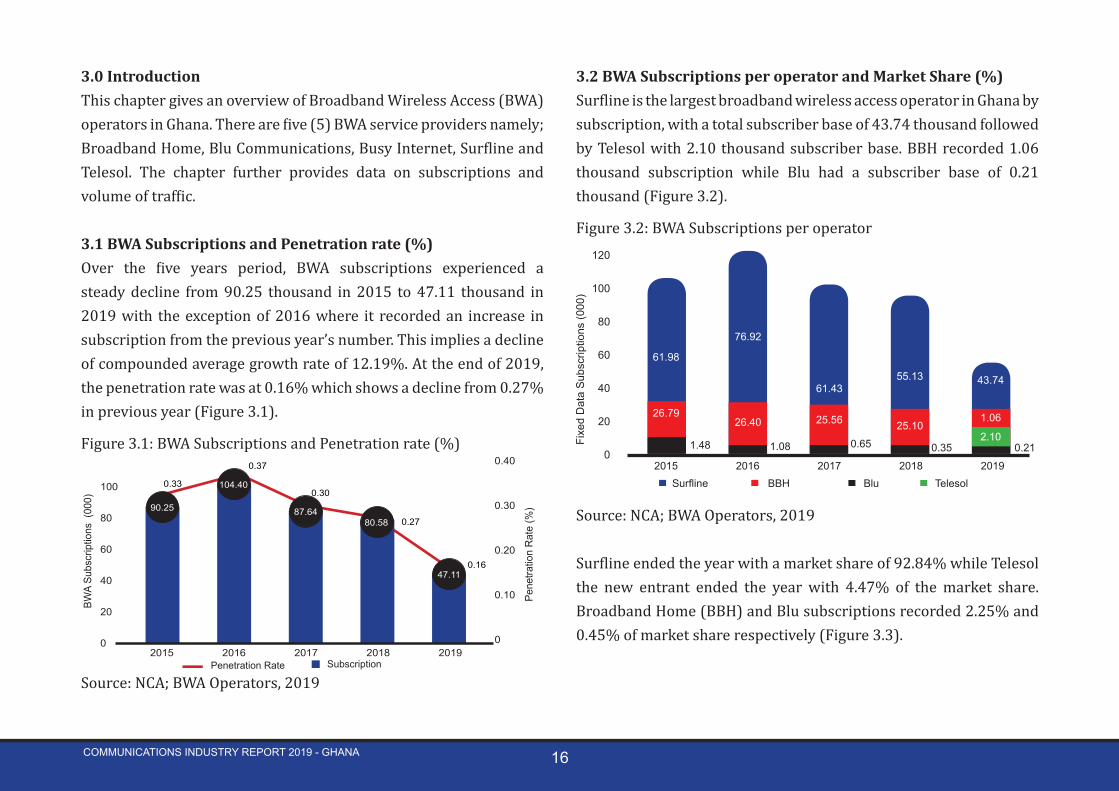
3.0 IntroductionThis chapter gives an overview of Broadband Wireless Access (BWA) operators in Ghana. There are five (5) BWA service providers namely; Broadband Home, Blu Communications, Busy Internet, Surfline and Telesol. The chapter further provides data on subscriptions and volume of traffic.
3.1 BWA Subscriptions and Penetration rate (%)Over the five years period, BWA subscriptions experienced a steady decline from 90.25 thousand in 2015 to 47.11 thousand in 2019 with the exception of 2016 where it recorded an increase in subscription from the previous year’s number. This implies a decline of compounded average growth rate of 12.19%. At the end of 2019, the penetration rate was at 0.16% which shows a decline from 0.27% in previous year (Figure 3.1).
Figure 3.1: BWA Subscriptions and Penetration rate (%)
Source: NCA; BWA Operators, 2019
3.2 BWA Subscriptions per operator and Market Share (%)Surfline is the largest broadband wireless access operator in Ghana by subscription, with a total subscriber base of 43.74 thousand followed by Telesol with 2.10 thousand subscriber base. BBH recorded 1.06 thousand subscription while Blu had a subscriber base of 0.21 thousand (Figure 3.2).
Figure 3.2: BWA Subscriptions per operator
Source: NCA; BWA Operators, 2019
Surfline ended the year with a market share of 92.84% while Telesol the new entrant ended the year with 4.47% of the market share. Broadband Home (BBH) and Blu subscriptions recorded 2.25% and 0.45% of market share respectively (Figure 3.3).
61.98
76.92
61.4355.13 43.74
0.210.350.651.081.48Fixe
d D
ata
Subs
crip
tions
(000
)
120
100
80
60
40
20
02015 2016 2017 2018 2019
Surfline BBH Blu Telesol
26.7926.40 25.56 25.10
1.06
2.10
90.25
104.40
87.6480.58
47.11
BWA
Subs
crip
tions
(00
0)
100
80
60
40
20
02015 2016 2017 2018 2019
0.40
0.30
0.20
0.10
0
Pene
tratio
n R
ate
(%)
0.33
0.37
0.30
0.27
0.16
Penetration Rate Subscription

17 BROADBAND WIRELESS ACCESS (BWA)
Figure 3.3: Share of subscriptions (%)
Source: NCA; Broadband Wireless Access, 2019
3.3 BWA Data Traffic in Gigabyte (GB)Total data traffic generated by the BWA’s at the end of 2019 was 15.34 billion megabytes from 15.42 billion megabytes in the previous year. Over the past five years, data generated by the BWA’s has risen from 5.34 billion megabytes in 2015 to 15.34 billion megabytes in 2019. However, within the five year period, it was at its peak in 2018 with 15.42 billion megabytes as illustrated in Figure 3.4.
Figure 3.4: BWA Traffic in Megabytes
Source: NCA; Broadband Wireless Access, 2019
68.68 73.68 70.0968.42
92.84
0.450.430.751.041.64Fixe
d D
ata
Subs
crip
tions
(000
)
120
100
80
60
40
20
02015 2016 2017 2018 2019
Surfline BBH Blu Telesol
29.68
25.29 29.1731.15
2.254.47
5.34
11.43
15.12 15.42 15.34
BWA
Dat
a Tr
affic
in M
egab
ytes
(000
,000
,000
) 16
14
12
10
8
6
4
2
02015 2016 2017 2018 2019

18COMMUNICATIONS INDUSTRY REPORT 2019 - GHANA

19 COMMUNICATIONS INDUSTRY REPORT 2019 - GHANA
CHAPTER 4
BROADCASTING

20COMMUNICATIONS INDUSTRY REPORT 2019 - GHANA
4.0 IntroductionThis Chapter reports on the Frequency Modulation (FM) and Television (TV) broadcasting in Ghana. It covers authorization, operational and non-operational stations in the broadcasting space.
4.1 Frequency Modulation (FM)4.1.1 Authorised FM Radio Stations in Ghana At the end of 2019, the total number of authorized FM stations in Ghana was 513 as compared to 487 in 2018. Most authorised FM Stations (381 out of 513) are Commercial FM Stations representing 74.27% of the total authorized FM Stations while the Public (foreign) FM Stations are the least with 5 stations representing 0.97% (Figure 4.1)
Figure 4.1: Distribution of Authorised FM Stations by categories in Ghana as at the end of 2019
Source: NCA, 2019
4.1.2 Regional Breakdown of FM Authorisation With the creation of six new regions, the Ashanti region (72) now has the highest number of authorized FM Stations with North East (6) having the least number of FM Stations in Ghana (Figure 4.2).
Figure 4.2: Regional Breakdown of Authorised FM Station
Source: NCA, 2019
4.1.3 Operational FM Stations There were 399 operational FM Stations in Ghana at the end of 2019, with 70.68% of them being Commercial Radio stations. Fifty-eight of them are Community Radio stations (14.54%), 7.77% are Public Radio Stations, Campus Radio stations make up 5.76% (23 Stations) of the operational FM stations and 1.25% (5 Stations) were Public (Foreign) Radio Stations (Figure 4.3).
20
35
59 57
9
3944
39
25
7
2328
6
43
7
72
FM R
adio
Sta
tions
by
Reg
ion
70
60
50
40
30
20
10
01 95 133 117 152 106 144 128 16
1. Ashanti 5. Bono 9. Bono East 13. Oti2. Western 6. Eastern 10. Upper West 14. Ahafo3. Greater Accra 7. Central 11. Upper East 15. Savanna4. Volta 8. Northern 12. Western North 16. North East

21 BROADCASTING SERVICES
Figure 4.3: Distribution of Types of Operational FM Stations in Ghana
Source: NCA, 2019
4.2 Television (TV) Broadcasting
4.2.1 Types of Operating and Non-Operating TV Stations At the end of 2019, a total of 141 television (TV) stations had been authorised to operate in the country. Out of the 141 authorised television stations, 97 were operational, and the remaining 44 stations were yet to commence operations. The authorised TV stations are grouped into fifteen (15) categories as presented in (Figure 4.4).1
7. Terrestrial television is a type of television broadcasting in which the television signal is transmitted by radio waves from the terrestrial (earth-based) transmitter of a television station to a receiver having an antenna.8. Satellite television is a type of television programming to viewers by relaying it from a communication satellite orbiting the Earth directly to the viewer’s location.9. Internet Protocol television (IPTV) is the delivery of television content over Internet Protocol (IP) networks and requires payment of subscription fees.10. Cable TV Broadcasting is the system of delivering television programming to consumers via radio frequency (RF) signals transmitted through coaxial cables, or in more recent systems, light pulses through fibre-optic cables and requires the payment of subscription fees.
Figure 4.4: Types of Operating and Non-Operating TV Stations
Source: NCA, 2019
4.2.2 Platforms for TV TransmissionTelevision Broadcasting is delivered through four (4) mediums in Ghana that is the Terrestrial , Satellite , Internet and Cable. Most authorized TV Stations are licensed to transmit via Satellite (57.45%) followed by Terrestrial (39.01%). Cable and Internet transmissions are 0.71% each. As at the end of 2019, two (2) TV Stations were using
Num
ber o
f TV
Stat
ion
Acco
rdin
g to
Cat
egor
y 70
60
50
40
30
20
10
01
5 5 4
34
6
2
95 133 117 152 106 144 128
1. Satellite Television Broadcasting (Free-To-Air Direct-To-Home Single Channel)2. Digital Terrestrial Free-To-Air Television Programme Channel (Nationwide Coverage)3. Satellite Television Broadcasting (Free-To-Air Direct-To-Home Bouquet)4. Digital Terrestrial Radio Service on TV Multiplex 5. Digital Terrestrial Free-To-Air Television Programme Channel (Regional Coverage)6. Digital Terrestrial Pay Television (Service and Frequency7. Satellite Television Broadcasting (Pay TV Direct-To-Home Bouquet)8. Analogue Terrestrial Television 9. Digital Terrestrial Pay Television (Service only)10. Digital Cable Television11. Television over Internet Protocol (Pay TV)12. Subscription Management Service for a Satellite Television Broadcasting (Pay TV Direct-To-Home Bouquet)13. Digital Terrestrial Television (Network only)14. Digital Terrestrial Mobile Television Service (Stand-alone Authorisation)15. Digital Terrestrial Television additional Services (eg. Teletext, etc)
1 1 1 11 1
6
332
36
On Air Not On Air
2
COMMERCIAL, 70.68%
PUBLIC, 7.77%
PUBLIC (FOREIGN),
1.25%
COMMUNITY, 14.54%
CAMPUS, 5.76%
COMMERCIAL PUBLIC PUBLIC (FOREIGN) COMMUNITY CAMPUS

22COMMUNICATIONS INDUSTRY REPORT 2019 - GHANA
only analogue technology to transmit (Figure 4.5). Thirty-five TV stations had migrated to the use of digital technology for broadcasting transmission, although 15 of these 35 stations simulcast (in analogue and digital).2
Figure 4.5: Number of authorized TV stations by mode of transmission
Source: NCA 2019
4.2.3 TV Stations in operationNinety-seven (97) out of the 141 TV Stations were operational as at the end of 2019. Forty-nine (50.52%) of the 97 operational TV Stations are broadcasting via the terrestrial mode whilst 47 of them broadcast via Satellite (48.45%). There was one (1) Cable Television operator but none for the internet mode of transmission (Figure 4.6).
11. Simulcast is a simultaneous transmission of the same programme in analogue and digital mode.
Figure 4.6: TV Stations in operation by mode of Transmission
Source: NCA 2019
4.2.4 Pay TV ServicesAs at the end of 2019, 290,746 subscribers were served with the pay TV services. Out of this number, 290,180 subscribers are residential subscribers and the remaining 566 are business subscribers. Multichoice Ghana Ltd has the highest number of subscriptions as compared to the other service providers.3
12. Television Broadcasting Service comprising of a bouquet of services provided over a satellite transponder and which requires television viewers to pay a subscription fee to watch the television service.

23 COMMUNICATIONS INDUSTRY REPORT 2019 - GHANA
CHAPTER 5
TOWER INFRASTRUCTURE

24COMMUNICATIONS INDUSTRY REPORT 2019 - GHANA
5.0 Introduction
This chapter provides an overview of the tower infrastructure companies in Ghana. Helios Tower Ghana Managed Services Limited (HTG) Eaton Tower Ghana Limited and, American Tower Company (ATC) were the three tower companies operating in Ghana as at the end of 2019. However, the report covers Helios Tower Ghana (HTG) and American Tower Company (ATC).
5.1 Total Number of Towers in Ghana
Total number of towers managed by the three tower companies in Ghana as at the end of 2019 was 4,774
Figure 5.1: Total Number of Towers in Ghana (2015 to 2019)
Source: NCA; Tower Companies, 2019. 1
13. The infrastructure tower companies are communications entities that have been given the authorisation by NCA to build, erect, construct or otherwise acquire and own communication towers that are open to sharing by licensed network providers.
5.2 Total number of towers per Tower Company
American Tower Company is the largest tower company managing a total of 2,381 towers whilst Eaton towers had 1,470 towers under its purview. Helios towers manages 923 towers.
Figure 5.2: Number of towers per TowerCo
Source: NCA; Tower Companies, 2019
4,1024,177
4,271
4,564
4,774
Tota
l Num
ber o
f Tow
ers
in G
hana
4800
4600
4400
4200
4000
3800
36002015 2016 2017 2018 2019
2015 2016 2017 2018 2019Num
ber o
f tow
ers
in G
hana
per
Tow
erC
o
2500
2000
1500
1000
500
0
2172 2224 2216 2303 2381
1180 11941277 1370 1470
750 759 778 891 923
American Tower Eaton Towers Helios Towers

25 TOWER INFRASTRUCTURE
5.3 Market Share of Tower Companies
American Towers accounts for 49.9% of towers in Ghana managed by the Tower companies. Eaton and Helios towers manage 28.8% and 19.3% of towers respectively in Ghana.
Figure 5.3 Market Share of Tower Companies
Source: NCA; Tower Companies, 2019
5.4 Greenfield and Rooftop Tower Distribution
Most of the towers in Ghana are Greenfield rather than Rooftop, and this is because of limited high rise buildings to accommodate these towers. As at the end of 2019, 91.85 percent of towers deployed were Greenfields (Figure 5.3).
Figure 5.3: Number of Greenfield and Rooftop Towers in Ghana
Source: NCA; Tower Companies, 2019
1
5.5 Tenancy Ratio on Towers in Ghana
Tenancy ratio refers to the number of tenants, or operators, who have put up their antennae and other active infrastructure on the towers. Tower sharing has a huge potential to boost tenancy ratio i.e. the total number of tenants or occupants of a tower. Prior to the entrance of tower companies, the situation was one tower occupied by one tenant, and several towers clustered in one area creating aesthetic mess. The tenancy ratio of the telecom tower has since decreased from 1.76 in 2014 to 1.62 in 2019 (Figure 5.4). 14. Greenfield towers are erected on the ground whereas rooftop are placed on high rise buildings. 15. An indoor DAS incorporates components that are meant only for indoor usage. These systems are designed to provide coverage to parts of a building that outdoor macro cells can’t reach.16. A cellular network is a network of handheld mobile phones (cell phones) in which each phone communicates with the telephone network by radio waves through a local antenna at a cellular base station (cell site).
52.9 53.251.9 50.5 49.9
Mar
ket S
hare
of T
ower
Cos
(%)
100
80
60
40
20
02015 2016 2017 2018 2019
28.6
18.2
29.9
18.2
30.0
19.5 19.3
28.8
American Tower Eaton Towers Helios Towers
28.8
18.3
2015 2016 2017 2018 2019
Num
ber o
f Gre
enfie
ld a
nd R
oofto
p To
wer
s in
Gha
na
4000
3000
2000
1000
0
3,739 3,799 3,8444,195 4,385
327 348 349 364 389
Greenfield Towers Rooftop Towers

26COMMUNICATIONS INDUSTRY REPORT 2019 - GHANA
Figure 5.4: Tenancy Ratio of Towers in Ghana
Source: NCA; Tower Companies, 2019
1.761.79
1.82
1.73
1.62
Tena
ncy
Rat
io o
f Tow
ers
in G
hana
1.85
1.80
1.75
1.70
1.65
1.60
1.552015 2016 2017 2018 2019

27 COMMUNICATIONS INDUSTRY REPORT 2019 - GHANA
CHAPTER 6
GLOBAL OVERVIEW OF THE COMMUNICATIONS INDUSTRY

28COMMUNICATIONS INDUSTRY REPORT 2019 - GHANA
6.0 Global Overview of the Communications IndustryThe telecommunications sector, all over the world has seen great transformation in recent times. The year 2019 was no exception as impressive figures of growth were recorded in almost all aspect of the industry, based on data available from the International Telecom-munications Union (ITU).
6.1 Mobile Voice Subscriptions Mobile cellular subscriptions globally recorded a growth rate of al-most 5%. Subscriptions increased to 8.30 billion at the end of the year from 7.91 billion in the previous year of 2018.
Figure 6.1: World Mobile voice subscriptions in millions
Source: ITU-D ICT Statistics
6.2 Mobile Broadband SubscriptionsActive Mobile broadband subscriptions globally has recorded rapid growth in recent times especially with the introduction of 4G or LTE technology. Subscriptions increased from 5.33 billion in 2018 to 6.38 billion in 2019 representing a year on year growth rate of almost 20%.
Figure 6.2: World Mobile broadband subscriptions in millions
Source: ITU-D ICT Statistics
6.3 Fixed Voice Subscriptions In 2019, the subscriptions figure stood at 931 million a decrease of
3778
40944351 4460 4768
Mar
ket S
hare
of T
ower
Cos
(%)
2015 2016 2017 2018 2019
111210991103 1114 1120
815814807 810 811
836780714 714 744
Asia & Pacific The Americas Europe Africa Arab States CIS
338334329 332 333
431421417 416 423
9000
8000
7000
6000
5000
4000
3000
2000
1000
0
15541927
2522
3003
3802
Mob
ile B
road
band
Sub
crip
tions
(000
,000
)
6000
5000
4000
3000
2000
1000
02015 2016 2017 2018 2019
1054950
771 844896
671623480 536 579
354312181 212 248
Asia & Pacific The Americas Europe Africa Arab States CIS
206187144 157 173288253
174 191 228

29 GLOBAL OVERVIEW
2% from the previous year’s figure of 950 million in 2018. Fixed telephone subscription has recorded a consistent decline globally since 2009 when it last recorded an increase in subscription from the previous years.
Figure 6.3: World Fixed Cellular Subscriptions in millions
Source: ITU-D ICT Statistics
6.4 Fixed Broadband SubscriptionsFixed broadband subscription is experiencing a steady increase year on year globally. Subscription has grown by an average growth of 7.01% over the past five years. In 2019 the subscriptions grew from 1.07 billion in 2018 to 1.14 billion in 2019 recording a growth rate of 6.54%.
Figure 6.4: World Fixed broadband subscriptions in millions
Source: ITU-D ICT Statistics
6.5 BroadcastingThe Traditional radio and TV broadcasting landscape is encountering stiff competition from digital content providers who are providing streaming services that people find more convenient and accessible than traditional broadcasting contents.In the United State for instance, Pay TV subscription and Penetration keep declining year on year. Pay TV penetration a decade ago stood at an all-time high of 87.8% which has since experienced steady decline to 65.3% at the end of year 2019.
439 411395
390378
Mar
ket S
hare
of T
ower
Cos
(%)
2015 2016 2017 2018 2019
249 245 239 233 227
250 246 241 235 231
50 49 48 47 47
Asia & Pacific The Americas Europe Africa Arab States CIS
10 11 9 9 930 31 33 35 38
1200
1000
800
600
400
200
0
611565
525459
404
Mar
ket S
hare
of T
ower
Cos
(%)
2015 2016 2017 2018 2019
222213199190182
220212204197190
4845433937
Asia & Pacific The Americas Europe Africa Arab States CIS
4 4 4 4 53528282219
1400
1200
1000
800
600
400
200
0

30COMMUNICATIONS INDUSTRY REPORT 2019 - GHANA
6.6 Tower InfrastructureIn the year 2019, both Vodafone PLC and Orange S.A. separately announced the establishment of dedicated tower companies separate from the bigger entities. During the latter part of the year, American Tower announced the acquisition of Eaton Towers which has over 5,500 sites in five African countries (Burkina Faso, Niger, Ghana, Uganda and Kenya). The deal, even though considered as huge, still keeps American Tower in second position when it comes to the African tower market with a little over 14,000 towers. IHS Towers leads the market in Africa with over 23,000 towers while Helios towers with a little over 6,500 towers complete the list of top three Tower companies in African.
6.7 Type ApprovalType Approval is a certificate granted to a product that meets minimum set of regulatory, technical standards and safety requirements applicable in a country. There are different procedures and variance of type approval regimes in different jurisdiction.Most European Union (EU) countries practice the “Self-Declaration” regime where manufacturers access the conformity of their products themselves. The classical type approval regime is the most widely used procedure in the world where manufacturers have to get their products tested in a certified laboratory before being issued with a certificate. Unregulated markets such as the North Korea, Turkmenistan and some Central African countries also have different set of rules in accepting such equipment into their markets.

A COMMUNICATIONS INDUSTRY REPORT (2019), GHANA
APPENDIX

32COMMUNICATIONS INDUSTRY REPORT 2019 - GHANA
APPENDIX
Table 1: Mobile Voice Subscriptions and Penetration Rate (%)
2015 2016 2017 2018 2019
Prepaid 34,797,888 37,918,623 36,275,284 40,391,558 40,216,604
Postpaid 210,499 386,455 440,477 543,317 640,473
Mobile Voice Subscriptions 35,008,387 38,305,078 36,715,761 40,934,875 40,857,077
Growth rate (%) 15.30 9.42 -4.15 11.49 -0.19
Net Additions4,647,616 3,296,691 -1,589,317 888,285 - 77,798
Population 27,429,232 28,094,823 28,776,565 29,474,851 30,190,081
Penetration rate (%) 127.60 136.30 127.60 138.88 135.33
Source: NCA; Mobile Network Operators, 2019

33 COMMUNICATIONS INDUSTRY REPORT 2019 - GHANA
Table 2: Mobile Voice Subscriptions per operator
Mobile Network Operator 2015 2016 2017 2018 2019
MTN
Subscriptions 16,254,984 19,296,157 17,832,546 20,092,798 22,555,848
Market Share (%) 46.43 50.37 48.57 49.08 55.21
Vodafone
Subscriptions 7,612,059 8,289,913 9,028,161 9,813,234 9,122,403
Market Share (%) 21.74 21.64 24.59 23.97 22.33
Tigo
Subscriptions 4,850,034 5,339,052 5,217,875 n/a n/a
Market Share (%) 13.85 13.94 14.21 n/a n/a
Airtel
Subscriptions 4,796,645 4,591,051 3,986,163 n/a n/a
Market Share (%) 13.70 11.99 10.86 n/a n/a
AirtelTigo
Subscriptions n/a n/a n/a 10,289,491 8,453,053
Market Share (%) n/a n/a n/a 25.14 20.69
Glo
Subscriptions 1,369,402 695,306 627,752 739,352 725,773
Market Share (%) 3.91 1.82 1.71 1.81 1.78
Expresso
Subscriptions 125,263 93,599 23,264 n/a n/a
Market Share (%) 0.36 0.24 0.06 n/a n/a
Industry Total35,008,387 38,305,078 36,715,761 40,934,875 40,857,077
Source: NCA; Mobile Network Operators, 2019

34COMMUNICATIONS INDUSTRY REPORT 2019 - GHANA
Table 3: Distribution of Off net and On net Traffic (Domestic)
2015 2016 2017 2018 2019
On-net
Traffic 33,296,762,169 40,034,168,879 51,054,275,008 62,689,764,854 73,774,794,534
Share (%) 76.51 79.14 83.44 87.86 90.78
Growth (%) 23.21 20.23 27.53 22.79 17.68
Off-net
Traffic 10,222,172,401 10,552,629,100 10,130,498,869 8,658,439,247 7,491,790,375
Share (%) 23.49 20.86 16.56 12.14 9.22
Growth (%) -1.08 3.23 -4 -14.53 -13.47
Total 43,518,934,570 50,586,797,979 61,184,773,877 71,348,204,101 81,266,584,909
Source: NCA; Mobile Network Operators, 2019

35 COMMUNICATIONS INDUSTRY REPORT 2019 - GHANA
Table 4: Distribution of Domestic Traffic per Operator
Mobile Operator 2015 2016 2017 2018 2019
MTNTraffic 23,634,976,840 31,184,751,056 43,842,841,382 58,625,073,109 70,521,752,504
Share (%) 54.31 61.65 71.66 78.89 86.78
VodafoneTraffic 11,829,125,976 11,679,786,800 11,236,871,661 9,268,358,493 6,682,666,929
Share (%) 27.18 23.09 18.37 12.47 8.22
TigoTraffic 4,558,278,719 4,245,289,115 3,483,638,837 n/a n/a
Share (%) 10.47 8.39 5.69 n/a n/a
AirtelTraffic 3,052,735,231 3,247,652,993 2,507,664,075 n/a n/a
Share (%) n/a n/a n/a n/a n/a
AirtelTigoTraffic n/a n/a n/a 1,518,674,252 3,953,752,066
Share (%) n/a n/a n/a 2.04 4.87
GloTraffic 425,471,141 224,026,298 113,183,248 605,635,378 108,413,410
Share (%) 0.98 0.44 0.18 0.81 0.13
ExpressoTraffic 18,346,665 5,291,716 574,674 n/a n/a
Share (%) 0.04 0.01 0.00 n/a n/a
Total Voice Traffic 43,518,934,571 50,586,797,979 61,184,773,877 74,311,343,259 81,102,214,055
Source: NCA; Mobile Network Operators, 2019

36COMMUNICATIONS INDUSTRY REPORT 2019 - GHANA
Table 5: Distribution of International Voice Traffic
2015 2016 2017 2018 2019
Inbound International Traffic 719,702,636 594,721,824 494,209,745 475,344,044 313,030,354
Share 45.88 45.85 46.00 45.42 37.50
Growth -38.70 -17.37 -16.90 -3.82 -34.15
Outbound InternationalTraffic 849,053,748 702,405,599 580,197,745 571,224,850 521,630,329
Share 54.12 54.15 54.00 54.58 62.50
Growth -40.69 -17.27 -17.40 -1.55 -8.68Total 1,568,756,383 1,297,127,423 1,074,407,490 1,046,568,894 834,660,682
Source: NCA; Mobile Network Operators, 2019
Table 6: Mobile Data Subscriptions and Penetration rate (%)
Subscriptions 2015 2016 2017 2018 2019
Prepaid 17,920,995 19,463,829 23,225,101 26,930,768 29,960,572
Postpaid 110,193 178,323 239,049 301,384 380,721
Mobile Data 18,031,188 19,642,152 23,464,150 27,232,152 30,341,293
Growth rate (%) 14.08 8.93 19.46 16.06 11.42
Net Additions 2,225,263 1,610,963 3,821,998 3,768,002 3,109,141
Population 27,429,232 28,094,823 28,776,565 29,474,851 30,190,081
Penetration rate (%) 65.74 69.91 81.54 92.39 100.50Source: NCA; Mobile Network Operators, 2019

37 COMMUNICATIONS INDUSTRY REPORT 2019 - GHANA
Table 7: Mobile Data Subscriptions per Operator
Mobile Network Operator 2015 2016 2017 2018 2019
MTN
Subscriptions 8,634,914 10,226,520 13,736,988 16,689,717 22,260,198
Market Share (%) 47.89 52.06 58.54 61.29 73.37
Vodafone
Subscriptions 3,316,343 3,474,090 4,097,805 4,213,054 3,700,970
Market Share (%) 18.39 17.69 17.46 15.47 12.20
Tigo
Subscriptions 2,732,863 2,725,489 2,848,021
Market Share (%) 15.16 13.88 12.14
Airtel
Subscriptions 2,879,431 2,902,009 2,532,873
Market Share (%) 15.97 14.77 10.79
AirtelTigo
Subscriptions 6,076,649 4,110,972
Market Share (%) 22.31 13.55
Glo
Subscriptions 419,459 277,372 238,312 252,732 269,153
Market Share (%) 2.33 1.41 1.02 0.93 0.89
Expresso
Subscriptions 48,178 36,672 10,151
Market Share (%) 0.27 0.19 0.04
Total 18,031,188 19,642,152 23,464,150 27,232,152 30,341,293Source: NCA; Mobile Network Operator
38COMMUNICATIONS INDUSTRY REPORT 2019 - GHANA
Table 8: Total Volume of internet data traffic in megabyte (MB) per operator
Mobile Network Operator 2015 2016 2017 2018 2019
MTNData Traffic (MB) 12,516,113,284 31,846,288,192 75,455,990,513 144,790,281,033 268,750,810,534
Market Share (%) 37.3 44.2 52.3 59.37 68.23
VodafoneData Traffic (MB) 10,095,526,716 17,791,093,515 31,619,137,935 59,588,642,450 70,938,659,586
Market Share (%) 30.1 24.7 21.9 24.44 18.01
TigoData Traffic (MB) 2,828,858,446 5,855,058,096 11,859,039,560 12,078,877,825
Market Share (%) 8.4 8.1 8.2 4.95
AirtelData Traffic (MB) 7,995,667,000 14,831,407,635 20,967,265,424 14,673,177,178
Market Share (%) 23.8 20.6 14.5 6.02
AirtelTigoData Traffic (MB) 8,221,194,104 46,857,385,803
Market Share (%) 3.90 11.90
GloData Traffic (MB) 82,975,022 1,659,745,592 4,500,688,049 4,513,372,375 7,370,002,242
Market Share (%) 0.2 2.3 3.1 2.2 1.87
ExpressoData Traffic (MB) 41,578,980 - - -
Market Share (%) 0.1 - - -
Total 33,560,719,448 71,983,593,031 144,402,121,481 243,865,544,965 393,916,858,165
Source: NCA; Mobile Network Operators, 2019

39 COMMUNICATIONS INDUSTRY REPORT 2019 - GHANA
Table 9: Distribution of Off-net and On-net SMS count
2015 2016 2017 2018 2019
ON-NET SMS
Traffic 1,220,459,806 1,198,236,550 1,322,354,207 2,049,813,306 2,367,716,985
Growth (%) 30.00 -1.82 10.36 55.01 15.51
OFF-NET SMS
Traffic 432,211,970 409,734,902 503,750,129 508,191,684 381,146,115
Growth (%) 0.23 -5.20 22.95 0.88 -25.00
Total 1,652,671,776 1,607,971,452 1,826,104,336 2,558,004,990 2,748,863,100 Source: NCA; Mobile Network Operator, 2019
Table 10: SMS Counts per Operator
Mobile Network Operator 2015 2016 2017 2018 2019
MTN 714,341,358 616,931,266 814,318,300 1,168,699,244 1,400,664,864
Vodafone 373,481,360 430,280,952 463,475,522 1,028,761,679 1,286,085,070
Tigo 403,649,719 417,188,292 468,091,327 309,040,192 n/a
Airtel 144,187,510 134,859,264 99,565,628 36,789,186 n/a
AirtelTigo n/a n/a n/a 7,084,605 58,597,086
Glo 16,674,261 8,703,617 7,653,559 7,630,084 3,516,080
Expresso 337,568 8,062 n/a n/a n/a
Total 1,652,671,776 1,607,971,453 1,853,104,336 2,558,004,990 2,748,863,100 Source: NCA; Mobile Network Operator, 2019

40COMMUNICATIONS INDUSTRY REPORT 2019 - GHANA
Table 11: Fixed Voice Subscriptions and Penetration Rate (%)
Subscriptions 2015 2016 2017 2018 2019
Fixed Voice 275,570 251,490 301,551 278,379 288,531
Growth Rate (%) 5.82 -8.74 19.90 -7.68 3.65
Net Additions 15,163 -24,080 50,061 -23,172 10,152
Country Population 27,429,232 28,094,823 28,776,565 29,474,851 30,190,081
Penetration Rate (%) 1.00 0.90 1.05 0.94 0.96
Source: NCA; Mobile Network Operator, 2019
Table 12: Fixed Voice Subscriptions per operator
Fixed Network Operators 2015 2016 2017 2018 2019
VodafoneSubscriptions 267,161 244,299 294,915 271,732 280,321
Share (%) 96.90 97.10 97.80 97.61 97.15
AirtelSubscriptions 8,409 7,191 6,636 6,647 8,210
Share (%) 3.10 2.90 2.20 2.39 2.85
Total Industry Subscriptions 275,570 251,490 301,551 278,379 288,531
Source: NCA; Mobile Network Operators, 2019

41 COMMUNICATIONS INDUSTRY REPORT 2019 - GHANA
Table 13 : Fixed Voice Traffic in minutes
Mobile Network Operator 2015 2016 2017 2018 2019
VodafoneTraffic 100,840,926 69,400,892 50,020,696 45,226,383 49,042,238
Shares (%) 93.40 87.10 87.50 91.80 100.00
AirtelTraffic 7,072,077 10,297,471 7,172,581 4,052,821 27
Shares (%) 6.60 12.90 12.50 8.20 0.00
Total Traffic (Minutes) 107,913,003 79,698,363 57,193,277 49,279,204 49,042,265
Source: NCA; Fixed Network Operators, 2019
Table 14: Fixed Data Subscriptions and Penetration Rate (%)
Subscriptions 2015 2016 2017 2018 2019
Fixed Data 75,092 86,596 56,810 58,808 57,393
Growth Rate (%) 0.21 0.15 -0.34 0.04 -0.02
Net Additions 13,230 11,504 -29,786 1,998 -1,415
Country Population 27,429,232 28,094,823 28,776,565 29,474,851 30,190,081
Penetration Rate (%) 0.27 0.31 0.20 0.20 0.19
Source: NCA; Fixed Network Operator, 2019

42COMMUNICATIONS INDUSTRY REPORT 2019 - GHANA
Table 15: Fixed Data Subscriptions per operator
Mobile Network Operator 2015 2016 2017 2018 2019
VodafoneSubscriptions 73,464 85,190 55,627 57,216 56,677
Shares (%) 97.83 98.38 97.92 97.29 98.75
AirtelSubscriptions 1,628 1,406 1,183 1,592 716
Shares (%) 2.17 1.62 2.08 2.71 1.25
Total Industry Subscriptions 75,092 86,596 56,810 58,808 57,393
Source: NCA; Fixed Network Operator, 2019
Table 16: BWA Subscriptions and Penetration rate (%)
Subscriptions 2015 2016 2017 2018 2019
BWA 90,246 104,402 87,639 80,581 47,108
Growth rate (%) - 15.69 -16.06 -8.05 -41.54
Net Additions - 14,156 -16,763 -7,058 -33,473
Population 27,429,232 28,094,823 28,776,565 29,474,851 30,190,081
Penetration rate (%) 0.33 0.37 0.30 0.27 0.16
Source: NCA; BWA Network Operator, 2019

43 COMMUNICATIONS INDUSTRY REPORT 2019 - GHANA
Table 17: BWA Subscriptions per operator
Broadband Wireless Access Operator 2015 2016 2017 2018 2019
Surfline
Subscriptions 61,980 76,919 61,426 55,134 43,735
Growth rate (%) n/a 24.10 -20.14 -10.24 -20.68
Market Share (%) 68.68 73.68 70.09 68.42 92.84
BBH
Subscriptions 26,786 26,402 25,560 25,100 1,058
Growth rate (%) n/a -1.43 -3.19 -1.80 -95.78
Market Share (%) 29.68 25.29 29.17 31.15 2.25
Blu
Subscriptions 1,480
n/a
1.64
1,081 653 347 211
Growth rate (%) -26.96 -39.59 -46.86 -39.19
Market Share (%) 1.04 0.75 0.43 0.45
Telesol
Subscriptions n/a
n/a
n/a
n/a
n/a
n/a
n/a n/a 2,104
Growth rate (%) n/a n/a n/a
Market Share (%) n/a n/a 4.47
Total 90,246 104,402 87,639 80,581 47,108Source: NCA; BWA Network Operators
Table 18: BWA Data Traffic in Megabytes2015 2016 2017 2018 2019
Surfline 4,553,985,700 9,801,704,172 13,579,324,195 14,228,311,888 13,468,971,378BBH 469,406,448 1,179,106,855 1,151,104,960 925,082,737 1,059,547,144Blu 314,182,333 453,000,187 391,082,907 271,321,838 353,730,049Telesol n/a n/a n/a n/a 455,870,770Total 5,337,574,482 11,433,811,214 15,121,512,062 15,424,716,464 15,338,119,341
Source: NCA; BWA Network Operators

44COMMUNICATIONS INDUSTRY REPORT 2019 - GHANA
Table 19: Regional Distribution of Authorised FM Radio Stations in Ghana as at the end of 2019
NO. NAME OF RE-GIONS
TOTAL NO. AUTHO-RISED
PUBLIC PUBLIC (FOREIGN) COMMUNITY CAMPUS COMMERCIAL
TOTAL NO. IN OPERA-
TION
TOTAL NO. NOT IN OP-
ERATION
1 ASHANTI 72 2 1 8 3 58 57 15
2 BONO 43 1 - 3 2 37 34 9
3 BONO EAST 28 2 - 3 - 23 25 3
4 AHAFO 7 - - 1 - 6 6 1
5 CENTRAL 39 2 - 9 3 25 32 7
6 EASTERN 39 2 - 7 1 29 32 7
7 GREATER ACCRA 57 2 3 3 4 45 51 6
8 NORTHERN 35 3 - 8 2 22 23 12
9 SAVANNAH 7 3 - 3 - 1 7 0
10 NORTH EAST 6 1 - 4 - 1 2 4
11 UPPER EAST 23 2 - 8 1 12 18 5
12 UPPER WEST 25 2 - 7 2 14 18 7
13 VOLTA 44 3 - 5 1 35 28 16
14 OTI 9 1 - 2 - 6 7 2
15 WESTERN 59 2 1 4 2 50 42 17
16 WESTERN NORTH 20 3 - - - 17 17 3
TOTAL 513 31 5 75 21 381 399 144
Source: NCA; (2019)

45 COMMUNICATIONS INDUSTRY REPORT 2019 - GHANA
Table 20: Regional Distribution of Operational FM Radio Stations in Ghana as at the end of 2019
NAME OF REGIONS PUBLIC PUBLIC (FOREIGN) COMMUNITY CAMPUS COMMERCIAL TOTAL IN
OPERATIONASHANTI 2 1 5 3 46 57
BONO 1 0 2 2 29 34
BONO EAST 2 0 3 0 20 25
AHAFO 0 0 1 0 5 6
CENTRAL 2 0 9 3 18 32
EASTERN 2 0 4 1 25 32
GREATER ACCRA 2 3 3 4 39 51
NORTHERN 3 0 7 1 12 23
SAVANNAH 3 0 0 3 1 7
NORTH EAST 1 0 0 0 1 2
UPPER EAST 2 0 8 1 7 18
UPPER WEST 2 0 7 2 7 18
VOLTA 3 0 4 1 20 28
OTI 1 0 2 0 4 7
WESTERN 2 1 3 2 34 42
WESTERN NORTH 3 0 0 0 14 17
TOTAL 31 5 58 23 282 399Source: NCA; (2019)

46COMMUNICATIONS INDUSTRY REPORT 2019 - GHANA
Table 21: Types of Operating and Non-Operating TV Stations as at the end of 2019
NO. TYPE OF TELEVISION SERVICETOTAL NO. OF AUTHORISED
STATIONS
TOTAL NO. OF STATIONS ON
AIR
TOTAL NO. OF STATIONS NOT ON AIR
1. Analogue Terrestrial Television 2 2 0
2. Digital Terrestrial Free-To-Air Television Programme Channel (Nationwide Coverage) 35 34 1
3. Digital Terrestrial Free-To-Air Television Programme Channel (Regional Coverage) 6 5 1
4. Digital Terrestrial Pay Television (Service only) 1 1 0
5. Digital Terrestrial Pay Television (Service and Frequency) 5 5 0
6. Digital Terrestrial Television (Network only) 0 0 0
7. Digital Terrestrial Radio Service on TV Multiplex 9 2 6
8. Satellite Television Broadcasting (Pay TV Direct-To-Home Bouquet) 4 4 0
9. Satellite Television Broadcasting (Free-To-Air Direct-To-Home Bouquet) 8 6 2
10. Satellite Television Broadcasting (Free-To-Air Direct-To-Home Single Channel) 68 36 32
11. Digital Terrestrial Television additional Services (eg. Teletext, etc) 0 0 0
12. Digital Terrestrial Mobile Television Service (Stand-alone Authorisation) 0 0 0

47 COMMUNICATIONS INDUSTRY REPORT 2019 - GHANA
13. Digital Cable Television 1 1 0
14. Television over Internet Protocol (Pay TV) 1 0 1
15. Subscription Management Service for a Satellite Television Broadcasting (Pay TV Direct-To-Home Bouquet) 1 1 0
TOTAL 141 97 44
Source: NCA; (2019)
Table 22: PayTV Subscriptions for 2019
COMPANY Residential Business
1 Crystal Premium Television Ltd. 180 -
2 Mobile Zone Ltd. 22,185 16
3 GOTV Ghana Ltd. 99,444 -
4 Multichoice Ghana Ltd. 168,200 550
5 Crystal Radiovision Network Ltd. 171 -
Total 290,180 566
Source: NCA; (2019)

48COMMUNICATIONS INDUSTRY REPORT 2019 - GHANA
Table 23: Number of Towers and Market Distribution per TowerCo
Tower Company 2015 2016 2017 2018 2019
Eaton TowersNumber of Towers 1,180 1,194 1,277 1,370 1,470
Market Share (%) 28.8 28.6 29.9 30 30.79
AmericanTowers
Number of Towers 2,172 2,224 2,216 2,303 2,381
Market Share (%) 52.9 53.2 51.9 50.5 49.9
Helios TowersNumber of Towers 750 759 778 891 923
Market Share (%) 18.3 18.2 18.2 19.5 19.3
Industry Total 4,102 4,177 4,271 4,564 4,774
Source: NCA; Tower companies (2019)
Table 24: Types of Towers
TOWER 2015 2016 2017 2018 2019
Greenfield 3,775 3,799 3,844 4,195 4,385
Rooftop 327 348 349 364 389
Total Number of Towers 4,102 4,147 4,193 4,559 4,774
Source: NCA; Tower companies (2019)

49 COMMUNICATIONS INDUSTRY REPORT 2019 - GHANA
Table 25: Tenancy ratio (2015 – 2019)
2015 2016 2017 2018 2019
Total Number of Towers 4,102 4,177 4,271 4,564 4,774
Total Number of Tenants 7,212 7,467 7,765 7,837 7,753
Tenancy Ratio 1.76 1.79 1.82 1.72 1.62
Source: ITU-D ICT Statistics

50COMMUNICATIONS INDUSTRY REPORT 2019 - GHANA
Table 26: Mobile Cellular Subscription in millions
2015 2016 2017 2018 2019
Africa 714 714 744 780 836
Arab States 417 416 423 421 431
Asia & Pacific 3,778 4,094 4,351 4,460 4,768
CIS 329 332 333 334 338
Europe 807 810 811 814 815
The Americas 1,103 1,114 1,120 1,099 1,112
World 7,181 7,511 7,814 7,911 8,304
Source: ITU-D ICT Statistics
Table 27: Fixed Telephone Subscription in millions
2015 2016 2017 2018 2019
Africa 10 11 9 9 9
Arab States 30 31 33 35 38
Asia & Pacific 439 411 395 390 378
CIS 52 49 48 47 47
Europe 250 246 241 235 231
The Americas 249 245 239 233 227
World 1,046 1,007 979 950 931
Source: ITU-D ICT Statistics

51 COMMUNICATIONS INDUSTRY REPORT 2019 - GHANA
Table 28: Active Mobile Broadband Subscription in millions
2015 2016 2017 2018 2019
Africa 181 212 248 312 354
Arab States 174 191 228 253 288
Asia & Pacific 1,554 1,927 2,522 3,003 3,802
CIS 144 157 173 187 206
Europe 480 536 579 623 671
The Americas 771 844 896 950 1,054
World 3,324 3,890 4,672 5,331 6,380
Source: ITU-D ICT Statistics
Table 29: Fixed Broadband Subscription in millions
2015 2016 2017 2018 2019
Africa 4 4 4 4 5
Arab States 19 22 28 31 35
Asia & Pacific 404 459 525 565 614
CIS 37 39 43 45 48
Europe 190 197 204 212 220
The Americas 182 190 199 213 222
World 839 916 1,005 1,070 1,145
Source: ITU-D ICT Statistics